Article

Short-Term Forecasting of Ozone Concentration in Metropolitan Lima Using Hybrid Combinations of Time Series Models

by
Natalí Carbo-Bustinza
1,*,
Hasnain Iftikhar
2,3,
Marisol Belmonte
4,5,
Rita Jaqueline Cabello-Torres
6,
Alex Rubén Huamán De La Cruz
7 and
Javier Linkolk López-Gonzales
8,9,*
1
Doctorado Interdisciplinario en Ciencias Ambientales, Universidad de Playa Ancha, Valparaíso 2340000, Chile
2
Department of Mathematics, City University of Science and Information Technology Peshawar, Peshawar 25000, Pakistan
3
Department of Statistics, Quaid-i-Azam University, Islamabad 45320, Pakistan
4
Laboratorio de Biotecnología, Medio Ambiente e Ingeniería (LABMAI), Facultad de Ingeniería, Universidad de Playa Ancha, Avda. Leopoldo Carvallo 270, Valparaíso 2340000, Chile
5
HUB-Ambiental, Universidad de Playa Ancha, Avda. Leopoldo Carvallo 270, Valparaíso 2340000, Chile
6
Escuela de Ingeniería Ambiental, Universidad César Vallejo, Lima 15314, Peru
7
E.P. de Ingenieria Ambiental, Universidad Nacional Intercultural de la Selva Central Juan Santos Atahualpa, La Merced 15106, Peru
8
Vicerrectorado de Investigación, Universidad Privada Norbert Wiener, Lima 15046, Peru
9
Escuela de Posgrado, Universidad Peruana Unión, Lima 15468, Peru
*
Authors to whom correspondence should be addressed.
Appl. Sci. 2023, 13(18), 10514; https://doi.org/10.3390/app131810514
Submission received: 8 August 2023 / Revised: 12 September 2023 / Accepted: 12 September 2023 / Published: 21 September 2023
(This article belongs to the Special Issue Air Quality Prediction Based on Machine Learning Algorithms II)

Abstract

:
In the modern era, air pollution is one of the most harmful environmental issues on the local, regional, and global stages. Its negative impacts go far beyond ecosystems and the economy, harming human health and environmental sustainability. Given these facts, efficient and accurate modeling and forecasting for the concentration of ozone are vital. Thus, this study explores an in-depth analysis of forecasting the concentration of ozone by comparing many hybrid combinations of time series models. To this end, in the first phase, the hourly ozone time series is decomposed into three new sub-series, including the long-term trend, the seasonal trend, and the stochastic series, by applying the seasonal trend decomposition method. In the second phase, we forecast every sub-series with three popular time series models and all their combinations In the final phase, the results of each sub-series forecast are combined to achieve the results of the final forecast. The proposed hybrid time series forecasting models were applied to four Metropolitan Lima monitoring stations—ATE, Campo de Marte, San Borja, and Santa Anita—for the years 2017, 2018, and 2019 in the winter season. Thus, the combinations of the considered time series models generated 27 combinations for each sampling station. They demonstrated significant forecasts of the sample based on highly accurate and efficient descriptive, statistical, and graphic analysis tests, as a lower mean error occurred in the optimized forecast models compared to baseline models. The most effective hybrid models for the ATE, Campo de Marte, San Borja, and Santa Anita stations were identified based on their superior out-of-sample forecast results, as measured by RMSE (4.611, 3.637, 1.495, and 1.969), RMSPE (4.464, 11.846, 1.864, and 15.924), MAE (1.711, 2.356, 1.078, and 1.462), and MAPE (14.862, 20.441, 7.668, and 76.261) errors. These models significantly outperformed other models due to their lower error values. In addition, the best models are statistically significant (p < 0.05) and superior to the rest of the combination models. Furthermore, the final proposed models show significant performance with the least mean error, which is comparatively better than the considered baseline models. Finally, the authors also recommend using the proposed hybrid time series combination forecasting models to predict ozone concentrations in other districts of Lima and other parts of Peru.

1. Introduction

The stratosphere is the atmospheric layer characterized by the significant presence of ozone (O 3 ), which benefits all kinds of life on the planet due to the filtering process of solar ultraviolet radiation that occurs in the environment. Its presence in the biosphere is harmful to the health of all living beings and the environment because ozone is not only a greenhouse gas but also a powerful oxidant that contributes to global warming [1]. In addition, the impact caused by this atmospheric pollutant on crop production is known [2].
Recently, the atmospheric levels of ozone in the air have increased, affecting more and more people, especially in the cardiovascular system, causing inflammation, oxidative stress, and imbalances that have been related to mortality and morbidity [3]. It is important to develop stricter controls on O 3 precursors to mitigate the increased risks of ozone pollution episodes [4]. Tropospheric ozone monitoring represents a practical tool to analyze spatiotemporal trends in the behavior of this polluting agent in the air [5]. Thus, accurately forecasting ozone concentration is crucial to safeguarding vulnerable individuals, such as children, the elderly, and outdoor workers, from air pollution during hazardous periods of the day. Ground-level ozone concentrations are of significant concern due to their toxic agents, which can adversely affect the respiratory systems of people who inhale high ozone concentrations for extended periods. These adverse health effects can lead to decreased lung function, chest pain while breathing, coughing, throat infections, congestion, and worsening symptoms of asthma.
Time series record the observations made in a particular place and are associated with the evolution over time of a particular variable; observed behavior cannot be replicated with repeated experiments, and observations are often time-dependent. This information has allowed the development of traditional deterministic modeling and statistical models. Although chemical transport models have generally been applied to differentiate emission sources and meteorological variables to explain short- or long-term ozone fluctuations, temporal analysis can show spatial and seasonal changes in the distribution of ozone concentrations [6]. At the same time, statistical models are generated by relational analysis between factors influencing pollutants, producing powerful statistical prediction equations [7]. However, when you want to study the behavior in the spatiotemporal distribution of a pollutant, the problem lies in the variability of pollutant concentrations, which are strongly influenced by the fluctuations of the emitting sources and the meteorological state—hourly, daily, seasonal, and annual. Thus, the impact exerted by trends in the behavior of air pollutants may be beneficial to optimize the performance of modeling [7].
Currently, statistical modeling is evolving, including the management of time series that deserves to be compared with traditional models, mainly multiple linear regression. However, it is still necessary to continue exploring new studies to improve the prediction of reliable models, the reduction of noise through filters, and the organization of the numerical information of contaminants [7]. Decomposition is a methodology applied to analyze time series air pollutant data; the decomposition in ensemble empirical mode is counted to process these non-stationary and nonlinear signals and allows one to gradually separate the different fluctuation components [8]. Generally, the numerical data of the ozone time series have various types of patterns, so it is essential to break the database into several components or sub-classes in such a way that each one is a unique pattern of the data. Furthermore, the time series for an air pollutant is considered to be additive and may comprise elements over time [6]. Interrupted time series designs are a powerful tool for comparing the variation of levels and the trend of results [9].
According to Din [6], the ozone concentration at time t is given by the sum of each component (from decomposition). One component is given by the “trend” of time in the time series and is relevant to the persistent decrease or increase in ozone concentration driven via emission sources or meteorological variables. For its part, the second component, “seasonality”, describes the fluctuations of the periodic seasons (decomposed), and the third, fixed by a short-term component, shows the “rest” of the random data once the first two components have been separated. In addition, other combined decomposition methods or structures have been proposed in series and time convolution and long-term short-memory bidirectional networks [10]. Other models use a non-parametric Theil–Sen estimator as a robust Kendall [11] line-fit method or locally estimated scatterplot models for smoothing to filter the data obtained and subsequently decompose the time series models into trend, seasonal, and residual components of data and then recombine them appropriately [12]. After the decomposition of the time series into components or sub-series, the data can be used in standardized time series modeling as linear, nonlinear autoregressive, or autoregressive moving averages. Linear models such as autoregressive are difficult to handle with nonlinear and time-varying data [13]. However, the application of combined auto-correlation function (ACF) and partial autocorrelation function (PACF) graphs overcomes the limitations of simple techniques by showing the correlation between the time series and the lags after excluding the contributions from previous lags [14]. Iftikhar et al. [15,16] applied a nonlinear autoregressive model relating a past value and smoothed functions of the original values of the time series. An autoregressive moving average was also applied to take into account the errors that make up the model, as well as linear models of combination for all lag observations and the lag error term. On the other hand, machine learning models have also been used to forecast ozone levels.For instance, the researchers in [17] proposed a deep learning model for the prediction of ozone levels in Aarhus using a grid search technique and implemented it as an accuracy tool for forecasting ozone levels in smart cities. The ozone concentration in India is predicted [18] using eight machine learning models, including XGboost, random forest, k-nearest neighbor, support vector regression, decision tree, Adaboost, linear regression, and bidirectional long-short-term memory, which achieved the predictive capabilities with a R 2 of 0.75 in winter. The researchers further divided the predicted capabilities in terms of season, and the winter season was found to be more predictable with 97.3%, post-monsoon 92.8%, monsoon 90.3%, and summer 88.9%. The authors in [19,20,21] applied time series, hybrid decomposition, machine learning, and deep learning models for forecasting ozone concentration in Tehran, Iran, in 11 municipal districts of Nanjing, China, and 8 out of 35 stations in Turkey.
Peru is a country located in South America in the Southeast Pacific Region, and its capital, Lima, is no stranger to ozone air pollution. Lima has become a megacity with more than 10 million inhabitants and severe air pollution problems. Romero et al. [22] evaluated the impact of meteorological variables on the ozone concentration and other pollutants present in the air through linear correlations made for data obtained between 2015 and 2018 at eight sampling stations in metropolitan Lima and reported that this pollutant increased with solar irradiation around 10:00 and 16:00 h, especially in spring, possibly caused by the interaction of primary NOx and hydrocarbon emissions from vehicle engines. Carbo-Bustinza et al. [23] instead studied the behavior of ozone in winter using machine learning algorithms in four stations in the city of Lima and found the highest critical levels (165.80 µ g / m 3 ) in the Ate district (ATE). However, we observed, in general, a drop in values in the cold season (O 3 < 100 µ g / m 3 ), similar to another study [24]. At the same time, there is a need to comprehensively analyze the time series of the most polluted districts to optimize the prediction of ozone concentration. In this context, this research aims to propose an improved tool to forecast tropospheric ozone concentration using hybrid combinations of time series models in four districts of the megacity of Metropolitan Lima in a very precise way, through an innovative methodology based on the decomposition of a time series of data and the combination of traditional methods to achieve efficient predictions. The following are the contributions of this research:
  • We improve the efficiency and accuracy of one-hour-ahead ozone concentration forecasting using a proposed hybrid combination of time series models based on the seasonal trend decomposition technique and various standard time series models.
  • We apply the seasonal trend decomposition method of the ozone concentration database in four districts—ATE, Campo de Marte (CDM), San Borja (SB), and Santa Anita (STA)—with severe episodes of ozone contamination between 2017 and 2019.
  • We evaluate the performance of the proposed hybrid combination of time series models, by determining five different accuracy mean errors: two relative mean errors, two absolute mean errors, and one correlation measure, such as root mean square error, root mean square percentage error, mean absolute error, and mean absolute percentage error; a statistical test, the Diebold–Mariano test; and a visual evaluation.
  • In this study, the results of the final best combination model are compared with the best model proposed in the literature as well as the considered baseline models and the comparative results are recorded. Based on these results, the proposed final best combination model from this work is highly accurate and efficient compared to the best models reported in the literature.
  • We present a methodological proposal applicable to the environmental management system in order to mitigate ozone pollution aimed at the stakeholders of the national air quality program.
  • Finally, the current work uses only the four district datasets in Lima, Peru. This can be extended to other districts of Lima, other regions of Peru, and even the world level to evaluate the performance of the proposed hybrid time series modeling and forecasting technique.
This article describes the proposed hybrid time series forecasting methodology and explains its construction step by step in Section 2. The results of the case study for each district studied are in Section 3. Discussion about the best combination model of this study versus the standard time series models is detailed in Section 4, and the conclusions, along with limitations and future challenges, are presented in Section 5.

2. The Proposed Hybrid Time Series Forecasting Methodology

Before starting the modeling, it often makes sense to prepare the data. The goal of preprocessing is usually to simplify the modeling of the data. To do this, the database is sorted, classified, and analyzed for each monitoring station, taking into account the winter period of the city, which runs from 21 June to 22 September, for ozone. From 2017 to 2019, four monitoring stations located at strategic points in the capital of Lima were considered. It should be noted that the number of monitoring stations in the capital of Lima is ten; however, four were selected due to a lack of data in the registry. The hourly ozone concentrations were measured with a Teledyne analyzer (an instrument with about 15 sensing technologies used in the monitoring and manufacturing of gas, liquid analysis, and medical fields). Analyzer operations include zero and span testing, calibration, and leak detection. Data are transmitted by telemetry to SENAMHI (National Meteorology and Hydrology Service of Peru) for validation after correcting zeros, duplicates, and/or anomalies. Similarly, SENAMHI has a systematic network of stations that normally and automatically monitor and report the variables studied to a processing center. These stations use high-quality instruments and sensors to measure temperature, relative humidity, wind speed, and direction on an hourly scale. In addition, an inductive algorithm called Multiple Imputation by Chained Equations was applied. This algorithm is based on a fully conditional specification, where each incomplete variable is specified by a separate model [25]. This performs multiple assignments to replace missing values in a dataset, in this case, for hourly rate records details (see Table 1).
After obtaining the imputed ozone time series (free from missing values), we then proceed with the imputed ozone series and achieve a one-hour-ahead ozone concentration using the proposed hybrid combination of time series models. As explained previously, the hourly time series of ozone contains specific properties, such as a nonlinear long-run trend, an hourly cycle, and a different mean and variance. Considering these particular features in the model improves forecast accuracy significantly. To get these results, the ozone concentration in time series ( C n ) is divided into three new sub-series: the first is a long-run trend ( l n ) , the second is a seasonal series ( h n ) , and the third is a residual ( r n ) series. The mathematical description of the decomposed subsequence is given by
C n = l n + h n + r n
however, these sub-series are obtained using the seasonal trend decomposition method described in the following subsection.

2.1. Seasonal Trend Decomposition Method

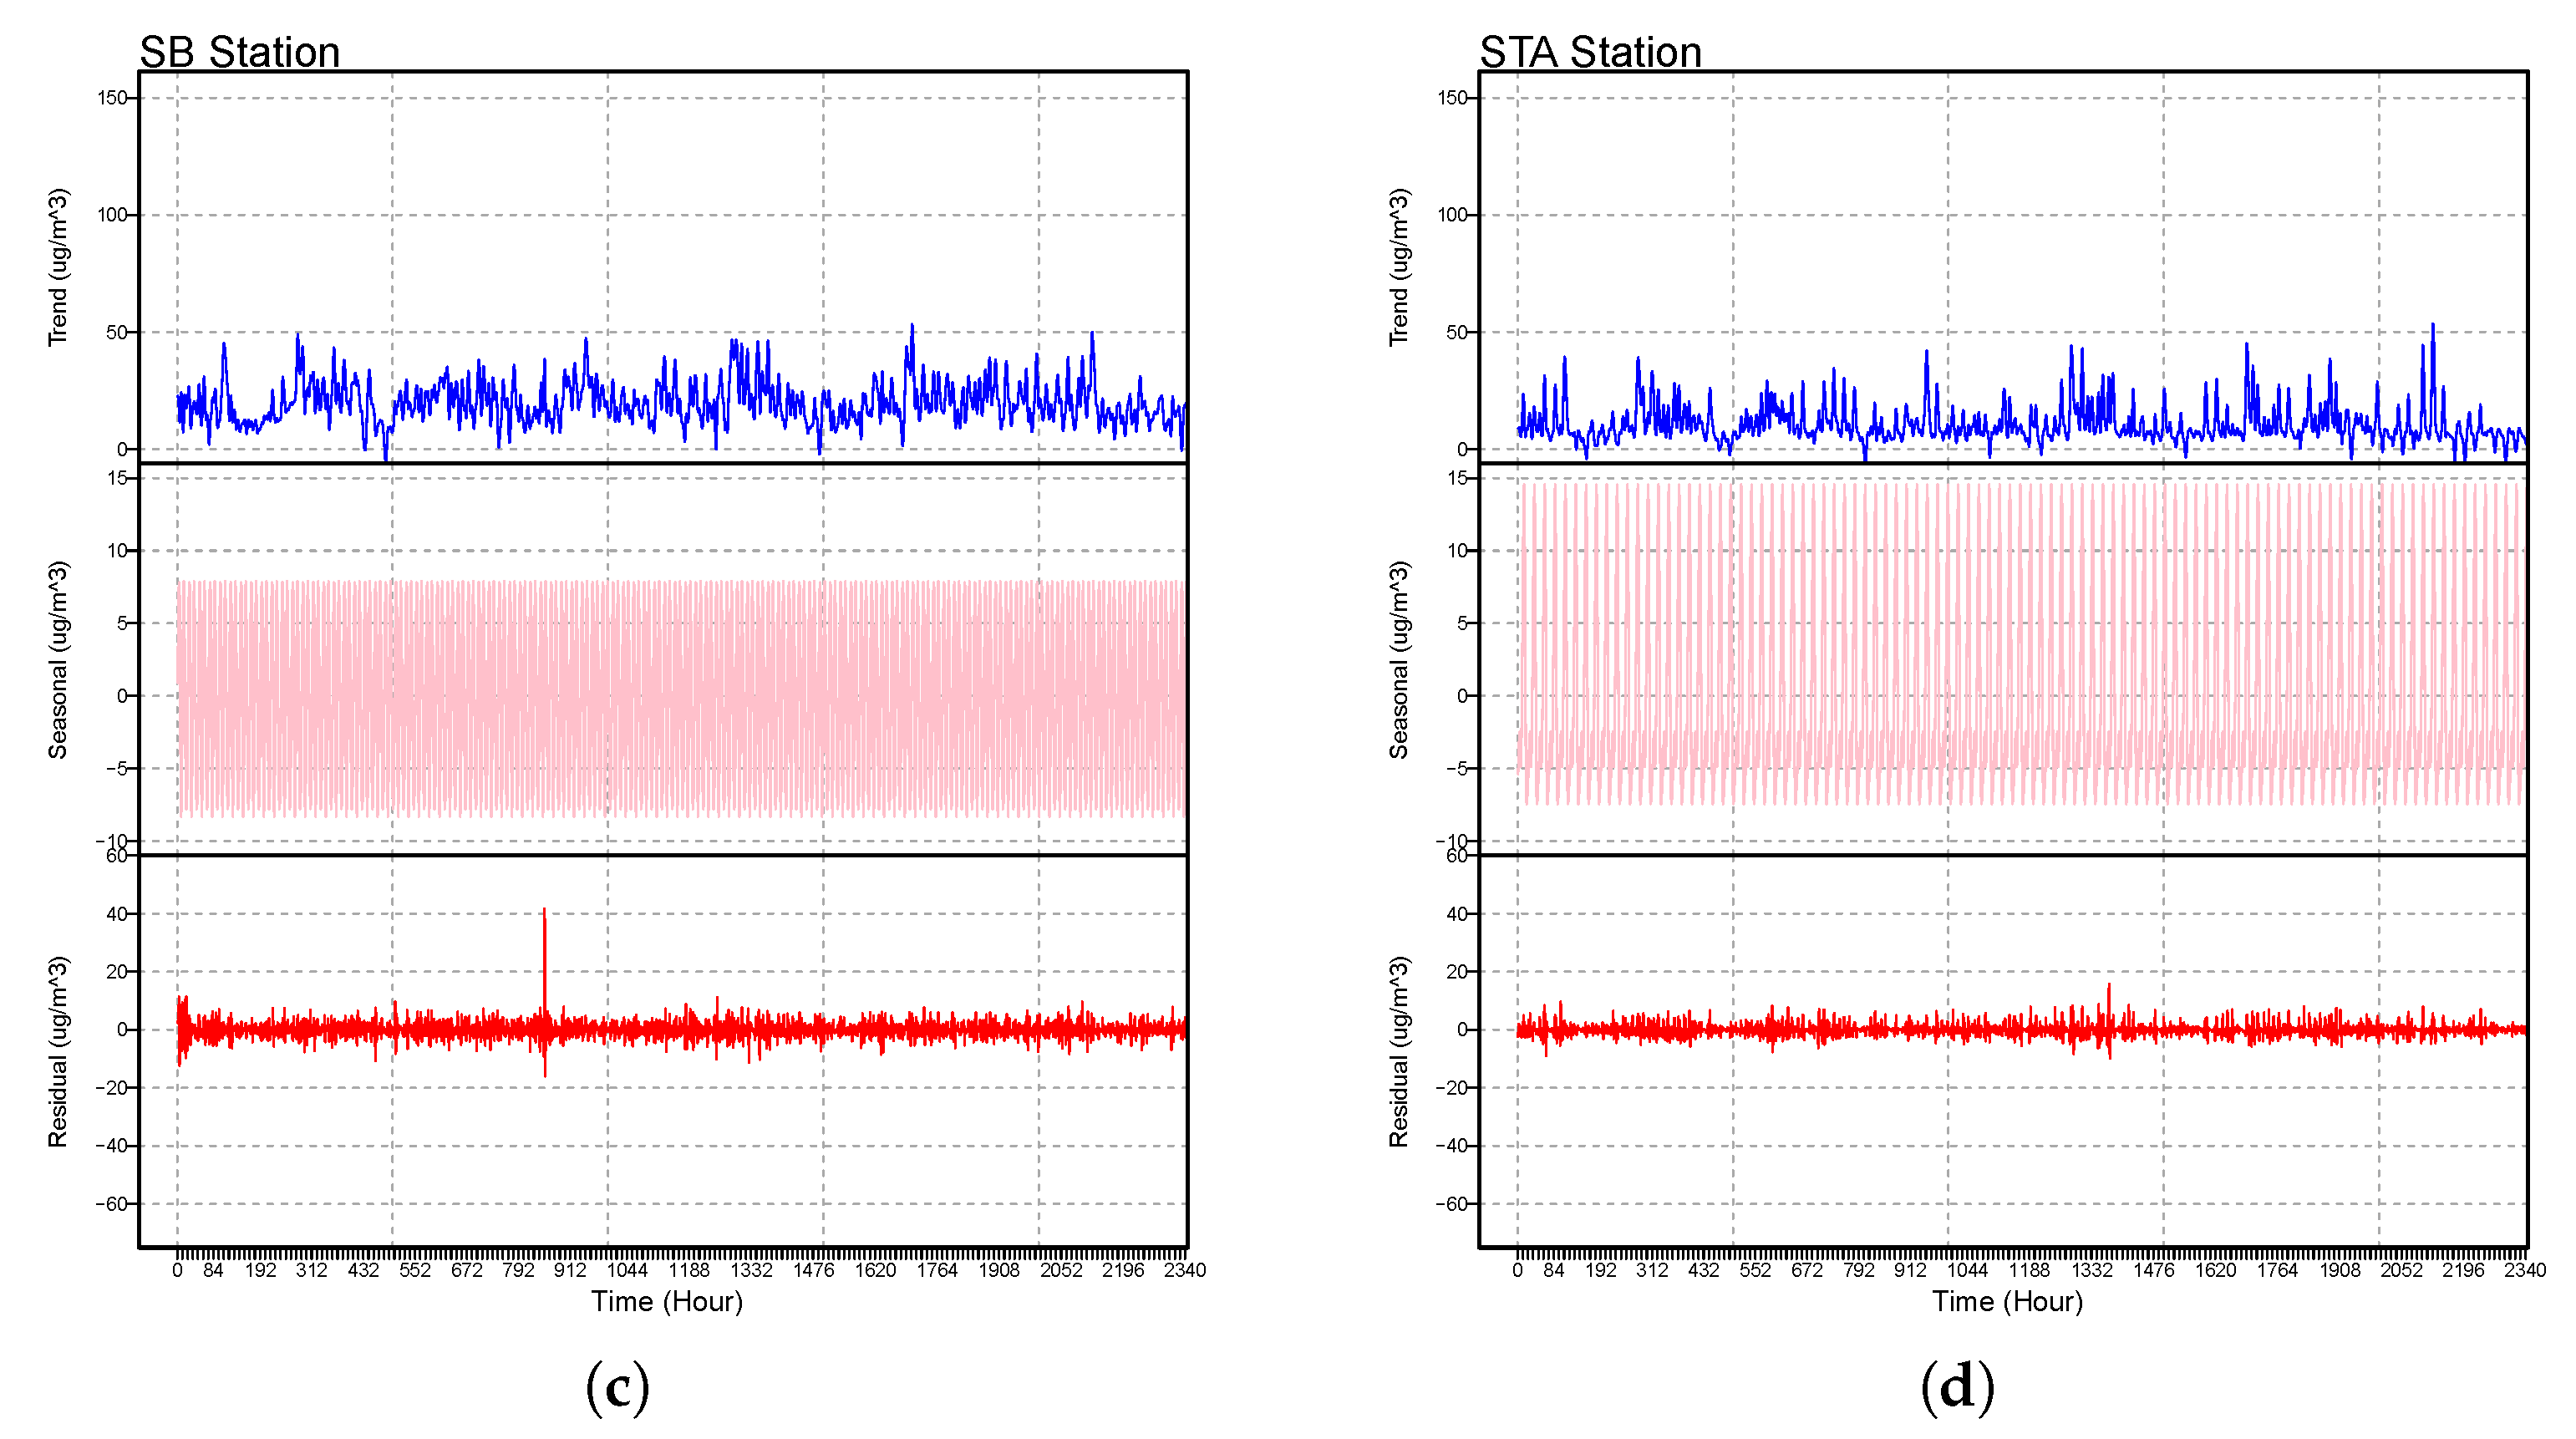
Cleveland et al. [26] proposed the decomposition technique where a seasonal time series model is split into three components of trend, seasonal, and stochastic. Seasonal trend decomposition (STLD) uses losses to decompose the seasonal component of a time series into other three components, including seasonal, trend, and stochastic. In particular, the steps included in STLD are: first de-trending; second cyclic smoothing of a sub-sequence, which creates the sequence of each seasonal component and smooths them individually; third, the regular sub-string is smoothed by a low-pass filter, which recombines and smooths sub-strings; fourth, we clean up the season series; fifth, the seasonal component computed in the previous step is used to de-trend the original series, and sixth, the seasonal sequence smoothing is used to get the trend component. To graphically explore the performance of the STLD method described above, the decomposed sub-series are shown in Figure 1. In each sub-figure (a to d) over a year (only winter season), the top panel indicates the long-term trend ( l n ), the seasonal component is shown in the middle panel ( h n ), and the residual component is presented in the bottom panel ( r n ). Hence, the STLD technique was applied to decompose ( C n ) to properly extract the long-term trend and hourly cycle in the ozone concentration time series. Moreover, the considered decomposition method extracts the specific features in all four station ozone concentration time series very well.

2.2. Modeling the Decomposed Sub-Series

Once the sub-series are obtained from the hourly ozone concentration time series using the STL decomposition technique, the extracted sub-series are fit by applying the three considered standard time series models, including linear autoregressive (AR), nonlinear autoregressive (NLAR), and autoregressive moving averages (ARMA) [27,28]. These three models are explained in the following subsections.

2.2.1. Autoregressive Model

The autoregressive model (AR) model uses a linear combination of x lagged observations of C n to explain the short-term dynamics of C n [29] and can be expressed as
C n = I + ξ 1 C n 1 + ξ 2 C n 2 + + ξ x C n x + ϵ n ,
where ξ i ( i = 1 , 2 , , r ) are the parameters of AR model and ϵ m denotes the white noise process. In the present study, the maximum likelihood method is used for parameter estimation. The lags 1, 2, 3, 4, and 5 were included in the model due to their significant results after the plotting of autocorrelation function (ACF) and partial autocorrelation function (PACF) for the series.

2.2.2. Nonlinear Autoregressive Model

The nonlinear autoregressive model (NLAR) is the additive counterpart of the AR model, in which there is no specific linear form between z n and its corresponding lag values [30]. Mathematically, it can be expressed as
C n = w 1 ( C n 1 ) + w 2 ( C n 2 ) + + w x ( C n x ) + ϵ n ,
where w i represents each lag value, and smoothing function C n expresses the relationship between C n . In this study, the function w i is described by a cubic regression spline, and lags 1, 2, 3, 4, and 5 are used for NLAR modeling.

2.2.3. Autoregressive Moving Average Model

The autoregressive moving average (ARMA) model includes both error terms and lagged values of the time series. In this work, the sub-series are modeled with a linear combination of x lagged values and delayed error terms [31]. Mathematically, the model equation can be expressed as
C n = μ + ξ 1 C n 1 + ξ 2 C n 2 + . . . + ξ x C n x + ϵ n + ψ 1 ϵ n 1 + ψ 2 ϵ n 2 + . . . + φ ϵ n s ,
where μ is the intercept, ξ i ( i = 1 , 2 , , x ) and ψ j ( j = 1 , 2 , , s ) are the parameters for the MA and AR models, respectively, and ϵ n N ( 0 , σ ϵ 2 ) . In this work, the descriptive and graphical analysis indicates that, in the MA part, the first two lags are significant, whereas in the AR part, only lags 1, 2, 3, 4, and 5 are significant.
In this research study, each combined model is denoted with the STLD method by l n STLD r n h n , where the l n in the top left corner represent the long-run component/sub-series, the h n in the top right indicates the seasonal component/sub-series, and the residual component/sub-series is represented in the bottom right by r n . In the forecasting models, we assign the codes “a”, “b”, and “c” to the autoregressive, the nonlinear autoregressive, and the autoregressive moving average models, respectively. For example, a STLD c b describes the estimate of the long-term trend ( l n ) with AR model, the seasonal series ( h n ) estimated with the NLAR model, and the residual series ( r n ) estimated by using ARMA. The individual forecast models are combined to obtain the final one-hour-ahead forecasts of ozone concentration.
C ^ n + 1 = l ^ n + 1 + h ^ n + 1 + r ^ n + 1

2.3. Accuracy Measures

In order to check the performance of the forecasting models in previous studies, many researchers used various performance measures and statistical tests [32,33,34,35]. Hence, in this study, for model evaluation, first, we used five accuracy mean errors: two relative mean errors, two absolute mean errors, and one correlation measure for observed versus forecasted values, such as root mean square error (RMSE), root mean square percentage error (RMSPE), mean absolute error (MAE), and mean absolute percentage error (MAPE). The mathematical formula for accuracy means errors are expressed as
RMSE = 1 n i = 1 n ( C i C ^ i ) 2 ,
RMSPE = 1 n i = 1 n ( C i C ^ i ) 2 C i × 100 ,
MAE = 1 n i = 1 n | C i C ^ i | ,
MAPE = 1 n i = 1 n | C i C ^ i | | C i | × 100 ,
CC = correlation C i , C ^ i .
Here, the observed value is C i of the time series, and C ^ i represent the forecasted ozone concentration value of the ith observation (i = 1, 2, , n), with the size of n in the testing set. Second, the Diebold and Mariano (DM) test [36] was conducted to test the significance of the differences among the performance of the forecasting models. The DM test is a broadly used statistical test for the comparison of forecasts extracted from various models [37,38,39]. To understand it, consider two forecasts, C ^ 1 n and C ^ 2 n , that are available for the time series C n for n = 1 , , N . The associated forecast errors are e 1 n = C n C ^ 1 n and e 2 n = C n C ^ 2 n . Let the loss associated with forecast error { e i n } i = 1 2 be L ( e i n ) . For example, the absolute loss in time n would be L ( e i n ) = | e i n | , and the differential loss between forecast 1 and forecast 2 for time t is then w n = L ( e 1 n ) L ( e 2 n ) . The null hypothesis of equal forecast accuracy for two forecasts is E [ w n ] = 0 . The DM test needs the differential loss to be covariance stationary, i.e.,
E [ w n ] = μ , n
cov ( w n w n τ ) = γ ( τ ) , n
var ( w n ) = σ w , 0 < σ w <
Under these assumptions, the DM test of equal forecast accuracy is
DM = w ¯ σ ^ w ¯ d N ( 0 , 1 )
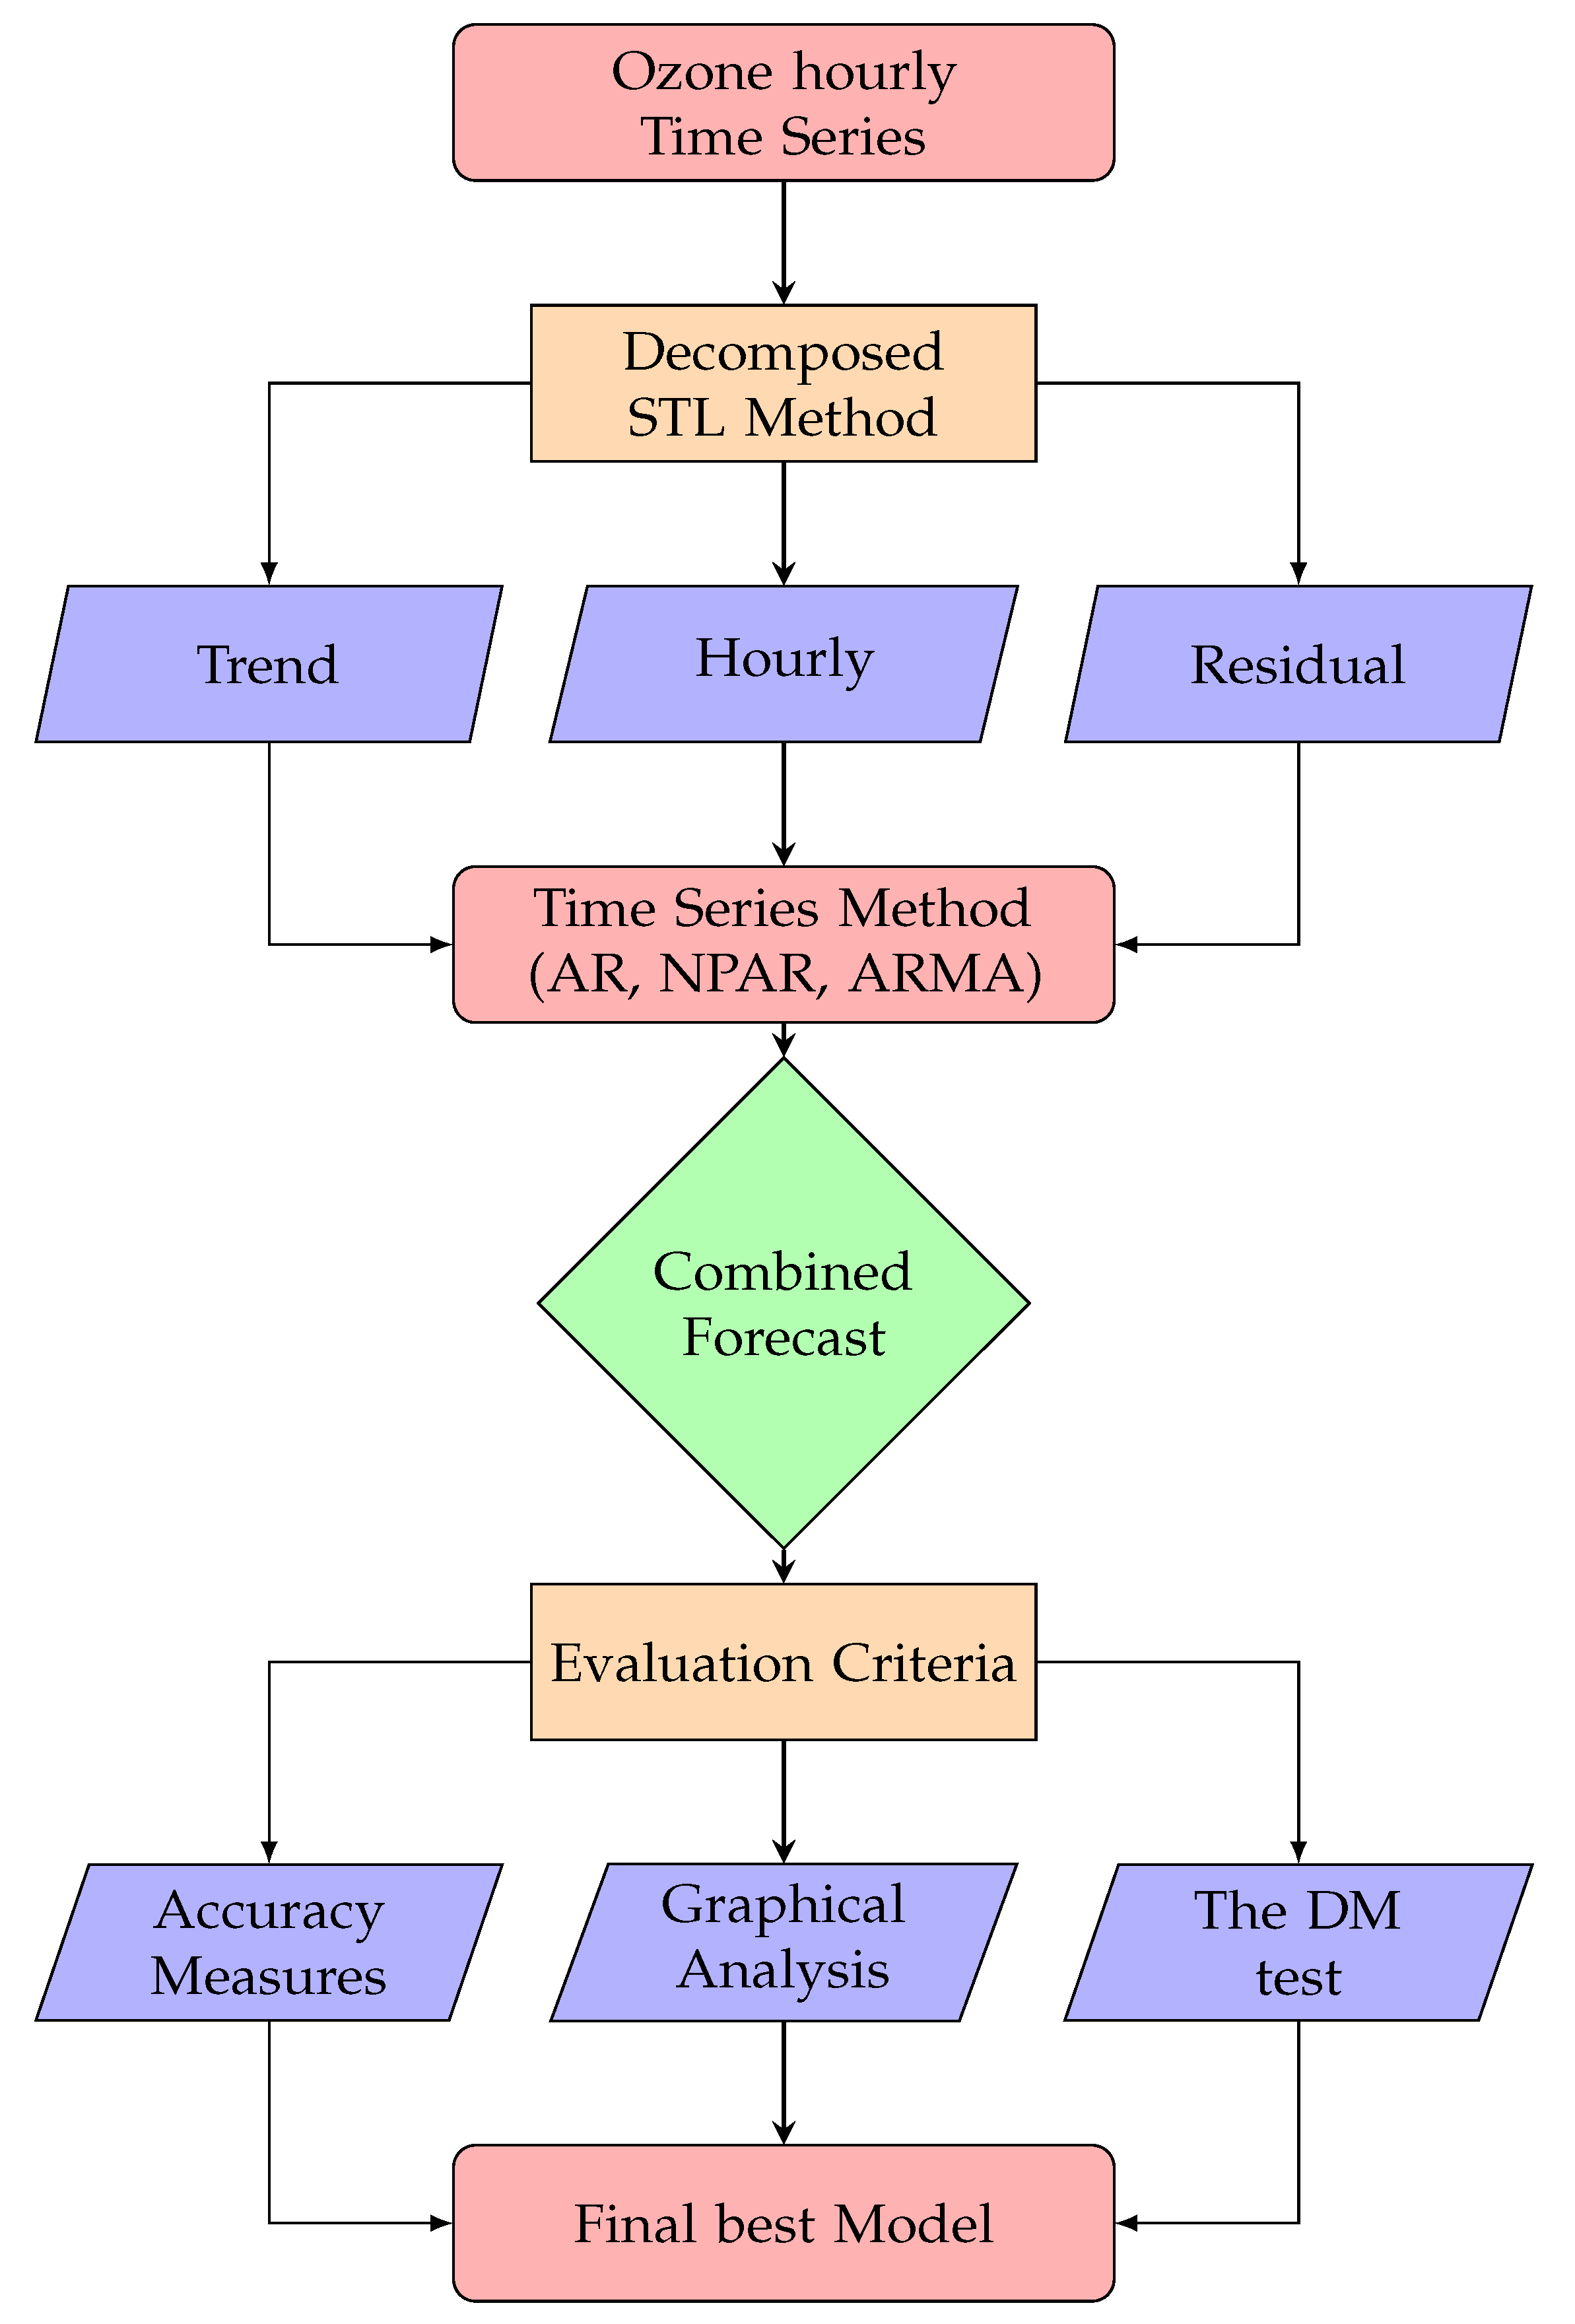
where w ¯ = 1 N n = 1 N w n is the differential loss of the sample mean, and σ ^ w ¯ is a consistent estimate of standard error w n . Finally, we verify the superiority of the proposed hybrid combination of time series forecasting models using various figures, such as the box plot, line plot, bar plot, and dot plot in this work. To conclude this section, the design of the proposed hybrid combination of time series modeling and forecasting technique is presented in Figure 2.

3. Case Study Results

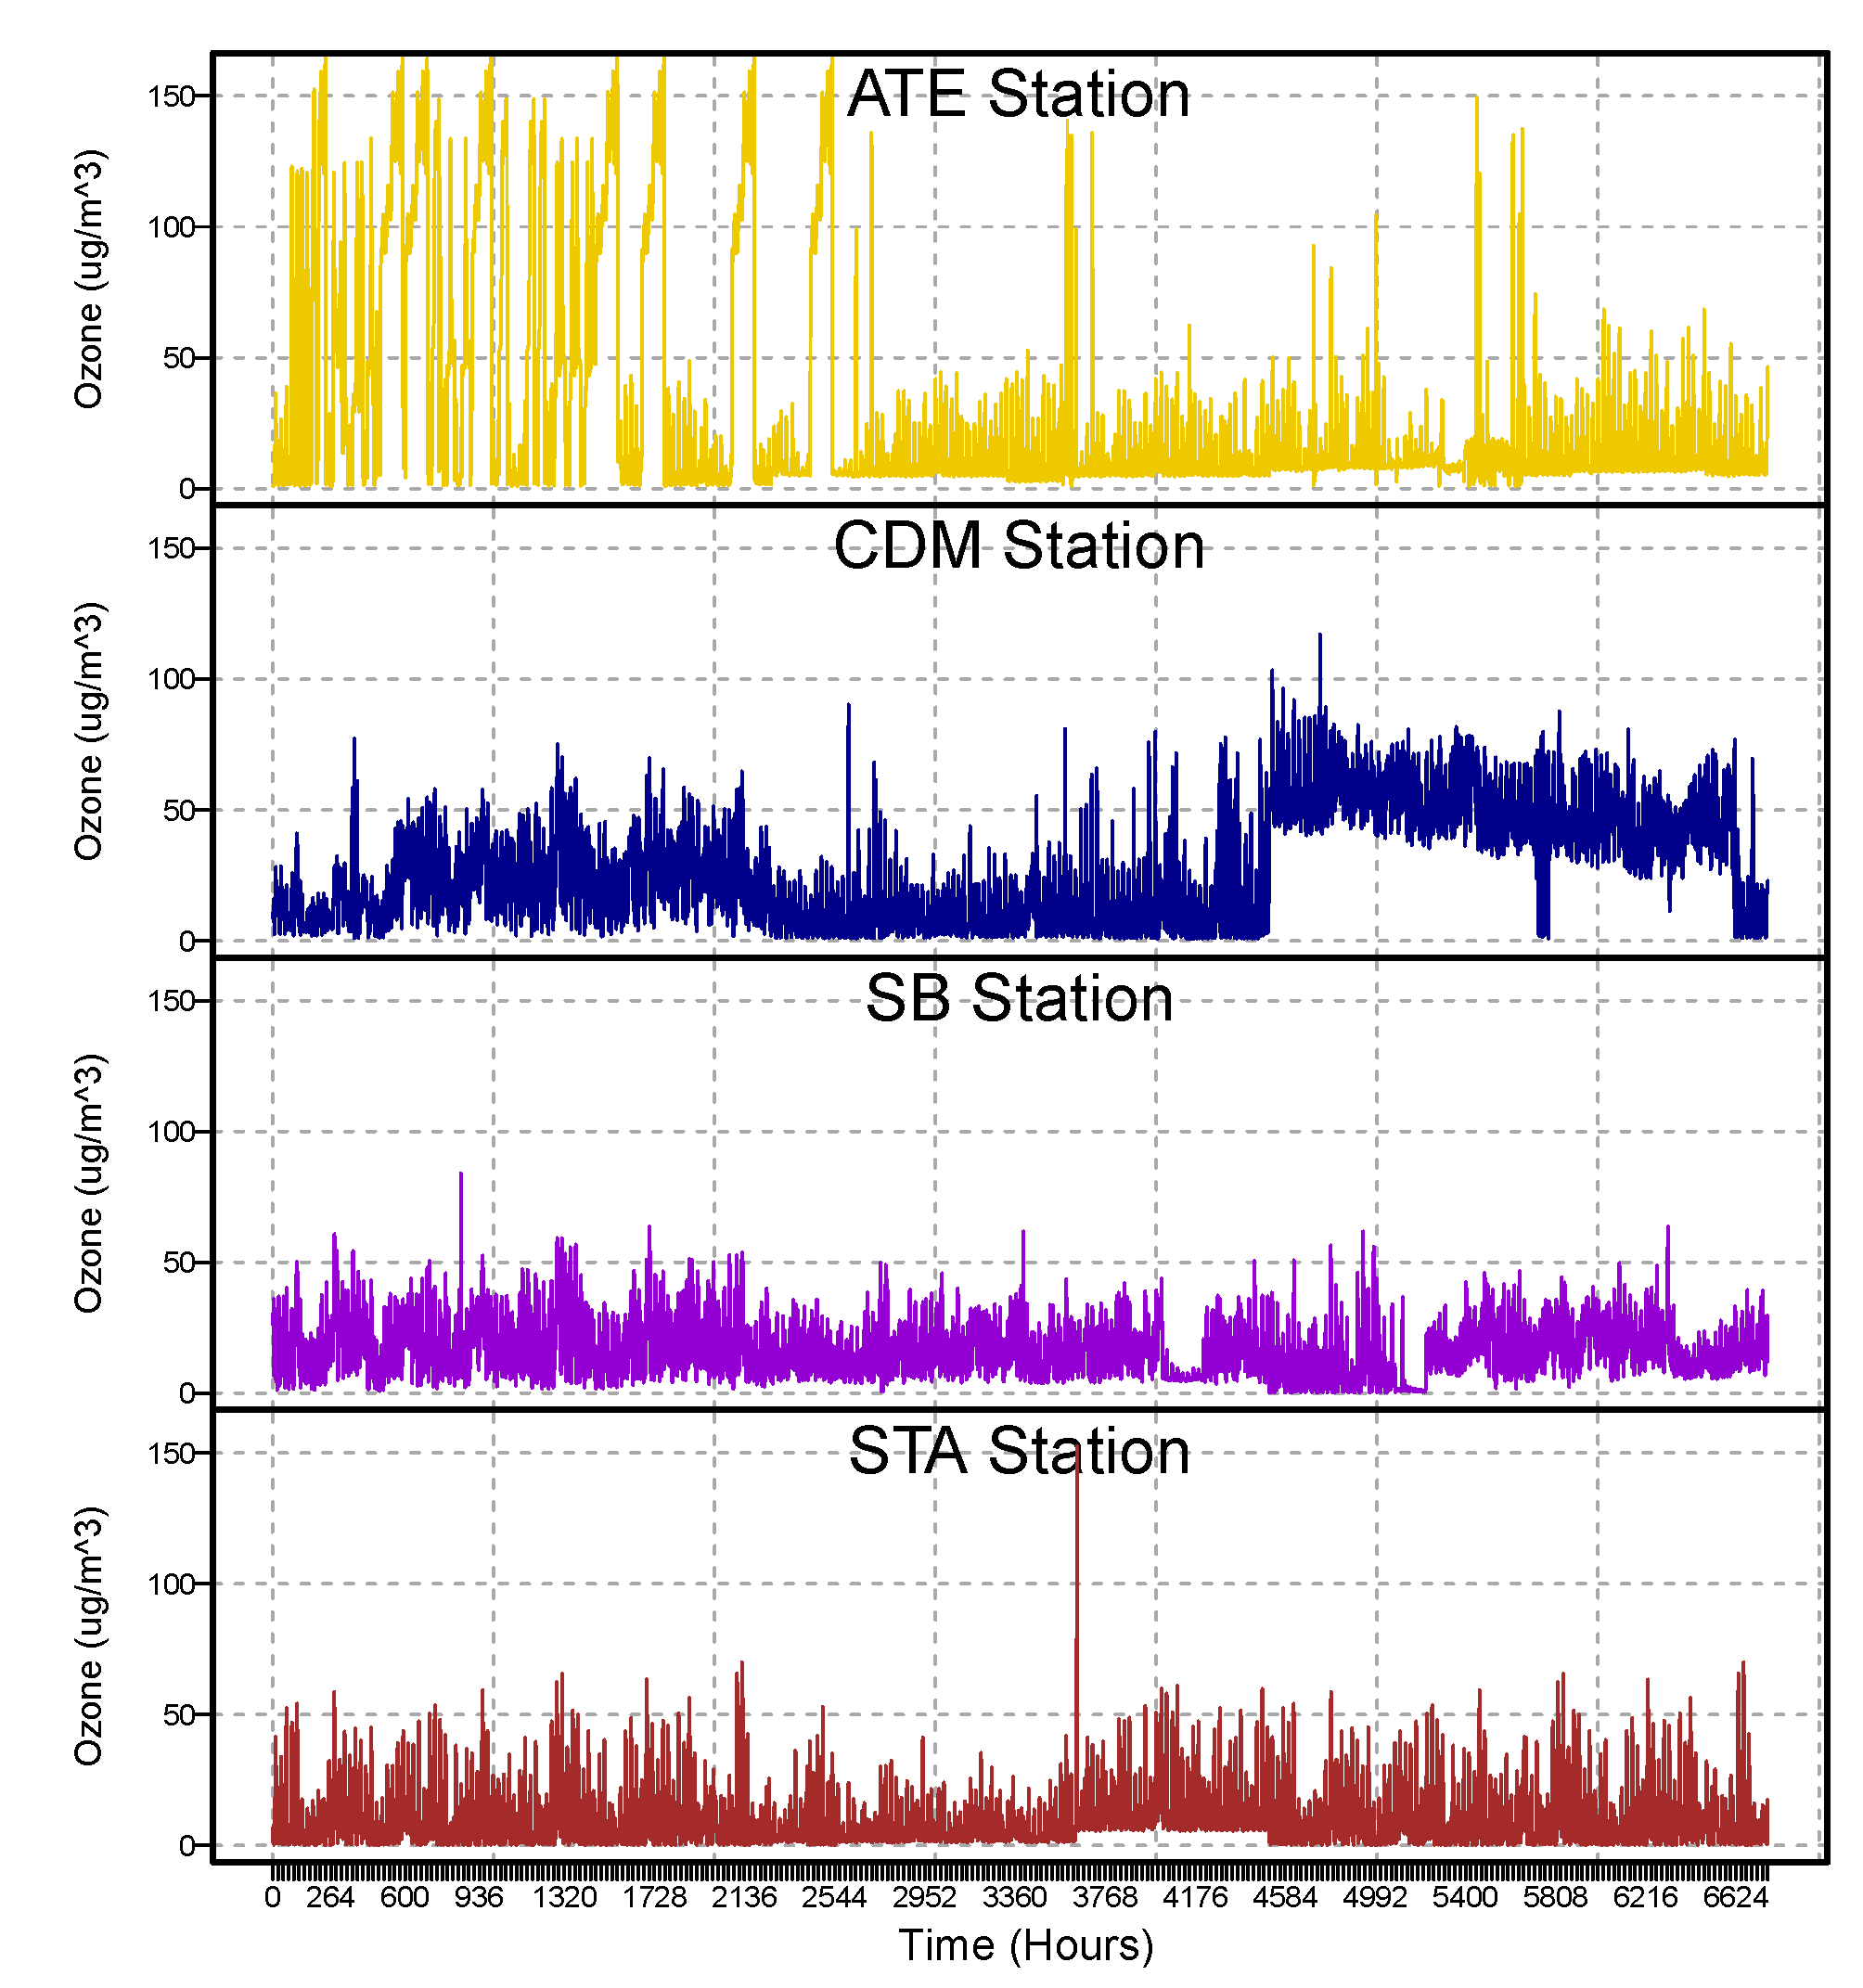
This work uses hourly ozone concentration datasets from four monitoring stations: ATE, CDM, SB, and Santa Anita, in Metropolitan Lima, for the duration of three consecutive years: 2017, 2018, and 2019. Within each year, only winter days are considered. Therefore, there are 6768 data points for one station. The graphic presentation of all four stations’ hourly time series can be seen in Figure 3. The descriptive statistics and non-stationary statistics (augmented Dickey–Fuller (ADF) [40] test) for all four stations’ imputed hourly ozone time series and the log imputed hourly ozone time series are listed in Table 2. Hence, descriptive metrics are a collection of methods for summarising and describing the key characteristics of a dataset, such as its central tendency, variability, and distribution. These statistics give an overview of the data and aid in determining the presence of patterns and linkages. It can be seen from Table 2 that the clear effect of the log and without log time series is in terms of all descriptive statistics, especially the variance and standard deviation stabilization. To conclude, the log-filtered series has the least descriptive statistic values. In addition to the above, we check the unit root issue for all four stations’ imputed hourly ozone time series and the log imputed hourly ozone time series statistically by the ADF test. The results (statistic values), listed in Table 2, suggest that both the log-filtered imputed hourly ozone time series and the log-imputed hourly ozone time series have a higher negative statistic value, which indicates that the series is stationary. Therefore, once the database addresses all the essential treatments, we proceed further, and for forecasting and model estimation purposes, the data are divided into two parts: a training part (for model fit) and a testing part (for out-of-sample forecast). The training part contains the data for 5424 h, which is about 80% of the overall data, and 1344 h are used as the out-of-sample (testing).
To obtain the forecast for ozone concentration one step ahead of an hour using the proposed hybrid methodology time series forecasting presented in Section 2, the given steps need to be followed: first, the STL method of decomposition was used to get a long-run trend ( l n ), a seasonal ( h n ), and the residual ( r n ) of the time sub-series. Second, the previously explained three famous models of times series were used for each sub-series. Therefore, the forecast of an hour ahead was obtained by using the rolling window technique for 1344 h and the models were estimated accordingly. Finally, the ozone concentration forecasts were achieved through Equation (5). The performance measures, including RMSE, RMSPE, MAE, MAPE, and CC, are then used for the evaluation and comparative performance of the models. Therefore, the following subsections detail the results from four monitoring stations: Ate, Campo de Marte, San Borja, and Santa Anita, all located in Metropolitan Lima.

Metropolitan Lima Stations

This subsection elaborates on the results and discussion about the Metropolitan Lima station. First, the hourly time series of the ATE, the CDM, the SB, and the SBA station’s ozone concentration ( C n ) are decomposed into a long-run trend ( l n ), seasonal ( h n ) and a residual sub-series ( r n ); the STL decomposition method was implemented in this study. For obtaining the forecasts of the sub-series, three univariate time series models were used. Ensemble models for sub-series forecast of ( 3 n l × 3 n h × 3 n r = 27) different combinations for all four considered monitoring stations were used. For these 27 different combination models, the performance measures (RMSE, RMSPE, MAE, MAPE, and CC) for one hour ahead of out-of-sample forecasts for the ATE, the CDM, the SB, and the SBA stations are listed in Table 3.
In the first attempt, the case study results of the ATE station accuracy performance measures (RMSE, RMSPE, MAE, MAPE, and CC) show that the a STLD c b hybrid combination model produces the best forecasts compared to all other possible hybrid combinations of time series models. The a STLD c b is the best forecasting model, which produced 4.611, 4.464, 1.711, 14.862, and 0.949 for RMSE, RMSPE, MAE, MAPE, and CC, respectively. However, the c STLD c b (4.636, 4.480, 1.704, 14.985, 0.948), c STLD b b (5.601, 4.817, 1.882, 16.179, 0.924), and a STLD b b (5.622, 4.906, 1.871, 16.081, 0.923) models produced the second, third, and fourth best results. Similarly, in the second attempt, the case study results of the CDM station and the results of the performance accuracy measures show that the b STLD c c model yields better forecasts compared to all other possible hybrid combination models. The best forecasting model, c STLD c c , produced 3.637, 11.846, 2.356, 20.441, and 0.978 for RMSE, RMSPE, MAE, MAPE, and CC, respectively. However, the c STLD c b (3.762, 11.689, 2.464, 20.847, 0.976), a STLD c c (3.746, 11.68, 2.458, 20.882, 0.976), and c STLD c b (3.794, 11.906, 2.514, 21.323) models produced the second, third, and fourth best results. In the same way, in the third attempt, the case study results of the SB station and the results of the performance accuracy measures show that the b STLD c b model yields better forecasts compared to all other possible combination models. The best forecasting model is b STLD c b , which gives outcomes of 1.495, 1.864, 1.078, 7.668, and 0.989 for RMSE, RMSPE, MAE, MAPE, and CC, respectively. However, the c STLD c b (1.559, 1.568, 1.136, 7.897, and 0.987), a STLD c b (1.535, 1.644, 1.118, 7.793, and 0.987), and b STLD c c (1.721, 2.021, 1.301, 9.293, and 0.985) models produced the second, third, and fourth best results. Finally, in the fourth attempt, the case study results of the SB station and the results of the performance accuracy measures show that the c STLD c b model yields better forecasts compared to all other possible combination models. The best forecasting model is c STLD c b , which gives outputs of 1.969, 15.924, 1.462, 76.261, and 0.989 for RMSE, RMSPE, MAE, MAPE, and CC, respectively. However, the c STLD c c (2.141, 19.925, 1.605, 88.958, and 0.988), c STLD c a (2.143, 19.669, 1.603, 89.367, and 0.988), and c STLD b b (3.190, 21.490, 2.298, 95.063, and 0.972) models produced the second, third, and fourth best results.
From all twenty-seven models, in each monitoring station, the best four hybrid combination models are selected for comparison and compared with other models in each case. The outcome of all these best hybrid combination models is tabulated in Table 4. For example, in the case of the ATE station, based on the performance accuracy measure findings, it is evident that the a STLD c b give the least values (RMSE = 4.611, RMSPE = 4.464, MAE = 1.711, MAPE = 14.862, and CC = 0.949). Therefore, it is concluded that the a STLD c b is the best model among the best models as well as all twenty-seven models. In the same way, in the case of the CDM station, from Table 4, it is confirmed that the b STLD c c produced the smallest values (RMSE = 3.637, RMSPE = 11.846, MAE = 2.356, MAPE = 20.441, and CC = 0.978). Hence, it is concluded that the b STLD c c is the best model among the best models as well as all twenty-seven models. However, in the case of the SB station results, it is evident that the c STLD c b produced the smallest values (RMSE=1.969, RMSPE = 15.924, MAE = 1.462, MAPE = 76.261, and CC = 0.989) within the final best hybrid combination models. Thus, it is concluded that the c STLD c b is the best hybrid combination model among the best models as well as all twenty-seven models. Likewise, within the best hybrid combination model outcomes from the STA stations, the b STLD c b produced the smallest values (RMSE = 1.495, RMSPE = 1.864, MAE = 1.078, MAPE = 7.668, and CC = 0.989). Based on these results, it is concluded that the b STLD c b is the best model among the best models as well as all twenty-seven models.
To confirm the dominance of models for all monitoring stations (the ATE, the CDM, the SB, and the STA) listed in Table 4, in this work, we performed the DM test on each pair of models. The null hypothesis is that the two models on the columns and rows are equally accurate, and the alternative hypothesis is that the model on the columns is more accurate than the model on the rows (using the loss-squared function). The results (p-values) of the DM test are given in Table 5 for all four stations (ATE, CDM, SB, and STA) of Metropolitan Lima. The results of the ATE station show that the final best ( a STLD c b ) model within all four best models is statistically superior to the other best combination models at the 5% level of significance. However, in the CDM, the SB, and the STA stations, the final best combination models, the ( b STLD c c ), the ( b STLD c b ), and ( c STLD c b ), are statistically superior to the other best combination models at the 5% level of significance.
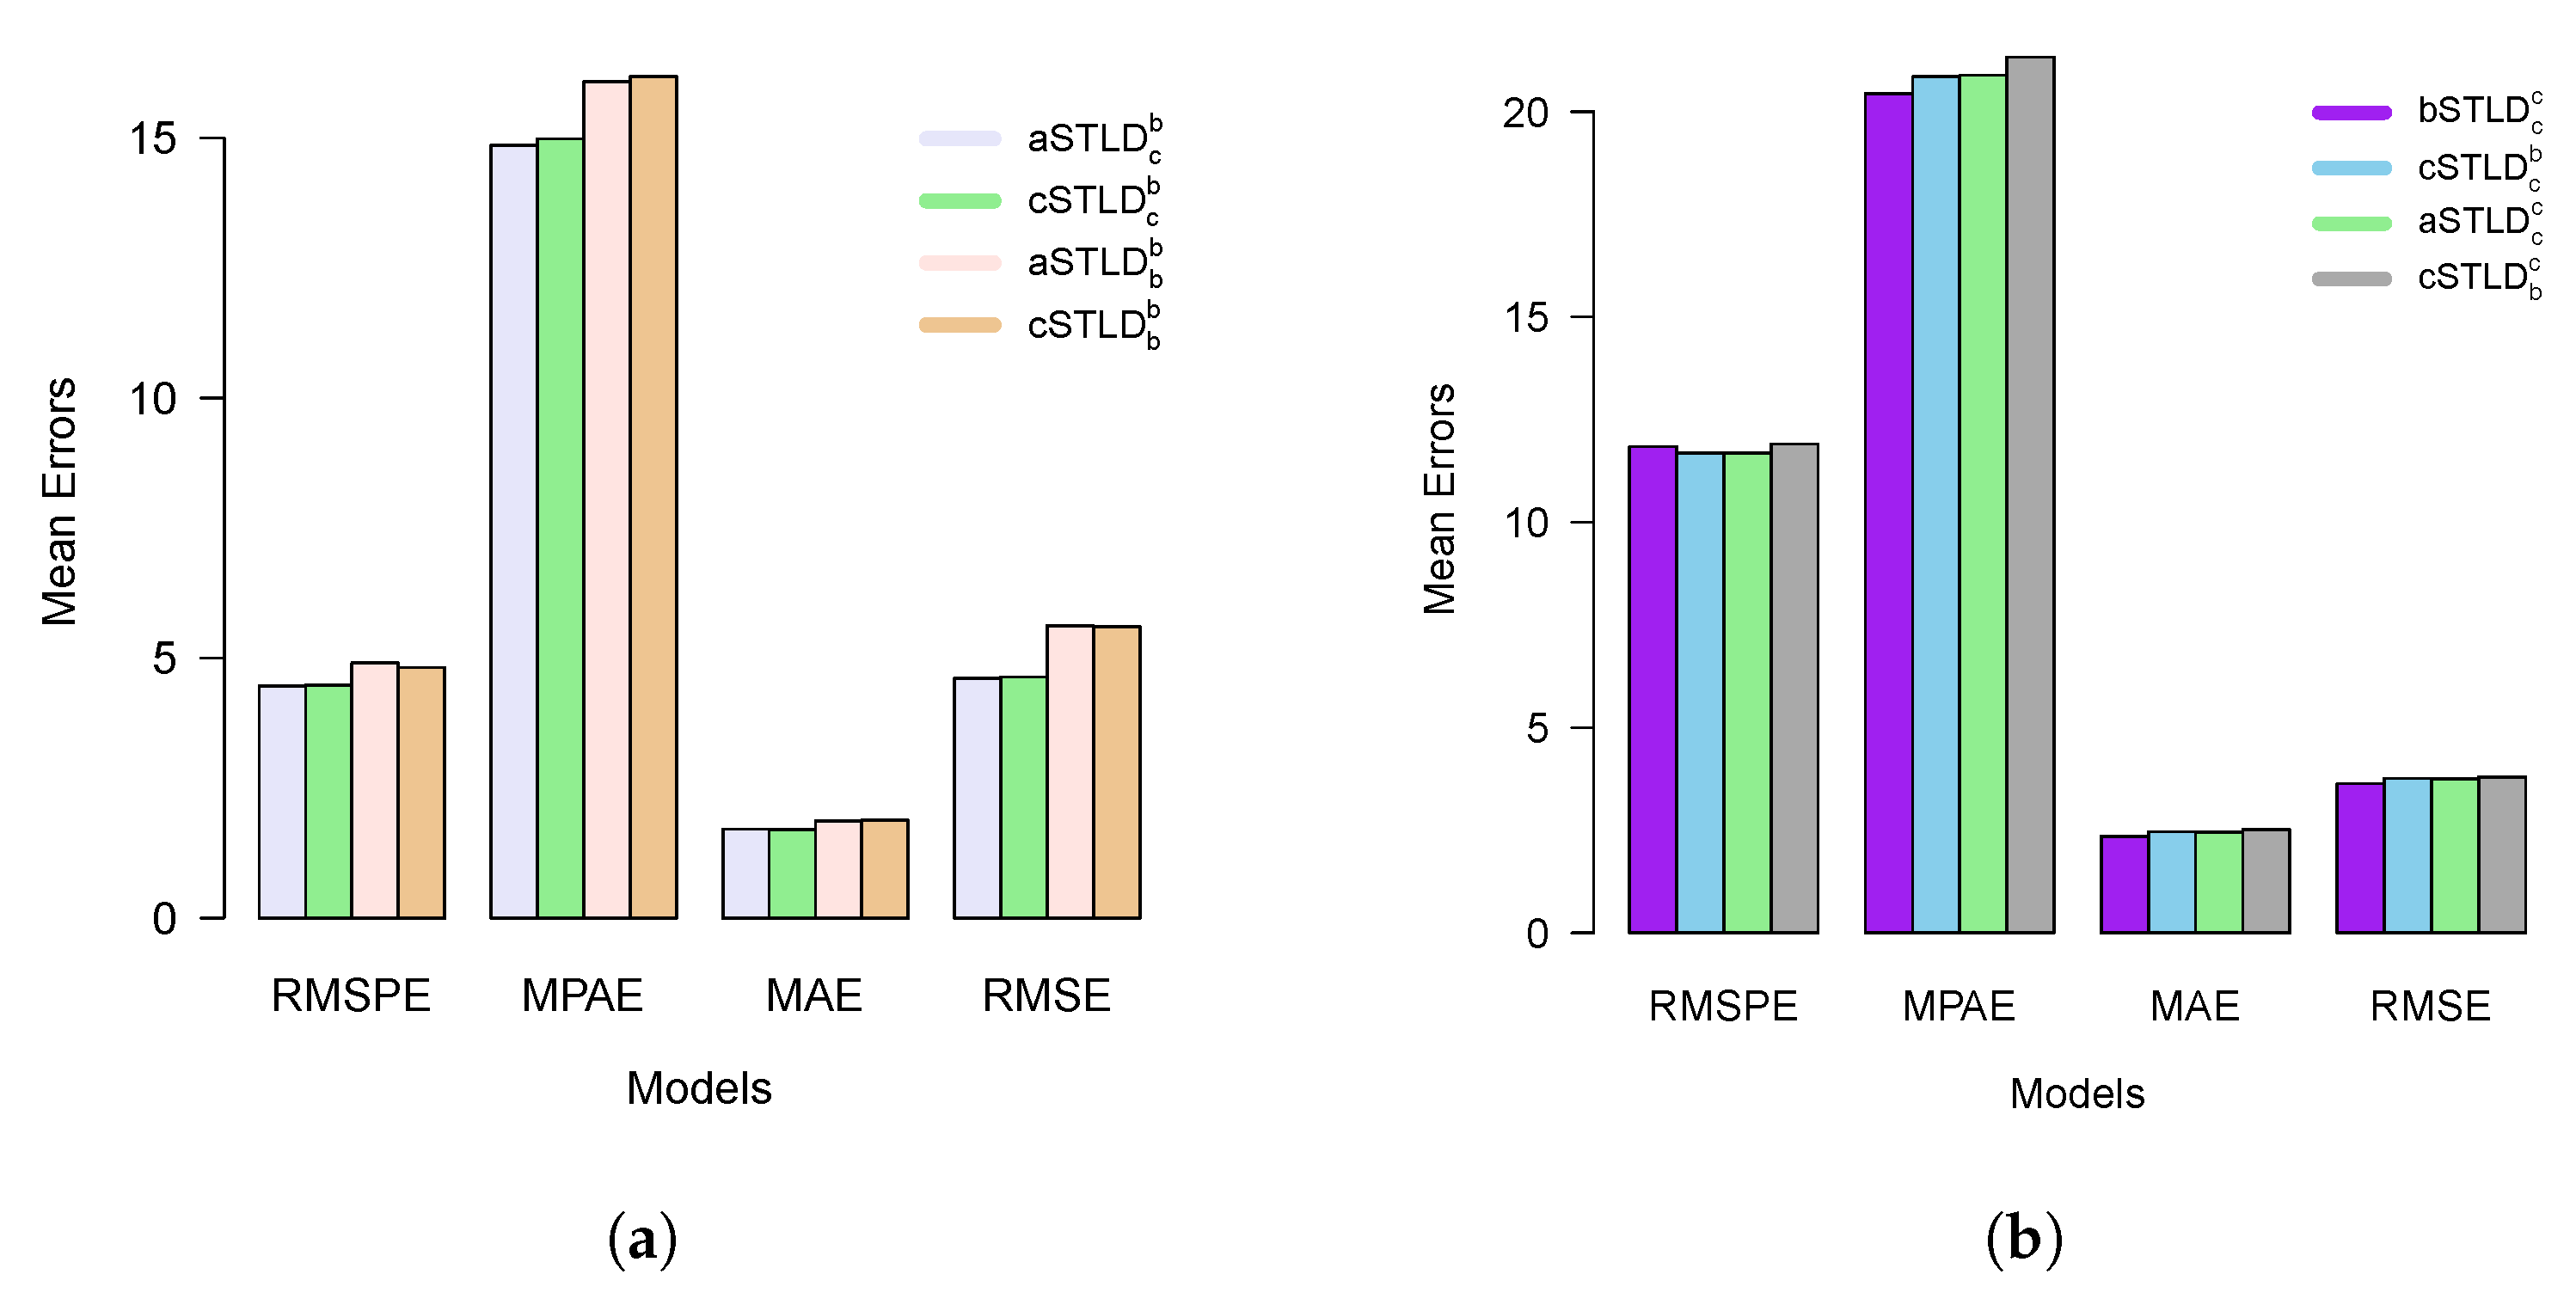
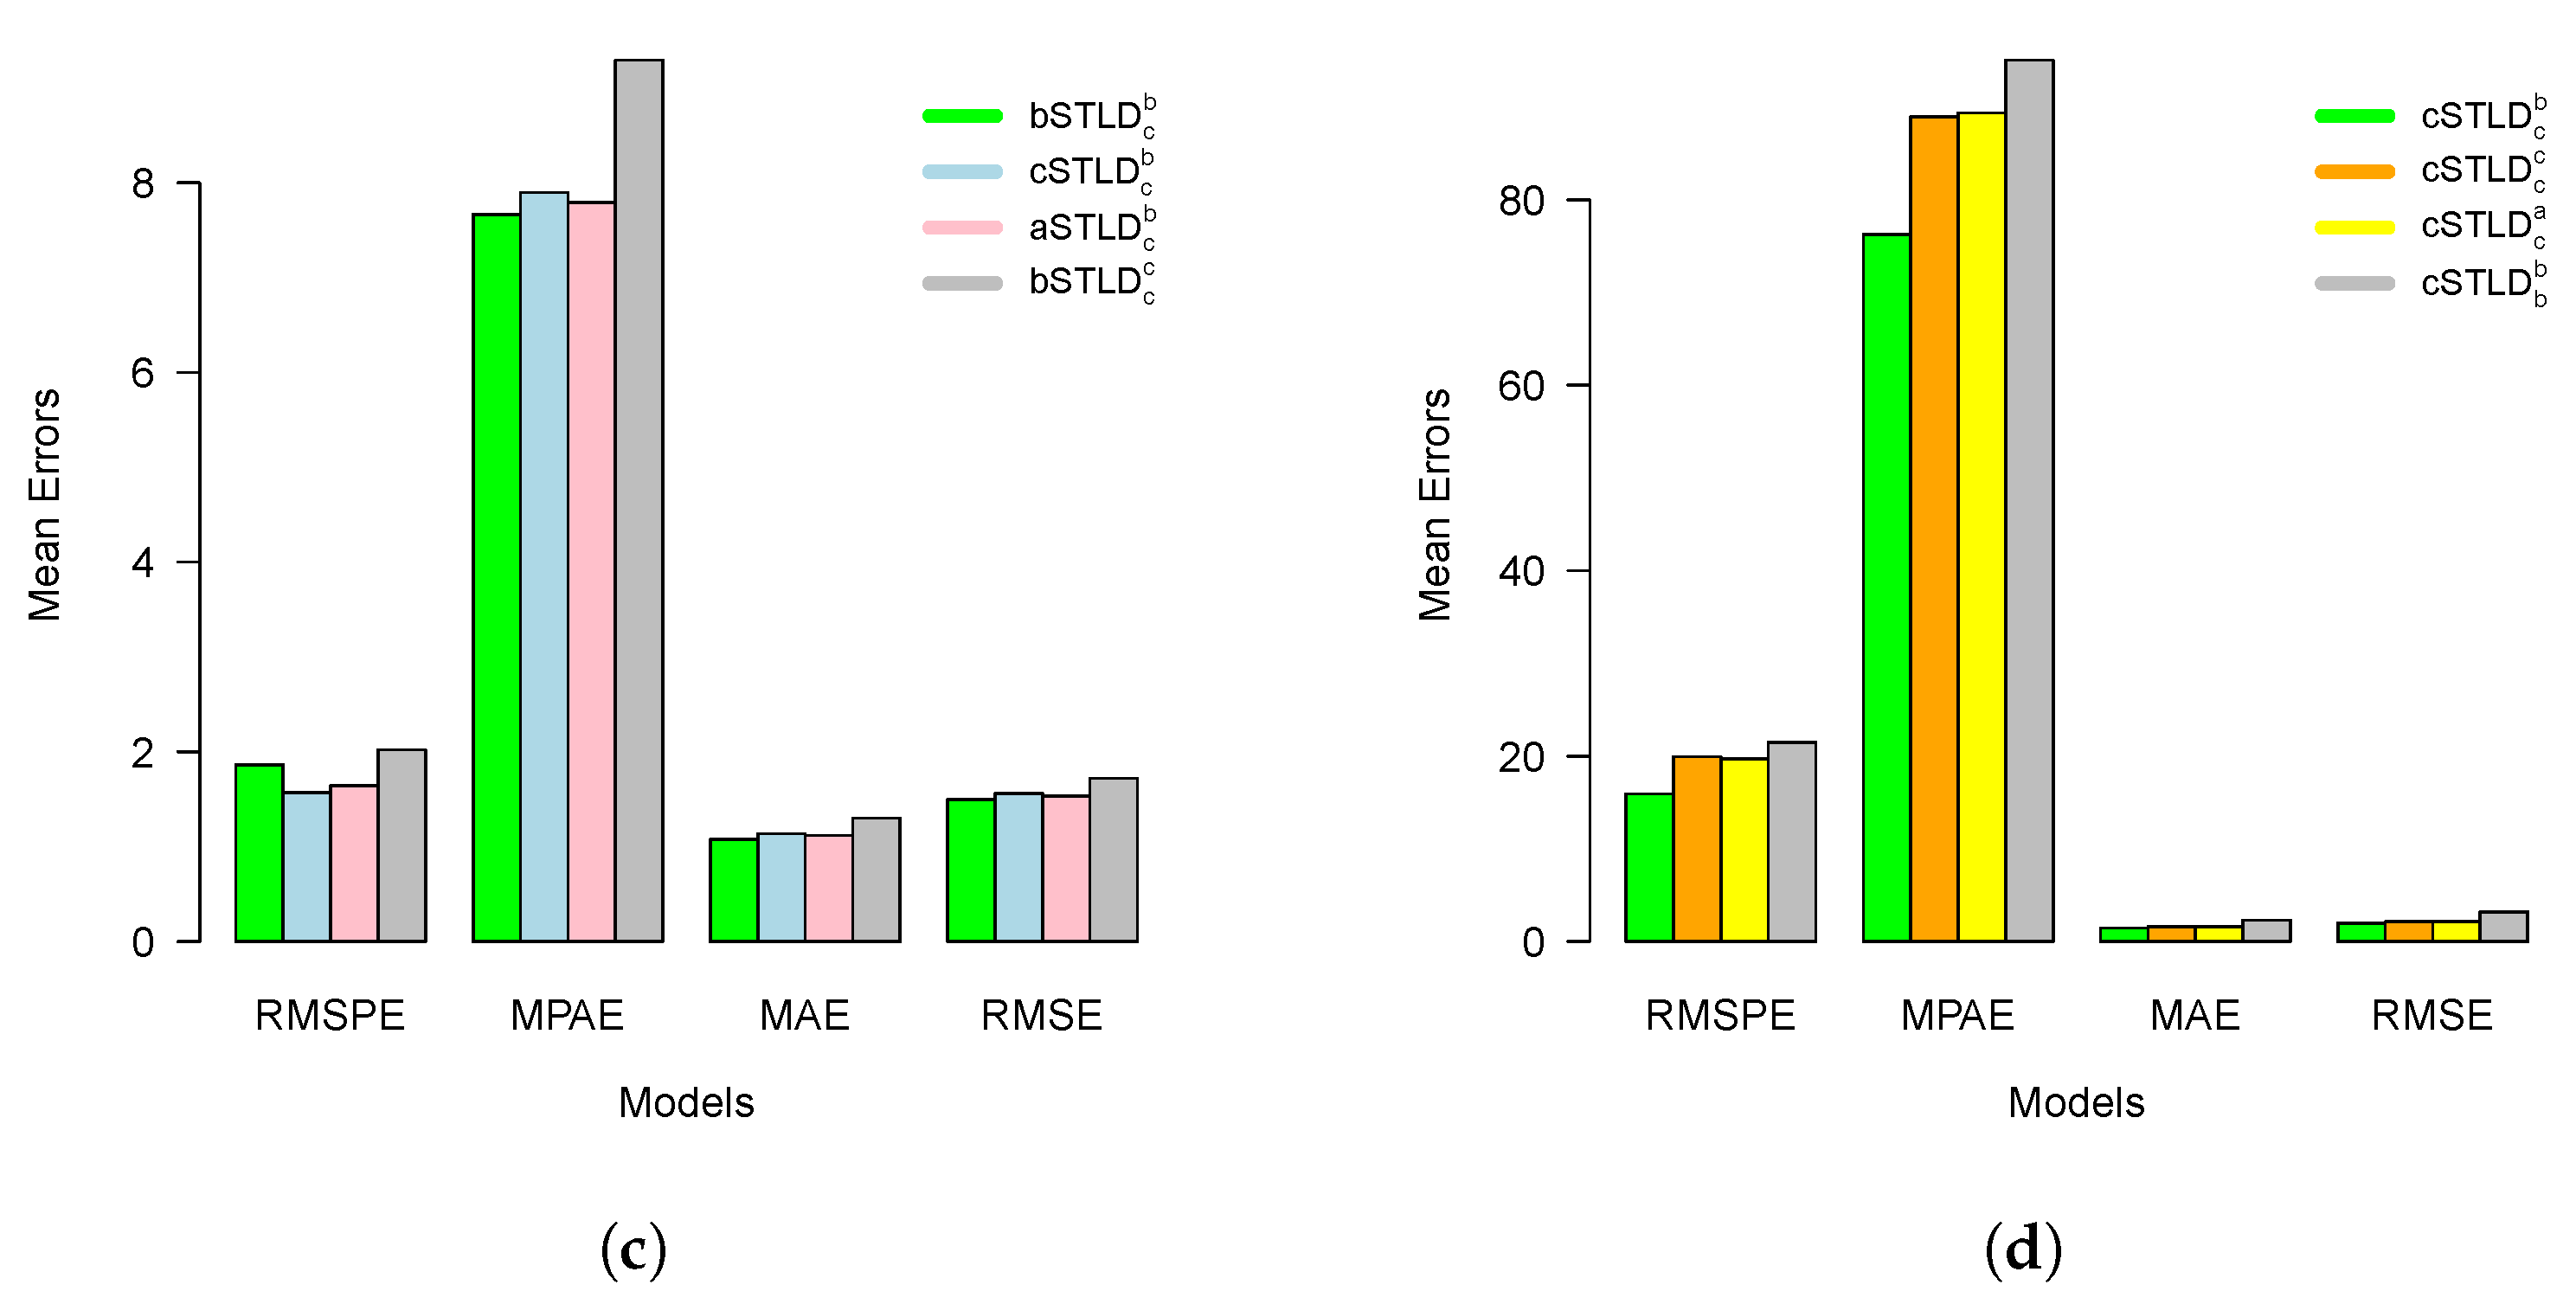
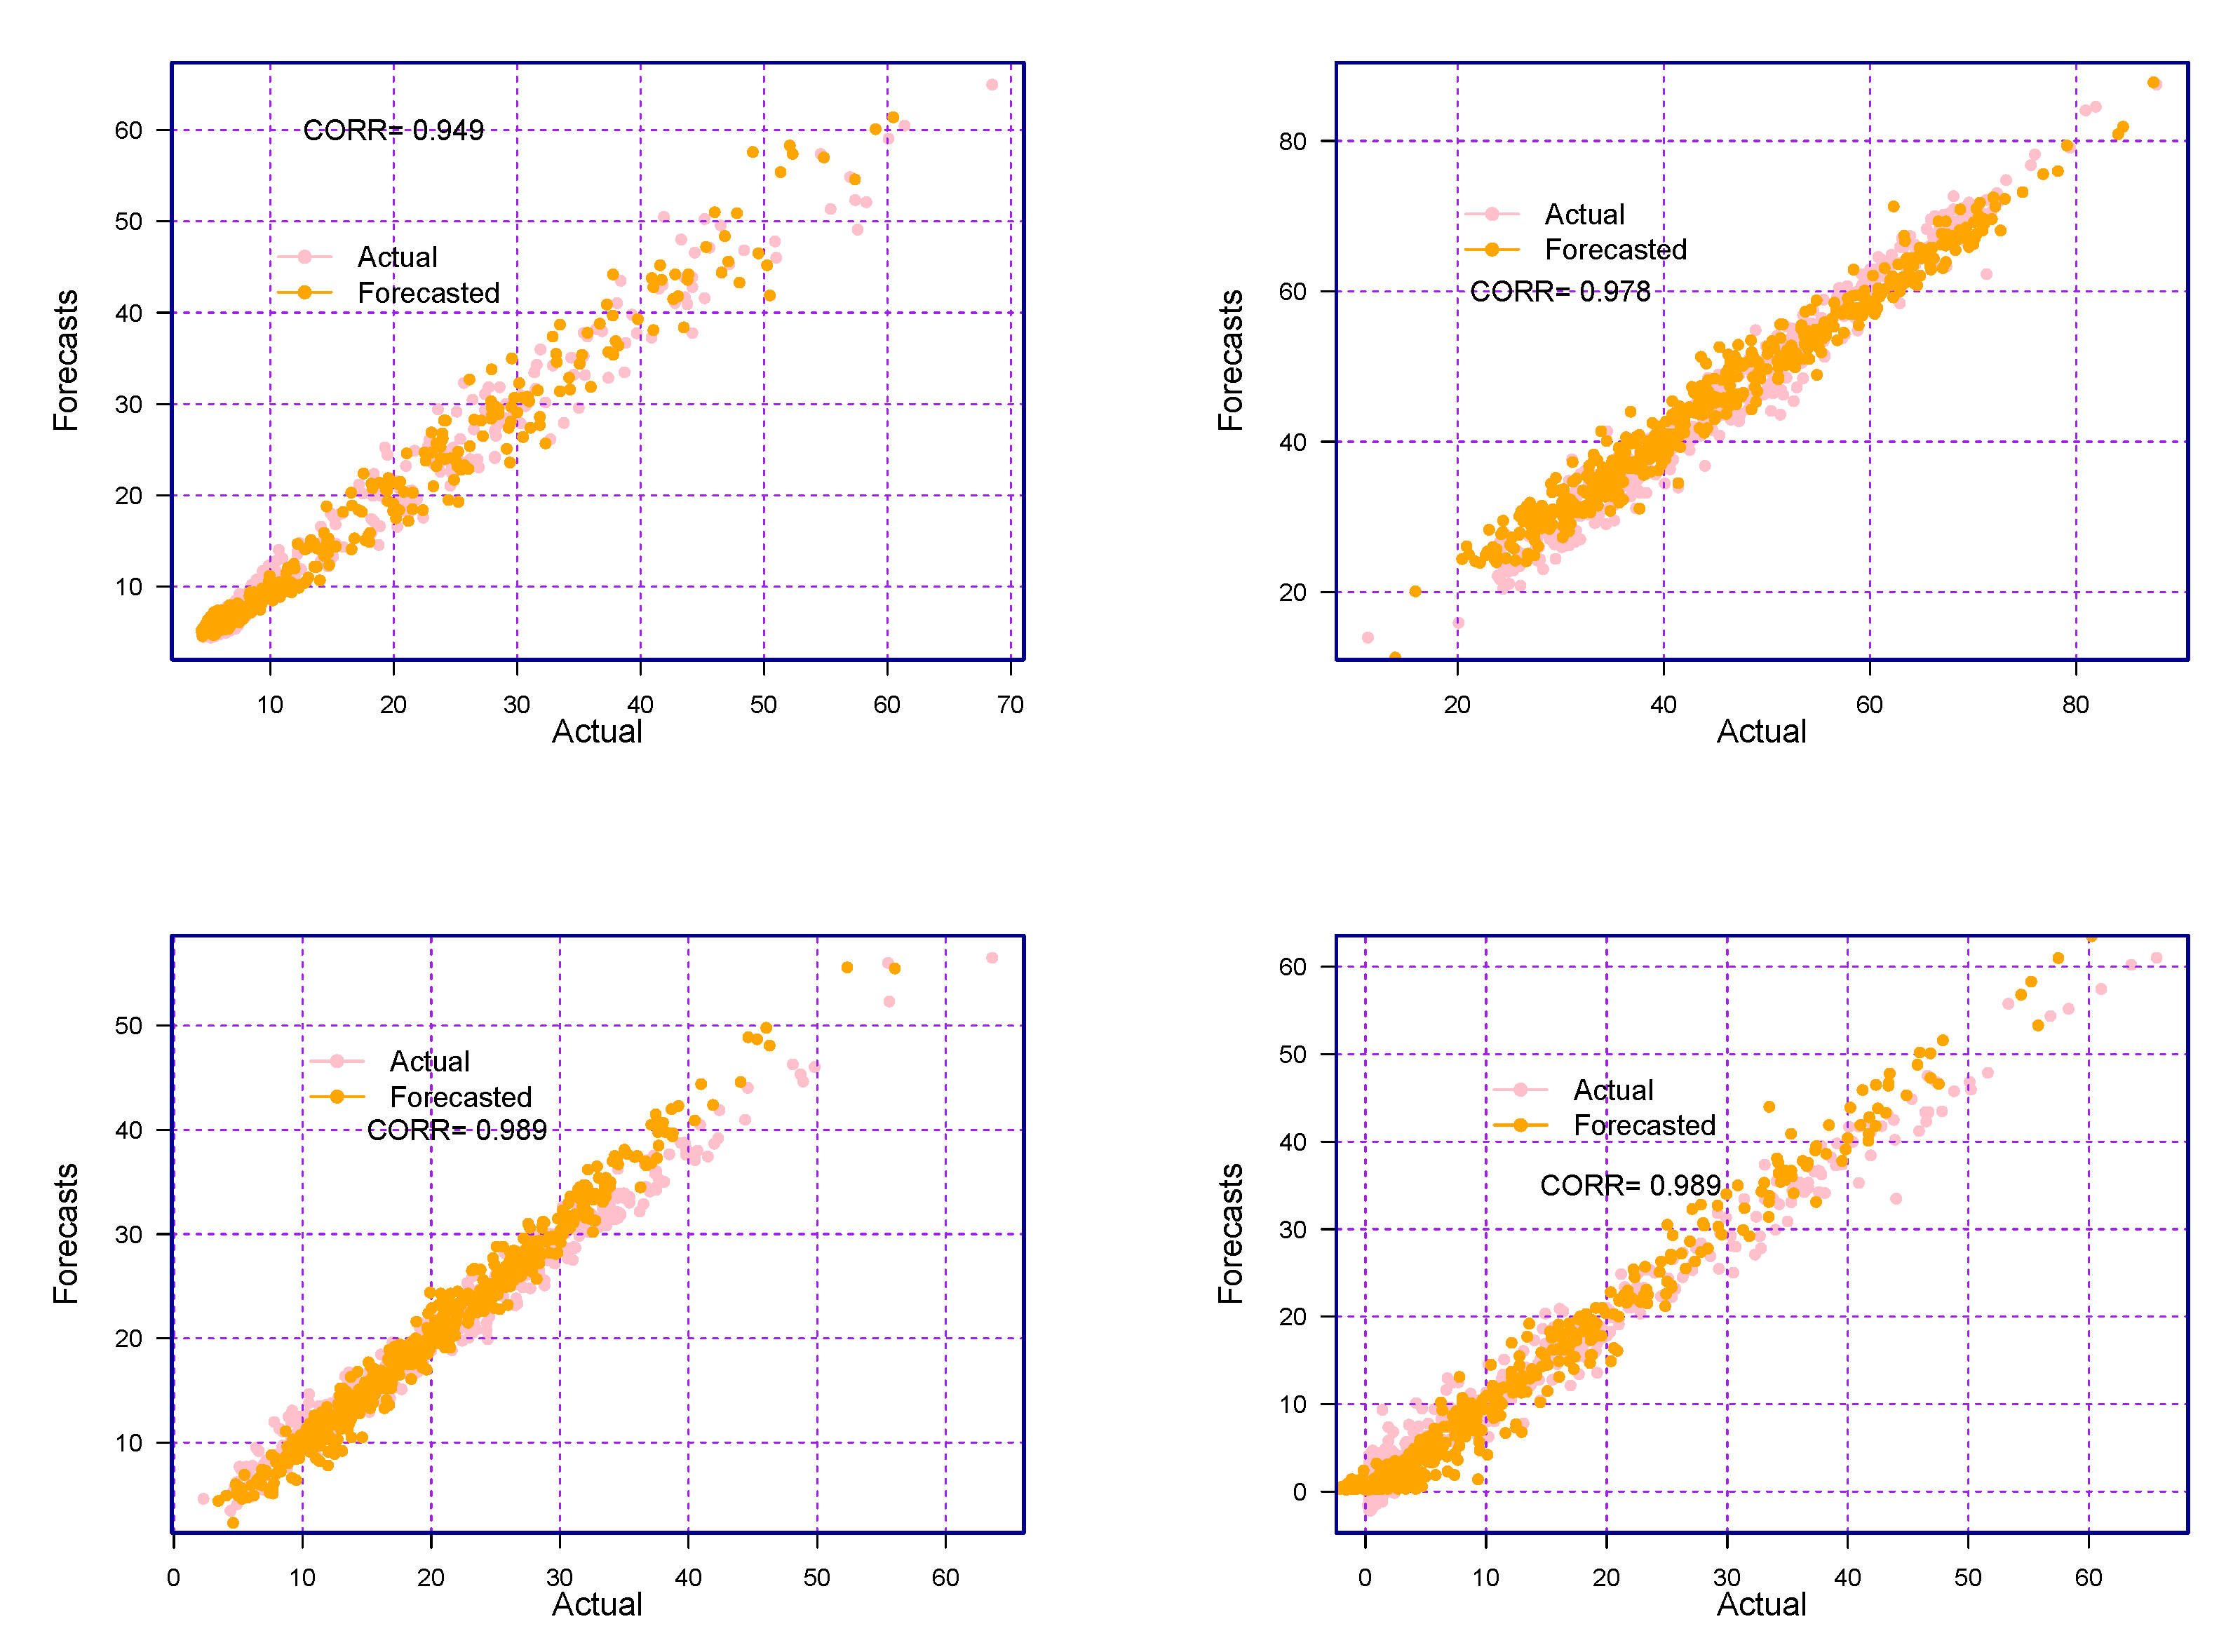
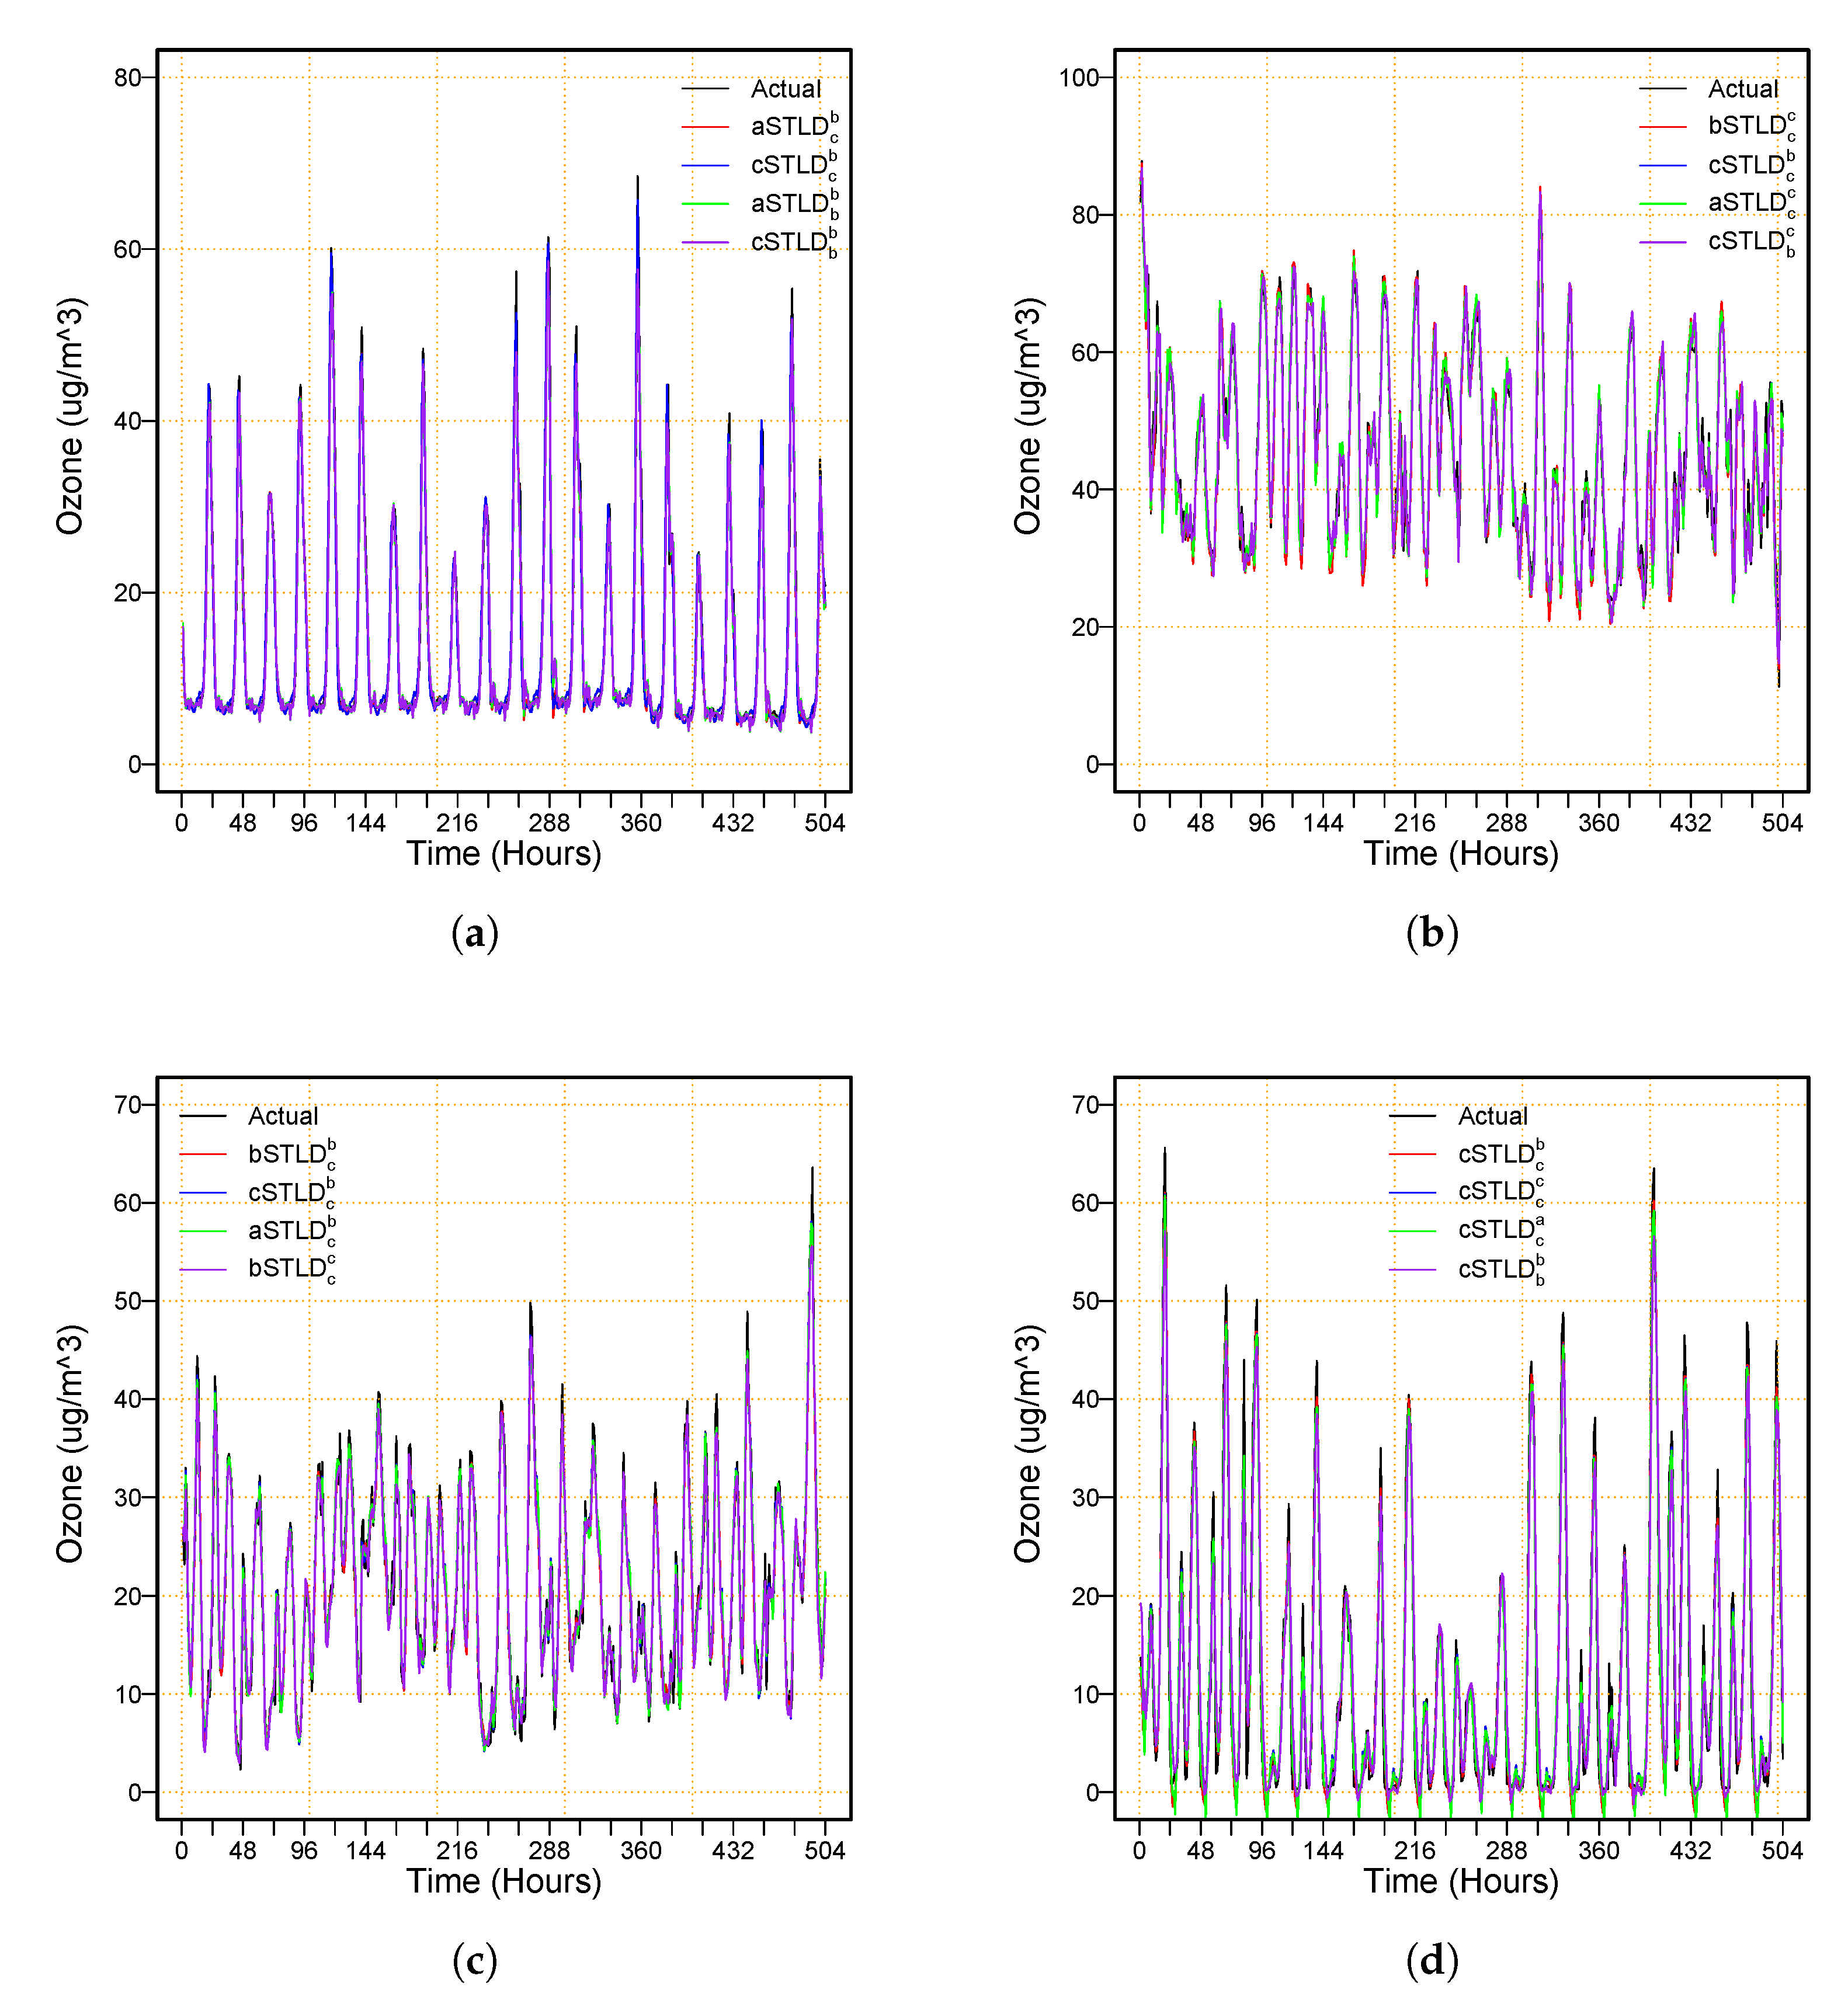
Once the proposed hybrid time series combination models’ performance was evaluated by accuracy performance measures (RMSPE, RMSE, MAE, MAPE, and CC) and a statistical test (the DM test), we then processed the models for graphic analysis. For instance, a graphical representation of mean errors (RMSE, RMSPE, MAE, and MAPE) for all twenty-seven models is shown in Figure 4a for the ATE station, Figure 4b for the CDM station, Figure 4c for the SB station, and Figure 4d for the STA station. From Figure 4a–d, we can see that within all twenty-seven models, the c STLD c b model in the ATE station, the c STLD c b model in the CDM station, the c STLD c b model in the SB station, the c STLD c b model in the STA station produce the highest accuracy measures (RMSE, RMSPE, MAE, and MAPE) in comparison to the rest of all combination models. On the other hand, from all twenty-seven models in each monitoring station, the best four hybrid combination models are selected for comparison and compared with other models in each station. The results of all these best hybrid combination models are plotted in Figure 5. For example, see the ATE station in Figure 5a, the CDM station in Figure 5b, the SB station in Figure 5c, and the STA station in Figure 5d It can be observed from these plots that the a STLD c b , a STLD c b , and a STLD c b show the least mean errors, respectively. In addition to the above, we plot the scatter diagrams for each station using their respective best model, which were obtained previously. For instance, Figure 6 displays the scatter plots for all considered monitoring stations. This figure showed that the best model produces greater correlation coefficient values, and it indicates that the correlation between forecast and actual ozone concentration values is highly significant. In the same way, the forecasted and observed values for the supermodel in each monitoring station are plotted in Figure 7. In Figure 7, forecasts of the best models follow the observed concentration of ozone very closely; from this, we can conclude that the supermodel in each considered station has accurate and efficient forecasts. Thus, from the descriptive statistical analysis, tests, and graphical results, we can conclude that the proposed hybrid combination of time series models is highly efficient and accurate in forecasting hourly ozone concentration.

4. Discussion

Finally, according to the results (descriptive statistical analysis, tests, and visual analysis), it is concluded that the final best models for forecasting hourly ozone concentration were the a STLD c b , the b STLD c c , the b STLD c b , and the c STLD c b for the ATE, the CDM, the SB, and the STA, respectively. However, to verify the superiority of these final best models, we compare them with some standard baseline time series models, including parametric autoregressive (PAR), nonparametric autoregressive (NPAR), and autoregressive integrated moving averages (ARIMA) models. For example, the comparative results are presented in Table 6 for all four monitoring stations. The results show that the considered baseline time series models are significantly outperformed by the best-proposed model in each station. In addition, to confirm the dominance of the best-proposed models given in Table 6 for each station, we performed a statistical DM test on each pair of models. The results (p-values) of the DM test are listed in Table 7, indicating that the baseline time series (PAR, NPAR, and ARIMA) models performed poorly in comparison to our best-proposed models in the considered stations at the 5% level of significance. To conclude, based on overall results, the performance measures of accuracy for the proposed methods of forecasting are comparatively better and more efficient than all other benchmark models in the competition.
In addition to the above, in the literature, Carbo-Bustinza [23] explored the correlations between ozone and meteorological variables and predicted ozone concentration for the same sites and winter periods selected in this study. They used models such as linear regression, support vector regression, decision trees, random forest, and multilayer perceptron and based their arguments on R 2 , MSE, and MAE. The linear model presented the highest prediction performance for all the places evaluated (R 2 : 0.9849–9923), supported by the lowest calculated errors (MAE: 0.0087–0.0724 and MSE: 0.0036–0.0087). Conversely, when the ozone concentration model is represented exclusively as a function of time as a relevant factor without considering meteorological factors, the decomposition methods have shown great performance, since in this investigation the significant models (p < 0.05; R 2 max: 0.949) with errors less than 20% (RMSE, RMSPE, MAE, MAPE) showed great performance. These errors have been comparable to other STL decomposition studies that used root mean square error (RMSE: 6.8%) and mean absolute percentage error (MAPE: 10.49%) as benchmarks for forecast reliability for ozone [10]. This evaluation of tropospheric ozone explains its long-term and seasonal behavior with temporary ozone patterns [41], in accordance with what was demonstrated by Carbo-Bustinza [23] for the winter months in these geographic areas. This approach has presented high precision and strong performance that allows for preventing serious tropospheric ozone pollution events and optimizing the powers of the authorities and actors involved in decision making, especially at the urban level.

5. Conclusions

An improved tool for forecasting ozone concentration has been proposed using hybrid combinations of time series models in four districts of Metropolitan Lima between the years 2017 and 2019. It was shown that the combination of the models through the decomposition of the series ozone temporal data into “long-term trend”, “seasonal”, and “stochastic” series, by the use of the seasonal trend decomposition method, produced efficient model performance. The combinations made of the autoregressive models, nonlinear autoregressive models, and autoregressive moving average models generated 27 combinations for each sampling station. They demonstrated significant forecasts of the sample based on highly accurate and efficient descriptive, statistical, and graphic analysis tests, as a lower mean error occurred in the optimized forecast models compared to traditional models. Thus, the best hybrid models for the ATE ( a STLD c b ), CDM ( b STLD c c ), SB ( b STLD c b ), and Santa Anita ( c STLD c b ) stations were presented because they showed the best forecast reflected in the measurement of RMSE, RMSPE, MAE, MAPE, and CC, which were very small compared to the other models. The confirmation of the best models was statistically significant (p < 0.05), being superior to the other models. The graphical representation of the mean errors (RMSE, RMSPE, MAE, MAPE, and CC) for the twenty-seven models at each sampling station presented a better precision for the supermodels compared to the rest of all the models combined. These statistical tests and graphical results show that the proposed forecast methodology is highly accurate and efficient in predicting hourly ozone concentration, which meant that the independent AR, NPAR, and ARIMA models were outperformed by our best models (p < 0.05).
The main drawback of this study is that it only provides hourly data on ozone concentration. It can be extended to include additional exogenous factors such as wind speed, temperature, wind direction, and humidity, which may improve the short-term forecast of ozone concentration. In addition, the current work uses only four district datasets in Lima, Peru. This can be extended to other districts of Lima (San Juan de Lurigancho, Chorrillos, Comas, San Juan de Miraflores, etc.) or to different regions of Peru (Huánuco, Coyhaique, Traiguén, Padre Las Casas, Santiago, etc.). It could also be extended to the world level (Mexico, China, Japan, Malaysia, Pakistan, etc.) to evaluate the performance of the proposed hybrid time series modeling and forecasting technique. Moreover, only univariate time series models were used in this study, which should be extended by machine learning models such as deep learning and artificial neural networks. They can also be considered in the current hybrid time series forecasting framework. It can also be extended and applied to other approaches and datasets (for example, energy [42,43,44], air pollution [45,46], solid waste [47], and academic performance [48]).

Author Contributions

Conceptualization, N.C.-B., H.I., M.B. and J.L.L.-G.; methodology, software, and validation, H.I.; formal analysis, H.I. and J.L.L.-G.; investigation, N.C.-B., H.I. and J.L.L.-G.; resources, N.C.-B., H.I., M.B., R.J.C.-T. and J.L.L.-G.; data curation, N.C.-B., H.I. and J.L.L.-G.; writing—original draft preparation, N.C.-B., H.I., M.B., R.J.C.-T., A.R.H.D.L.C. and J.L.L.-G.; writing—review and editing, N.C.-B., H.I., M.B., R.J.C.-T., A.R.H.D.L.C. and J.L.L.-G.; visualization, N.C.-B., M.B., H.I. and J.L.L.-G.; supervision, M.B. and J.L.L.-G.; project administration, H.I., M.B. and J.L.L.-G.; funding acquisition, M.B. and R.J.C.-T. All authors have read and agreed to the published version of the manuscript.

Funding

This research received no external funding.

Institutional Review Board Statement

Not applicable.

Informed Consent Statement

Not applicable.

Data Availability Statement

The collection and statistical processing of the data was carried out under the authorization of Servicio Nacional de Meteorología e Hidrología del Perú, a specialized technical agency of the Peruvian State that provides information on weather forecasting, as well as scientific studies in the areas of hydrology, meteorology, and environmental issues. The datasets are available in the repository, https://www.senamhi.gob.pe/site/descarga-datos/ (accessed on 21 July 2022).

Acknowledgments

The authors would like to thank the “INVESTIGA UCV” Teaching Research Support Fund of the Universidad César Vallejo for the financial support for the publication of this research.

Conflicts of Interest

The authors declare no conflict of interest.

References

  1. Wang, T.; Xue, L.; Feng, Z.; Dai, J.; Zhang, Y.; Tan, Y. Ground-level ozone pollution in China: A synthesis of recent findings on influencing factors and impacts. Environ. Res. Lett. 2022, 17, 063003. [Google Scholar] [CrossRef]
  2. Feng, Z.; Xu, Y.; Kobayashi, K.; Dai, L.; Zhang, T.; Agathokleous, E.; Calatayud, V.; Paoletti, E.; Mukherjee, A.; Agrawal, M.; et al. Ozone pollution threatens the production of major staple crops in East Asia. Nat. Food 2022, 3, 47–56. [Google Scholar] [CrossRef] [PubMed]
  3. Jiang, Y.; Huang, J.; Li, G.; Wang, W.; Wang, K.; Wang, J.; Wei, C.; Li, Y.; Deng, F.; Baccarelli, A.A.; et al. Ozone pollution and hospital admissions for cardiovascular events. Eur. Heart J. 2023, 44, 1622–1632. [Google Scholar] [CrossRef]
  4. Lei, Y.; Yue, X.; Liao, H.; Zhang, L.; Zhou, H.; Tian, C.; Gong, C.; Ma, Y.; Cao, Y.; Seco, R.; et al. Global perspective of drought impacts on ozone pollution episodes. Environ. Sci. Technol. 2022, 56, 3932–3940. [Google Scholar] [CrossRef] [PubMed]
  5. Cabello-Torres, R.J.; Estela, M.A.P.; Sánchez-Ccoyllo, O.; Romero-Cabello, E.A.; Ávila, F.F.G.; Castañeda-Olivera, C.A.; Valdiviezo-Gonzales, L.; Eulogio, C.E.Q.; De La Cruz, A.R.H.; López-Gonzales, J.L. Statistical modeling approach for pm10 prediction before and during confinement by COVID-19 in South Lima, Perú. Sci. Rep. 2022, 12, 16737. [Google Scholar] [CrossRef] [PubMed]
  6. Ding, J.; Dai, Q.; Fan, W.; Lu, M.; Zhang, Y.; Han, S.; Feng, Y. Impacts of meteorology and precursor emission change on O3 variation in Tianjin, China from 2015 to 2021. J. Environ. Sci. 2023, 126, 506–516. [Google Scholar] [CrossRef] [PubMed]
  7. Wu, Q.; Lin, H. A novel optimal-hybrid model for daily air quality index prediction considering air pollutant factors. Sci. Total Environ. 2019, 683, 808–821. [Google Scholar] [CrossRef]
  8. Fu, H.; Zhang, Y.; Liao, C.; Mao, L.; Wang, Z.; Hong, N. Investigating PM 2.5 responses to other air pollutants and meteorological factors across multiple temporal scales. Sci. Rep. 2020, 10, 15639. [Google Scholar] [CrossRef]
  9. Ewusie, J.E.; Soobiah, C.; Blondal, E.; Beyene, J.; Thabane, L.; Hamid, J.S. Methods, applications and challenges in the analysis of interrupted time series data: A scoping review. J. Multidiscip. Healthc. 2020, 13, 411–423. [Google Scholar] [CrossRef]
  10. Li, W.; Jiang, X. Prediction of air pollutant concentrations based on TCN-BiLSTM-DMAttention with STL decomposition. Sci. Rep. 2023, 13, 4665. [Google Scholar] [CrossRef]
  11. Tudor, C. Ozone pollution in London and Edinburgh: Spatiotemporal characteristics, trends, transport and the impact of COVID-19 control measures. Heliyon 2022, 8, e11384. [Google Scholar] [CrossRef]
  12. Hong, J.; Wang, W.; Bai, Z.; Bian, J.; Tao, M.; Konopka, P.; Ploeger, F.; Müller, R.; Wang, H.; Zhang, J.; et al. The Long-Term Trends and Interannual Variability in Surface Ozone Levels in Beijing from 1995 to 2020. Remote Sens. 2022, 14, 5726. [Google Scholar] [CrossRef]
  13. Chang, S.W.; Chang, C.L.; Li, L.T.; Liao, S.W. Reinforcement learning for improving the accuracy of pm 2.5 pollution forecast under the neural network framework. IEEE Access 2019, 8, 9864–9874. [Google Scholar] [CrossRef]
  14. Gemst, M.V. Forecasting Stock Index Volatility—A Comparison of Models. Ph.D. Thesis, Universidade Nova de Lisboa, Lisbon, Portugal, 2020. [Google Scholar]
  15. Iftikhar, H.; Bibi, N.; Canas Rodrigues, P.; López-Gonzales, J.L. Multiple Novel Decomposition Techniques for Time Series Forecasting: Application to Monthly Forecasting of Electricity Consumption in Pakistan. Energies 2023, 16, 2579. [Google Scholar] [CrossRef]
  16. Iftikhar, H.; Turpo-Chaparro, J.E.; Canas Rodrigues, P.; López-Gonzales, J.L. Forecasting Day-Ahead Electricity Prices for the Italian Electricity Market Using a New Decomposition—Combination Technique. Energies 2022, 15, 3607. [Google Scholar] [CrossRef]
  17. Ghoneim, O.A.; Manjunatha, B.R. Forecasting of ozone concentration in smart city using deep learning. In Proceedings of the 2017 International Conference on Advances in Computing, Communications and Informatics (ICACCI), Udupi, India, 13–16 September 2017; pp. 1320–1326. [Google Scholar]
  18. Juarez, E.K.; Petersen, M.R. A comparison of machine learning methods to forecast tropospheric ozone levels in Delhi. Atmosphere 2021, 13, 46. [Google Scholar] [CrossRef]
  19. Chaloulakou, A.; Saisana, M.; Spyrellis, N. Comparative assessment of neural networks and regression models for forecasting summertime ozone in Athens. Sci. Total Environ. 2003, 313, 1–13. [Google Scholar] [CrossRef]
  20. Borhani, F.; Ehsani, A.H.; Hosseini Shekarabi, H.S. Prediction and spatiotemporal analysis of atmospheric Fine Particles and their effect on temperature and vegetation cover in Iran using Exponential Smoothing approach in Python. J. Nat. Environ. 2023, 76, 325–344. [Google Scholar]
  21. Tang, H.; Bhatti, U.A.; Li, J.; Marjan, S.; Baryalai, M.; Assam, M.; Ghadi, Y.Y.; Mohamed, H.G. A New Hybrid Forecasting Model Based on Dual Series Decomposition with Long-Term Short-Term Memory. Int. J. Intell. Syst. 2023, 2023, 9407104. [Google Scholar] [CrossRef]
  22. Romero, Y.; Diaz, C.; Meldrum, I.; Velasquez, R.A.; Noel, J. Temporal and spatial analysis of traffic–Related pollutant under the influence of the seasonality and meteorological variables over an urban city in Peru. Heliyon 2020, 6, e04029. [Google Scholar] [CrossRef]
  23. Carbo-Bustinza, N.; Belmonte, M.; Jimenez, V.; Montalban, P.; Rivera, M.; Martínez, F.G.; Mohamed, M.M.H.; De La Cruz, A.R.H.; da Costa, K.; López-Gonzales, J.L. A machine learning approach to analyse ozone concentration in metropolitan area of Lima, Peru. Sci. Rep. 2022, 12, 22084. [Google Scholar] [CrossRef] [PubMed]
  24. Leon, C.A.M.; Felix, M.F.M.; Olivera, C.A.C. Influence of Social Confinement by COVID-19 on Air Quality in the District of San Juan de Lurigancho in Lima, Perù. Chem. Eng. Trans. 2022, 91, 475–480. [Google Scholar]
  25. Van Buuren, S.; Oudshoorn, C.G. Multivariate Imputation by Chained Equations; Netherlands Organization for Applied Scientific Research (TNO): The Hague, The Netherlands, 2000. [Google Scholar]
  26. Cleveland, R.B.; Cleveland, W.S.; McRae, J.E.; Terpenning, I. STL: A seasonal-trend decomposition. J. Off. Stat. 1990, 6, 3–73. [Google Scholar]
  27. Iftikhar, H.; Zafar, A.; Turpo-Chaparro, J.E.; Canas Rodrigues, P.; López-Gonzales, J.L. Forecasting Day-Ahead Brent Crude Oil Prices Using Hybrid Combinations of Time Series Models. Mathematics 2023, 11, 3548. [Google Scholar] [CrossRef]
  28. Iftikhar, H.; Turpo-Chaparro, J.E.; Canas Rodrigues, P.; López-Gonzales, J.L. Day-Ahead Electricity Demand Forecasting Using a Novel Decomposition Combination Method. Energies 2023, 16, 6675. [Google Scholar] [CrossRef]
  29. Davis, P.J.B.R.A. Introduction to Time Series and Forecasting; Springer: Berlin/Heidelberg, Germany, 2016. [Google Scholar]
  30. Wasserman, L. All of Nonparametric Statistics; Springer Science & Business Media: Berlin/Heidelberg, Germany, 2006. [Google Scholar]
  31. Hyndman, R.J.; Athanasopoulos, G. Forecasting: Principles and Practice; OTexts: Melbourne, Australia, 2018. [Google Scholar]
  32. Iftikhar, H. Modeling and Forecasting Complex Time Series: A Case of Electricity Demand. Master’s, Thesis, Quaid-i-Azam University, Islamabad, Pakistan, 2018. Available online: https://www.researchgate.net/publication/372103958_Modeling_and_Forecasting_Complex_Time_Series_A_Case_of_Electricity_Demand (accessed on 28 July 2023).
  33. Shah, I.; Iftikhar, H.; Ali, S.; Wang, D. Short-Term Electricity Demand Forecasting Using Components Estimation Technique. Energies 2019, 12, 2532. [Google Scholar] [CrossRef]
  34. Shah, I.; Iftikhar, H.; Ali, S. Modeling and Forecasting Medium-Term Electricity Consumption Using Component Estimation Technique. Forecasting 2020, 2, 9. [Google Scholar] [CrossRef]
  35. Shah, I.; Iftikhar, H.; Ali, S. Modeling and Forecasting Electricity Demand and Prices: A Comparison of Alternative Approaches. J. Math. 2022, 2022, 3581037. [Google Scholar] [CrossRef]
  36. Diebold, F.; Mariano, R. Comparing predictive accuracy. J. Bus. Econ. Stat. 1995, 13, 253–263. [Google Scholar]
  37. Iftikhar, H.; Khan, M.; Khan, Z.; Khan, F.; Alshanbari, H.M.; Ahmad, Z. A Comparative Analysis of Machine Learning Models: A Case Study in Predicting Chronic Kidney Disease. Sustainability 2023, 15, 2754. [Google Scholar] [CrossRef]
  38. Iftikhar, H.; Khan, M.; Khan, M.S.; Khan, M. Short-Term Forecasting of Monkeypox Cases Using a Novel Filtering and Combining Technique. Diagnostics 2023, 13, 1923. [Google Scholar] [CrossRef] [PubMed]
  39. Alshanbari, H.M.; Iftikhar, H.; Khan, F.; Rind, M.; Ahmad, Z.; El-Bagoury, A.A.A.H. On the Implementation of the Artificial Neural Network Approach for Forecasting Different Healthcare Events. Diagnostics 2023, 13, 1310. [Google Scholar] [CrossRef] [PubMed]
  40. Dickey, D.A.; Fuller, W.A. Distribution of the estimators for autoregressive time series with a unit root. J. Am. Stat. Assoc. 1979, 74, 427–431. [Google Scholar] [CrossRef]
  41. Kawano, N.; Nagashima, T.; Sugata, S. Changes in the seasonal cycle of surface ozone over Japan during 1980–2015. Atmos. Environ. 2022, 279, 119108. [Google Scholar] [CrossRef]
  42. Leite Coelho da Silva, F.; da Costa, K.; Canas Rodrigues, P.; Salas, R.; López-Gonzales, J.L. Statistical and artificial neural networks models for electricity consumption forecasting in the Brazilian industrial sector. Energies 2022, 15, 588. [Google Scholar] [CrossRef]
  43. Gonzales, J.L.L.; Calili, R.F.; Souza, R.C.; Coelho da Silva, F.L. Simulation of the energy efficiency auction prices in Brazil. Renew. Energy Power Qual. J. 2016, 1, 574–579. [Google Scholar] [CrossRef]
  44. López-Gonzales, J.L.; Castro Souza, R.; Leite Coelho da Silva, F.; Carbo-Bustinza, N.; Ibacache-Pulgar, G.; Calili, R.F. Simulation of the Energy Efficiency Auction Prices via the Markov Chain Monte Carlo Method. Energies 2020, 13, 4544. [Google Scholar] [CrossRef]
  45. da Silva, K.L.S.; López-Gonzales, J.L.; Turpo-Chaparro, J.E.; Tocto-Cano, E.; Rodrigues, P.C. Spatio-temporal visualization and forecasting of PM 10 in the Brazilian state of Minas Gerais. Sci. Rep. 2023, 13, 3269. [Google Scholar] [CrossRef]
  46. Jeldes, N.; Ibacache-Pulgar, G.; Marchant, C.; López-Gonzales, J.L. Modeling air pollution using partially varying coefficient models with heavy tails. Mathematics 2022, 10, 3677. [Google Scholar] [CrossRef]
  47. Quispe, K.; Martínez, M.; da Costa, K.; Romero Giron, H.; Via y Rada Vittes, J.F.; Mantari Mincami, L.D.; Hadi Mohamed, M.M.; Huamán De La Cruz, A.R.; López-Gonzales, J.L. Solid Waste Management in Peru’s Cities: A Clustering Approach for an Andean District. Appl. Sci. 2023, 13, 1646. [Google Scholar] [CrossRef]
  48. Orrego Granados, D.; Ugalde, J.; Salas, R.; Torres, R.; López-Gonzales, J.L. Visual-Predictive Data Analysis Approach for the Academic Performance of Students from a Peruvian University. Appl. Sci. 2022, 12, 11251. [Google Scholar] [CrossRef]
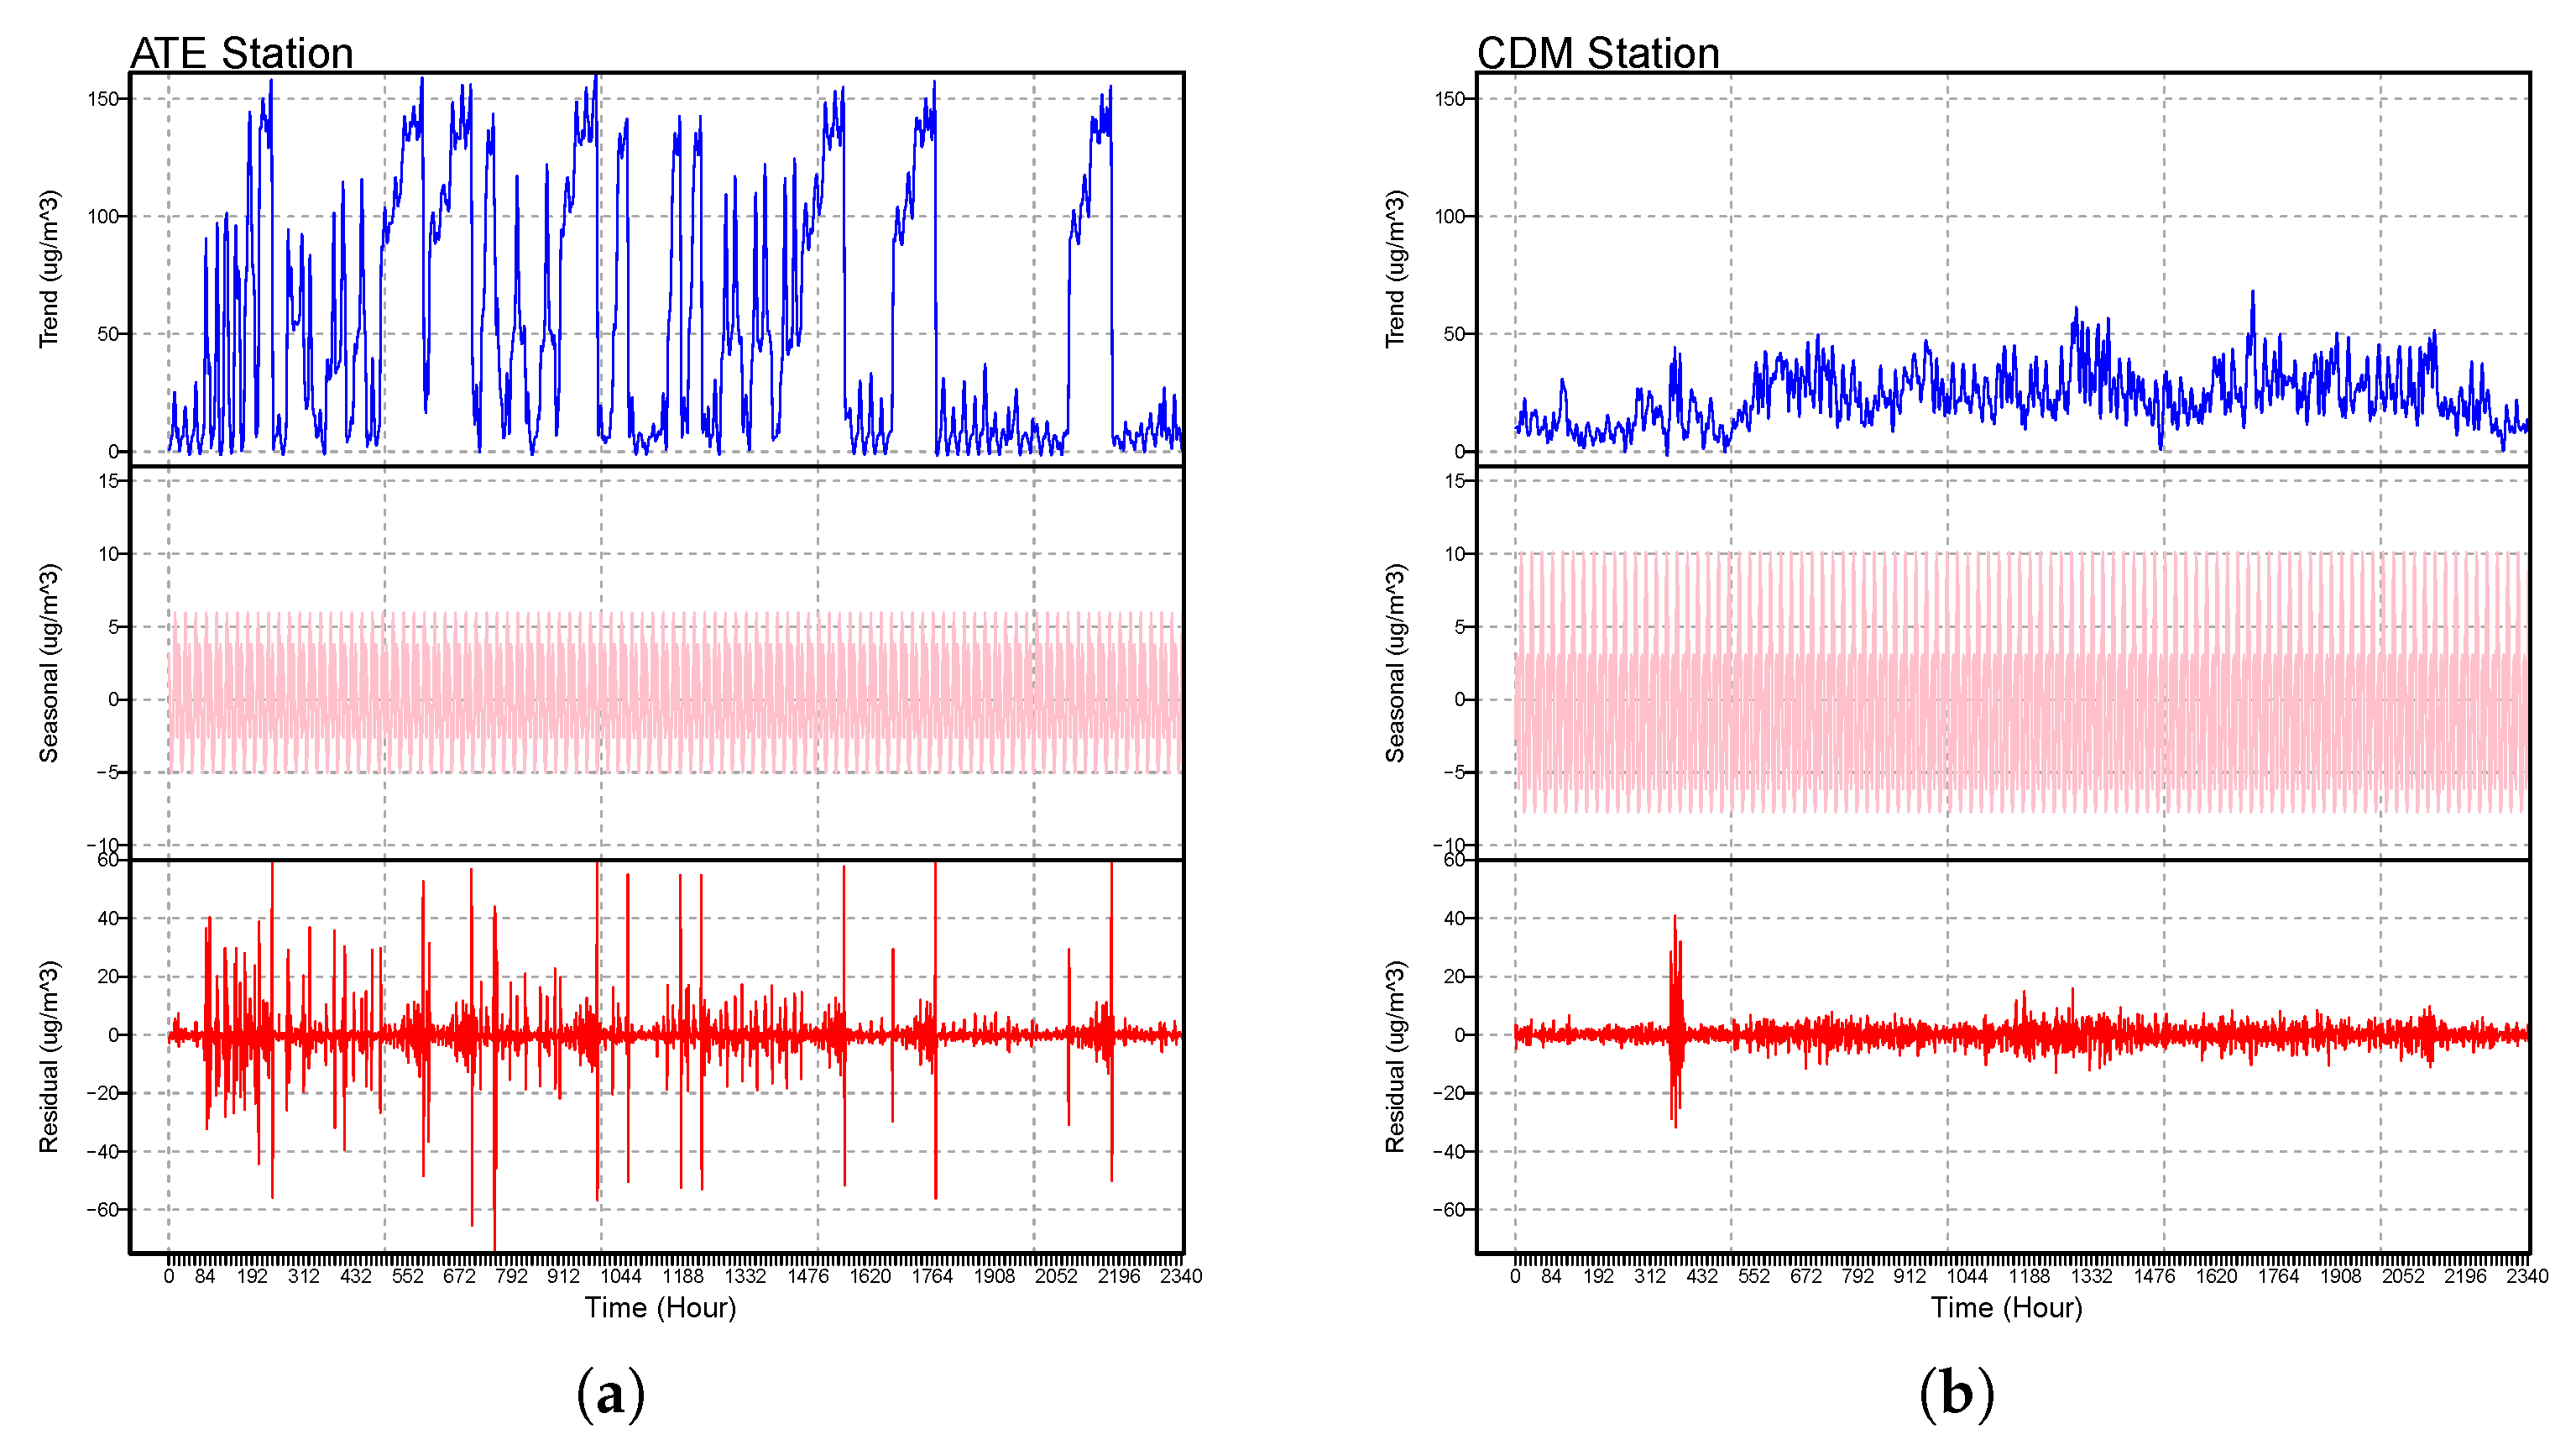
Figure 1. Ozone concentration in the metropolitan area of Lima (µ g / m 3 ): the hourly ozone concentration of the decomposed time series by the STLD method; ATE (a), Campo de Marte (b), San Borja (c), and Santa Anita (d), in each sub-figure, the top panel shows the long-run trend ( l n ), the middle shows the seasonal ( h n ) component, and the bottom shows the residual ( r n ) component over a year.
Applsci 13 10514 g001aApplsci 13 10514 g001b
Figure 2. A flowchart of the proposed forecasting methodology.
Applsci 13 10514 g002
Figure 3. Ozone concentration in the metropolitan area of Lima (µ g / m 3 ): the hourly ozone concentration time series for ATE (1st panel), Campo de Marte (2nd panel), San Borja (3rd panel), and Santa Anita (4th panel).
Applsci 13 10514 g003
Figure 4. Ozone concentration (µ g / m 3 ) in four Metropolitan Lima stations: (a) ATE, (b) Campo de Marte, (c) San Borja, and (d) Santa Anita; the RMSPE (1st panel), MAPE (2nd panel), MAE (3rd panel), and RMSE (4th panel) for all twenty-seven combination models using the proposed forecasting methodology.
Applsci 13 10514 g004
Figure 5. Ozone concentration in four Metropolitan Lima stations (µ g / m 3 ): (a) Ate, (b) Campo de Marte, (c) San Borja, and (d) Santa Anita evaluation measures; the barplot for the best four models among all twenty-seven models.
Applsci 13 10514 g005aApplsci 13 10514 g005b
Figure 6. Correlation plots for the ozone concentration (µ g / m 3 ) in all four Metropolitan Lima stations using their respective best hybrid models, including (1st) ATE ( a STLD c b ), (2nd) Campo de Marte ( b STLD c c ), (3rd), San Borja ( b STLD c b ), and (4th) Santa Anita ( c STLD c b ).
Applsci 13 10514 g006
Figure 7. Ozone concentration in four Metropolitan Lima stations (µ g / m 3 ): (a) Ate, (b) Campo de Marte, (c) San Borja, and (d) Santa Anita: actual and forecasted ozone concentration values for four of the best models over three weeks.
Applsci 13 10514 g007
Table 1. This table is based on 6768 observations taken throughout the winter season encompassing three years (2017, 2018, and 2019). It includes the percentage of imputation for each monitoring site.
StationATECDMSBSTA
Total hours6768676867686768
Available hours6654663466146613
Imputed hours114134154155
Imputed%1.68%1.98%2.27%2.29%
Note: Campo de Marte (CDM), San Borja (SB), and Santa Anita (STA).
Table 2. This table contains descriptive statistics for the time series of ozone concentration and the logarithmic time series of the ozone concentration for all considered monitoring stations.
MeasureMinQ1MedianMeanModeVarS.DSkewnessKurtosisQ3MaxADF (Statistic)
ATE0.805.508.5028.365.201606.0840.081.892.3029.30165.80−8.61
log(ATE)−0.221.702.142.551.651.501.230.49−0.543.385.11−8.70
CDM0.808.9824.5028.131.00454.0221.310.53−0.6744.03117.10−6.03
log(CDM)−0.222.193.202.860.001.371.17−0.89−0.193.784.76−6.53
SB0.208.3015.1017.096.50122.0511.050.830.5124.0083.90−13.02
log(SB)−1.612.122.712.561.870.780.88−1.463.383.184.43−10.35
STA0.101.806.2010.560.40149.0912.211.945.5414.80152.60−16.17
log(STA)−2.300.591.821.59−0.922.021.42−0.44−0.612.695.03−14.38
Table 3. Ozone concentration in four Metropolitan Lima stations (µ g / m 3 ): out-of-sample one-hour ahead mean forecast error for all models combined with the STL decomposition method.
StationATECampo de MarteSan BorjaSanta Anita
S.NoModelsRMSERMSPEMAEMAPECCRMSERMSPEMAEMAPECCRMSERMSPEMAEMAPECCRMSERMSPEMAEMAPECC
1 a STLD a a 5.5295.4142.20920.8270.9325.07316.533.32925.7350.9572.1152.6001.58711.2170.9755.27940.4643.958196.4060.916
2 a STLD b a 5.6994.8282.07618.0050.9215.14516.4063.35424.9080.9552.0812.4171.54710.8170.9765.33840.0703.959188.5680.913
3 a STLD c a 4.6754.6281.91318.2570.9473.99312.1172.71922.960.9731.8181.8541.3769.7680.9823.95833.2642.965158.5430.954
4 a STLD a b 5.4104.9761.95017.5620.9374.88916.4743.13625.1960.961.9742.4971.44810.2790.9795.22436.7863.878179.8230.917
5 a STLD b b 5.6224.9061.87116.0810.9234.92116.3363.10824.1180.9591.9732.3331.43910.1740.9795.31036.9723.907172.3800.914
6 a STLD c b 4.6114.4641.71114.8620.9493.77411.892.50421.2930.9761.5351.6441.1187.7930.9873.90930.3572.937148.2900.955
7 a STLD a c 5.5295.4142.20920.8270.9324.71716.4742.84826.2530.9632.1152.6001.58711.2170.9755.27740.4313.959197.4070.916
8 a STLD b c 5.6994.8282.07618.0050.9214.68516.2712.76424.6230.9632.0812.4171.54710.8170.9765.33740.0713.963190.2190.913
9 a STLD c c 4.6754.6281.91318.2580.9473.74611.682.45820.8820.9761.8181.8541.3769.7670.9823.95833.3652.970159.5310.954
10 b STLD a a 5.6075.3132.27721.0150.9335.48516.9573.69726.8170.9492.2132.8721.66411.7930.9745.31941.2633.977199.4870.915
11 b STLD b a 5.7304.8452.06717.8300.9225.57916.8453.77626.4810.9472.2312.7111.68011.8190.9735.37540.7693.979191.4340.912
12 b STLD c a 4.7094.6832.03319.6010.9474.18712.4642.98424.150.9711.7212.0211.3019.2930.9853.99133.7422.979160.3680.953
13 b STLD a b 5.5094.8952.04717.7700.9375.24716.8593.45826.0890.9542.1322.8031.59711.3840.9765.25737.4403.894182.8650.916
14 b STLD b b 5.6724.9511.90916.1430.9245.30516.7333.50725.4460.9522.1822.6611.64311.6710.9755.33937.5063.927175.4240.913
15 b STLD c b 4.6694.5521.89316.7990.9493.88612.1832.68722.1630.9751.4951.8641.0787.6680.9893.93330.6072.941148.4800.954
16 b STLD a c 5.6075.3132.27721.0150.9334.92116.7642.97926.3530.9592.2132.8721.66411.7930.9745.31741.2313.978200.4330.915
17 b STLD b c 5.7304.8452.06717.8300.9224.92116.5752.99525.1190.9592.2312.7111.68011.8200.9735.37440.7713.984193.1410.912
18 b STLD c c 4.7094.6832.03319.6010.9473.63711.8462.35620.4410.9781.7212.0211.3019.2930.9853.99133.8432.985161.5760.953
19 c STLD a a 5.5455.5812.19720.7970.9325.09216.5443.3425.7320.9562.1242.5061.60611.3220.9753.26725.6242.460125.7320.973
20 c STLD b a 5.6784.7532.08117.9640.9225.16616.423.36324.8980.9552.0752.3161.55410.8210.9763.28925.4722.435117.3380.971
21 c STLD c a 4.7004.6591.90018.2660.9464.01312.1342.7322.9650.9731.8581.8071.42110.1630.9812.14319.6691.60389.3670.988
22 c STLD a b 5.4275.1431.94017.5350.9364.90916.4873.14625.1990.961.9652.3841.44110.0900.9793.12520.5932.27799.4200.975
23 c STLD b b 5.6014.8171.88216.1790.9244.94216.353.11824.1280.9591.9472.2121.4159.8690.9793.19021.4902.29895.0630.972
24 c STLD c b 4.6364.4801.70414.9850.9483.79411.9062.51421.3230.9761.5591.5681.1367.8970.9871.96915.9241.46276.2610.989
25 c STLD a c 5.5455.5812.19720.7970.9324.73416.4812.85526.2040.9622.1242.5061.60611.3220.9753.26225.6372.460126.3060.973
26 c STLD b c 5.6784.7532.08117.9630.9224.70416.282.77124.5760.9632.0752.3161.55410.8210.9763.28625.5402.432116.8420.971
27 c STLD c c 4.7004.6591.90018.2670.9463.76211.6892.46420.8470.9761.8581.8071.42110.1630.9812.14119.9251.60588.9580.988
Table 4. Ozone concentration in four Metropolitan Lima stations (µ g / m 3 ): mean forecast error of one-hour-ahead post-sample for the best four models among all twenty-seven models.
ATE Station
ModelsRMSERMSPEMAEMAPECC
a STLD c b 4.6114.4641.71114.8620.949
c STLD c b 4.6364.4801.70414.9850.948
c STLD b b 5.6014.8171.88216.1790.924
a STLD b b 5.6224.9061.87116.0810.923
Campo de Marte Station
ModelsRMSERMSPEMAEMAPECC
b STLD c c 3.63711.8462.35620.4410.978
c STLD c c 3.76211.6892.46420.8470.976
a STLD c c 3.74611.682.45820.8820.976
c STLD c b 3.79411.9062.51421.3230.976
San Borja Station
ModelsRMSERMSPEMAEMAPECC
b STLD c b 1.4951.8641.0787.6680.989
c STLD c c 1.5591.5681.1367.8970.987
a STLD c b 1.5351.6441.1187.7930.987
b STLD c c 1.7212.0211.3019.2930.985
Santa Anita Station
ModelsRMSERMSPEMAEMAPECC
c STLD c b 1.96915.9241.46276.2610.989
c STLD c c 2.14119.9251.60588.9580.988
c STLD c a 2.14319.6691.60389.3670.988
c STLD b b 3.19021.4902.29895.0630.972
Table 5. Ozone concentration in four Metropolitan Lima stations (µ g / m 3 ): results (p-value) of the DM test for the best four models given in Table 4.
ATE Station
Models a STLD c b c STLD c c c STLD c b a STLD b b
a STLD c b -0.2290.9880.992
c STLD c c 0.771-0.9910.993
c STLD b b 0.0120.009-0.332
a STLD b b 0.0080.0070.668-
Campo de Marte Station
Models b STLD c c c STLD c c a STLD c c c STLD c b
b STLD c c -0.9650.9440.963
c STLD c c 0.036-0.0000.716
a STLD c c 0.0561.000-0.806
c STLD c b 0.0370.2840.194-
San Borja Station
Models b STLD c b c STLD c b a STLD c b b STLD c c
b STLD c b -0.9890.9451.000
c STLD c b 0.011-0.0051.000
a STLD c b 0.0550.996-1.000
b STLD c c 0.0000.0000.000-
Santa Anita Station
Models b STLD c b c STLD c b a STLD c b b STLD c c
b STLD c b -1.0001.0001.000
c STLD c b 0.000-0.7041.000
a STLD c b 0.0000.296-1.000
b STLD c c 0.0000.0000.000-
Table 6. Ozone concentration in four Metropolitan Lima stations (µ g / m 3 ): mean accuracy measures of the proposed versus the baseline models.
ATE Station
ModelsRMSERMSPEMAEMAPECC
a STLD c b 4.6114.4641.71114.8620.949
PAR5.6075.3132.27721.0150.933
NPAR5.7304.8452.06717.8300.922
ARIMA4.7094.6832.03319.6010.947
Campo de Marte Station
ModelsRMSERMSPEMAEMAPECC
b STLD c c 3.63711.8462.35620.4410.978
PAR5.48516.9573.69726.8170.949
NPAR5.57916.8453.77626.4810.947
ARIMA4.18712.4642.98424.1500.971
San Borja Station
ModelsRMSERMSPEMAEMAPECC
b STLD c b 1.4951.8641.0787.6680.989
PAR2.2132.8721.66411.7930.974
NPAR2.2312.7111.68011.8190.973
ARIMA1.7212.0211.3019.2930.985
Santa Anita Station
ModelsRMSERMSPEMAEMAPECC
c STLD c b 1.96915.9241.46276.2610.989
PAR5.31941.2633.977199.4870.915
NPAR5.37540.7693.979191.4340.912
ARIMA3.99133.7422.979160.3680.953
Table 7. Ozone concentration in four Metropolitan Lima stations (µ g / m 3 ): results (p-value) of the DM test for the final best-proposed model versus the baseline models given in Table 6.
ATE Station
Models a STLD c b PARNPARARIMA
a STLD c b -0.9990.9950.927
PAR0.001-0.6620.001
NPAR0.0050.338-0.006
ARIMA0.0730.9990.995-
Campo de Marte Station
Models b STLD c c PARNPARARIMA
b STLD c c -1.0001.0001.000
PAR0.000-0.9260.000
NPAR0.0000.074-0.000
ARIMA0.0001.0001.000-
San Borja Station
Models b STLD c b PARNPARARIMA
b STLD c b -1.0001.0001.000
PAR0.000-0.9070.000
NPAR0.0000.093-0.000
ARIMA0.0001.0001.000-
Santa Anita Station
Models b STLD c b PARNPARARIMA
b STLD c b -1.0001.0001.000
PAR0.000-0.9950.000
NPAR0.0000.005-0.000
ARIMA0.0001.0001.000-
Disclaimer/Publisher’s Note: The statements, opinions and data contained in all publications are solely those of the individual author(s) and contributor(s) and not of MDPI and/or the editor(s). MDPI and/or the editor(s) disclaim responsibility for any injury to people or property resulting from any ideas, methods, instructions or products referred to in the content.