Abstract
The combination of new airframes with electric and hybrid-electric propulsion is a potential solution to decarbonize aviation. In this context, recent studies have proven that the box-wing airframe, if integrated on a hybrid-electric aircraft belonging to the regional category, can provide significant reductions in fuel consumption. In light of these promising results, this paper aims to present a broader comparison between the box-wing aircraft and the conventional tube-and-wing aircraft, in the context of regional hybrid-electric air transport. An economic analysis is assessed, and the effects deriving from the box-wing introduction, in terms of direct operating costs, are quantitatively evaluated by applying cost models that consider the integration of hybrid-electric propulsion. In parallel, a comparative analysis of greenhouse emissions is proposed, considering both flight- and production-related emissions. The environmental, economic, and operating improvements that the introduction of the box-wing configuration may provide in the context of future regional hybrid-electric aviation are critically detailed. In this regard, the proposed results show that a box-wing hybrid-electric aircraft can reduce cost and emission without affecting compliance with current airport aprons. Finally, a general summary is presented, providing a solution that represents a practical, incremental, and technological step in the path of commercial aviation decarbonization.
1. Introduction
Hybrid-electric propulsion is currently under extensive investigation regarding its application to transport aircraft [1,2,3,4,5,6,7]. The interest in this type of propulsive architecture is mainly found in its theoretical potential to reduce fuel consumption [8,9,10,11,12,13] and consequently the related greenhouse emissions. One of the main limitations of integrating electric propulsion lies in the low gravimetric energy density (BED) of batteries [14,15,16], which, even in future development forecasts, realistically allows us to believe that such propulsion systems can only be effectively applied to small aircrafts, up to the regional category [17,18]. An effective solution to mitigate the weight limits introduced by the low energy density of batteries has been identified in increasing the energy efficiency of novel aircraft configurations. In particular, this aspect involves combining electric propulsion with other technological developments, at the overall aircraft level, in order to decrease the energy demand to complete a typical mission scenario [19]. In this context, different evolutionary technological solutions have been proposed, such as the incremental development of structures and materials. However, solutions capable of providing even more significant performance boosts seem to be the disruptive ones, which involve the study and integration of radically novel lifting architectures [20,21]. Amongst these, the box-wing lifting configuration [22,23,24,25], characterized by a closed lifting system composed of a pair of horizontal wings joined to the tip by vertical wings [26,27,28], has been proven to be able to introduce aerodynamic, structural, and weight benefits capable of improving the aircraft energy efficiency. In this regard, a detailed performance analysis of a hybrid-electric box-wing regional aircraft has been recently proposed by the authors in [17], where the study confirms that the combination of the two innovations, i.e., airframe and propulsive, is capable of producing significant reductions in fuel consumption throughout the entire operational envelope of the aircraft.
In the light of these promising results, a design and performance comparison between regional hybrid-electric aircraft with traditional tube-and-wing (TW) and box-wing (BW) configurations was proposed in [29]. In particular, the results presented in [29] show that the aerodynamic and structural benefits of the BW concept allow significant advantages compared to the corresponding TW configurations, enabling considerable reductions in fuel consumption. This paper aims to start from the performance results presented in that recent work [29] and broaden the study, presenting a more general impact analysis, as described in the following subsections.
1.1. Context of the Work and Literature Results
The results recently discussed in [29] are the initial pivot for the development of the research work illustrated in this paper. In [29], a multidisciplinary design and optimization methodology for regional hybrid-electric aircraft with BW and TW configurations is first described, the results obtained from the application of this methodology are proposed and commented on, and the performance comparison between the two different lifting architectures is critically discussed. The main result that emerges is that the BW architecture introduces structural weight reductions compared to the corresponding TW with the same maximum take-off weight, together with an increase in aerodynamic performance in terms of classical lift-to-drag ratio. The main results in this regard, referring to a population of about 103 configurations of hybrid-electric TW and BW sizes, varying the maximum takeoff weight (MTOW) and the on-board power utilization, are reported in Figure 1. In particular, Figure 1 represents the statistical analysis of the numerical results obtained from the sensitivity study involving the design of hybrid-electric TW and BW. This representation allows the designer to extract general trends, hence, to identify the main differences between the two possible architectures. The left part of Figure 1 shows the average lifting system structural weight reductions achievable by properly integrating the BW architecture, whereas the right part of Figure 1 reports the differences in terms of lift-to-drag ratio L/D at the design point. For the accurate and detailed explanation of these results, the reader can refer to [29]. In fact, reductions in introduce the most significant performance gains for BW architecture. In particular, these reductions are achieved as the BW lifting system allows the redistribution of the lifting load on two different wings, which also have reduced wingspan than the corresponding TW and are over-constrained to the fuselage structure. These features provide lower bending stress for the wings, enabling the design of lighter wing box. Furthermore, BW does not need an additional lifting surface (i.e., the horizontal stabilizer) for longitudinal stability and control functions, as these are intrinsically provided by a proper design and arrangement of the two horizontal wings.
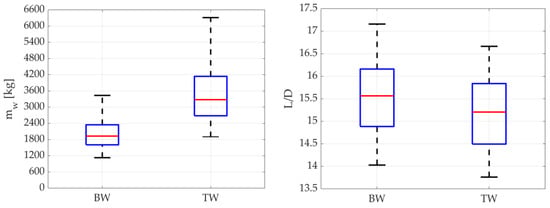
Figure 1.
Statistical analysis of the structural mass of the lifting system (left) and of lift-to-drag ratio (right) for the BW and TW datasets [29].
The lower structural mass allows the BW to load a larger amount of battery onboard, if the same MTOW of the corresponding TW configurations is considered. This aspect enables a larger utilization of the electric power during the aircraft mission, providing both a reduction in thermal power request and an increase in the overall propulsive efficiency [29]. Such that feature, together with the average higher cruise lift-to-drag ratio, makes the BW configuration more energy-efficient than the corresponding TW. Overall, these benefits translate into substantial reductions in block fuel consumption (i.e., the fuel needed for the standard mission, without considering the amount for diversion and reserve) for the different hybrid-electric configurations presented in [29], as illustrated in Figure 2.
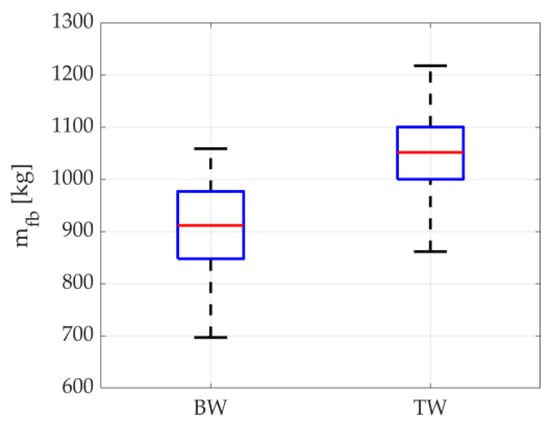
Figure 2.
Statistical analysis of results for BW and TW datasets. Image adapted from [29].
Fuel consumption gains are for sure one of the key aspects in aircraft optimization (i.e., the set of mathematical methodologies that aims at optimizing aircraft configuration in terms of aerodynamics, structure, and performance) when introducing new, even disruptive, technological elements such as hybrid-electric propulsion and unconventional lifting configurations. The performance analysis should not be limited to the evaluation of only this key figure of merit (FoM) but should expand into a more general assessment of the overall impact that the introduction of innovative aircraft can have, even at a conceptual level. Specifically, how do the technical/performance advantages reflect in terms of environmental impact, emissions, and climate-changing effects? Are there trade-offs to be accepted between environmental and economic metrics? How can the operating scenario change to accommodate a new disruptive technology?
1.2. Aim of This Work
Based on the background provided in the previous sub-sections, this paper aims to present and discuss the impact analysis of the introduction of BW hybrid-electric regional aircraft in the regional air transport sector. This analysis is proposed through a critical discussion of the comparison between BW and TW aircraft, starting from the performance analysis and reaching to a detailed comparison of the economic impact, in terms of direct operating costs (DOC), and the environmental impact in terms of total CO2 emissions. The comparison is discussed both at the design point and in the entire payload-range envelope, while the main aircraft features that influence these aspects are identified and critically commented on. The paper is organized as follows: Section 2 reports the methodologies used to evaluate the environmental and economic impact of hybrid-electric aircraft, and Section 3 presents a sensitivity analysis varying some relevant design parameters and proposes the related results for BW and TW configurations. In Section 4, the environmental and economic impact comparison is presented for optimized TW and BW configurations. Finally, Section 5 summarizes the conclusions of this work.
2. Materials and Methods
This section outlines the methodological elements that are the hinge for the performance analysis presented in this paper. First, the aspects relating to aircraft design are briefly outlined, the detailed description of which is omitted as this is proposed and discussed in detail in [29]. Subsequently, the literature models used to assess the economic and environmental impact of the innovative configurations introduced in this conceptual research are illustrated. In this context, Section 2.2 presents the mathematical model used to evaluate the DOC of hybrid-electric aircraft, while Section 2.3 proposes the simplified model used to assess both flight-related and electrical-energy-production-related CO2 emissions.
2.1. Summary of the Aircraft Design Procedure
As anticipated in Section 1, this work extends and completes the one recently presented in [29], so that the design and performance analysis methodologies are only briefly mentioned here for the sake of brevity. The interested reader may refer to [29] and the other related authors’ references [30,31,32] for a more in-depth examination of the methodological aspects. The design of the hybrid-electric aircraft, both in TW and BW configuration, was conducted using different conceptual design software, which was developed in house to deal with this specific scenario.
In particular, the design of the lifting surfaces planform was carried out by means of an optimization procedure that handles the variables defining the wings geometry to maximize the lift-to-drag ratio, while typical constraints on trim and stability are satisfied. Such that procedure is implemented in the AEROSTATE code, which is described in detail in [31,32]. The overall aircraft design, on the other hand, which involves the multidisciplinary iteration of propulsive (specific to hybrid-electric architectures), structural, aerodynamic, and weight aspects, is integrated in the conceptual design platform named THEA-CODE, which is described in detail in [30]. In such a software, the aerodynamics of the lifting systems is evaluated by means of the proper interaction of the AVL [33] and XFOIL [34] codes, while the drag contributions of the other components (e.g., fuselage and nacelle) are evaluated by means of established (classical) textbook methods [35]. Given the architectural differences between BW and TW, the structural sizing of the lifting surfaces is carried out by means of FEM-based surrogate models, as described in [36]. The weight of the fuselage, nacelles, systems, furnishings, and components required to operate the aircraft are estimated using the procedures given in [37]. The hybrid-electric powertrain is sized according to the requirements of the matching chart [38,39], in which the distribution of installed power between the thermal and electric chains is defined by the hybridization factor HP, which is considered a design variable. The other design variables that THEA-CODE can handle are the wing loading W/S and the power fractions supplied by the thermal engine (in relation to the total installed thermal power) during the climb (), cruise (), and descent () phases. In particular, the design variables can be varied by the designer in the case of sensitivity analysis (see Section 3) or can be managed by an optimizer to minimize a given FoM, such as the block fuel (see Section 4). For further details on the methodology, the interested reader may refer to [10,29,30].
In this work, the aircraft analyzed are the same as those sized and discussed in [29]. In particular, the design requirements that were used for the sizing are: design range equal to 600 nm, number of passengers equal to 40, flight altitude equal to 6100 m, cruise Mach equal to 0.4, and required runway length equal to 1100 m. In this context, Figure 3 shows two generic regional hybrid-electric BW and TW configurations, representative of the main architectural choices made in terms of arrangement of the lifting surfaces, positioning of the engines, and shape of the fuselage. The hybrid-electric powertrain selected is of a parallel architecture, and the forecasts used for the technological development of electric machines and batteries refer to the 2035 scenario. In this context, according to [17], the electric motor specific power is 13 kW/kg and its efficiency is 0.96, the battery gravimetric energy density is 500 Wh/kg (at pack level) and its efficiency is 0.96, the inverter shows specific power of 19 kW/kg with an efficiency of 0.98, and finally the wires/cables have a linear specific power of 352 kWm/kg with an efficiency of 0.99.
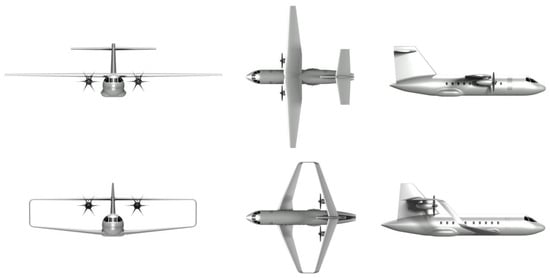
Figure 3.
Generic regional configuration for hybrid-electric TW (top) and BW (bottom).
2.2. DOC Assessment
Cost assessment is a fundamental step when dealing with aircraft conceptual design and, currently, several mathematical models exist in the literature for kerosene-based aircrafts [40,41]. These models allow the prediction of the cost associated for buying and/or using the aircraft. This section focuses on the DOC (that is, the costs associated to aircraft actual operations) by considering the energy requested to accomplish the flight (), the crew (), the aircraft maintenance (), the investment (), and the fees (). The mathematical model adopted in this research parallels that proposed in [42,43], so just a brief overview is given hereafter. The value of the total DOC is computed as
where considers the cost associated to fuel and electricity. In particular, fuel cost per unit weight is assumed equal to 1.22 EUR/kg [44], and the electricity cost per unit energy is equal to 0.14 EUR/kWh [45]. The latter cost refers to consumers with an annual request between 0.5 TWh and 2 TWh, and it represents an average value for the European Union in the second semester of the year 2021 [45]. In particular, the value of the takes into account the cost related to the flight attendants (assumed equal to 30,000 EUR/year [42]) and pilots (assumed equal to 70,000 EUR/year [42]), while the value of the considers the costs associated to the airframe material, the maintenance personnel, and the engine technology. In order to estimate the cost associated to the engine, a sea-level thrust equal to 40% of the aircraft MTOW [39] has been considered. The term is the cost associated to the ground operations, landing, and navigation fees. The cost related to the electrical components such as battery and electric motor are assumed equal to the values proposed in [42].
The value of the is representative of the airline investment to buy and operate the aircraft, which also considers the depreciation cost of both the airframe and battery. Specifically, the cost associated to the investment can be estimated, according to the model discussed in [42], as
where is a reference value associated with the i-th component, i.e., the airframe weight (measured in kgf), the installed power of the gas turbine and electric motor (measured both in kW), and the amount of energy required from the battery pack (measured in kWh); is the price per unit measure of the reference value ; and is the spare factor associated with the i-th component. In particular, a and f are the annuity factor and the insurance rate, respectively, and f is assumed equal to 0.05 as suggested in [46], whereas a is calculated as [42]
where is the interest rate, is the residual value associated with the investment, and is the depreciation time. The interest rate is equal to 0.5% for both aircraft and battery pack, the residual value is set to 10% and 40% for aircraft and battery pack, respectively [42], and the depreciation time is set to 20 years for aircraft and is computed according to Equation (4) for the battery pack:
where is the number of flights per year, which is set equal to 2190, and it corresponds to a number of six flights per day. Accordingly, the number of battery pack () necessary to accomplish the flight is set equal to three since it is assumed that each battery pack allows the accomplishment of two flights per day, as described in [42]; nc is the number of cycles for each battery pack, which is set equal to 1500. The values used to calculate are reported in Table 1.

Table 1.
Reference values to compute [42], see also Equation (2).
2.3. CO2 Emissions Assessment
The emitted to accomplish the flight has been computed as
where indicates the amount of produced per kilogram of fuel burned, which was considered equal to 3.16 [47], and is the mass of , measured in kg, produced per unit of kWh of electrical energy produced and delivered. It is worth noting that the term takes both flight-related and non-flight related emissions into account, namely the emissions related to in-flight operations and that are linked to the electricity production. Bearing in mind the term , three different values were considered, that is, 0.42, 0.21, and 0 kg/kWh, where the first value refers to the production of electricity based on current energy mix [42] (it is identified with the symbol ), whereas the last two values are potential forecast due to the continuous increasing of usage of renewable sources (), up to the full renewable-based scenario () [48,49].
2.4. The Benchmark Thermal Reference
As the main contribution of this work relies on the comparison between the TW and BW architectures, to properly assess a quantitative effect of the introduction of the innovation in both the airframe and the propulsion, a regional full-thermal benchmark aircraft is selected and sized by means of the same design tools of the corresponding hybrid-electric TW (hence, by fixing HP = 0). The main features and performance metrics of this configuration are reported in Table 2 [29].

Table 2.
Main features of the thermal-powered TW benchmark.
3. Results: Sensitivity Study
This section presents the analysis of the comparison of TW and BW hybrid-electric regional aircraft configurations obtained varying some of the main relevant design variables. In particular, the result of the sensitivity study is that obtained from the work proposed in [29], so that in this section the focus is on the general economic and environmental trends for the TW and BW architectures.
3.1. Overview on the Sensitivity Analysis Set-up
The performance analysis discussed in this section refers to the aircraft sized in [29] according to a design campaign in which the main design variables were varied parametrically. In particular, the sensitivity analysis was performed considering all possible combinations between the values of the design variables reassumed in Table 3.

Table 3.
Range of design parameters.
The performance analysis and the related comparison between TW and BW were conducted by considering two main FoMs, that is, the DOC and the total mass of emissions per flight.
3.2. DOC Comparison between TW and BW
Figure 4 reports the yearly DOC computed for the TW and BW configurations designed within the sensitivity analysis. In general, the BW aircraft exhibits lower DOC compared to the corresponding TW: this result is related to three different aspects, namely , , and , whose values are plotted in the breakdown of Figure 6. As indicated before (and demonstrated in [29]), BW configurations require less energy than TW to complete the same mission at the same MTOW, due to improved lift-to-drag ratio and the more efficient usage of hybrid-electric propulsion, as the statistical analysis of the output of the sensitivity analysis reports, in terms of energy required for the mission (see the left part of Figure 5), energy supplied by battery (see the middle part of Figure 5) and energy supplied by fuel (see the right part of Figure 5). This results in reduced energy-related costs for BWs; see the left part of Figure 6.
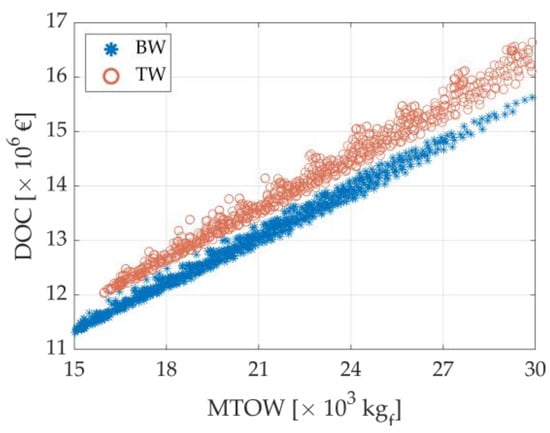
Figure 4.
Yearly DOC for BW and TW configurations.

Figure 5.
Energy required to accomplish the mission (left), energy required to battery pack (center), and energy required to fuel (right) for BW and TW.

Figure 6.
Breakdown of yearly DOC: energy (left), maintenance (middle), and capital (right).
Regarding maintenance and capital investment costs, these are directly related to the operating empty weight (OEW) according to the models discussed in [41,43]. In particular, these reduce for lower values of OEW, hence providing DOC reductions in BW configurations. This aspect is highlighted in Equation (2), which shows that depends linearly on the weight of the airframe. A similar relationship exists for , but it has not been reported for sake of conciseness; the reader can refer to the appendix of [42] for more details. The crew- and fee-related costs are identical, since the aircraft was designed for the same top-level aircraft requirements, thus requiring the same onboard crew and being subject to the same navigation and ground operation fees.
The structural, aerodynamic, and propulsive benefit introduced by the BW airframe hence reflect not only in block fuel consumption gains but also provide economic benefit with respect to the corresponding TW configurations.
It is worth specifying that more adequate and up-to-date models regarding the assessment of hybrid-electric aircraft DOC are to be expected according to both the technological development of electric machines and to possible policy measures aimed at introducing specific charges on emissions resulting from the use of thermal power systems [50,51].
3.3. CO2 Emissions Comparison between TW and BW
In Figure 7, the results of the sensitivity analysis are reported in terms of block fuel, for both the TW and BW configurations datasets. These results, taken from the first part of this research [29], highlight that increasing MTOW is beneficial to achieve reduction in block fuel reductions.
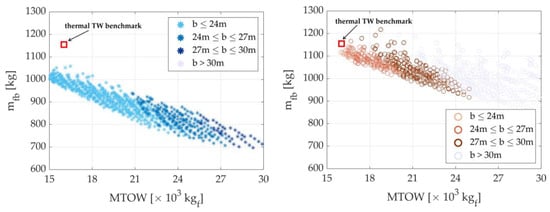
Figure 7.
Block fuel vs. MTOW for the BW (left) and TW (right) datasets [29].
Figure 8 shows the total mass of emissions varying the parameter . The first outcome from these results is that, even if the block fuel reduces increasing MTOW, hence a part of the energy to accomplish the mission is provided by batteries, the increases for both BW and TW if the current production of electricity is taken into account; see the left part of Figure 8. The trend becomes neutral if we consider an increase in renewable sources (see the middle part of Figure 8), whereas sensible improvements in can be gained if the whole production of electricity is renewable-based (see the right part of Figure 8); in this case, the follows the trend of the block fuel. The second outcome provided by this analysis is that BWs configurations, in any scenario, produce less than the corresponding TW, for the same reasons presented in Section 1 when discussing the block fuel as FoM. The statistical analysis of the datasets of Figure 8 is shown in Figure 9.

Figure 8.
vs. MTOW for BW and TW configurations varying .

Figure 9.
Statistical analysis of for BW and TW datasets.
It is apparent from this scenario that, if an effective impact from the introduction of hybrid-electric propulsion is to be achieved on a global level, the technological advancement introduced on aircraft must necessarily be accompanied by a system-wide complete transition. In particular, if electricity production does not reduce its reliance on fossil sources, even disruptive aircraft technology developments would not be effective in reducing the climate impact of transport aviation. Thus, it is necessary to provide a significant conversion of electricity production based on renewable sources at the same time as the development of electric propulsion technologies.
4. Results: Optimized Configurations
Sensitivity analysis is used to identify general trends and to discuss the related performance outcomes. After a sensitivity analysis, the subsequent step is to use the obtained information to set up the conceptual development of the considered aircraft. In the case of the conceptual design of BW and TW hybrid-electric configurations proposed in [29], that is, the configurations on which the analysis presented in this paper is based, this conceptual design process is carried out by means of an optimization procedure. This section first provides an overview of the optimization procedure implemented to design TW and BW hybrid-electric regional aircraft for different MTOW categories, then discusses the economic and environmental performance comparison between optimized TW and BW, both at the design point and within the payload-range envelope. Finally, a qualitative analysis of airport infrastructure compatibility is proposed.
4.1. Optimized Hybrid-Electric Regional BW and TW
The optimization problem formalized to design hybrid-electric TW and BW regional aircraft is set to minimize block fuel , and is described using the following equations
where x is the vector of the design variables, namely HP, W/S, , , and , that are limited within lower and upper boundaries, and , respectively. The constraints refer to the maximum limit on MTOW imposed by the designer, and the maximum threshold of supplied electrical power to avoid overheating of the electric motors. Specifically, four regional hybrid-electric aircraft configurations were optimized for BW and TW respectively, varying between the values [23 30 40 50] × 103 kgf. The results obtained in [29] are reassumed in Table 4.

Table 4.
Main outcomes of optimized hybrid-electric TW and BW (data taken from [29]).
In terms of FoMs relating to the economic and environmental impact of a hybrid-electric aircraft, the DOC and CO2 emission values reported in Table 5 were obtained. A discussion of these results is proposed in Section 4.2.

Table 5.
Data related to the selected FoM for optimized hybrid-electric TW and BW.
4.2. Overall Performance Comparison at the Design Point
An overall summary of the comparison between the couples of optimal BW–TW configurations, for each value of the MTOW considered, is reported in Figure 10, which provides a complete overview of the results of the optimization process. In this context, the comparison is expressed in the form of radar charts showing the percentage differences between TW and BW of the following metrics: MTOW, OEW, block fuel, wingspan, battery mass, DOC, in the three scenarios, evaluated at the design point.
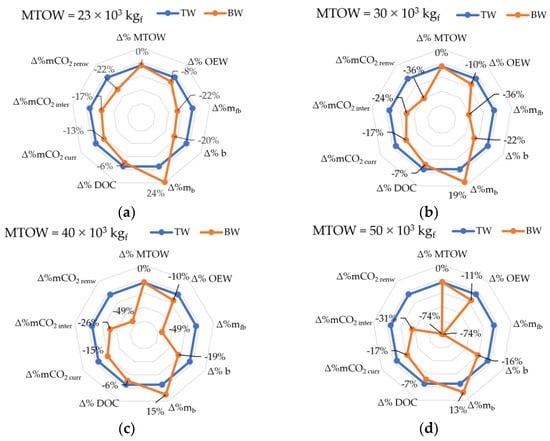
Figure 10.
Radar charts of the FoMs comparison between the optimal BW–TW configurations. MTOW: (a) 23 × 103 kgf; (b) 30 × 103 kgf; (c) 40 × 103 kgf; (d) 50 × 103 kgf.
The comparison at the design point of the optimized TW and BW configurations provides interesting insights. Indeed, as mentioned above and as demonstrated in [29], the BW configurations save significant amounts of block fuel. These advantages also reflect in a less emissions in all three scenarios for the BW with respect the TW, but with different quantitative impacts; in the case of the current scenario, the reductions for BW are noteworthy but anyway do not exceed 17%, as the impact of emissions related to electricity production significantly mitigate the reductions due to lower fuel consumption. The differences increase in the intermediate scenario, while in the scenario the percentage differences coincide with those for , as there are no emissions related to electricity production.
It becomes even more interesting to assess this comparison between hybrid-electric configurations and the thermal benchmark. Indeed, it is this trend that makes it clear whether the proposed technological solutions have a positive impact on greenhouse emissions. The comparison, in percentage terms of emissions, for the three scenarios, between the TW and BW hybrid-electric configurations and the thermal benchmark is shown in Table 6. From this data it is apparent that, if the electricity production scenario remains as it is today (), introducing hybrid-electric propulsion on TW aircraft does not produce any reduction in greenhouse emissions. Furthermore, although increasing MTOW results in substantial reductions in , these do not introduce any benefit in greenhouse emissions, which on the contrary are in clear opposite trend. In correspondence with fuel consumption reductions of 54%, emission increases of more than 33% are generated. Still considering the current context, the situation is slightly better for BW, which in the ‘23t’ and ‘30t’ cases can achieve reductions, albeit still quantitatively limited. The trend begins to reverse for the scenario, hence providing more relevant reductions, while emission reductions coincide with fuel reductions in the case. These results highlight once again how the introduction of electric propulsion technologies alone is not sufficient on a global level if they are not coupled with the ecological transition of electricity production.

Table 6.
Comparison of optimized hybrid-electric TW and BW and reference thermal TW considering CO2 emission as FoM.
As far as the economic impact is concerned, once again the BW has advantages over the TW, although this time much more limited compared to the other FoMs discussed; see Table 5. This is because the share of cost reductions related to electricity and fuel is weighted by a series of fixed costs that are common between the two configurations. Considering instead the DOC comparison with the thermal benchmark (see Table 7), it is observed that for any configuration as MTOW changes, there are economic disadvantages in operating hybrid-electric aircraft compared to the state of the art. According to the current estimates, the effect of the cost of electrical components and energy, which becomes more impactful as the MTOW increases, imposes a trade-off between the beneficial effects in terms of emissions and the increases in operating costs of hybrid-electric aircraft.

Table 7.
Comparison of optimized hybrid-electric TW and BW and reference thermal TW considering DOC as FoM.
4.3. BW and TW Hybrid-Electric Aircaft Impact Assessment within the Payload-Range Envelope
The single-point comparison considering the design point presented in Section 4.2 provides relevant indications in terms of performance differences between TW and BW. However, aircrafts most often operate far from the design point [52], and for payload-range combinations, that may be variable. Therefore, in order to provide as general a discussion of aircraft performance as possible, it is appropriate to evaluate key FoMs within the entire payload-range envelope. In [29], this was completed with regard to the block fuel analysis, as shown in Figure 11, which illustrates the fuel consumption contours for standard missions at varying passengers number (20 to 40) and range (250 to 600 nm) for the TW- and BW-optimized configurations; see Section 4.1. These charts show the substantial benefit related to the use of BW hybrid-electric aircraft, for each of the MTOW considered. If we consider MTOW values similar to those of the regional turboprop aircraft currently operating (e.g., up to 23t for the ATR 72) and analyze the differences between optimized BW and TW (see the bottom part of Figure 11), we obtain average block fuel savings up to 200 kgf; these gains for the BW increase as the MTOW is increased. This result highlights again the potential fuel saving of the BW configuration, which can be extended to the entire pax-range envelope. A further relevant result lies in the capability of the BW configuration with MTOW equal to 50 × 103 kgf to operate throughout the entire operational envelope with almost zero fuel consumption, except for the small quota required for take-off. As extensively discussed in [17], the fuel consumption at the design point is 113 kg, with the highest amount in the cruise phase; if the range reduces, fuel consumption decreases, as well in climb and cruise phases, where no fuel is burnt at the exception of the take-off phase. The trade-off between MTOW and is a peculiarity of hybrid-electric configurations, which by carrying more batteries, thus increasing the MTOW, allow more electrical energy to be supplied during flight, at the expense of less energy demand for fuel.
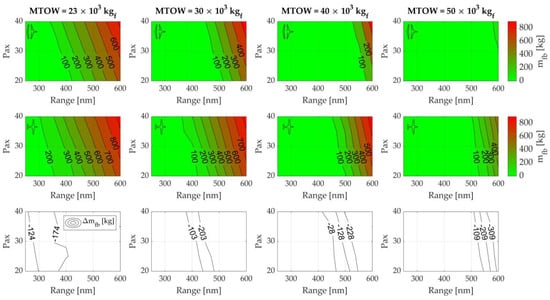
Figure 11.
Pax-range envelope of optimized hybrid-electric BW (first row) and TW (second row) configurations; the plotted contour is the block fuel, and the (last row) reports the point-to-point difference between TW and BW.
However, how do these trends translate into economic and environmental impacts within the entire operating envelope? Figure 12 shows the contours of the DOC per flight within the pax-range diagram for the optimized TW and BW configurations. The contours show that the DOC trend is significantly more sensitive to the range than to the payload, as changes in range result in larger increases in the energy required for the mission. The comparison between TW and BW shows that the latter offers general economic advantages not only at the design point (see Section 4.2), but throughout the operating envelope, as reported by the DOC point-by-point differences between the BW and TW configurations; see the bottom part of Figure 12.
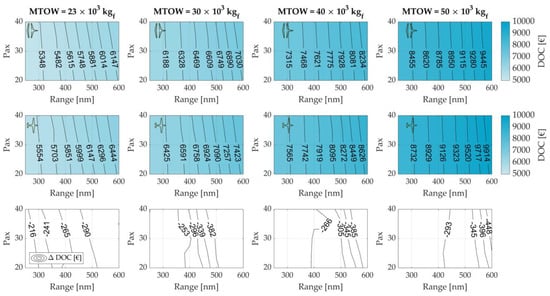
Figure 12.
Pax-range envelope of optimized hybrid-electric BW (first row) and TW (second row) configurations; the plotted contour is DOC, and the (last row) reports the point-to-point difference between TW and BW.
As in the case of the design point, the lower cost quota for BW is mainly attributable to the lower energy demand for flight, and thus, the lower cost share of electricity and fuel. The advantage for the BW over the TW decreases as the payload decreases, but above all, as the range decreases, i.e., as the energy required to perform the flight is reduced. As MTOW increases, a substantial increase in DOC is observed throughout the whole pax-range diagram for each configuration, again highlighting the trade-off that must be paid in economic terms if fuel consumption is to be reduced with hybrid-electric propulsive technologies. Nevertheless, this scenario remains wide open, as policy actions to tax pollutant and greenhouse emissions are currently under discussion [50], and these could introduce economic penalties for the most fuel-consuming flights.
However, considering the current scenario, i.e., without taking possible emissions charges into account, and comparing the data of the thermal benchmark DOC shown in Figure 13 with those of the hybrid-electric BW and TW (see Figure 12), it can be observed that in all MTOW and pax-range conditions, there are economic disadvantages in operating hybrid-electric aircraft compared to the state of the art. The current strong investment in electric propulsion technologies for aviation applications, however, may indicate that in a future when these technologies are mature to be implemented, a reduction in related costs could be expected, thus mitigating the penalty in operating costs against current thermal aircraft.
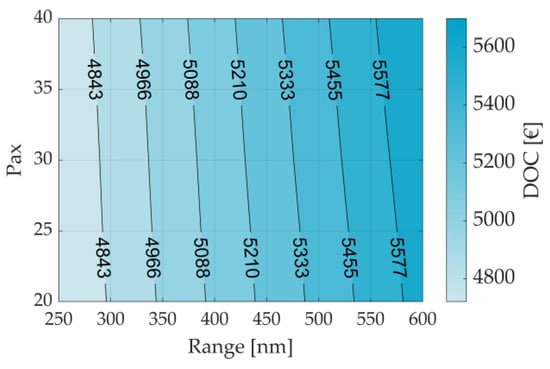
Figure 13.
DOC contours inside the pax-range envelope for the benchmark thermal TW.
For the sake of completeness, the emission values within the pax-range diagrams for the optimized BW and TW configurations for the three previously discussed scenarios of , , and , respectively, are shown in Figure 14, Figure 15 and Figure 16. It is interesting to note that, in the case of , it is the range that is dominant in the emission trend, as this value is strongly related to both fuel and electricity and thus depends on the total energy budget required to fly. This trend is less pronounced in the case, and instead, the effect of the number of passengers becomes more apparent in the case. In general, BW exhibits substantial advantages over TW in all operating envelopes. The two main outcomes previously discussed in Section 4.2 can also be observed from these data: first, in the scenario, the opposite trend between general reductions in obtained as configurations with larger MTOW are considered (see Figure 11), resulting in increases in emissions; this trend becomes almost neutral in the scenario, while follows in the case.
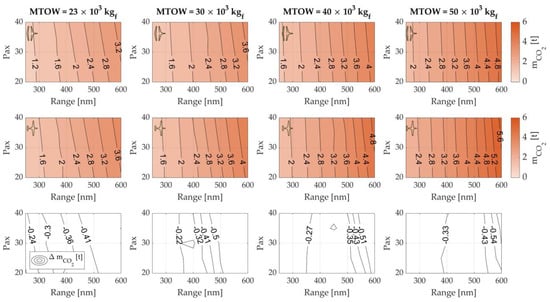
Figure 14.
Pax-range envelope of optimized hybrid-electric BW (first row) and TW (second row) configurations; the plotted contour is CO2 emissions (with = 0.42 kg/kWh), and the (last row) reports the point-to-point difference between TW and BW.
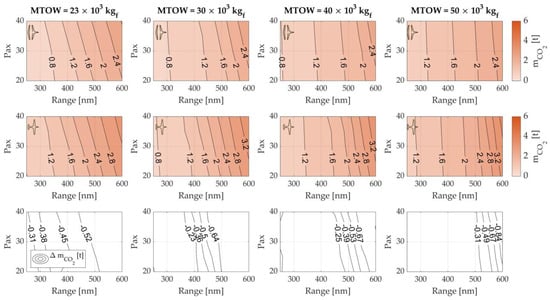
Figure 15.
Pax-range envelope of optimized hybrid-electric BW (first row) and TW (second row) configurations; the plotted contour is CO2 emissions (with
= 0.21 kg/kWh), and the (last row) reports the point-to-point difference between TW and BW.
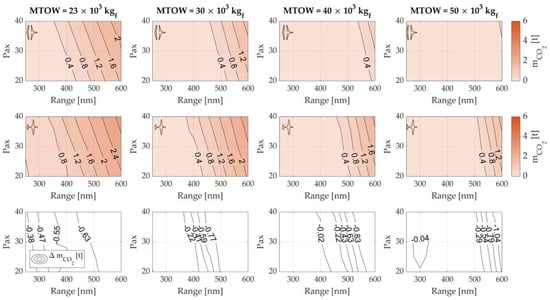
Figure 16.
Pax-range envelope of optimized hybrid-electric BW (first row) and TW (second row) configurations; the plotted contour is CO2 emissions (with = 0 kg/kWh), and the (last row) reports the point-to-point difference between TW and BW.
Secondly, it emerges again that if the introduction of the hybrid-electric propulsion is to reduce greenhouse gas emissions, it is necessary to move towards the scenario; this can be seen by comparing the emissions for all TW and BW configurations with those for the thermal benchmark, proposed in Figure 17.
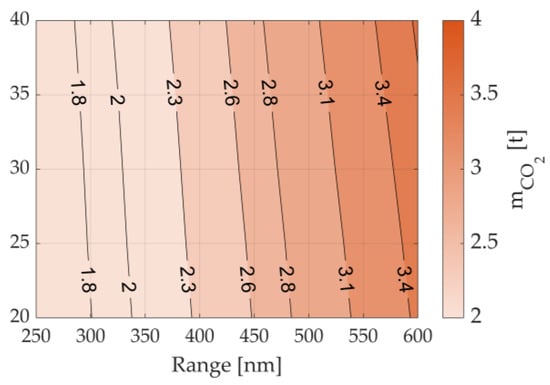
Figure 17.
DOC contours inside the pax-range envelope for the benchmark thermal TW.
4.4. Airport Compatibility
A key aspect in the introduction of a novel transport aircraft lies in the assessment of compatibility with current airport infrastructure. In particular, the main aspects to be considered in the conceptual design phase are related to limits on runway lengths for landing/take-off and dimensional compatibility with aprons. Regarding the first point, the minimum runway length, this has been addressed in the design phase for both the TW and BW hybrid-electric configurations, through the sizing of the propulsion system. In particular, within the matching chart, the take-off sizing condition has been imposed in the event of a failure of one of the two propulsive units, considering a maximum runway length of 1100 m. Since this dimensional constraint has been imposed for both architectures, there are no differences between them in this regard. On the other hand, it is different when it comes to the subject of airport aprons; these are regulated by the standards of the ICAO Aerodrome Codes [53], which, among the various characteristics of the apron, regulate its maximum width, i.e., they limit the maximum wingspan of the aircraft that can utilize the apron. Table 8 shows the ICAO Aerodrome Codes and the related maximum wingspan values.

Table 8.
ICAO Aerodrome Codes [53].
Analyses on the availability of airport aprons show that the smaller the wingspan, i.e., the lower the ICAO code complied with, the greater the possibilities of using more airports [54], even small ones, providing the opportunity to open new routes as well. This is of key importance in the regional market, where short routes are often involved between places with small airport infrastructures [52]. In this context, as discussed above, the effective introduction of hybrid-electric propulsion introduces MTOW increases compared to corresponding state-of-the-art thermal aircraft. Therefore, the lifting surfaces required to trim the aircraft in horizontal flight are also larger than their current equivalents. This, for the TW hybrid-electric configurations results in wingspan increases; on the other hand, the BW configuration, having the lifting capabilities divided over two different surfaces, can trim the same weights with smaller wingspan. This can be seen from Figure 18, in which the planforms of the optimized TW and BW hybrid-electric aircraft described in Section 4.1 are superimposed.

Figure 18.
Planform comparison of optimized TW (grey line) and BW (black line) hybrid-electric configurations.
The wingspan data for the configurations in Figure 18 are reported in Table 9, where the minimum compatibility with ICAO Aerodrome Codes standards is also highlighted.

Table 9.
Wingspan compliance with ICAO Aerodrome Codes for TW and BW hybrid-electric aircraft.
From the data in Table 9 emerges the possibility of distributing the lifting load over two different surfaces and thus decrease the wingspan, allowing the BW configuration to be compatible with the ‘B’ standard in the case of the ‘23t’ configuration and to be always compatible with the ‘C’ standard for the other MTOW categories. On the other hand, the TW configuration is never compatible with the ‘B’ standard, and for configurations with lower fuel consumption, it is not compatible with the ‘C’ standard, introducing severe operating penalties due to the reduced number of aprons available for the ‘D’ standard, especially in the context of regional aviation.
5. Conclusions
This paper presented a conceptual analysis of the environmental and economic impact of introducing hybrid-electric propulsion in the context of regional aviation. In addition, the introduction of a new airframe such as the box-wing was considered as an incremental technological step, and an extensive comparative analysis with corresponding TW aircraft has been proposed.
The obtained results can be analyzed from two different perspectives. Firstly, when analyzing the effects in terms of greenhouse gas reductions resulting from the introduction of hybrid-electric propulsion, it can be observed that the incremental technological contribution at the propulsion level is not sufficient to introduce general environmental benefits. In fact, emissions related to the current methods of electricity production mitigate the potential beneficial effects of emission reductions directly related to flight. Introducing more energy-efficient airframes, such as box wing, may introduce gains over the corresponding hybrid-electric TW, but if general benefits with respect to the state of the art are to be achieved, changes at the overall system level involving a marked transition to electricity production from renewable sources, should be provided.
From an economic point of view, once again the box-wing configuration introduces benefits in terms of reduced value of DOC when directly compared to the corresponding TW hybrid-electric aircraft. These benefits, however, are lower than those found in terms of fuel consumption and CO2 emissions, as they are averaged over a set of fixed costs that are the same for both architectures. On the other hand, when compared to the data of state-of-the-art regional thermal aircraft, both configurations introduce direct operational cost increases. This conceptual analysis, therefore, shows that, according to current estimates, a trade-off between economic and environmental performance should be addressed. In general, this scenario is in constant evolution, as both significant investment in research and development for electric propulsion for aeronautical applications and the gradual introduction of policies aimed at penalizing more polluting modes of transport, tend to mitigate the economic penalties that can be expected from the current outlook.
Author Contributions
Conceptualization, K.A.S., G.P. and A.A.Q.; methodology, K.A.S. and G.P.; software, G.P. and K.A.S.; validation, K.A.S. and G.P.; formal analysis, K.A.S. and G.P.; investigation, G.P. and K.A.S.; data curation, G.P. and K.A.S.; writing—original draft preparation, K.A.S. and G.P.; writing—review and editing, A.A.Q.; visualization, G.P. and K.A.S.; supervision, G.P., K.A.S. and A.A.Q.; funding acquisition, A.A.Q. All authors have read and agreed to the published version of the manuscript.
Funding
This research received no external funding.
Data Availability Statement
The data presented in this study are available on request from the authors G.P. and K.A.
Conflicts of Interest
The authors declare no conflict of interest.
Nomenclature
| List of symbols | Description | Unit |
| a | Annuity factor | |
| b | Wingspan | m |
| Efl | Energy to accomplish the mission | kWh |
| Eb | Energy required to battery | kWh |
| Ef | Energy required to fuel | kWh |
| f | Insurance rate | |
| HP | Degree of hybridization | |
| ir | Interest rate | |
| L | Lift | kgf |
| L/D | Lift-to-drag ratio | |
| lb | Upper bound vector | |
| mb | Battery mass | kg |
| CO2 mass | kg | |
| mfb | Block fuel mass | kg |
| mw | Wing mass | kg |
| Nb | Number of battery packs | |
| Nf | Number of flights | |
| p | Price | |
| rv | Residual value of the investment | |
| tdp | Depreciation time | |
| ub | Lower bound vector | |
| W | Aircraft weight | kgf |
| W/S | Wing loading | kgf/m2 |
| Φe | Power fraction supplied by the electric motor | |
| Φt | Power fraction supplied by the thermal engine | |
| List of acronyms | Description | Unit |
| BED | Gravimetric battery energy density | Wh/kg |
| BW | Box Wing | |
| DOC | Direct Operating Costs | |
| FoM | Figure of Merit | |
| MTOW | Maximum Take-Off Weight | kgf |
| OEW | Operative Empty weight | kgf |
| TW | Tube and Wing |
References
- Brelje, B.; Martins, J. Electric, hybrid, and turboelectric fixed-wing aircraft: A review of concepts, models, and design approaches. Prog. Aerosp. Sci. 2018, 104, 1–19. [Google Scholar] [CrossRef]
- Pornet, C.; Isikveren, A. Conceptual design of hybrid-electric transport aircraft. Prog. Aerosp. Sci. 2015, 79, 114–135. [Google Scholar] [CrossRef]
- Marciello, V.; Orefice, F.; Nicolosi, F.; Ciliberti, D.; Della Vecchia, P. Design of hybrid-electric aircraft with fault-tolerance considerations. Chin. J. Aeronaut. 2023, 36, 160–178. [Google Scholar] [CrossRef]
- Sahoo, S.; Zhao, X.; Kyprianidis, K. A Review of Concepts, Benefits, and Challenges for Future Electrical Propulsion-Based Aircraft. Aerospace 2020, 7, 44. [Google Scholar] [CrossRef]
- Ye, X.I.E.; Savvarisal, A.; Tsourdos, A.; Zhang, D.; Jason, G.U. Review of hybrid electric powered aircraft, its conceptual design and energy management methodologies. Chin. J. Aeronaut. 2021, 34, 432–450. [Google Scholar] [CrossRef]
- Finger, D.F.; Bil, C.; Braun, C. Initial sizing methodology for hybrid-electric general aviation aircraft. J. Aircr. 2020, 57, 245–255. [Google Scholar] [CrossRef]
- Isikveren, A.T.; Fefermann, Y.; Maury, C.; Level, C.; Zarati, K.; Salanne, J.P.; Pornet, C.; Thoraval, B. Pre-design of a commuter transport utilising Voltaic-Joule/Brayton motive power systems. Aeronaut. J. 2018, 122, 205–237. [Google Scholar] [CrossRef]
- Orefice, F.; Nicolosi, F.; Della Vecchia, P.; Ciliberti, D. Aircraft conceptual design of commuter aircraft including distributed electric propulsion. In Proceedings of the AIAA Aviation Forum, Virtual Event, 15–19 June 2020. [Google Scholar] [CrossRef]
- Rolando, A.; Salucci, F.; Trainelli, L.; Riboldi, C.E.; Khan, Y.M. On the Design of an Electric-Powered Micro-Feeder Aircraft. In Proceedings of the 1st Aerospace Europe Conference, Bordeaux, France, 25–28 February 2020. [Google Scholar]
- Palaia, G.; Abu Salem, K. Mission Performance Analysis of Hybrid-Electric Regional Aircraft. Aerospace 2023, 10, 246. [Google Scholar] [CrossRef]
- de Vries, R.; Brown, M.; Vos, R. Preliminary Sizing Method for Hybrid-Electric Distributed-Propulsion Aircraft. J. Aircr. 2019, 56, 2172–2188. [Google Scholar] [CrossRef]
- Gnadt, A.; Speth, R.; Sabnis, J.; Barrett, S. Technical and environmental assessment of all-electric 180-passenger commercial aircraft. Prog. Aerosp. Sci. 2019, 105, 1–30. [Google Scholar] [CrossRef]
- Sgueglia, A.; Schmollgruber, P.; Bartoli, N.; Benard, E.; Morlier, J.; Jasa, J.; Martins, J.R.; Hwang, J.T.; Gray, J.S. Multidisciplinary Design Optimization Framework with Coupled Derivative Computation for Hybrid Aircraft. J. Aircr. 2020, 57, 715–729. [Google Scholar] [CrossRef]
- Zhang, H.; Li, X.; Zhang, H. Li–S and Li–O2 Batteries with High Specific Energy; Springer: Singapore, 2017; pp. 1–48. [Google Scholar] [CrossRef]
- Marciello, V.; Di Stasio, M.; Ruocco, M.; Trifari, V.; Nicolosi, F.; Meindl, M.; Lemoine, B.; Caliandro, P. Design Exploration for Sustainable Regional Hybrid-Electric Aircraft: A Study Based on Technology Forecasts. Aerospace 2023, 10, 165. [Google Scholar] [CrossRef]
- Löbberding, H.; Wessel, S.; Offermanns, C.; Kehrer, M.; Rother, J.; Heimes, H.; Kampker, A. From cell to battery system in BEVs: Analysis of system packing efficiency and cell types. World Electr. Veh. J. 2020, 11, 77. [Google Scholar] [CrossRef]
- Abu Salem, K.; Palaia, G.; Quarta, A.A. Review of hybrid-electric aircraft technologies and designs: Critical analysis and novel solutions. Prog. Aerosp. Sci. 2023, 141, 100924. [Google Scholar] [CrossRef]
- Abu Salem, K.; Palaia, G.; Quarta, A.A.; Chiarelli, M.R. Medium-Range Aircraft Conceptual Design from a Local Air Quality and Climate Change Viewpoint. Energies 2023, 16, 4013. [Google Scholar] [CrossRef]
- Karpuk, S.; Elham, A. Influence of Novel Airframe Technologies on the Feasibility of Fully-Electric Regional Aviation. Aerospace 2021, 8, 163. [Google Scholar] [CrossRef]
- Cavallaro, R.; Demasi, L. Challenges, Ideas, and Innovations of Joined-Wing Configurations: A Concept from the Past, an Opportunity for the Future. Prog. Aerosp. Sci. 2016, 87, 1–93. [Google Scholar] [CrossRef]
- Bravo-Mosquera, P.; Catalano, F.; Zingg, D.W. Unconventional aircraft for civil aviation: A review of concepts and design methodologies. Prog. Aerosp. Sci. 2022, 131, 100813. [Google Scholar] [CrossRef]
- Abu Salem, K.; Cipolla, V.; Palaia, G.; Binante, V.; Zanetti, D. A physics-based multidisciplinary approach for the preliminary design and performance analysis of a medium range aircraft with box-wing architecture. Aerospace 2021, 8, 292. [Google Scholar] [CrossRef]
- Frediani, A. The Prandtl Wing. VKI, Lecture Series: Innovative Configurations and Advanced Concepts for Future Civil Transport Aircraft. 2005. Available online: https://perma.cc/XU6F-8YLG (accessed on 10 August 2023).
- Schiktanz, D.; Scholz, D. Box Wing Fundamentals—An Aircraft Design Perspective, DGLR: Deutscher Luft- und Raumfahrtkongress, DLRK, Bremen, Germany, September 2011. ISBN 978-3-932182-74-X. Document ID: 241353; Available online: http://Airport2030.ProfScholz.de (accessed on 10 August 2023).
- Bravo-Mosquera, P.D.; Cerón-Muñoz, H.D.; Catalano, F.M. Design, aerodynamic analysis and optimization of a next-generation commercial airliner. J. Braz. Soc. Mech. Sci. Eng. 2022, 44, 609. [Google Scholar] [CrossRef]
- Frediani, A.; Montanari, G. Best wing system: An exact solution of the Prandtl’s problem. In Variational Analysis and Aerospace Engineering; Springer Optimization and Its Applications; Springer: New York, NY, USA, 2009; Volume 33. [Google Scholar] [CrossRef]
- Frediani, A.; Cipolla, V.; Rizzo, E. The PrandtlPlane Configuration: Overview on Possible Applications to Civil Aviation. In Variational Analysis and Aerospace Engineering: Mathematical Challenges for Aerospace Design; Springer Optimization and Its Applications; Springer: Boston, MA, USA, 2012; Volume 66. [Google Scholar] [CrossRef]
- Demasi, L.; Dipace, A.; Monegato, G.; Cavallaro, R. Invariant formulation for the minimum induced drag conditions of nonplanar wing systems. AIAA J. 2014, 52, 2223–2240. [Google Scholar] [CrossRef]
- Palaia, G.; Abu Salem, K.; Quarta, A. Comparative analysis of hybrid-electric regional aircraft with tube-and-wing and box-wing airframes: A performance study. Appl. Sci. 2023, 13, 7894. [Google Scholar] [CrossRef]
- Palaia, G.; Zanetti, D.; Salem, K.A.; Cipolla, V.; Binante, V. THEA-CODE: A design tool for the conceptual design of hybrid electric aircraft with conventional or unconventional airframe configurations. Mech. Ind. 2021, 22, 19. [Google Scholar] [CrossRef]
- Rizzo, E.; Frediani, A. Application of Optimisation Algorithms to Aircraft Aerodynamics. In Variational Analysis and Aerospace Engineering; Springer Optimization and Its Applications; Springer: New York, NY, USA, 2009; Volume 33. [Google Scholar] [CrossRef]
- Salem, K.A.; Giuseppe, P.; Vittorio, C.; Vincenzo, B.; Davide, Z.; Mario, C. Tools and methodologies for box-wing aircraft conceptual aerodynamic design and aeromechanic analysis. Mech. Ind. 2021, 22, 39. [Google Scholar] [CrossRef]
- Drela, M.; Youngren, H. AVL 3.36 User Primer, Online Software Manual. 2017. Available online: https://perma.cc/R35R-W29F (accessed on 10 August 2023).
- Drela, M.; Youngren, H. XFOIL 6.9 User Primer, Online Software Manual. 2001. Available online: https://web.mit.edu/drela/Public/web/xfoil/ (accessed on 10 August 2023).
- Raymer, P. Aircraft Design: A Conceptual Approach; AIAA Education Series; Washington DC, USA, 1992; ISBN 0-930403-51-7. Available online: https://arc.aiaa.org/ (accessed on 10 August 2023).
- Cipolla, V.; Abu Salem, K.; Palaia, G.; Binante, V.; Zanetti, D. A DoE-based approach for the implementation of structural surrogate models in the early stage design of box-wing aircraft. Aerosp. Sci. Technol. 2021, 117, 106968. [Google Scholar] [CrossRef]
- Wells, D.P.; Horvath, B.L.; McCullers, L.A. The Flight Optimization System Weights Estimation Method. NASA Technical Memorandum; 2017. Available online: https://ntrs.nasa.gov/citations/20170005851 (accessed on 10 August 2023).
- Fioriti, M. Adaptable conceptual aircraft design model. Adv. Aircr. Spacecr. Sci. 2014, 1, 43–67. [Google Scholar] [CrossRef]
- Sforza, P.M. Commercial Airplane Design Principles; Elsevier: Amsterdam, The Netherlands, 2014. [Google Scholar]
- Lammering, T.; Franz, K.; Risse, K.; Hoernschemeyer, R.; Stumpf, E. Aircraft cost model for preliminary design synthesis. In Proceedings of the 50th AIAA Aerospace Sciences Meeting, Nashville, TN, USA, 9–12 January 2012. [Google Scholar] [CrossRef]
- Risse, K.; Schäfer, K.; Schültke, F.; Stumpf, E. Central reference aircraft data system (CeRAS) for research community. CEAS Aeronaut. J. 2021, 7, 121–133. [Google Scholar] [CrossRef]
- Hoelzen, J.; Liu, Y.; Bensmann, B.; Winnefeld, C.; Elham, A.; Friedrichs, J.; Hanke-Rauschenbach, R. Conceptual Design of Operation Strategies for Hybrid Electric Aircraft. Energies 2018, 11, 217. [Google Scholar] [CrossRef]
- Scholz, A.E.; Trifonov, D.; Hornung, M. Environmental life cycle assessment and operating cost analysis of a conceptual battery hybrid-electric transport aircraft. CEAS Aeronaut J. 2022, 13, 215–235. [Google Scholar] [CrossRef]
- IATA. Jet Fuel Price Monitor. Available online: https://www.iata.org/en/publications/economics/fuel-monitor (accessed on 10 August 2023).
- EUROSTAT. Electricity Price Statistics. Available online: https://ec.europa.eu/eurostat/statistics-explained/index.php?title=Electricity_price_statistics#Electricity_prices_for_non-household_consumers (accessed on 10 August 2023).
- Hoelzen, J.; Silberhorn, D.; Zill, T.; Bensmann, B.; Hanke-Rauschenbach, R. Hydrogen-powered aviation and its reliance on green hydrogen infrastructure–review and research gaps. Int. J. Hydrogen Energy 2022, 47, 3108–3130. [Google Scholar] [CrossRef]
- Overton, J. Issue Brief|The Growth in Greenhouse Gas Emissions from Commercial Aviation. Environmental and Energy Study Institute, 2022. Available online: https://www.eesi.org/papers/view/fact-sheet-the-growth-in-greenhouse-gas-emissions-from-commercial-aviation (accessed on 10 August 2023).
- Hainsch, K.; Göke, L.; Kemfert, C.; Oei, P.-Y.; Hirschhausen, C.V. European green deal: Using ambitious climate targets and renewable energy to climb out of the economic crisis. DIW Wkly. Rep. 2020, 10, 303–310. [Google Scholar] [CrossRef]
- Kougias, I.; Taylor, N.; Kakoulaki, G.; Jäger-Waldau, A. The role of photovoltaics for the European green deal and the recovery plan. Renew. Sustain. Energy Rev. 2021, 144, 111017. [Google Scholar] [CrossRef]
- Brueckner, J.K.; Zhang, A. Airline emission charges: Effects on airfares, service quality, and aircraft design. Transp. Res. Part B 2010, 44, 960–971. [Google Scholar] [CrossRef]
- McConnachie, D.; Wollersheim, C.; Hansman, R.J. The impact of fuel price on airline fuel efficiency and operations. In Proceedings of the AIAA Aviation Technology, Integration, and Operations Conference, Los Angeles, CA, USA, 12–14 August 2013. [Google Scholar] [CrossRef]
- Eisenhut, D.; Moebs, N.; Windels, E.; Bergmann, D.; Geiß, I.; Reis, R.; Strohmayer, A. Aircraft Requirements for Sustainable Regional Aviation. Aerospace 2021, 8, 61. [Google Scholar] [CrossRef]
- International Civil Aviation Organization. Aerodromes: Volume I—Aerodrome Design and Operations. International Standards and Recommended Practices; ICAO Annex 14: Montréal, QC, Canada, 2009. [Google Scholar]
- Bishop, K. Assessment of the Ability of Existing Airport Gate Infrastructure to Accommodate Transport Category Aircraft with Increased Wingspan for Improved Fuel Efficiency. Master’s Thesis, Department of Aeronautics and Astronautics, Massachusetts Institute of Technology, Boston, MA, USA, 2012. Available online: http://hdl.handle.net/1721.1/76095 (accessed on 10 August 2023).
Disclaimer/Publisher’s Note: The statements, opinions and data contained in all publications are solely those of the individual author(s) and contributor(s) and not of MDPI and/or the editor(s). MDPI and/or the editor(s) disclaim responsibility for any injury to people or property resulting from any ideas, methods, instructions or products referred to in the content. |
© 2023 by the authors. Licensee MDPI, Basel, Switzerland. This article is an open access article distributed under the terms and conditions of the Creative Commons Attribution (CC BY) license (https://creativecommons.org/licenses/by/4.0/).
