Abstract
Hydrogen permeation reduces a material’s properties and increases the risk of brittle fracture, which causes a potential safety hazard. A workpiece’s hydrogen permeation resistance could be improved by improving its surface integrity through surface processing. This paper studies low-alloy steel’s surface integrity and its hydrogen permeation resistance in a hydrogen production reactor, using the electrochemical cathodic hydrogen-charging method to carry out electrochemical hydrogen-charging experiments. After the specimens were pretreated using different surface-grinding methods and shot peening pressure strengthening, they were hydrogen-charged on a self-designed and built electrolytic hydrogen charging platform. Before and after hydrogen charging, the specimens’ section hardness and tensile strength were tested, and the fracture morphology of the specimens was observed. The influence laws of surface roughness and surface residual compressive stress on the distribution of material hardness along the depth, the variation in material hardness, the fracture morphology, and the decline in the tensile properties of the low-alloy steel specimens after 5 h of hydrogen charging were analyzed. The reasons for the influence of surface integrity indexes on the hydrogen permeation resistance of the specimens were also analyzed. Based on the experimental results, a series of mechanical processing parameters were proposed to improve the material’s permeation resistance, which provides a theoretical and practical basis for the processing of materials with high surface integrity and hydrogen permeation resistance. Through the experiments, it was found that the hydrogen permeation resistance of the Ra 0.17 μm surface roughness specimen was the best of all specimens with different surface roughness values, and its hydrogen embrittlement sensitivity index was 20.96%. The specimen had the best hydrogen permeation resistance under 336 MPa surface residual compress stress, and its hydrogen embrittlement sensitivity index was 16.45%.
1. Introduction
As a high-energy clean fuel, hydrogen is widely used in aerospace, energy, and other application domains [1]. During hydrogen generation, storage, and transportation, the hydrogen production reactor’s inner wall surface contacts with the produced hydrogen. In the presence of concentration differences, the hydrogen atoms penetrate the hydrogen production reactor material surface through adsorption and diffusion. The hydrogen atoms are enriched within the lattices of the steel of the hydrogen production reactor, leading to hydrogen embrittlement and the performance degradation of the material, resulting in the degradation of various hydrogen reactor steel properties [2,3], which increases the risk of material cracking, gas leakage, explosion, and other major safety accidents associated with the equipment. The hydrogen production reactors, hydrogen containers, and hydrogen–chemical facilities are conventionally manufactured using low-alloy steel due to its excellent machinability, mechanical strength, and low manufacturing costs. Currently, the hydrogen permeation resistance of the materials used can be enhanced by elemental ratio adjustment [4,5,6], surface plating [7,8], and other processing methods. Meanwhile, decreasing the surface unevenness of the material, majorizing the surface micro-topography, and modifying the residual stress variation on the material surface to improve its integrity could also enhance the material’s hydrogen permeation resistance, reducing the reduction in the mechanical properties of the material caused by hydrogen permeation [9,10,11]. Finally, these approaches can improve the reliability of the equipment and prolong the service life of the equipment.
At present, many scholars take surface roughness as the evaluation index of surface integrity and carry out research related to the influence of laws of the surface roughness of materials on the hydrogen permeation resistance and material performance after hydrogen permeation. Asahi et al. [12] analyzed the effect of pre-charging hydrogen on the mechanical behavior of melt-blown amorphous Ni-Nb-Zr alloy and found the larger surface roughness specimens had a higher hydrogen absorption capacity, resulting in a higher hydrogen content within the specimens. Tanaka et al. [13] conducted an electrolytic water experiment and found that the amount of dissolved hydrogen produced during water electrolysis varied according to the roughness factor of the electrode. Cui et al. [14] analyzed the stress corrosion behavior of steels with different degrees of plastic deformation. The experiments found that the steel with more significant deformation promoted the permeation and absorption of hydrogen in the steel due to its higher surface roughness, resulting in higher hydrogen content in the steel. Queiroga et al. [15] studied the hydrogen embrittlement sensitivity of AISI 304 and 310 austenitic stainless steels with different surface finishing and found that the hydrogen embrittlement process accelerated with the increase in the specimens’ surface defects and surface hardness. Liu et al. [16] studied the effect of surface roughness on the fatigue life of specimens in a hydrogen environment and found that the rough surface of the specimen was more conducive to hydrogen permeation, resulting in the shorter fatigue life of the specimen. Alejandra [17] and Kim et al. [18] investigated the effect of surface roughness on the hydrogen permeation rate of Ti-6Al-4V alloy and found that the hydrogen capacity at the initial stage of hydrogen charging was directly related to the surface quality of the specimens. Deconinck [19] analyzed the interaction of different states of surface materials with hydrogen and found that the surface of unpolished specimens absorbed more hydrogen due to having a greater contact surface area. Oezen et al. [20] conducted experiments and found that the excessive surface roughness caused by shot peening resulted in more serious hydrogen embrittlement on the surface of the specimen, reducing its fatigue life.
The scholars mentioned above conducted hydrogen-charging experiments on different surface roughness and material specimens. They discovered that different material and surface roughness specimens’ hydrogen permeation resistance variation is diverse. The reasons for the surface roughness’s influence on the materials’ hydrogen permeation resistance are also relatively complicated.
The scholars also conducted simulation and experimental research work to study the connection between surface residual stress and hydrogen permeation resistance. Li et al. [21] studied the influence of the pure iron surface treatment process on the hydrogen-induced blister behavior. The experiment results indicated that the ground surface had good resistance to hydrogen permeation due to the high residual compress stress, which led to the area and amount of blister on the ground surface being smaller than that on the polished surface after hydrogen charging. Kawamori et al. [22] conducted the hydrogen charging experiment on shot peened specimens and evaluated their hydrogen penetration behavior. They found that the residual compress stress generated by shot peening reduced the hydrogen concentration in the specimen’s surface layer, which in turn inhibited hydrogen entry. Huang et al. [23] and Kumar et al. [24] investigated the hydrogen permeation resistance of Ti-6Al-4V alloy treated by laser peening and conducted hydrogen charging experiments. They found that laser peening could increase the surface compressive residual stress of Ti-6Al-4V alloy effectively, which further reduced the hydrogen concentration and the diffusion coefficient in the crystal lattice, improving the alloy’s hydrogen penetration resistance. Hassan et al. [25] developed a model based on coupled crystal plasticity and hydrogen diffusion to simulate the diffusion and storage process of hydrogen in polycrystalline microstructures. They found that the residual stress introduced during the cold working process affected the strength of the hydrogen traps inside the material, affecting the hydrogen diffusion ability. Agyenim et al. [26] compared the hydrogen penetration resistance of laser shot peening and non-processed specimens, and the experimental results showed that the specimens processed by laser shot peening had a low hydrogen embrittlement sensitivity index due to the high surface residual compress stress. Takakuwa et al. [27] used the finite element method to analyze the hydrogen concentration in the fatigue crack tip regions of the material under the influence of residual stress. The results showed that the concentration of hydrogen ions at the crack tip is higher due to the effect of residual stress in the material, and the residual tensile stress could enhance hydrogen diffusion and concentration. Yang et al. [28] investigated the phenomenon of hydrogen diffusion induced by the changes of residual stress from solid-state phase transition in thick rigid plate welding. Sato et al. [29] analyzed the correlation between cold cracking, surface residual stress and hydrogen aggregation within the high-strength steel weld bead. The research discovered a significant tensile residual stress at the weld bead root; consequently, hydrogen diffused and accumulated at the root due to the elevated tensile residual stress. Jiang et al. [30] investigated the correlation between residual stress and hydrogen diffusion in spiral-welded pipes. The research found that hydrogen primarily concentrated in the heat-affected zones. Additionally, as the welding helix angle increased, the residual tensile stress induced by welding decreased, leading to a reduction in both hydrogen concentration and residual tensile stress.
The scholars mentioned above conducted simulations and experimental research on the hydrogen charging of specimens with different surface residual stress. They found that different residual stress types and strengths could affect the materials’ hydrogen permeation resistance.
After years of research, numerous scholars have conducted experiments on hydrogen diffusion and performed simulation studies on specimens with different materials or different surface integrity. They found that the influence of surface integrity on the hydrogen permeation resistance performance of different materials is comparatively complicated. The laws of hydrogen permeation resistance vary for different metal materials.
In order to investigate the correlation between surface integrity and hydrogen production reactors using low-alloy steel, in this paper, the hydrogen-charging experiments are carried out on the low-alloy steel specimens with different surface integrity evaluation indexes, including the surface roughness and the surface residual compress stress. After hydrogen charging, specimens’ hydrogen-hardening effect and mechanical property variations are compared with those before hydrogen charging, and the hydrogen embrittlement sensitivity index is calculated. Finally, the influence law of surface integrity on hydrogen permeation resistance is analyzed.
This paper obtains different surface roughness and surface residual stress by utilizing different process methods and different strengthening parameters. The hydrogen permeation resistance of specimens after different pretreatment methods are analyzed, and material processing parameters are proposed to enhance hydrogen permeation resistance based on the observed laws. This provides both theoretical and practical foundations for the high-integrity processing of material surfaces regarding hydrogen permeation resistance. The research present in this paper holds specific guiding significance for the reliable manufacturing of hydrogen production reactors.
2. The Design of Hydrogen-Charging Experiment
2.1. Experimental Design
2.1.1. Specimens Preparation and Pretreatment
In electrochemical hydrogen-charging experiments, two types of specimens are used: block specimens and tensile specimens. These specimens are typically made of low-alloy steel, and they are specifically chosen for their suitability in hydrogen production reactors. To ensure consistent and comparable hardness measurements across different experiments, the block specimens are primarily used for hardness testing after hydrogen charging. The block specimen has specific dimensions of 20 mm × 20 mm × 8 mm. The dimensions and configuration of the tensile specimen are determined by the experimental approach standard “ISO 6892-1:2019, Metallic materials-Tensile testing-Part 1: Method of test at room temperature” [31], which are shown in Figure 1. Specimens with different surface roughness and surface residual stresses are used in hydrogen-charging experiments. Each part consists of four sets of experiments. In order to minimize the experimental error, three block specimens are used for each set of experiments, while 24 block specimens and eight tensile specimens are used in the hydrogen charging experiment. Before pretreatment, all specimens undergo annealing and are stored in a controlled environment set at room temperature and in dry conditions. The surface of the specimen is rust removed and cleaned with anhydrous ethanol before pretreatment to prevent impurity particles from affecting the experiment results.
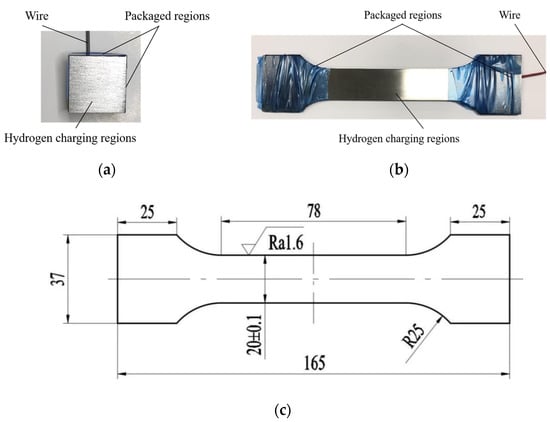
Figure 1.
The dimensions and configuration of specimens. (a) Block specimen; (b) Tensile specimen; (c) Dimensions of tensile specimen (Uint: mm).
To achieve varying initial surface roughness before hydrogen charging, the hydrogen-charging section of one side of the block specimen and both sides of the tensile specimens undergo a preparatory process consisting of grinding using files, 80# sandpaper, 1200# sandpaper, and polishing. After the grinding process, the surfaces of the specimen are cleaned with anhydrous ethanol to prevent impurity particles from affecting the experiment results. To achieve different surface residual stresses, the block specimens undergo shot peening on one side of the hydrogen-charging section, while the hydrogen-charging sections of tensile specimens undergo shot peening on both sides. The shot peening process parameters include a steel pellet diameter of 0.5 mm, a shot peening time of 120 s, and the applied shot peening pressures of 0 MPa, 0.2 MPa, 0.3 MPa and 0.4 MPa, respectively. Meanwhile, after shot peening, all specimen surfaces are lightly ground by 80# sandpaper to ensure the uniform surface roughness of all specimens. After the shot peening strengthening and grinding steps, the surface of the specimen is cleaned with anhydrous ethanol to prevent impurity particles from influencing the experiment results. After treatment and surface cleaning, the surface topography, surface roughness, surface residual stress, surface microstructure and section hardness of specimens are measured.
Meanwhile, to ensure the validity and effectiveness of the experiment, we reduced the period of the hydrogen-charging experiment and controlled the hydrogen-charging sections and current density during the hydrogen-charging process. After pretreatment of the specimens’ surface, the untreated sections of specimens are covered with special anti-corrosion tape, which consists of four untreated side faces and the bottom face of block specimens, only leaving the treated square area of 400 mm2 for hydrogen charging. The two clamping parts and untreated sections of tensile specimens are also similarly covered, leaving only a rectangular area of 1560 mm2 for hydrogen charging. The wrapped specimens are shown in Figure 1a,b.
2.1.2. Setup of Electrochemical Hydrogen-Charging Experiment
The self-designed and constructed electrolytic hydrogen charging device is used to carry out hydrogen-charging experiments by the electrochemical cathodic hydrogen-charging method [32]. The electrochemical hydrogen-charging device consists of an eTM-L linear programmable DC power source, a hydrogen-charging reaction electrolyzer, an electrolyte, and electrode specimens. To minimize errors in the experiment caused by hydrogen escaping from the specimens, which initially finished hydrogen charging during the long hydrogen-charging experimental period, and also to avoid different amounts of hydrogen charging for each specimen caused by the human operation, a series connection that can simultaneously charge hydrogen for multiple specimens is adopted. The platinum electrodes are connected to the anode of the power source; the hydrogen-charging specimens are connected to the cathode of the power source, as shown in Figure 2.
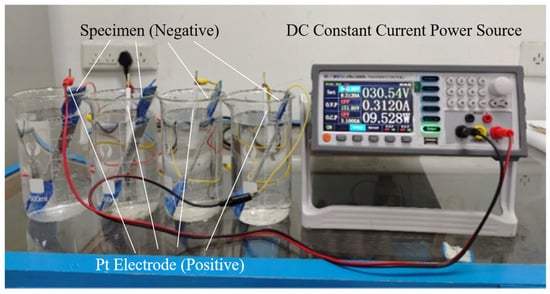
Figure 2.
Electrochemical synchronous hydrogen-charging device.
During the electrolytic hydrogen-charging process, the main component of the electrolyte is 0.1 mol/L sulfuric acid solution, and 1 g/L CH4N2S solution is selected as the poisoning agent. The hydrogen-charging current density is uniformly set at 10 mA/cm2, and the hydrogen-charging temperature is maintained at room temperature. CH4N2S could inhibit a hydrogen recombination reaction, effectively preventing hydrogen atoms at the cathode from combining into hydrogen molecules and escaping from the specimen surface. This results in an improved effect of the electrolytic hydrogen-charging process. After hydrogen charging, the specimens are sequentially cleaned with 0.1 mol/L dissolved sodium hydroxide and anhydrous ethanol.
2.2. The Hydrogen-Charging Plans and Detection Indicators
To analyze the electrolytic hydrogen-charging effectiveness, the material hardness, fracture morphology, tensile properties, and hydrogen embrittlement sensitivity index are evaluated during the experiments. A HV1000Z Vickers hardness tester is used to measure the specimens’ material hardness, the applied load is 0.5 kgf, and the loading time is set to 10 s. Three locations on the hydrogen-charged surface are uniformly selected for hardness testing, and the average measurement result is considered as the surface hardness measure result. Additionally, the hardness layer is measured at regular intervals of 25 μm along the depth to ascertain the hardening depth. In each layer, three points are selected for hardness measurement, and the average value is the hardening depth of the test results.
To evaluate the tensile properties of the specimens before and after hydrogen charging, the UTMX4104X universal testing machine is used. During the testing process, based on the recommendation of relevant standard ISO 6892-1:2009, taking into consideration the material properties and specimens length, the strain rate used in the tensile test is selected as 0.00025 s−1. Based on the formula provided by the standard, the corresponding actual tensile rate for the selected strain rate is determined to be 1.17 mm/min. Considering the specific parameters of the equipment used and the tensile parameters set in similar materials tests [33], the tensile rate used in the tensile test in this paper is finally set at 1 mm/min in the actual tensile process. The SUPRA 55 field emission scanning electron microscopy is used to observe the fracture morphology at the magnification of 1000 times.
During the tensile process, the variations in the length between the fractured specimens before and after hydrogen charging are measured, and the post-break elongation δ of the specimens is calculated. The hydrogen embrittlement sensitivity index IH is calculated based on the post-break elongation of specimens before and after hydrogen charging. The calculation process is illustrated by Equation (1).
where δ0 is the breaking elongation of the non-hydrogen charging specimen, and δH is the breaking elongation of the hydrogen charging specimen.
3. The Pretreatment Results
3.1. Surface Roughness and Surface Morphology Test Results
The surface roughness and surface morphology of the specimens after pretreatment with different grinding methods are shown in Figure 3 and Figure 4, respectively. It can be seen from Figure 4 that with the increase in sandpapers’ mesh numbers and the improving precision of grinding process methods, the original specimen surface defects, like pits and scratches, finally vanish or reduce, and the surface of the specimen is gradually smooth. Moreover, during the inspection process, the surface of specimens gradually becomes mirror-like, especially the polished specimen, and water-misty spots appear on the surface during testing.
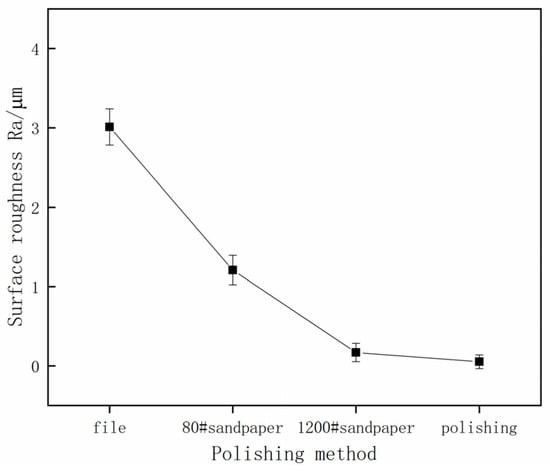
Figure 3.
The test results of processed surface roughness.

Figure 4.
Surface morphology of specimens after being pretreated by different methods. (a) By file; (b) By 80# sandpaper; (c) By 1200# sandpaper; (d) By polishing.
3.2. Surface Residual Stress Test Results
In order to evaluate the surface residual stress of specimens after pretreatment, the Empyrean X-ray diffractometer is used. The measured surface residual stress of specimens pretreated by different grinding methods and shot peening intensities is shown in Figure 5. From Figure 5, it can be seen that the surface residual stress decreases gradually as the processing precision improves. The specimens’ surface residual compress stress progressively intensifies as the shot peening strength increases.
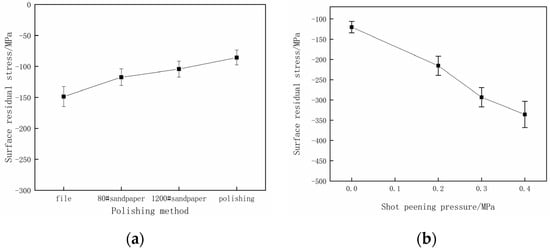
Figure 5.
The test results of surface residual stress. (a) Different pretreatment processes; (b) different shot peening strengths.
3.3. The Specimens’ Surface Layer Microstructure Test Results
According to Figure 6, it can be seen that as the shot peening strength increases, a distinct plastic deformation layer gradually appears within the microstructure of the specimen material. The thickness of the deformation layer increases as the shot peening pressure increases, providing that the impact of the shot peening process deepens. By further observation, it is revealed that in the near-surface layer of the specimen, pearlitic and ferrite have converted into an elongated shuttle-like structure due to the pressure effect induced by high shot peening pressure. Additionally, the grain size of the microstructure reduces significantly, and the axial direction is distributed parallel to the surface of the specimen. In contrast, such a phenomenon is not observed in the inner sections of the specimen.
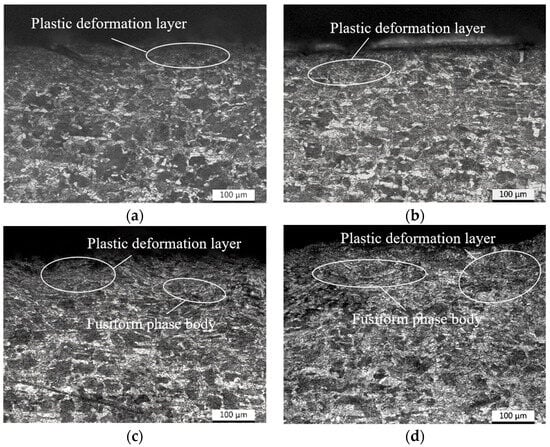
Figure 6.
Microstructure of specimens after shot peening with different strengths. (a) 0 MPa; (b) 0.2 MPa; (c) 0.3 MPa; (d) 0.4 MPa.
3.4. Hardness Test Results of Specimen
After undergoing various pretreatments, the hardness test results of the specimens, both the surface and along depth directions, are presented in Figure 7. In Figure 7, it is evident that after the pretreatment by different methods, the material hardness near the surface of the specimen is higher than that inside the deeper sections. Additionally, by comparing the hardness of different surface roughness specimens, it can be observed that the material hardness of the surface and subsurface is positively correlated with the surface roughness of the specimen. It is implied that the large specimen surface roughness leads to a higher material hardness on the specimens’ surface and subsurface due to the hardening effect resulting from obvious surface plastic deformation during the pretreatment process. After shot peening, the surface hardness of the specimens significantly increases with the reduction in surface residual stress.
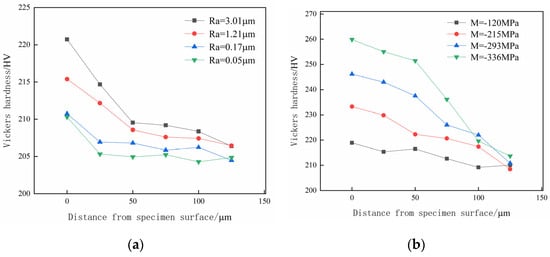
Figure 7.
The hardness distribution of testpieces along the depth direction. (a) Different surface roughness; (b) different shot peening strength.
4. Effect of Surface Roughness on Hydrogen Resistance
4.1. Hydrogen Hardening Effect Analysis
Figure 8 illustrates the hardness test results along the depth direction and the variation in hardness for specimens with different surface roughness after hydrogen charging. From Figure 8a, it is evident that after the pretreatment by hydrogen, the material hardness of the surface and subsurface exhibit a decreasing trend with an increasing test depth. The hardness of specimens with different surface roughness eventually approaches 210 HV at 125 μm from the surface. Within the range of 0–100 μm from the specimen’s surface, the hardness of the hydrogen-charged specimens increases with surface roughness. The hardness values of the specimens with a surface roughness of Ra 0.17 μm and Ra 0.05 μm are close at a distance of 100 μm from the surface of the specimen. From a distance of 75–125 μm from the surface, the decrease in the specimen’s hardness with a surface roughness of Ra 0.05 μm slows down. The hardness at a distance from the surface of 75 μm is only 1.45% higher than that of 125 μm; thus, it could be assumed that hydrogen charging produces a considerable hardening effect in the distance of 0–75 μm from the surface of the Ra 0.05 μm surface roughness specimen, while the hardening effect in the distance of 75–125 μm is relatively small.
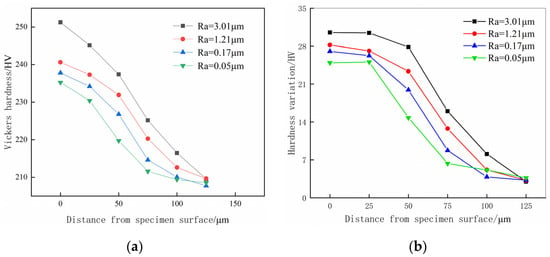
Figure 8.
Hardness test results and hardness changing trends. (a) Hardness test result after hydrogen charging; (b) increase in hardness at different depths.
The hardness variation at different depths before and after hydrogen charging is analyzed to avoid the interference of specimen surface pretreatment hardening to the specimen hydrogen-induced hardening analysis. By comparing the measured hardness at different depths of specimens before hydrogen charging in Figure 7a with the corresponding measurement in Figure 8a, the variation in hardness at different depths is shown in Figure 8b.
From Figure 8b, it is evident that the change in hardness of specimens with different surface roughness at different depths before and after hydrogen charging shows a decreasing trend as the depth increases. Ultimately, the hardness variation of different surface roughness specimens stabilizes to 3 HV at 125 μm from the surface. With the increase in specimen surface roughness, the hardness of the specimen surface and subsurface region after hydrogen charging also increases after hydrogen charging. Among these, the surface hardness of the specimen with a surface roughness Ra 3.01 μm reaches 251.25 HV, which is increased by 13.8% before hydrogen charging. This specimen has the largest hardness after hydrogen charging within the test range of 0–100 μm, with both the surface hardness and variation in hardness being the largest among the four groups of specimens with different surface roughness. The specimen with a surface roughness of Ra 0.05 μm achieves a surface hardness of 235.23 HV, which is 11.8% higher before hydrogen charging, and the hardness variation is the lowest.
The reason for this phenomenon is that after hydrogen atoms penetrate the metal material, the penetrated hydrogen atoms produce brittle hydrides with impurity elements in the metal. The elasticity and plasticity of the produced brittle hydride differ from the material’s properties, resulting in a certain increasing trend in material hardness after hydrogen charging. The specimens with larger surface roughness possess more surface defects, such as peaks, valleys, surface cracks, holes, and scratches, which increase the contact areas and the atomic density between the specimen and the hydrogen-containing medium. Meanwhile, it also has a higher specific surface energy than a smooth surface [34], representing the lack of neighboring atoms around the specimen material surface atoms. The presence of many dangling bonds on the surface and the atoms on the surface are saturated, exhibiting a higher chemical activity [35]. Therefore, under the same hydrogen environment, specimens with larger surface roughness tend to form more brittle hydrides, resulting in a higher hardness than the specimens with smaller surface roughness. As the depth increases, the permeating effect of hydrogen atoms gradually decreases.
Furthermore, the surface damage induced by pretreatment is attenuated, and the proportion of hydrogen traps in the subsurface and interior of the material is higher than that on the surface. The permeation of hydrogen atoms is hindered by hydrogen traps in the interior of the material, leading to a decrease in hydrogen atoms permeating the interior of the material in deeper depth. The amount of hydride produced by the hydrogen atoms’ permeation also decreases as the amount decreases of permeation, which presents a decreasing tendency in the depth direction for the hardness of each surface roughness specimen. Specimens with smaller surface roughness exhibit higher surface integrity, resulting in less contact area between hydrogen atoms and the specimen surfaces and weaking the permeation of hydrogen atoms. Meanwhile, the damage depth caused by pretreatment of the specimen subsurface and internal sections is relatively low. At the low depth section of the specimens, the proportion of hydrogen trap is higher than that with a larger surface roughness, which further reduces the permeation of hydrogen atoms to the deeper sections of the specimen. Therefore, the hardening depth of the specimens with smaller surface roughness caused by the permeation of hydrogen atoms is relatively low.
It can be seen from the test results in Figure 5a that a lower precision in the surface pretreatment process results in a larger residual compress stress of the specimen. However, by comparing with Figure 8a, it can be seen that the specimen with a surface roughness of Ra 3.01 μm exhibits a larger residual compress stress on the surface. However, this does not effectively prevent the process of hydrogen permeation because the hydrogen permeation effect induced by large specimen surface roughness is stronger than the hydrogen permeation resistance effect induced by surface residual compress stress. Consequently, the hydrogen-induced hardening effect on the specimen is more obvious.
4.2. The Analysis of Tensile Fracture Morphology
Figure 9 illustrates the tensile fracture morphology of specimens with different surface roughness after hydrogen charging. Figure 9 shows that after 5 h of hydrogen charging, the brittle fracture features, such as cleavage planes and intergranular fractures appear on the different surface roughness specimens to some extent. Figure 9a reveals that the fracture mode of the Ra 3.01 μm surface roughness specimen is mainly quasi-cleavage fractures, and the fracture surface had plenty of brittle fracture features distributed such as quasi-cleavage planes, tear ridges and intergranular fractures on the fracture surface. As shown in Figure 9b, many river-like textures, plenty of small areas of quasi-cleavage planes and intergranular fracture features are distributed on the fracture surface of the specimen with a surface roughness Ra1.21 μm. As shown in Figure 9c, the fracture surface of the specimen with a surface roughness of Ra 0.17 μm has a large number of distributed dimple features and a small number of quasi-cleavage planes. The fracture form of this specimen is a ductile–brittle composite fracture dominated by ductile fracture. As shown in Figure 9d, the fracture surface of the specimen with a surface roughness of Ra 0.05 μm distributes the dimple features, and it also obviously distributes a great number of brittle fractures as large area cleavage planes and intergranular fractures. The fracture form of this specimen is ductile–brittle composite fracture dominated by brittle fracture. Based on the above fracture morphology observation, it can be seen that after 5 h of hydrogen charging, the specimen with different surface roughness appears to have different degrees of embrittlement. As the specimens’ surface roughness decreases, the proportion of brittle fracture features in the specimens’ fracture morphology tends to decrease and then increase.
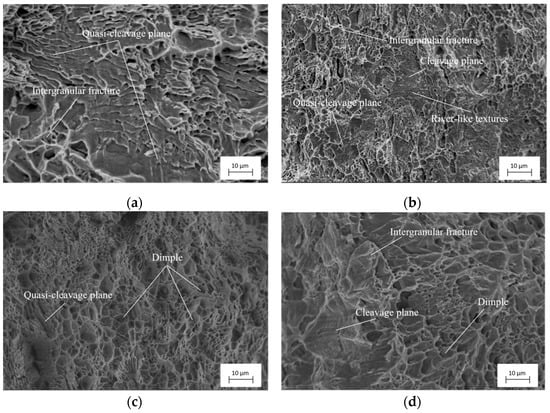
Figure 9.
Fracture topographies of samples with different surface roughness after hydrogen charging for 5 h. (a) Ra 3.01 μm; (b) Ra 1.21 μm; (c) Ra 0.17 μm; (d) Ra 0.05 μm.
When the specimen has a large surface roughness, the hydrogen permeation resistance of the specimen surface is relatively weak, which increases the permeation of hydrogen atoms into the specimens. However, the permeated hydrogen atoms in the specimen’s metal material would accumulate, forming hydrogen molecules and generating high pressure. The acting force generated by hydrogen molecules’ aggregation pressure, material internal residual stress and external force may exceed the yield limit of the material. The acting force exceeding the yield limit of the material would lead to hydrogen embrittlement fracture in the material [36]. Therefore, the fracture of specimens with a surface roughness of Ra 3.01 μm and Ra 1.21 μm is dominated by brittle fractures. As the surface roughness of the specimen decreases to Ra 0.17 μm, the adsorption capacity of the specimen surface for hydrogen atoms reduces, leading to a decrease in the content of hydrogen atoms permeating into the interior of the specimen material. Consequently, the brittle fracture features of the specimen gradually reduce with the reduction in surface roughness. In contrast, the surface energy of the specimen with a surface roughness of Ra 0.05 μm reduces due to the adsorption of hydrogen atoms, reducing the required crack propagation, which makes the specimen more susceptible to fracture. Meanwhile, the crack diffusion fracture point would accumulate hydrogen atoms, which are more likely to produce a hydrogen embrittlement phenomenon, leading to an increase in hydrogen embrittlement fracture features in the fractured specimen.
4.3. The Mechanical Properties Analysis of Materials after Hydrogen Charging
Figure 10 compares the specimen’s tensile stress–strain curves before and after hydrogen charging for 5 h with different surface roughness values. Figure 11 illustrates the mechanical property parameters obtained through the tensile testing of hydrogen-charged specimens with different surface roughness and the calculated hydrogen embrittlement sensitive index. Based on the analysis of Figure 10, it can be inferred that the tensile mechanical properties of all specimens subjected to hydrogen charging exhibit varying degrees of deterioration. This phenomenon indicates that this paper’s hydrogen-charging experimental condition is effective for different surface roughness specimens. It is worth noting that under the test conditions provided in this paper, the mechanical properties of specimens with relatively large or small surface roughness show significant degradation after hydrogen charging.
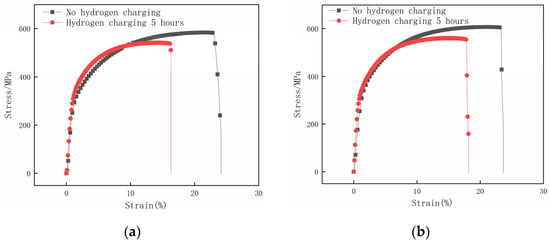
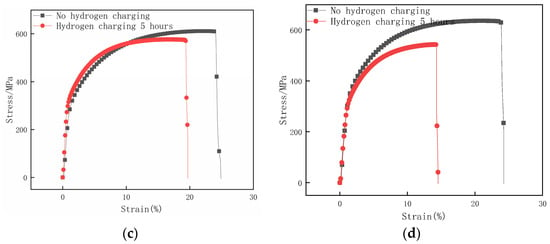
Figure 10.
Stress–strain curves of samples with different surface roughness before and after hydrogen charging for 5 h. (a) Ra 3.01 μm; (b) Ra 1.21 μm; (c) Ra 0.17 μm; (d) Ra 0.05 μm.
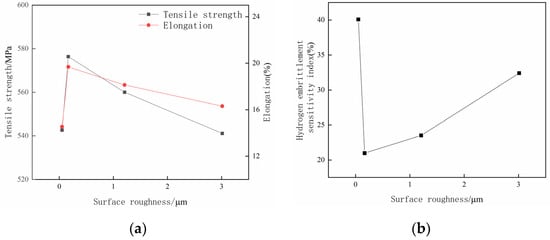
Figure 11.
The performance curve of samples with different surface roughness after being charged with hydrogen for 5 h. (a) Curves of tensile stress and elongation; (b) hydrogen embrittlement sensitivity index curve.
By analyzing Figure 11a, it can be found that as the surface roughness of the hydrogen-charged specimens increases, the measured tensile strength and elongation ratio both show the trends of first increasing and then decreasing. Furthermore, the surface roughness Ra 0.17 μm specimen has the largest tensile strength and elongation after hydrogen charging for 5 h; the tensile stress is 576.35 MPa, which decreases by 5.69% before hydrogen charging, and the elongation is 19.68%, which decreases by 5.22% before hydrogen charging. Figure 11b illustrates that with the increase in the specimen’s surface roughness, the hydrogen embrittlement sensitivity of specimens first decreases and then increases. The specimen with a surface roughness of Ra 0.05 μm has the largest hydrogen embrittlement sensitivity index, which is 40.08%. In contrast, the specimen with a surface roughness of Ra 0.17 μm has the lowest hydrogen embrittlement sensitivity index, which is 20.96%.
The reasons for the above phenomena are that after 5 h of hydrogen charging, specimens with larger surface roughness are more likely to have stress concentration, resulting in the triaxial tensile stress at the stress concentration point reducing hydrogen‘s chemical potential energy in steel. The hydrogen atoms would diffuse from high chemical potential energy sections to low chemical potential energy sections due to the effect of the chemical potential difference. Furthermore, the permeated hydrogen atoms accumulate at the stress concentration sections under the stress-inducing effect until reaching a chemical potential equilibrium, which leads to an increase in the hydrogen mass fraction at the stress concentration sections. Moreover, the larger surface roughness specimens have a larger ratio surface and specific surface energy, making it easier to combine with hydrogen ions, which would penetrate more hydrogen ions. Additionally, the specimens with large surface roughness have high hydrogen-induced brittleness, and the fracture morphology is more flush and smooth. In contrast, the specimens with small surface roughness have fewer brittle fracture features on the fracture surfaces. It is attributed to the permeation and fusion of hydrogen atoms within the specimen material, which enhances the material’s brittleness, hardness and reduces the material’s plasticity, significantly reducing its tensile strength.
Although the specimen with a surface roughness of Ra 0.05 μm has a small surface roughness, its tensile strength decreases significantly after hydrogen charging, exhibiting the largest hydrogen embrittlement sensitivity index. It can be attributed to the surface of the specimen with a surface roughness of Ra 0.05 μm being relatively smooth, which does not easily generate stress concentrations. However, the surface cracks would emerge subjected to the exogenic force-stretching effect. The emerging surface cracks would lead the hydrogen atoms absorbed by the specimen’s surface to diffuse from the original hydrogen-rich sections to the stress concentration position of the cracks. Moreover, the rearrangement of hydrogen atoms would slowly expand the cracks [37]. So, the tensile property of the specimen reduces, and large areas of cleavage plane also appear on the fracture surface and exhibit a brittle fracture feature.
Based on the analysis, the Ra 0.17 μm specimen demonstrates the best hydrogen permeation resistance among the specimens with different surface roughness.
5. The Influence of Surface Residual Stress on Hydrogen Permeation Resistance
5.1. The Analysis of Hydrogen Hardening
Figure 12 illustrates the test results of the hydrogen penetration hardness gradient with different surface residual stress specimens after hydrogen charging. It can be seen from Figure 12a that after 5 h of hydrogen charging, the hardness of both the surface and subsurface material shows a decreasing trend as the test depth increases. Additionally, the tested hardness increases as the specimens’ surface residual stress increases. In particular, the hardness of the specimen with a surface residual compress stress of 120 MPa slightly decreases within the depth range of 0–25 μm. Within the depth range of 25–75 μm, the hardness significantly decreases, and the varying trend of hardness and the increasing amount trend of hardness eventually tend to be stable at a depth of 75 μm to the surface. The specimens with a surface residual compress stress of 336 MPa show the most apparent decrease in the decay rate of the hardness value, which slows down at a depth of 100 μm. The specimens with surface residual compress stresses of 215 MPa and 293 MPa show a stable trend of hardness decline; the hardness at a depth of 100 μm is close to that of the specimen with a surface residual compress stress of 336 MPa.
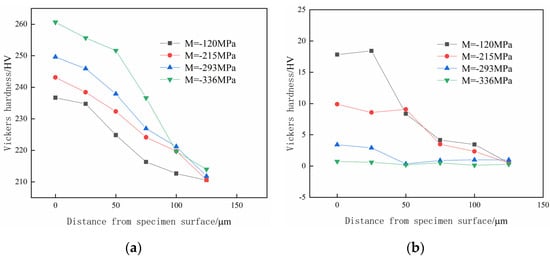
Figure 12.
The effect of surface residual stress on the hydrogen penetration hardness gradient. (a) Hardness test after hydrogen charging; (b) increase in hardness at different depths.
By comparing the measured hardness at different depths of specimens before hydrogen charging in Figure 7b with the measured results after hydrogen charging in Figure 12a, the variable quantity of hardness at different depths is shown in Figure 12b. The goal is to minimize the interference of hardening caused by shot peening on the hydrogen analysis.
Based on the observations in Figure 12b, it is evident that the surface and subsurface hardness of the specimens with the surface residual compress stress values of 120 MPa and 215 MPa after hydrogen charging increase significantly compared to before hydrogen charging. Specifically, the hardness of the surface residual compress stress 120 MPa hydrogen-charged specimen increases by 17.82 HV compared to that before hydrogen charging, which increases by 8.14%; the increase in hardness is the largest among four specimens with different surface residual compress stresses.
Meanwhile, the hardness of the two groups of specimens changes significantly before and after hydrogen charging within a depth range of 0–75 μm from the surface, which indicates that the depth of the hydrogen-hardening layer in the specimens after hydrogen charging is approximately 75 μm. The surface and subsurface hardness of specimens with surface residual compress stresses of 293 MPa and 336 MPa change slightly before and after hydrogen charging. The variation of two groups of specimens tends to be stable at a depth of 50 μm from the surface. Among all the different residual compress stress specimens, the surface residual compress stress of 336 MPa only increased the specimen’s surface hardness by 0.75 HV after hydrogen charging. The increase in hardness is the smallest among the four specimens with different surface residual compress stresses. The material hardness of the specimen with a surface residual stress of 293 MPa shows a noticeable increase within the depth range of 0–25 μm after 5 h of hydrogen charging. However, the variation of material hardness becomes less significant as the depth reaches 50 μm.
Based on the phenomenon mentioned above, it can be seen that after 5 h of hydrogen charging, the depth of the hydrogen-induced hardening layer in the specimens with surface residual compress stresses of 293 MPa and 336 MPa is only 50 μm. The reasons for the phenomenon are that compared with the unprocessed specimen with a surface residual compress stress of 120 MPa, the surface and subsurface material microstructures of the surface residual compressive stress of 215 MPa, 293 MPa, and 336 MPa are significantly refined due to the shot peening strengthening effect. The densification of the microstructure also improves, leading the hardness of the surface and subsurface of the specimens to be higher than that of the specimen without the shot peening process. The brittle hybrids would form when the specimen metal material contacts with the hydrogen medium, which improves the specimen material’s hardness on the original basis. Therefore, the surface and subsurface hardness of the specimens with surface residual compress stress processed by shot peening is generally higher than that of unprocessed specimens.
During the pretreatment, the evident plastic deformation and microstructure refinement of the reinforced layer would be generated on the specimen surface and subsurface by shot peening. As the depth from the specimen surface increases, the impact-strengthening effect of shot peening gradually weakens, diminishing microstructure refinement. Meanwhile, the hydrogen traps on the surface and subsurface of the specimen intercept hydrogen atoms within the material, significantly reducing the amount of hydrogen atoms permeating into deeper layers of the material, which reduces the improvement in specimen material hardness caused by hydrogen-induced hardening. Therefore, the hardness of the specimen decreases with the increasing depth from the surface under the combined influence of two effects. In the case of the specimen with a surface residual compress stress of 120 MPa, which is not processed by shot peening, the microstructure of the specimen surface and subsurface is relatively coarse. Consequently, the proportion of the hydrogen traps within the material’s surface is relatively small, and the intercept effect of hydrogen atoms is relatively weak. Therefore, the depth of the hydrogen-induced hardening effect is more significant, and the increase in hardness growth after 5 h of hydrogen charging is the largest among the four groups of specimens.
By comparing the microstructure of the specimen surface and subsurface after shot peening in Figure 6, it is evident that due to the larger pressure of the shot peening pretreatment, the specimens form a surface residual compress stress of 293 MPa and 336 MPa. The refinement of the surface and subsurface could be clearly observed, which creates a strong intercept effect on the permeation of hydrogen atoms in a pro-hydrogen environment. Therefore, the increase in material hardness near the surface of specimens is relatively small. Meanwhile, the refinement grains increase the grain boundary area per unit volume of the specimen material. The density of grain boundary hydrogen traps within the specimen material increases, the hydrogen permeation is inhibited, and the hydrogen concentration of the per unit grain boundary area is reduced [38], which interferes with the further permeation of penetrated hydrogen atoms into the deeper depth of the specimen. Therefore, the material hardness of the two regions of the specimens only increases significantly within the depth range of 0–50 μm.
5.2. The Analysis of Tensile Fracture Morphology
Figure 13 shows the tensile fracture morphology of specimens with different surface residual stresses after hydrogen charging for 5 h. From the observation results shown in Figure 13, as the specimen’s surface residual compress stress increases, the proportion of plastic fracture features on the specimen fracture surface gradually increases. Among these, many cleavage planes are distributed accompanied by intergranular fracture features on the fracture surface of the specimen with a surface residual compress stress of 120 MPa, which is a typical brittle fracture feature, as shown in Figure 13a. It is evident that the specimen with a surface residual compress stress of 120 MPa is significantly affected by hydrogen charging, resulting in a severe embrittlement of specimen material. It can be seen from Figure 13b that the ratio of cleavage planes and intergranular fracture features decreases on the fracture surface of the specimen with a surface residual compress stress of 215 MPa. The ratio of the dimple feature increases and the plastic properties of the fractured specimen significantly improve compared to specimens with a surface residual compress stress of 120 MPa. The fracture morphologies of the other two groups of specimens are shown in Figure 13c,d. It can be observed from Figure 13c,d that a large number of dimples are distributed on the fracture surface of the specimens, the cleavage planes are locally distributed, and the plastic fractures dominate the fracture form.
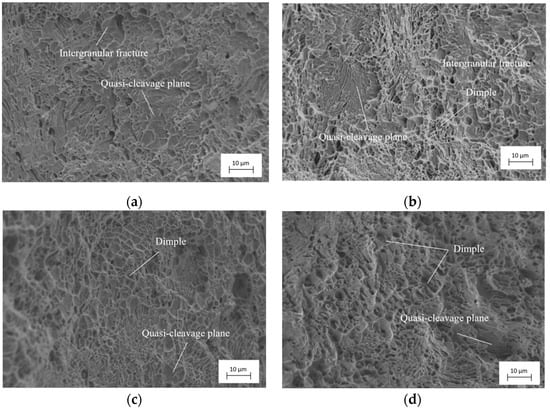
Figure 13.
Fracture morphologies of samples with different surface residual stress after hydrogen charging for 5 h. (a) M = −120 MPa; (b) M = −215 MPa; (c) M = −293 MPa; (d) M = −336 MPa.
As the specimen’s surface residual compress stress increases, the area of the cleavage planes distributed on the specimen surface decreases, and the feature of intergranular fractures disappears. Simultaneously, the proportion of plastic fracture features dominated by dimples increases, and the shapes of the dimples gradually become apparent. The specimens with surface residual compress stresses of 215 MPa, 293 MPa, and 336 MPa after processed by shot peening during the pretreatment could not easily be affected by hydrogen charging. The specimen could retain good plastic properties and demonstrates good hydrogen permeation resistance. Among these specimens, the shape of dimples on the fracture surfaces of the specimens with a surface residual compress stress of 336 MPa is the most obvious, the amount of quasi-cleavage plane features is small, and the area of the quasi-cleavage plane is relatively small. The specimen material has good plastic properties and the best hydrogen permeation resistance among the four groups of specimens.
5.3. Analysis of Mechanical Properties of Materials after Hydrogen Charging
Figure 14 compares the specimens’ tensile stress–strain curves with different surface residual compress stresses before and after 5 h of hydrogen charging. Based on the analysis of Figure 14, it can be inferred that after 5 h of hydrogen charging of all specimens, the tensile mechanical properties of the specimens with different surface residual compress stresses show different degrees of degradation. Among all different surface residual stress specimens, the untreated specimen with a surface residual stress of 120 MPa has a tensile strength of 542 MPa after hydrogen charging, which is decreased by 11.01%. The elongation is 16.94%, which is 6.16% less than that before hydrogen charging. The mechanical properties of this specimen change significantly due to the effect of hydrogen permeation. The specimen preprocessed with 0.2 MPa shot peening strength, leading to a surface residual compress stress of 120 MPa, exhibits a tensile strength of 554 MPa after hydrogen charging, which decreases by 9.77% before hydrogen charging, and the elongation decreases by 4.91%. The specimen with a surface residual compress stress of 293 MPa has a tensile strength of 572 MPa after hydrogen charging, which decreases by 7.44%. The elongation is 18.11%, which decreases by 3.71%.
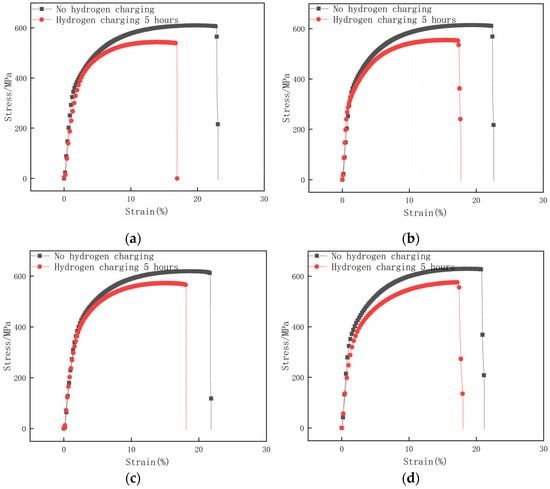
Figure 14.
Stress–strain curves of samples with different surface residual stress before and after hydrogen charging for 5 h. (a) M = −120 MPa; (b) M = −215 MPa; (c) M = −293 MPa; (d) M= −336 MPa.
Figure 15 shows the material properties’ change curves of different surface residual stress specimens after 5 h of hydrogen charging. Figure 15a illustrates the measured tensile strengths and elongation ratios of different surface residual compress stress specimens after hydrogen charging. The analysis of Figure 15a indicates that the tensile strength of each hydrogen-charged specimen positively correlates with the residual compress stress on the specimen surface, which means the tensile strength of each specimen increases monotonically with the increase in the specimen’s surface residual stress. However, the elongation of each hydrogen-charged specimen does not change monotonically with the variation of each specimen’s surface residual compress stress. The specimens’ elongation ratio tends to increase first and then decrease as the surface residual compress stress increases. The specimen with a surface residual compress stress of 293 MPa has the largest elongation after hydrogen charging.
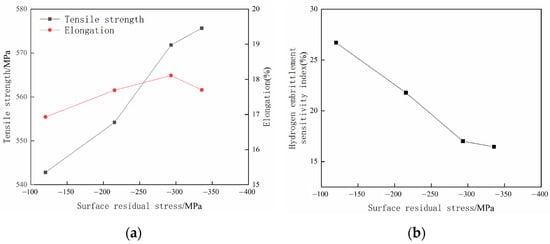
Figure 15.
The performance curves of samples with different surface residual stress after hydrogen charging for 5 h. (a) Curves of tensile stress and elongation; (b) hydrogen embrittlement sensitivity index curve.
Figure 15b shows the curve of the specimens’ hydrogen embrittlement sensitivity indexes. As illustrated in Figure 15b, it is evident that as the surface residual compress stress of the specimen increases, the specimens’ hydrogen embrittlement sensitivity index shows a decreasing trend. When the surface residual compress stress of the specimen falls within the range of 293–336 MPa, the decreasing trend of the specimens’ hydrogen embrittlement sensitivity indexes slows down. By comparison, it can be seen that the measured result of specimens with a surface residual compress stress of 336 MPa on tensile strength is 575 MPa after 5 h of hydrogen charging, which is the largest among the four groups of specimens. The tensile strength is about 8.49% higher than that before hydrogen charging, and the elongation is 17.7%, which is 3.49% lower than that before hydrogen charging. The hydrogen embrittlement susceptibility index is 16.45%, which is the lowest among the four groups of specimens.
The reasons for the phenomenon mentioned above are that when the hydrogen atom permeates into the material, the permeated hydrogen atoms concentrate under the influence of the internal stress field within the specimens’ material, leading to the formation of the hydrogen-containing brittle and hard substances, which increases the material’s brittleness and reduces the plasticity, ultimately resulting in a decrease in the tensile property of the specimens. Before the experiment, the specimens are processed by shot peening, which generates the surface residual compress stress and refines the microstructure of the surface and subsurface. The process also reduces the material’s lattice gap and increases the area of the unit grain boundary. Furthermore, the density of hydrogen traps in the material is also improved, the actual equivalent hydrogen pressure within the lattice under the same ambient hydrogen pressure reduces, and the permeation and intergranular diffusion of hydrogen atoms are inhibited, which slows down the erosion effect of hydrogen on the material. Therefore, as the surface compress stress of the specimen increases, the tensile strength of specimens after 5 h hydrogen charging also increases.
As the surface residual compress stress of the specimen increases, the erosive effect of hydrogen atoms on materials is inhibited, which slows down the erosion rate of hydrogen atoms to the specimen’s material. This reduces the brittleness of the specimen’s material, which in turn makes the specimen’s material exhibit a relatively good plastic mechanical property. This process usually manifests as the specimen’s elongation ratio increases with the specimen’s surface residual compress stress. However, the trend is slightly different from the surface of the specimen with a residual stress of 336 MPa due to the larger surface residual compress stress and more refined metal microstructure, which inhibits the tension process and reduces the extension length of the specimen during the tension fracture process. Therefore, the elongation curve of the specimen appears to increase first and then decrease, and the decreasing rate of the specimens’ hydrogen embrittlement susceptibility index also slows down.
Based on the analysis, the 336 MPa surface compress stress specimen has the best hydrogen permeation resistance among all the surface residual compress stress specimens.
5.4. Specimen Surface Integrity Processing Method
The influence laws of surface roughness and surface residual compress stress on hydrogen permeation resistance are obtained by conducting tests and analyzing specimens with various processing methods. Two processing methods are proposed based on the experimental conditions in this paper to enhance the materials’ surface integrity and hydrogen permeation resistance:
- (1)
- Using 80#-1200# sandpaper to grind the material surface, the final surface roughness of the material is about Ra 0.2 μm. The material under this surface roughness condition could have the best hydrogen permeation resistance. The surface effect of the specimen after processing according to this method is shown in Figure 16a.
 Figure 16. Specimens after processing according to the recommended process. (a) Grinding specimen; (b) shot peening specimen.
 - (2)
- Using shot peening to process the material surface, the diameter of the pellet is 0.5 mm, the shot peening pressure is 0.4 MPa, and the period of shot peening is 120 s. The residual compress stress on the material surface is about 340 MPa. The material under this surface residual compress stress condition could have the best hydrogen permeation resistance. The surface effect of the specimen after processing according to this method is shown in Figure 16b.
The specimens shown in Figure 16 all have a good hydrogen permeation resistance.
6. Conclusions
In this paper, the electrolytic hydrogen charging method is used to investigate the influence laws of low-alloy steel’s surface integrity on the hydrogen permeation resistance in a hydrogen production reactor. The specimens with different surface roughness and surface residual compress stress are hydrogen-charged. The influence laws of surface integrity on hydrogen permeation resistance are obtained by analyzing the variation of mechanical properties and calculating the hydrogen embrittlement sensitivity indexes of specimens under different pretreatments. Based on the experimental findings, the recommendations for processing parameters that enhance the material’s resistance to hydrogen permeation are provided. The conclusions of this study are as follows:
- (1)
- As the surface roughness of the specimen decreases, the hydrogen permeation resistance of the specimens increases and then decreases. Among all the different surface roughness specimens, the specimen with a surface roughness of Ra 0.17 μm has the best hydrogen permeation resistance. After 5 h of hydrogen charging, the tensile strength of the specimen is 576.35 MPa, which decreased by 5.69% before hydrogen charging, the elongation is 19.68%, which decreased by 5.22% before hydrogen charging, and the hydrogen embrittlement sensitivity is 20.96%.
- (2)
- As the surface compress residual stress increases, the hydrogen permeation resistance of the specimens increases. Among all different surface residual compress stress specimens, the specimen with a surface residual compress stress of 336 MPa has the best hydrogen permeation resistance. After 5 h of hydrogen charging, the tensile strength is 576.65 MPa, which is a decrease of about 8.49% compared with that before hydrogen charging, the elongation is 17.7%, which is 3.49% less than that before hydrogen charging, and the hydrogen embrittlement sensitivity is 16.45%.
Author Contributions
S.Z. and Y.L. conceived the idea of this work. Z.W., W.W. and J.Y. conducted the hydrogen-charging experiment; data curation, H.G.; original draft preparation, Z.L.; review and editing S.Z. and Y.L. All authors have read and agreed to the published version of the manuscript.
Funding
This research was funded by the National Key R&D Program of China (2020YFA0714403).
Institutional Review Board Statement
Not applicable.
Informed Consent Statement
Not applicable.
Data Availability Statement
The data used to support the findings of this study are available from the corresponding author upon request.
Conflicts of Interest
The authors declare no conflict of interest.
References
- Dawood, F.; Anda, M.; Shafiullah, G.M. Hydrogen production for energy: An overview. Int. J. Hydrogen Energy 2020, 45, 3847–3869. [Google Scholar] [CrossRef]
- Ohaeri, E.; Eduok, U.; Szpunar, J. Hydrogen related degradation in pipeline steel: A review. Int. J. Hydrogen Energy 2018, 43, 14584–14617. [Google Scholar] [CrossRef]
- Goutam, G.; Paul, R.; Rajnish, G.; Ashoutosh, P. Hydrogen induced cracking of pipeline and pressure vessel steels: A review. Eng. Fract. Mech. 2018, 199, 609–618. [Google Scholar]
- Spencer, G.L.; Duquette, D.J. The Role of Vanadium Carbide Traps in Reducing the Susceptibility to Hydrogen Embrittlement of High Strength Alloy Steels; US Army Armament Research and Engineering Center: New York, NY, USA, 1998; pp. 1–10. [Google Scholar]
- Yagodzinskyy, Y.; Todoshchenko, O.; Saukkonen, T.; Hnninen, H. Role of non-metallic inclusions in hydrogen-induced fracture of high-strength carbon steels. Metall. Mater. Trans. A 2014, 45, 4742–4747. [Google Scholar]
- Moro, L.; Gonzalez, G.; Brizuela, G.; Juan, A.; Simonetti, S. Influence of chromium and vanadium in the mechanical resistance of steels. Mater. Chem. Phys. 2007, 109, 212–216. [Google Scholar] [CrossRef]
- Fowler, J.D.; Chandra, D.; Elleman, T.S.; Payne, A.W.; Verghese, K. Tritium diffusion in A12O3 and BeO. J. Am. Ceram. Soc. 1977, 60, 155–161. [Google Scholar] [CrossRef]
- Kim, H.; Popov, B.N.; Chen, K.S. Comparison of corrosion-resistance and hydrogen permeation properties of Zn–Ni, Zn–Ni–Cd and Cd coatings on low-carbon steel. Corros. Sci. 2003, 45, 1505–1521. [Google Scholar] [CrossRef]
- Zhao, Y.Y.; Zhu, Y.F.; Shi, R.; Jia, Z.; Zhang, J.G.; Liu, Y.N.; Cheng, H.H.; Tang, Q.K.; Ba, Z.X.; Hu, X.H.; et al. Structural inhomogeneity: A potential strategy to improve the hydrogen storage performance of metal hydrides. J. Mater. Chem. A 2023, 11, 13255–13265. [Google Scholar] [CrossRef]
- Xue, J.H.; Cheng, A.D.; Bai, C.X.; Ji, L. Research on residual stress and hydrogen diffusion of X80 pipeline welded joint. Front. Mater. 2023, 20, 2325843. [Google Scholar] [CrossRef]
- Zhang, Y.; Wan, S.X.; Yang, R.; Dai, T.Y.; Zhang, N.; Xi, P.X.; Yan, C.H. Effect of Residual Stress on Hydrogen Diffusion in Flat Butt Welding Joints. ACTA Chim. Sin. 2020, 78, 1455–1460. [Google Scholar] [CrossRef]
- Asahi, K.; Shinji, Y.; Naofumi, O.; Hisamichi, K.; Akihisa, I. Mechanical Properties of Melt-Spun Amorphous Ni-Nb-Zr Alloys after Hydrogen Charging. Mater. Trans. 2006, 47, 1523–1526. [Google Scholar]
- Tanaka, Y.; Kikuchi, K. Dissolution of hydrogen produced by water electrolysis: Effects of electrode roughness factor and current density. Results Chem. 2023, 5, 100984. [Google Scholar] [CrossRef]
- Cui, Z.Y.; Liu, Z.Y.; Wang, L.W.; Li, X.G.; Du, C.W.; Wang, X. Effect of plastic deformation on the electrochemical and stress corrosion cracking behavior of X70 steel in near-neutral pH environment. Mater. Sci. Eng. A 2016, 677, 259–273. [Google Scholar] [CrossRef]
- Queiroga, L.R.; Marcolino, G.F.; Santos, M.; Rodrigues, G.; Santos, C.E.D.; Brito, P. Influence of machining parameters on surface roughness and susceptibility to hydrogen embrittlement of austenitic stainless steels. Int. J. Hydrogen Energy 2019, 44, 29027–29033. [Google Scholar] [CrossRef]
- Li, H.X.; Ding, F.T.; Zhou, Q.J.; Shi, Z.M.; Venezuela, J.; Yan, M.; Knibbe, R.; Zhang, M.X.; Atrens, A. Influence of hydrogen on the S-N fatigue of DP1180 advanced high-strength steel. Corros. Sci. 2022, 205, 110465. [Google Scholar] [CrossRef]
- López, S.A. Influence of surface roughness on consecutively hydrogen absorption cycles in Ti–6Al–4V alloy. Int. J. Hydrogen Energy 2010, 35, 10404–10411. [Google Scholar] [CrossRef]
- Kim, J.; Hall, D.; Yan, H.X.; Shi, Y.; Joseph, S.; Fearn, S.; Chater, R.J.; Dye, D.; Tasan, C.C. Roughening improves hydrogen embrittlement resistance of Ti-6Al-4V. Acta Mater. 2021, 220, 117304. [Google Scholar] [CrossRef]
- Deconinck, L.; Bernardo, Q.E.; María, V.V.T.; Jägle, E.A.; Verbeken, K.; Depover, T. The mechanism behind the effect of building orientation and surface roughness on hydrogen embrittlement of laser powder bed fused Ti-6Al-4V. Addit. Manuf. 2023, 72, 103613. [Google Scholar] [CrossRef]
- Oezen, F.; Dam, U.; Ilhan, A.; Sezan, H.T.; Aslanlar, S. Effect of shot peening duration on fatigue life of galvanized and non-galvanized pearlitic high strength helical compression springs. Surf. Rev. Lett. 2023, 30, 2350064. [Google Scholar] [CrossRef]
- Li, X.; Wang, Y.; Huang, W.H.; Zhang, J.; Wu, X.B. Effect of surface roughness on hydrogen-induced blister behavior in pure iron. Metals 2020, 10, 745. [Google Scholar] [CrossRef]
- Kawamori, M.; Urushihara, W.; Yabu, S. Improved Hydrogen Embrittlement Resistance of Steel by Shot Peening and Subsequent Low-temperature Annealing. ISIJ Int. 2021, 61, 1159–1169. [Google Scholar] [CrossRef]
- Huang, S.; Li, H.Y.; Zhang, H.; Sheng, J.; Agyenim, B.E.; Lu, J.Z. Experimental study and finite element simulation of hydrogen permeation resistance of Ti-6Al-4V alloy strengthened by laser peening. Surf. Coat. Technol. 2020, 400, 126217. [Google Scholar] [CrossRef]
- Kumar, G.R.; Muralidharan, A.; Rajyalakshmi, G.; Swaroop, S. Atom probe tomography analysis of hydrogen distribution in laser peened Ti6Al4V alloy to control hydrogen embrittlement. Int. J. Adv. Manuf. Technol. 2021, 114, 1395–1408. [Google Scholar] [CrossRef]
- Hassan, H.; Govind, K.; Hartmaier, A. Micromechanical modelling of coupled crystal plasticity and hydrogen diffusion. Philos. Mag. 2019, 99, 92–115. [Google Scholar] [CrossRef]
- Agyenim, B.E.; Huang, S.; Sheng, J.; Yuan, G.; Wang, Z.W.; Zhou, J.Z.; Feng, A.X. Influence of laser peening on the hydrogen embrittlement resistance of 316L stainless steel. Surf. Coat. Technol. 2017, 328, 44–53. [Google Scholar] [CrossRef]
- Takakuwa, O.; Nishikawa, M.; Soyama, H. Numerical simulation of the effects of residual stress on the concentration of hydrogen around a crack tip. Surf. Coat. Technol. 2012, 206, 2892–2898. [Google Scholar] [CrossRef]
- Yang, J.G.; Liu, G.H.; Zheng, W.J. Study on hydrogen diffusion behavior during welding of heavy plate. Materials 2020, 13, 3887. [Google Scholar] [CrossRef]
- Sato, Y.; Murakami, Y.; Satoshi, I.; Ishikawa, N. Critical Conditions of Cold Cracking in High Strength Steel Weld Based on the Local Stress Distribution and Hydrogen Accumulation. Mater. Sci. Forum 2018, 941, 153–157. [Google Scholar] [CrossRef]
- Jiang, W.C.; Luo, Y.; Zhang, X.L.; Zhang, Q.; Zhang, W.Y. Effect of Helix Angle on Hydrogen Diffusion of Spiral Weld Pipe. J. Eng. Mater. Technol. 2018, 140, 011009. [Google Scholar] [CrossRef]
- ISO 6892-1:2019; Metallic Materials—Tensile Testing—Part 1: Method of Test at Room Temperature. Comite Europeen de Normalisation: Brussels, Belgium, 2019.
- Jeong, Y.J.; Kim, S.J. Possibility of false interpretations of hydrogen measurements in ferritic steel after an electrochemical cathodic charging process. Int. J. Hydrogen Energy 2020, 46, 10. [Google Scholar] [CrossRef]
- Qin, S.J.; Yin, J.Q.; Liu, S.; Chen, Y.D.; Gu, J.Y. Mechanical properties test and simulation analysis of glass coated amorphous filaments. J. Phys. Conf. Ser. 2021, 1995, 012011. [Google Scholar] [CrossRef]
- Xue, Y.Q.; Luan, C.H.; Fan, J.C. The effect of rough surfaces on chemical corrosions of metals. Mater. Rep. 1998, 12, 23–24. [Google Scholar]
- Li, J.H.; Peng, Y.; Tang, X.Q.; Liu, B.; Bai, L.C.; Zhou, K. Hydrogen-passivation modulation on the friction behavior of graphene with vacancy defects under strain engineering. Appl. Surf. Sci. 2022, 579, 152055. [Google Scholar] [CrossRef]
- Jiang, J.; Zeng, W.; Li, L. Effect of Residual Stress on Hydrogen Diffusion in Thick Butt-Welded High-Strength Steel Plates. Metals 2022, 12, 1074. [Google Scholar] [CrossRef]
- Zhong, W.; Cai, Y.; Tománek, N.D. Computer simulation of hydrogen embrittlement in metals. Nature 1993, 362, 435–437. [Google Scholar] [CrossRef]
- Pressouyre, G.M.; Bernstein, I.M. A kinetic trapping model for hydrogen-induced cracking. Acta Metall. 1979, 27, 89–100. [Google Scholar] [CrossRef]
Disclaimer/Publisher’s Note: The statements, opinions and data contained in all publications are solely those of the individual author(s) and contributor(s) and not of MDPI and/or the editor(s). MDPI and/or the editor(s) disclaim responsibility for any injury to people or property resulting from any ideas, methods, instructions or products referred to in the content. |
© 2023 by the authors. Licensee MDPI, Basel, Switzerland. This article is an open access article distributed under the terms and conditions of the Creative Commons Attribution (CC BY) license (https://creativecommons.org/licenses/by/4.0/).