Abstract
The adequate interfacial pressure of silicone rubber in cable intermediate joints is a basic condition to ensure the normal operation of cable joints, while high temperature and ageing in the operation of actual cables and accessories would affect the magnitude of interfacial pressure. The uniaxial tensile force of two different silicone rubbers for 10 kV cold-shrink joints at different temperatures and thermal ageing times was measured by experiment, and the Yeoh rubber intrinsic structure model was fitted according to the measured data. The material model was embedded into a two-dimensional axisymmetric finite element simulation model of the structure, and the relationship between the interference, temperature, thermal ageing time and interfacial pressure was investigated. The results show that the interfacial pressure increases linearly with the increase in interference. At the same interference, the interfacial pressure at the root of insulating silicone rubber and semiconducting silicone rubber increased by 9.1%, 12.3%, 6.4% and 9.2%, 16.3%, 5.6%, respectively, at 50, 75, and 100 °C compared with room temperature, and the largest interfacial pressure of cable joints was at 75 °C. Using the established ageing life prediction model based on the Arrhenius principle, the service life of the accessories was predicted to be 28.9 years at 90 °C of operating temperature and interfacial pressure greater than 55% of initial interfacial pressure.
1. Introduction
Cable joints are the vulnerable components where cable accidents occur. Insufficient interface pressure between cable accessories and cross-linked polyethylene is one of the significant causes of insulation breakdown in joints. Therefore, to prevent breakdown accidents, the interface pressure of cable joints should be controlled within a reasonable range [1,2,3,4]. Previous studies have shown that when the interface pressure between cable accessories and the main insulation is between 0.1 and 0.25 MPa, it can meet the electrical strength requirements [5]. The heating of cable cores can lead to an increase in the temperature of accessory insulation materials, affecting the mechanical performance of silicone rubber materials in accessories. Additionally, the prolonged high-temperature operation of accessories can cause aging and deterioration of the mechanical performance of silicone rubber [6]. Therefore, studying the interface pressure of cable accessories after temperature rise and aging is of great significance.
Currently, many studies have been conducted on the factors influencing the interface pressure of cable accessories both domestically and internationally. Wang Z did not consider the silicone rubber material as a hyperelastic material in the finite element simulation of interfacial pressure, and did not utilize the intrinsic model to simulate the nonlinear change in elastic modulus during the nonlinear change in the hyperelastic material [6]. The model designed by Jia does not take into account the effect of thermal expansion due to the high operating temperatures on the calculated values [7]. Xie Q confirms that the Yeoh model can describe the mechanical properties of silicone rubber materials well, and has high computational efficiency and computational stability [8]. Tian Z et al. studied the close relationship between interface pressure and Young’s modulus by utilizing a series of finite element models established using ANSYS for cable accessories [9]. Normand Amyot studied the effect of temperature on interfacial pressure, but did not study the effect of temperature on the modulus of elasticity of silicone rubber or the effect of aging on interfacial pressure [10]. Wang X analyzed the effect of extreme high and low temperatures on interfacial pressure, but did not study the effect of high temperatures (150 °C, 170 °C) on interfacial pressure [11]. Based on the mechanical properties of the material itself, some researchers considered the thermal expansion effect of the material and conducted simulation analysis on the magnitude of the impact of different factors on the interface pressure of the accessory surface. However, there has been limited research on the actual aging process in this study [12,13]. Abbas Ghaderi and others studied the variations in interface pressure of cable intermediate joints under simulated cyclic temperature conditions in real operating conditions. However, they did not consider the influence of cyclic temperature under different aging durations on the interface pressure [14]. At present, there are more studies at home and abroad on the effect of temperature on the partial discharge, breakdown field strength and electrical field distribution of silicone rubber fabricated parts and cable intermediate joints, while there are fewer studies on the effect of temperature on the interfacial pressure of cable intermediate joints [15,16,17].
In summary, existing research mainly focuses on the interface pressure of cable accessories under normal temperature conditions, and there is a lack of data on tensile stress–strain and constitutive model parameters of silicone rubber materials in accessories under high-temperature and aging conditions. There is also limited research on the changes in interface pressure in temperature variation environments for cable joints. Therefore, in this study, taking a 10 kV cold-shrink cable intermediate joint as an example, the stress–strain data of silicone rubber materials in the accessory were determined through uniaxial tension tests under high-temperature environments and different durations of thermal aging. Based on the experimental data, the hyperelastic Yeoh constitutive model of silicone rubber was fitted, and a simplified two-dimensional axisymmetric finite element model of the intermediate joint was established. The simulation was used to analyze the effects of temperature and thermal aging on the interface pressure of the accessory silicone rubber.
2. Materials and Methods
2.1. Tensile Test of Cable Joint Accessories
According to the actual materials used in the production of the YJJI7 10 kV cold shrinkable middle joint by the Guodian Changyuan Electric Power Limited Liability Company, we commissioned the company to manufacture black sheets made of the same materials as the insulation silicone rubber and semiconductive silicone rubber sections of the 10 kV cold shrinkable middle joint. The production of the black sheets should adhere to the same level of craftsmanship as the silicone rubber used in the cold shrinkable cable accessories. The dimensions of the insulation silicone rubber and conductive silicone rubber black sheets were 1000 mm × 1000 mm × 2 mm. The sheets were cut into dumbbell-shaped II specimens using a dedicated cutting tool, as shown in Figure 1. The narrow part of the specimen had an average width of 4 mm and an average thickness of 2 mm. The gauge length of the specimen was 25 mm, and the average length of the specimen was 75 mm.
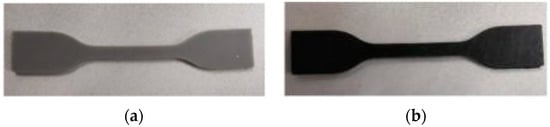
Figure 1.
Dumbbell-type silicone rubber sample. (a) Insulating silicone rubber (materials selected from Figure 5, 6—accessory insulation); (b) semiconductive silicone rubber (materials selected from Figure 5, 1—stress cone).
Due to the external armored tape wrapping of the three-core cable accessory and the sealed internal environment of the joint, the heat transfer coefficient was low, resulting in a temperature difference of less than 7 °C between the outer and inner surfaces of the accessory [18]. Therefore, in this study, when calculating the interface pressure, it was assumed that the temperature was equal at all locations of the accessory. To enhance the accuracy of the tests, the heating chamber temperature of the high-temperature tensile testing machine was set to 25 °C, 50 °C, 75 °C, and 100 °C, simulating the environmental temperature of the cable accessories. The samples needed to be preheated for 5–8 min before the tensile test. The samples were clamped onto the fixed fixture for the tensile test (with the tensile force set to zero before the test). Each set of tensile tests were repeated three times.
Accelerated aging tests were conducted on the samples using the DHG-9425A blast drying oven manufactured by Shanghai Yiheng Scientific Instrument Limited Liability Company. The aging temperatures were set at 130, 150, and 170 °C, and the aging time was 120 h. After aging had been completed, the samples were taken out and allowed to rest for 30 min at room temperature before conducting the tensile tests.
Uniaxial tensile tests were performed using an FL-GD type tensile testing machine produced by Fu le Instrument Technology Limited Liability Company. The tensile rate was set at 500 mm/min. In order to reduce the influence of environmental factors and differences between specimens, the average tensile values of the three specimens were selected as the test results.
Figure 2 and Figure 3 show the stress–strain curves of the insulation silicone rubber and semiconductive silicone rubber of the accessory at different temperatures. It can be observed from Figure 2 and Figure 3 that the mechanical properties of the insulation silicone rubber and semiconductive silicone rubber were highly influenced by temperature. At the same elongation rate, both materials exhibited the lowest stress at room temperature (25 °C). As the temperature increased, the tensile stress of the insulation silicone rubber and semiconductive insulation rubber initially increased and then decreased, with the maximum tensile stress occurring at 75 °C. During the tensile deformation of the accessory silicone rubber, the molecular chains became stretched, leading to increased orderliness and decreased entropy. Due to molecular thermal motion, the molecules spontaneously returned to their original state, resulting in increased entropy and generating elastic recovery force. As the temperature rose, the tendency of entropy recovery became stronger, resulting in an increase in elastic modulus [19]. When the temperature exceeded 75 °C, considering the thermal effects and volumetric expansion, the effective cross-linking density decreased, weakening the interactions between molecules and chain segments, leading to a decrease in stress.
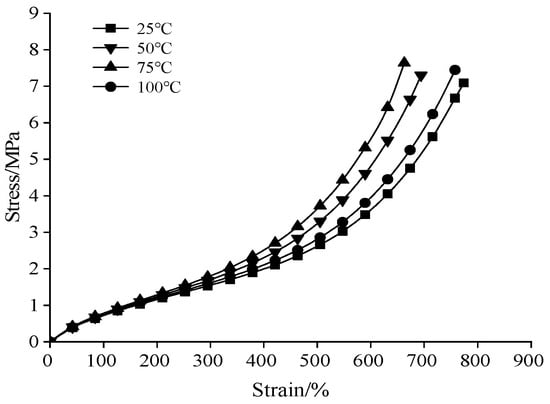
Figure 2.
Stress–strain curves of insulating silicone rubber at different temperatures.
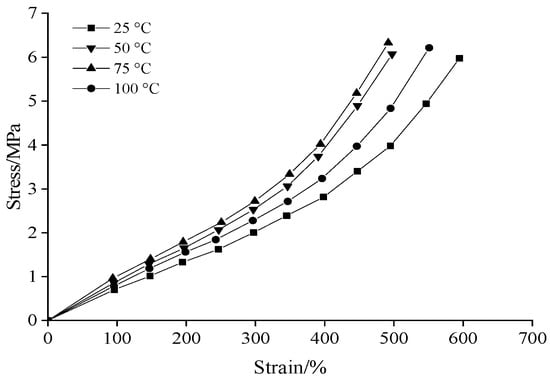
Figure 3.
Stress–strain curves of semi-conductive silicone rubber at different temperatures.
The stress–strain curves of silicone rubber under thermal aging conditions at 30, 150, and 170 °C are shown in Figure 4. For clarity reasons, only the stress–strain curves for aging durations of 96 h, 360 h, and 720 h at temperatures of 150 and 170 °C are presented in Figure 4c,d.
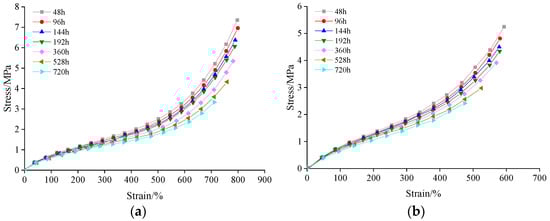
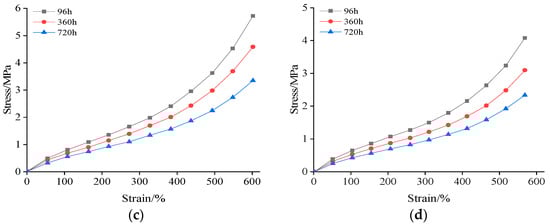
Figure 4.
(a) Stress–strain curves of insulating silicone rubber after ageing different times at 130 °C; (b) stress–strain curves of semiconductive silicone rubber with different aging times at 130 °C; (c) stress–strain curves of semiconductive silicone rubber at different aging durations at 150 °C; (d) stress–strain curves of semiconductive silicone rubber at different aging durations at 170 °C.
From Figure 4, it can be observed that with an increase in aging time, the tensile stress decreased and the mechanical properties deteriorated at the same elongation rate. The stress–strain responses of both materials exhibited nonlinear elastic characteristics. This nonlinear behavior remained consistent as the material temperature increased and aging time extended.
2.2. Simulation Model
The study focuses on a 10 kV cold shrink cable mid-joint. A two-dimensional (2D) axisymmetric model of the joint was constructed, and its simulated structure is shown in Figure 5. To reduce computational complexity, a simplified cable joint model was used, consisting of copper cores, cross-linked polyethylene, stress cones, high-voltage shielding tubes, insulation of the cable accessory, insulation tape, and crimping tubes. The stress cones and high-voltage shielding tubes were made of semi-conductive silicone rubber, while the accessory insulation was made of insulation silicone rubber. The stress cones, high-voltage shielding tubes, and insulation rubber were heat cured to form a complete joint assembly. The cable cold shrink accessory was assembled with the main cross-linked polyethylene (XLPE) insulation of the cable, creating an interface with different media. The silicone rubber of the accessory underwent compression deformation with a certain interference fit, generating pressure at the composite interface.
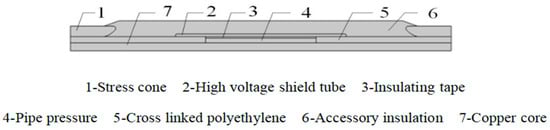
Figure 5.
The 10 kV cable joint simulation model structure.
In the finite element simulation analysis, a penalty function analysis method was used to solve the geometric nonlinearity issue of silicone rubber. When two boundaries are compressed against each other, a virtual unit is established between the nodes of the two contact surfaces to simulate the surface-to-surface contact. To simulate the interface pressure of actual cable accessories, the assembly was defined in the model by creating contact pairs. The silicone rubber was set as the contact body, while the cross-linked polyethylene (XLPE) was set as the target body (i.e., elements 1, 6, and 2 in Figure 5 were set as the contact body, and elements 3 and 5 were set as the target body, with no contact defined between elements 1, 6, and 2). The amount by which the contact surface deviates from the geometric target body surface is referred to as the overload. A displacement load (i.e., overload) was set instead of boundary loads. The physics field was set with solid mechanics, and the upper boundary of the two-dimensional attachment model was set as a free boundary. Two points along the axis of symmetry were fixed constraints. In the mesh division of the two-dimensional model, the focus was on the deformation and stress of the silicone rubber on the interference fit surface. Therefore, the silicone rubber was divided into a finer mesh, while the mesh for cross-linked polyethylene and copper core models was coarser. The silicone rubber material in the cable mid-joint accessory undergoes minimal volume change during compression deformation and is typically considered an approximately incompressible and isotropic hyperelastic material. The deformation process is complex and highly nonlinear. Therefore, this study was based on the Yeoh hyperelastic constitutive model for rubber. Three material parameters, , , and , related to the strain energy density function, were utilized to calculate the interface pressure.
2.3. The Stress–Strain Relationship Determines the Silicone Rubber Constitutive Model
Under the assumption that silicone rubber is isotropic, the strain energy density function is expressed as [20].
where W is the strain energy density, and , and are the three invariants of the Green deformation tensor.
where are the principal stretches.
Equation (1) can be approximated by the power series:
Due to the incompressibility of the silicone rubber material, and Equation (5) reduces to
To simplify the problem, consider the case where let , and Equation (6) reduces to
N and are input parameters. In practical applications, N is typically set to 3. Substituting these values into Equation (7), we obtain Equation (8).
In Equation (5), W represents the strain energy density. I1 is the first invariant of the Green strain. , , and are Yeoh coefficients. is one half of the initial shear modulus at small strains. At small strains, the rubber–filler network is not damaged, and only comes into play. The negative value of reflects the softening process of the material during moderate deformation. The positive value of reflects the hardening of the material during large deformation.
The Yeoh constitutive model demonstrates high fitting accuracy and is in accordance with the uniaxial tensile mechanical behavior of silicone rubber. In this paper, the stress–strain data obtained from the test were imported into Origin software, and nonlinear curves were used to fit the material constitutive model parameters , , and . The constitutive model parameters for insulation silicone rubber and semiconductor silicone rubber at room temperature (25 °C) and elevated temperatures of 50 °C, 75 °C, and 100 °C are presented in Table 1 to Table 2, respectively. It can be observed that the initial shear modulus was the highest for both insulation and semiconductor silicone rubber at 75 °C. The fitting parameters for insulation silicone rubber and semiconductor silicone rubber aged for 48 h, 96 h, 144 h, 192 h, 360 h, 528 h, and 720 h at 130 °C are shown in Table 3 to Table 4. It can be observed that with increasing aging time, the initial shear modulus continuously decreased.

Table 1.
Fitting results based on Yeoh model for insulating silicone rubber at different temperatures.
Table 2.
Fitting results based on Yeoh model for semi-conductive silicone rubber at different temperatures.
Table 3.
Fitting results based on Yeoh model for insulating silicone rubber after ageing at 130 °C.
Table 4.
Fitting results based on Yeoh model for semi-conductive silicone rubber after ageing at 130 °C.
2.4. Theoretical Calculation of Interfacial Pressure
The rubber constitutive relationship is defined by the strain energy density function, as shown in Equation (9) [21].
In Equation (9), presents the Cauchy stress deviator, and DEV [.] denotes the deviatoric part of the tensor [.]. W is the strain energy density function per unit undeformed volume. and are the first and second invariants of the Cauchy–Green deformation tensor, respectively. J represents the volume ratio before and after the deformation of the silicone rubber. , where F is the deformation gradient tensor of the silicone rubber.
The three principal stretches (I = r, θ, z) of axisymmetric plane strain are shown in Equation (10).
In Equation (10), R is the radius of silicone rubber before deformation; r is the radius of silicone rubber after deformation. Equation (11) can be obtained by combining Equation (9).
In Equation (11), is the radial stress; is a circumferential stress.
The pressure balance equation of the semi-conductive material is Equation (12).
Equation (13) can be obtained by connecting the lines Equations (8), (11), and (12).
Equation (14) is obtained by considering the rubber’s approximate incompressibility.
In Equation (14), and , respectively, represent the radial stress and radial deformation of the semi-conductive layer at , represent the radius of silicone rubber before deformation, and represent the radius of silicone rubber after deformation.
For the insulation layer, the radial stress on the outer surface of the insulating silicone rubber was 0, and the radial stress expression where the inner diameter of the insulation layer is can be calculated by connecting Equations (13) and (14), as shown in Equation (15), where is the outer diameter of the joint.
For the semi-conductive layer, radial stress at and radial deformation at in semiconductive silicone rubber are represented by and , respectively. and represent the initial and final radii of the semiconductive silicone rubber, respectively. Therefore, Equation (16) is given.
By using Equations (13) and (16), the expression for the radial stress at the inner diameter of the cable joint can be calculated, as shown in Equation (17).
Let represent the deformation that occurs in the cable layer at . Due to the continuity of longitudinal stress and contact interface deformation, the radial stress in the cable layer at is denoted as . represents the elastic modulus of XLPE, and represents the Poisson’s ratio of XLPE.
The deformation relation of the interference fit interface is Equation (19).
Equation (20) can be obtained from the near incompressibility of the semiconducting rubber layer.
By simultaneously solving Equations (9)–(14), the interface pressure between the cable joint and the cable insulation XLPE, as well as the radial stress and deformation of the cable insulation XLPE, can be determined.
2.5. Distribution of Interfacial Pressure
In order to study the distribution of interface pressure in cable joints, the constitutive model parameters of the attached silicone rubber were incorporated into the simulation model at temperatures of 25 °C, 50 °C, 75 °C, and 100 °C (this ideal model does not take into account other phenomena in rubber-like materials, such as viscoelasticity (relaxation) and irreversible phenomena on interfacial pressure). An interference fit of 1.5 mm was assumed. The stress contour map of the cable joint is shown in Figure 6, and the stress distribution and displacement deformation of the insulation silicone rubber in the radial direction are shown in Figure 7.
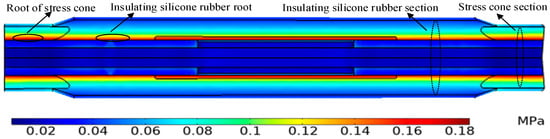
Figure 6.
Maps of stress distribution for cable joints.
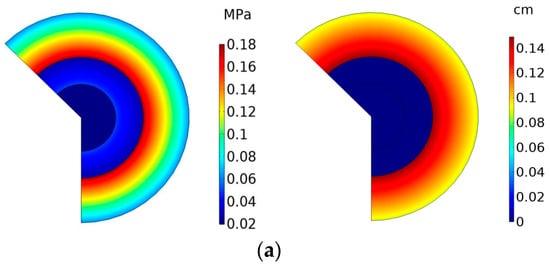
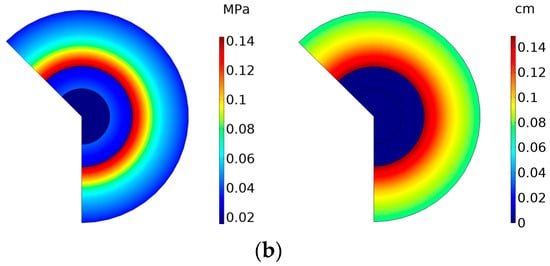
Figure 7.
Stress distribution and displacement field. (a) Stress cone section stress diagram and displacement field; (b) insulation silicone rubber section stress diagram and displacement field.
Analyzing Figure 6 to Figure 7, the following observations can be made. The cable joint is an axisymmetric structure, and the interface pressure in the middle joint is symmetrically distributed. The stress magnitudes are equal on the same radius circumference. Maximum deformation occurs at the interference fit between the attachment and the cross-linked polyethylene (XLPE). The characteristic feature is that the displacement deformation gradually decreases from the inner side to the outer side of the joint. The maximum stress occurs at the interface between the attachment and the XLPE contact surface. The characteristic feature is that the stress gradually decreases from the inner side to the outer side of the joint.
Figure 8 shows the interface pressure at the root of the insulation silicone rubber and the semiconductive silicone rubber as a function of the interference fit. From the graph, it can be observed that the interface pressure linearly increases with the interference fit. For every 0.5 mm increase in interference fit, the interface pressure at the root of the insulation silicone rubber increases by 0.0455 MPa, and the interface pressure at the root of the semiconductive silicone rubber increases by 0.0577 MPa.
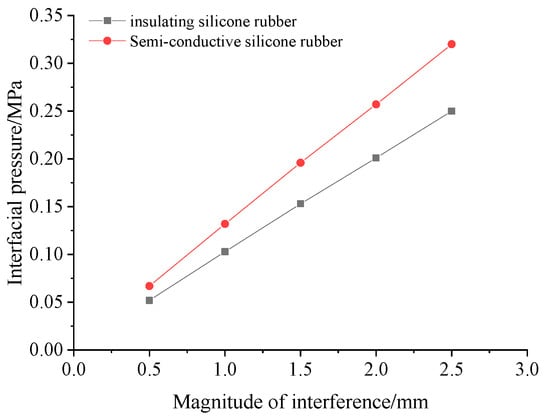
Figure 8.
Interfacial pressure and interference volume.
In order to study the axial interface pressure more intuitively, the joint interface pressure data along the composite interface of the joint were collected, with the left end of the stress cone defined as the origin and the positive direction towards the right. The interface pressure distribution of the joint is shown in Figure 9.
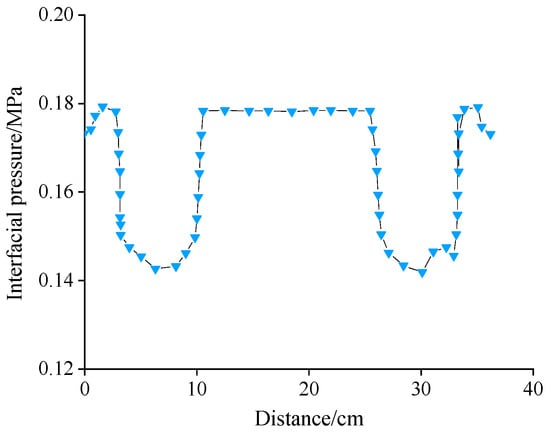
Figure 9.
The upward pressure distribution of the cable joint shaft.
The stress cone structure was present at both ends of the 10 kV cable cold-shrink attachment, and the stress cone interface pressure was generated by the compression deformation of the semi-conductive silicone rubber. As seen in Figure 10, the pressure at the outer end of the attachment was 0.173 MPa, and it increased to 0.180 MPa at 1.1 cm and then significantly decreased to 0.146 MPa at 3.2 cm. This is because the thickness of the stress cone decreased, the insulating silicone rubber thickness increased, and the elastic modulus of insulating silicone rubber was less than the stress cone silicone rubber. The modulus of elasticity was smaller than the stress cone silicone rubber modulus, and the modulus of elasticity on the calculation of mechanical properties had a greater impact. The minimum interfacial pressure at the root of the silicone rubber was 0.143 MPa, which rose significantly to 0.179 MPa at 10.1 cm due to the fact that the inner material of the cable attachment was a high-voltage shielding tube, which had a higher modulus of elasticity than that of the insulating silicone rubber. Due to the axisymmetric structure of the cable joint, the pressure variation trends were the same at both ends.
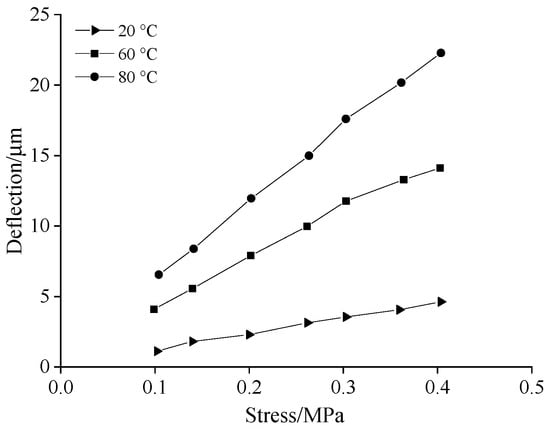
Figure 10.
Radial displacement of XLPE at different interface pressures.
A theoretical analysis and finite element numerical simulation were conducted to determine the interface pressures at the weak points of the cable joint, including the interface between the joint insulation and XLPE, the interface between the stress cone root and XLPE, and the interface between the high-voltage shielding tube and XLPE. The results of the theoretical analysis and finite element numerical simulation were compared and presented in Table 5. From Table 5, it can be observed that there was minimal difference between the theoretical calculations and simulation results, with a deviation of less than 2%. The high level of agreement between the two demonstrates their consistency.
Table 5.
The calculation result of the composite interface pressure of the cable joint.
3. Results
To study the influence of interface pressure on the deformation of XLPE (cross-linked polyethylene) in different temperatures, we assumed the 10 kV cable copper core to be rigid with a diameter of 15 mm, and the insulation thickness to be 6 mm. Based on the temperature-dependent values of the elastic modulus of cross-linked polyethylene measured, the relationship between the radial displacement of XLPE and pressure was calculated and shown in Figure 10.
From Figure 10, it can be observed that under the influence of interface pressure, XLPE undergoes a certain radial displacement. As the temperature increased, the elastic modulus of XLPE decreased, leading to an increase in the radial displacement. At an interface pressure of 0.2 MPa, the deformations of XLPE at 20 °C and 80 °C were 2.3 μm and 12 μm, respectively. This corresponds to strain levels of approximately 0.15% and 0.8%. The compressive deformation of the cable’s XLPE can be neglected with increasing temperature.
To investigate the effect of temperature on the interface pressure of the cable’s intermediate joint, the constitutive model parameters of the accessory silicone rubber at temperatures of 50 °C, 75 °C, and 100 °C were incorporated into the simulation model. The stress distribution in the cable joint with an interference fit of 1.5 mm under different temperatures is shown in Figure 11, indicating that the interface pressure was highest at 75 °C.
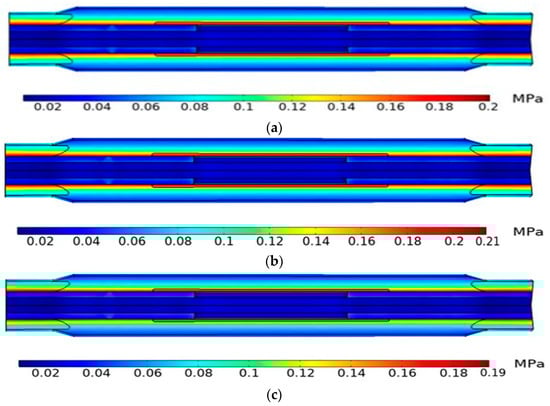
Figure 11.
Maps of stress distribution for cable joints at different temperatures. (a) 50 °C; (b) 75 °C; (c) 100 °C.
The relationship between the interface pressures at the stress cone and insulation silicone rubber root interfaces and temperature, with interference fits of 1.5 mm and 2 mm, is presented in Figure 12. From Figure 12, it can be observed that compared to room temperature, the interface pressures at the insulation silicone rubber and semi-conductive silicone rubber root interfaces exhibited the greatest increase at 75 °C, reaching 12.3% and 16.3%, respectively. The accessory silicone rubber in the cable was a high polymer composed of flexible macromolecular chains, exhibiting high elasticity under external stretching due to conformational changes in the macromolecular chains. The macromolecular chains had a strong dependence on temperature. According to the elastic modulus formula of cross-linked rubber elastic bodies, the elastic modulus is proportional to temperature and the effective cross-linking density of the elastic body [22,23,24]. When the insulation silicone rubber and semiconductive silicone rubber were subjected to temperatures between 25 °C and 75 °C, the elastic modulus increased, with an increase in conformational entropy as the dominant factor. When the insulation silicone rubber and semiconductive silicone rubber were subjected to temperatures between 75 °C and 100 °C, the volume expanded, creating more free space between the molecular chains. This increased the thermal motion and activity of the molecular chains, resulting in a decrease in the effective cross-linking density and a weakening of the interactions between molecules and chain segments. This macroscopically manifested as a decrease in the rubber’s elastic modulus. It indicates that the effective cross-linking density had a major contribution to the elastic modulus of the silicone rubber when the temperature exceeded 75 °C.
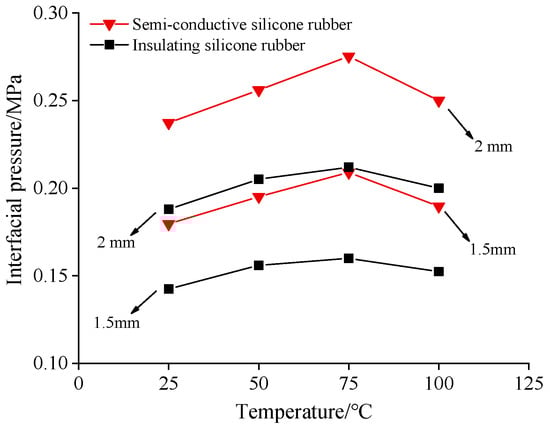
Figure 12.
Interfacial pressure at the root of silicone rubber at different temperatures.
4. Discussions
4.1. Degree of Interface Pressure Reduction
When the cable accessories were tightly fitted with the cable, the compression of the silicone rubber caused deformation, storing strain energy within the volume of the silicone rubber. To investigate the effect of thermal aging on the strain energy density at the stress concentration unit, data from 192 h thermal aging at 130 °C were selected for calculation, and the results are shown in Figure 13.
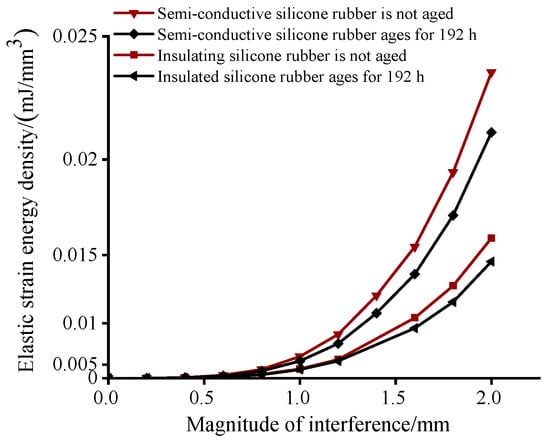
Figure 13.
Elastic strain energy density curves of silicone rubber with different ageing times.
From Figure 13, it can be observed that the elastic strain energy density of both types of silicone rubber in the accessories increased with the increase in interference fit. Under the same interference fit, the elastic strain energy density of the semiconductor silicone rubber was greater than that of the insulating silicone rubber. After aging, the strain energy density of both types of silicone rubber decreased. At 192 h of aging and an interference fit of 2 mm, the strain energy density of the semiconductor silicone rubber decreased by 13.3%, while that of the insulating silicone rubber decreased by 10.0%.
As the aging time increases, the slope of the strain energy density function decreased, reflecting a decrease in the energy stored per unit volume of the silicone rubber and a reduction in the mechanical properties of the silicone rubber, resulting in a decrease in interfacial pressure.
To study the change in interfacial pressure of the cable accessories after thermal aging, stress–strain curves of the semiconductor silicone rubber were obtained through thermal aging experiments at temperatures of 130 °C, 150 °C, and 170 °C for aging durations of 48, 96, 192, 360, 528, and 720 h. The degree of interfacial pressure reduction at each aging time node under the same interference fit was calculated, as shown in Figure 14.
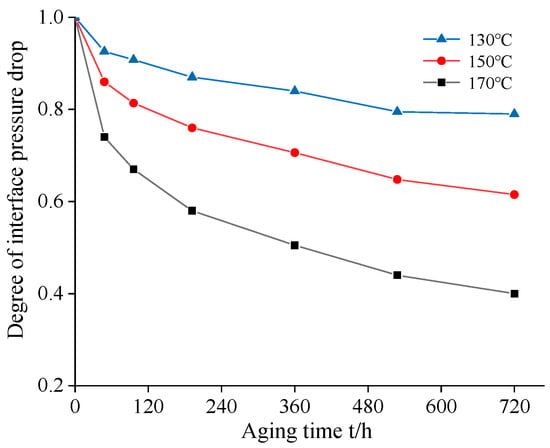
Figure 14.
Curves of interfacial pressure drop with aging time.
From Figure 14, it can be seen that under the same interference fit condition, the interfacial pressure of the cable accessories decreased with the increase in aging time. Furthermore, the decrease in interfacial pressure exhibited a pattern of initially fast reduction, followed by a slower rate of change as aging progressed. At 130 °C aging for 192 h, the interfacial pressure at the root of the stress cone decreased by 13.6%. Meanwhile, at the same aging time, when the thermal aging temperature was 150 °C, the interfacial pressure at the root decreased by 24.5%. By comparing the rate of change in interfacial pressure at different thermal aging temperatures, it can be observed that temperature plays a crucial role in the thermal aging rate. The higher the temperature of thermal aging, the more pronounced the impact on the interface pressure of silicone rubber at the root.
In the early stage of thermal aging, cross-linking reactions occur within the silicone rubber samples, resulting in a more compact network structure inside the material. The increased cross-linking inhibits the sliding between polymer chains, reduces the flexibility of the polymer, and disrupts the original high elasticity of the silicone rubber, resulting in a decrease in the interfacial pressure at the root of the insulating silicone rubber. When the insulating silicone rubber is exposed to long-term high temperatures, the movement of molecular chains intensifies. When the energy required to break the chemical bonds is exceeded, thermal degradation of the polymer chains occurs. As the aging time increases, thermal degradation reactions gradually dominate, leading to severe molecular chain breakage in the silicone rubber material. This results in a decrease in its mechanical properties, ultimately reducing the elasticity of the silicone rubber and even causing a loss of elasticity [25].
4.2. Aging Prediction Model
The reduction rate of aging performance in silicone rubber is commonly referred to as the degree of aging (P). In this study, the degree of reduction in interface pressure at the root of the silicone rubber before and after aging was used to represent the aging level.
At a certain temperature T, the interface pressure generated by rubber deformation decreases over time. The degree of interface pressure reduction P and aging time (t) are fitted using the modified equation proposed [26], as shown in Equation (21).
In Equation (21), P represents the ratio between the interface pressure at any given time t and the initial pressure . is a temperature-independent constant, and k is a temperature-dependent rate constant. At a certain temperature, the relationship between the rate constant k and the aging temperature T follows the Arrhenius equation, as shown in Equation (22).
In Equation (22), A represents the collision factor; E represents the apparent activation energy; R represents the gas constant; and T represents the aging temperature. The unknown parameters are solved using an iterative approach, and the convergence criterion is to minimize the value of I in Equation (23).
In Equation (23), I represents the convergence criterion; represents the experimental values of the j-th performance at the i-th temperature; and represents the calculated values of the j-th performance at the i-th aging temperature. By computing, the minimum value of I is obtained when .
Using a linear relationship equation between and obtained from fitting Equation (21), rate constants at various temperatures can be determined, namely , , and . To transform Equation (22) into a linear relationship, a logarithmic transformation is applied, resulting in Equation (24). The values of , , and are logged, and a linear fit is performed on and .
In Equation (24), . The coefficients C and D of the linear equation are calculated using the least squares method.
The r was used to verify the linear correlation of the equation, and Equation (25) is the equation for calculating the correlation coefficient r:
Setting q = 4, the experimental calculation yields , which is greater than the specified test value of 0.95 for the correlation coefficient. This demonstrates the linear correlation of the established equation.
The relationship between the rate constant (k) and the aging temperature (T) is determined to be Equation (26).
In summary, the aging prediction model is shown in Equation (27).
Given that the minimum initial interface pressure of the cold shrink accessory is 0.18 MPa and the maximum temperature during cable operation is 90 °C (363 K), the minimum interface pressure required to meet the electrical requirements is 0.1 MPa. Therefore, the interface pressure should be maintained above 55%, as shown in Figure 15. The estimated service life is approximately 28.9 years.
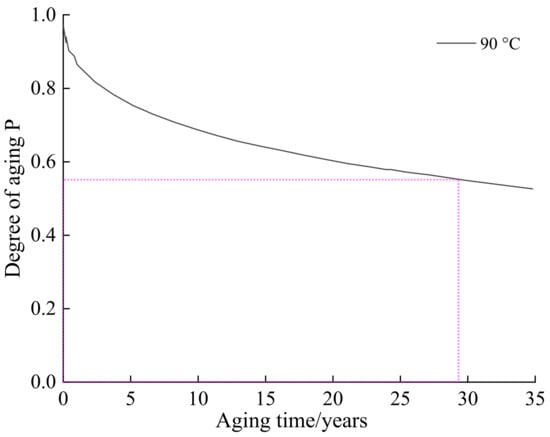
Figure 15.
Ageing degree at 90 °C as a function of ageing time.
5. Conclusions
- The maximum displacement deformation of the cable accessory occurs at the interface between the accessory and the cross-linked polyethylene, with the displacement deformation gradually decreasing from the inner side to the outer side of the accessory. The maximum stress of the accessory appears on the contact surface with the cross-linked polyethylene, and the stress gradually decreases from the inner side to the outer side of the accessory.
- Temperature has a significant impact on the silicone rubber material of the accessory. With increasing temperature, the mechanical properties of the two materials change. By establishing a finite element simulation model to analyze the interface pressure variation at different temperatures and aging time points under the same interference fit compared to room temperature, the insulation silicone rubber at 50, 75, and 100 °C shows an increase in interface pressure by 9.1%, 12.3%, and 6.4%, respectively. The semiconductive silicone rubber shows an increase in interface pressure by 9.2%, 16.3%, and 5.6%, respectively. At 75 °C, the interface pressure is the highest for the cable joint.
- The initial shear modulus of the silicone rubber material of the accessory decreases with increasing aging time. Along the composite interface horizontal path, at the same point, the interface pressure and elastic strain energy density before aging were greater than those after aging, and the degree of interface pressure decrease showed a pattern of initial rapid decline, followed by a slow decline as aging progresses. A predictive model for the service life of the semiconductive silicone rubber was established. According to the prediction model calculation, when the accessory is used at a temperature of 90 °C and the interface pressure exceeds 55% of the initial interface pressure, the service life is estimated to be 28.9 years.
- Through finite element static structural simulation analysis, it is possible to effectively analyze the interface pressure of the joint under different temperatures. The measured stress–strain data at high temperature and thermal aging provide a foundation for theoretical calculations and model development of the interface pressure in the middle joint of the cable.
Author Contributions
Conceptualization, R.X.; methodology, R.X., B.O., K.H. and Y.W. (Yuli Wang); validation, Y.W. (Yuli Wang) and Y.W. (Yanhui Wang); formal analysis, Y.W. (Yuli Wang); investigation, R.X., B.O., J.Y., C.F. and Y.W. (Yuli Wang); data curation, R.X., B.O., Y.W. (Yuli Wang), K.H. and J.Y.; writing—original draft preparation, R.X., Y.W. (Yuli Wang), B.O. and Y.W. (Yanhui Wang); writing—review and editing, R.X., B.O. and Y.W. (Yuli Wang); visualization, R.X., B.O., C.F., J.Y. and K.H.; supervision, R.X., B.O., C.F. and J.Y.; project administration, R.X. and B.O.; funding acquisition, R.X., C.F. and J.Y. All authors have read and agreed to the published version of the manuscript.
Funding
This study received funding from ‘Research on automation assistance and quality defect inspection techniques for key installation steps of high-voltage cross-linked cable accessories’ (Science and Technology Project No. 5500-202255402A-2-0-ZN of State Grid Co., Ltd.). The funder was not involved in the study design, collection, analysis, interpretation of data, the writing of this article, or the decision to submit it for publication.
Institutional Review Board Statement
Not applicable.
Informed Consent Statement
Not applicable.
Data Availability Statement
The data presented in this study are available on request from the corresponding author. The industrial partner’s policy prevents public access to the data.
Acknowledgments
We would like to acknowledge all of the authors and peer reviewers for their contributions to this paper. We would also like to thank the editorial board of Applied Sciences for trusting our proposal of the Special Issue and the editorial team at MDPI for the help in handling the editorial process.
Conflicts of Interest
The authors declare no conflict of interest.
References
- Fournier, D.; Dang, C.; Paquin, L. Interfacial Breakdown in Cable Joints. In Proceedings of the 1994 IEEE International Symposium on Electrical Insulation, Pittsburgh, PA, USA, 5–8 June 1994. [Google Scholar]
- Wang, P.L. Electrical Field and Interface Pressure Control in HV Cable Accessories Design. Electr. Wire Cable 2011, 5, 1–5. [Google Scholar]
- Liu, S.; Peng, J.; Wang, X.; Zheng, H. Relationship Between Permanent Deformation and Shrink Range in Cable Accessory. Electr. Wire Cable 2013, 2, 49–55. [Google Scholar]
- Cui, J.; Yu, D.; Wang, X.; Qiu, W.; Huang, T.; Wei, L. Research Progress of Measuring Method for Interface Pressure between Cable and Accessory. Insul. Mater. 2013, 51, 1–6. [Google Scholar]
- Wang, X.; Dong, Y.; Duan, S.; Zhang, Y.; Zhang, W.; Wu, K.; Tu, D. Dealing with Some Key Design Problems in Hv Cable Accessory. Gaodianya Jishu/High Volt. Eng. 2018, 44, 2710–2716. [Google Scholar]
- Wang, Z.; Zhou, K.; Zhu, G.; Liang, Z.; Fu, Y.; Zhao, Q. Effect of Thermal Cycling on the Interface Pressure of Cable Accessories and Their Strips’ Material Properties. Gaodianya Jishu/High Volt. Eng. 2022, 48, 2198–2207. [Google Scholar]
- Jia, Z.; Zhang, Y.; Fan, W.; Zhu, B.; You, J.; Lu, G. Analysis of the interface pressure of cold shrinkable joint of 10 kV XLPE cable. Gaodianya Jishu/High Volt. Eng. 2017, 43, 661–665. [Google Scholar]
- Xie, Q.; Wang, X.; Fu, M.; Hui, B.; Liu, T. Interference Fit and Mechanical Property Computation of Silicone Rubber Accessory in HV Cable Joint. Gaodianya Jishu/High Volt. Eng. 2018, 44, 498–506. [Google Scholar]
- Tian, Z.; Sun, L.; Wang, J.; Bai, X. A Study of Simulation on Relationship between Young’s Modulus of Cable joints and Interface Pressure Based on Finite Element Method; Journal of Physics: Conference Series; IOP Publishing: Bristol, UK, 2019; Volume 1187. [Google Scholar]
- Amyot, N.; Fournier, D. Influence of thermal cycling on the cable-joint interfacial pressure, ICSD’01. In Proceedings of the 2001 IEEE 7th International Conference on Solid Dielectrics (Cat. No.01CH37117), Eindhoven, The Netherlands, 25–29 June 2001; pp. 35–38. [Google Scholar]
- Wang, X.; Ye, X.; Wu, C.; Miao, Z.; Wu, K. Relaxation Characteristics of Simulated Interfacial Pressure Between Locomotive Cable and Accessory Under Extreme Ambient Operating Temperatures. Gaodianya Jishu/High Volt. Eng. 2023, 49, 484–492. [Google Scholar]
- Hamdan, M.A.; Pilgrim, J.A.; Lewin, P.L. Thermo-mechanical analysis of solid interfaces in HVAC cable joints. IEEE Trans. Dielectr. Electr. Insul. 2019, 26, 1779–1787. [Google Scholar] [CrossRef]
- Song, M.; Jia, Z. Calculation and simulation of mechanical pressure of XLPE-SR surface in cable joints. In Proceedings of the 2018 12th International Conference on the Properties and Applications of Dielectric Materials, Xi’an, China, 20–24 May 2018. [Google Scholar]
- Di Sante, R.; Ghaderi, A.; Mingotti, A.; Peretto, L.; Tinarelli, R. Effects of thermal cycles on interfacial pressure in MV cable joints. Sensors 2020, 20, 169. [Google Scholar] [CrossRef]
- Peng, S.; Zhu, X.; Wu, J.; Yin, Y. Effect of Temperature and Electric Field on Partial Discharge Characteristics in XLPE and Nano-MgO/XLPE During Electrical Tree Growth. Zhongguo Dianji Gongcheng Xuebao/Proc. Chin. Soc. Electr. Eng. 2020, 40, 4033–4042. [Google Scholar]
- Zhou, Y.; Hou, F.; Nie, Q.; Liu, R.; Yang, L.; Zhao, J.; Chen, Z.; Xue, W.; Zhang, X. Temperature effects on electrical tree aging characteristics of silicone rubber. Gaodianya Jishu/High Volt. Eng. 2012, 38, 2640–2646. [Google Scholar]
- Chen, Q.; Qin, Y.; Shang, N.; Chi, M.; Wei, X. Influence analysis of temperature on electric-field distribution in HVDC cable joint. Gaodianya Jishu/High Volt. Eng. 2014, 40, 2619–2626. [Google Scholar] [CrossRef]
- Tang, K.; Ruan, J.; Tang, L.; Zhan, Q.; Liu, Y. Temperature Field Calculation of Three Core Cable Joint. Gaodianya Jishu/High Volt. Eng. 2019, 45, 3571–3578. [Google Scholar]
- Wang, R.; He, Y.; Kang, H.; Wang, Z.; Jin, H. Thermal Aging and Ultrasonic Characteristics of Silicone Rubber for Cable Joint Insulation. Gaodianya Jishu/High Volt. Eng. 2021, 47, 3181–3188. [Google Scholar]
- Yeoh, O.H. Some Forms of the Strain Energy Function for Rubber. Rubber Chem. Technol. 2012, 66, 754–771. [Google Scholar] [CrossRef]
- Zou, Y.; Zhuang, Z.; Huang, K.-Z. Solutions of axisymmetric plane stress for a hyperelastic material interference problem. Gongcheng Lixue/Eng. Mech. 2004, 21, 72–75+83. [Google Scholar]
- Yang, Y.; Huang, Y.H.; Hao, M.; An, M.Z.; Su, Z.T. Tensile Properties of Vinyl Silicone Rubber at High Temperature. Silicone Mater. 2010, 24, 215–217. [Google Scholar]
- Liang, Y.; Gao, T.; Wang, X.; Sun, M. Microstructure Evolution of Silicone Rubber Used for Composite Insulators under the Effects of Electric Field and Temperature. Diangong Jishu Xuebao/Trans. China Electrotech. Soc. 2020, 35, 1575–1583. [Google Scholar]
- Tian, L.; Jin, E.; Mei, H.; Ke, Q.; Li, Z.; Kui, H. Bio-inspired graphene-enhanced thermally conductive elastic silicone rubber as drag reduction material. J. Bionic Eng. 2017, 14, 130–140. [Google Scholar] [CrossRef]
- Cheng, L.; Mei, H.; Wang, L.; Zhang, F.; Dong, H. Study on long-term aging characteristics and impact factors for silicone rubber sheath of composite insulators. Dianwang Jishu/Power Syst. Technol. 2016, 40, 1896–1902. [Google Scholar]
- Sun, J.-Y.; Chen, S.-P.; Sha, J.-J.; Gao, J.-G.; Liu, Y.-X.; Yang, J.-K.; Ni, Z.-H. Evaluation and prediction of thermal aging life of XLPE for cables. Dianji Yu Kongzhi Xuebao/Electr. Mach. Control. 2022, 26, 31–39. [Google Scholar]
Disclaimer/Publisher’s Note: The statements, opinions and data contained in all publications are solely those of the individual author(s) and contributor(s) and not of MDPI and/or the editor(s). MDPI and/or the editor(s) disclaim responsibility for any injury to people or property resulting from any ideas, methods, instructions or products referred to in the content. |
© 2023 by the authors. Licensee MDPI, Basel, Switzerland. This article is an open access article distributed under the terms and conditions of the Creative Commons Attribution (CC BY) license (https://creativecommons.org/licenses/by/4.0/).