1. Introduction
Embankment-induced lateral soil movement would cause disastrous embankment failure and pose a significant threat to nearby vulnerable structures in the construction, widening, and maintenance of the embankment [
1,
2,
3]. To resist the adverse soil movement, piles can also be used (termed passive piles) to sustain the passive loading caused by the soil movement, and their performances may differ from the active pile directly subjected to active loading at the pile head [
4,
5]. Of the two kinds of passive piles, i.e., vertical piles and battered piles classified as per the pile axis inclination in
Figure 1a, the battered pile is anticipated to offer a better solution to this problem, just as their applications in excavation and slope engineering [
6,
7,
8]. The prediction of these battered piles, however, would be different and more complicated as a result of varied mechanical backgrounds (e.g., load transfer and boundary condition) [
9,
10,
11]. It remains the most ambiguous yet one of the most crucial aspects in the design, construction, and serviceability of embankment engineering.
To date, however, insufficient attention has been paid to the performance of the passive battered pile resisting the embankment-induced lateral soil movement. The existing studies have mainly focused on the active battered pile [
12,
13] and existing passive vertical piles of buildings and bridges [
5,
14] adjacent to embankment constructions (
Figure 1b). It has to be admitted that they have something in common; both active and passive battered piles have a better performance in resisting lateral load, whereas both passive battered pile and passive vertical piles are affected by soil movement and the distance between the pile and embankments [
15]. More importantly, there are some differences among them. To begin with, compared with the active battered pile, the passive battered pile is adopted in a different scenario with different external loads [
16,
17,
18]. Then, unlike the passive vertical pile, the passive battered piles affected by newly built embankments can counterbalance some passive loading with a component along the pile, and they are analyzed without considering the axial loads and constrain conditions at the pile head [
19,
20,
21,
22].
Although the passive battered pile cannot directly use conclusions of the aforementioned existing passive vertical pile, its analysis methodology can still extend from the latter because of the same application scenario and external loads. To date, the behaviors of existing vertical piles adjacent to newly built embankments have been investigated by theory analyses, numerical imitations, and experiments. For instance, the displacement-based theoretical methods can produce soil stiffness degradation curves to interpret the soil-pile interaction for all embankment construction stages [
23]; this theoretical method was capable of characterizing the actual field behavior because the stresses were obtained directly by measured free-field deformation-stress curves. Subsequently, the pressure-based method was theoretically developed to explicitly predict the responses of rigid piles by encapsulating the effect of soil movement into a power–law distributed loading [
24]. However, the applications of these methods and empirical equations were restricted by assumptions such as the assumption of elastic passive vertical piles and a priori of explicitly expressed soil movement (stress distribution). Moreover, the behaviors of existing vertical piles under lateral soil movement have also been extensively investigated by numerical simulations because of their efficiency. However, the numerical simulations always starve for the support of solid physical evidence [
25,
26,
27,
28]. The experimental investigation has played a fundamental role in revealing the response characteristics of existing vertical piles adjacent to embankment constructions. The maximum bending moment is observed to be dependent on the pile head constraint condition, the ratio of the depth of moving soil to the pile embedment length, and the pile stiffness [
29]. Placing the passive pile in front of active piles would produce a much greater influence on surrounding ground deformation as compared with the case of conversely disposed piles [
4]. Recently, passive piles have been observed to perform better in restraining the lateral soil movement induced by embankment constructions than diminishing the settlement by full-scale tests [
30].
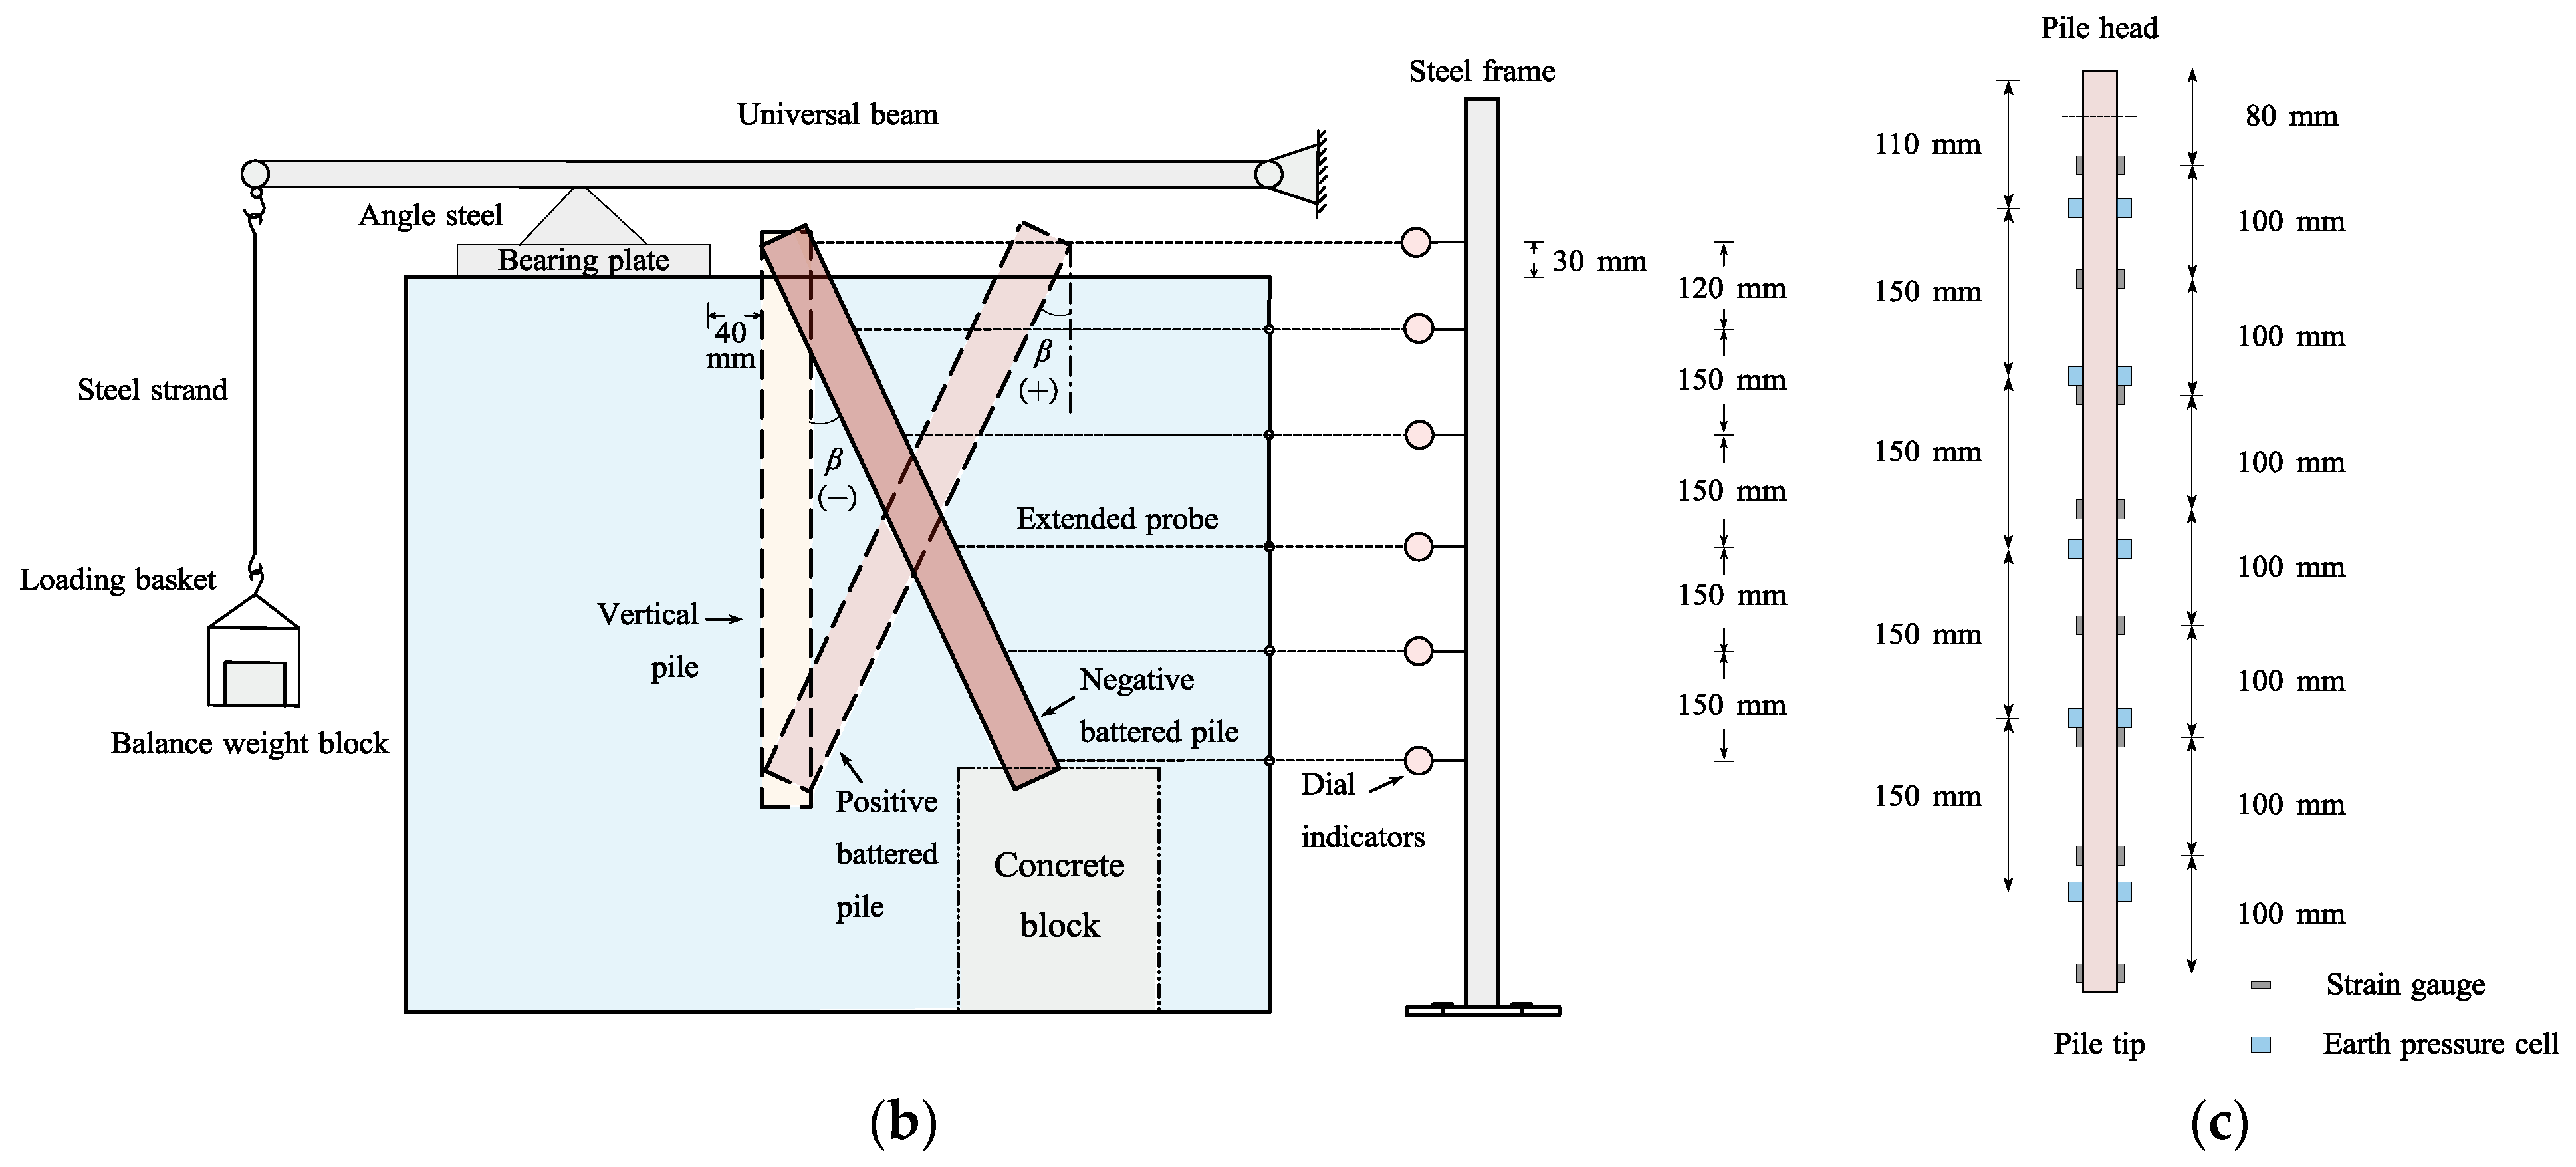
This study was part of a preliminary feasibility investigation for the reinforcement plan of an actual embankment project, and reduced-scale model experiments were designed to explore the performance of battered piles resisting the lateral soil movement in a test tank filled with sandy soil. To minimize the error caused by the disturbance of loading and maintain the loading stress level, a lever loading system was designed, comprising the bearing plate under the pivot (angle steel), a one-end hinged lever (universal beam), and balance weight blocks. High sensitivity sensors (i.e., the dial indicators, strain gauges, and earth pressure cells) were instrumented to record the responses of the pile and the embankment (i.e., pile deflection and strain, earth pressure, and subgrade reaction). The effects of pile inclinations, surcharge magnitudes, and constraint conditions at the pile tip on the nondimensionalized responses of passive battered piles were particularly focused on and analyzed.
2. Overview of Engineering Background
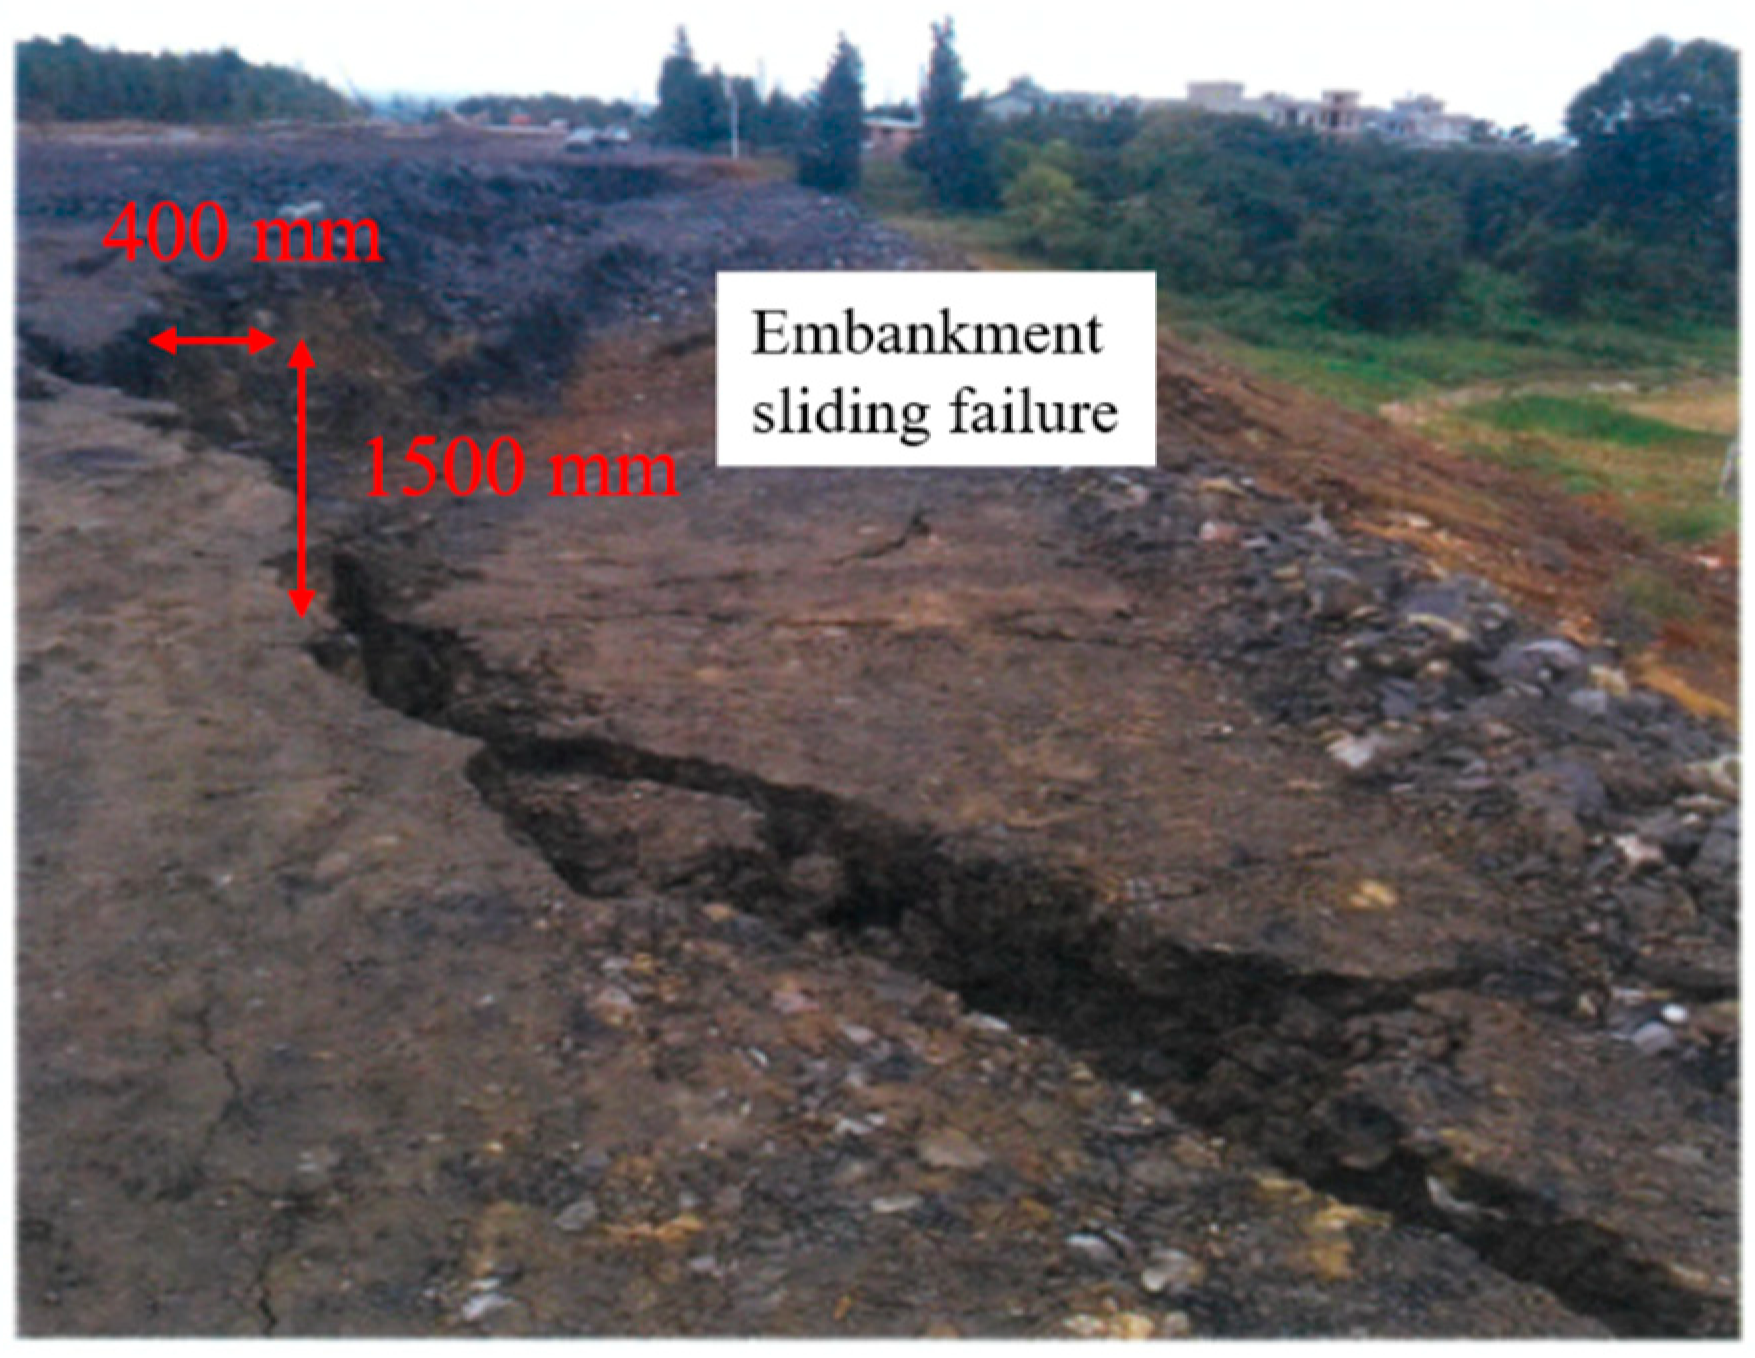
It is a reinforcement project of the Qilin-Shizong Highway in Qujing City, Yunnan Province of China, and the site is located at the Yunnan-Guizhou Plateau of a subtropical monsoon climate at an elevation of around 2000 m. The problematic embankments (e.g., sections K13 + 290 to K13 + 520, K14 + 520 to K14 + 580, and K15 + 330 to K15 + 470) were constructed with a breadth of 25.5 m, an average height of 10 m, and a slope of 1:1.5, passing through intermountain depressions of the tectonic erosion mountain valley areas. The main strata under these fill embankments were mainly composed of the Quaternary Holocene alluvial diluvial layer (Q4a1 + p1), silty clay, mucky clay, organic soil, pebble soil, and peaty soil. The influence of groundwater was neglected in the analyses of the stability of the embankment slope and the influence of the embankment-induced lateral movement on the nearby pile foundation because the groundwater level was far lower than the bottom of the embankment. No adverse geological hazards, such as debris flow and landslides, have been observed according to the results of the geological survey. The embankment was constructed with plain fill (mainly composed of gravel, sandy soil, and cohesive soil). Because the randomly distributed soft soil of high compressibility was not sufficiently reinforced, the differential settlement, longitudinal crack, lateral soil movement, and bulge at the toe of the embankment would usually occur when the fill height surpasses a certain height. In the worst case, within sections K15 + 330 to K15 + 470, the subgrade settlement and crack width can even come up to 1500 and 400 mm, respectively (
Figure 2), displacing the retaining wall at the foot of the embankment greater than 1000 mm.
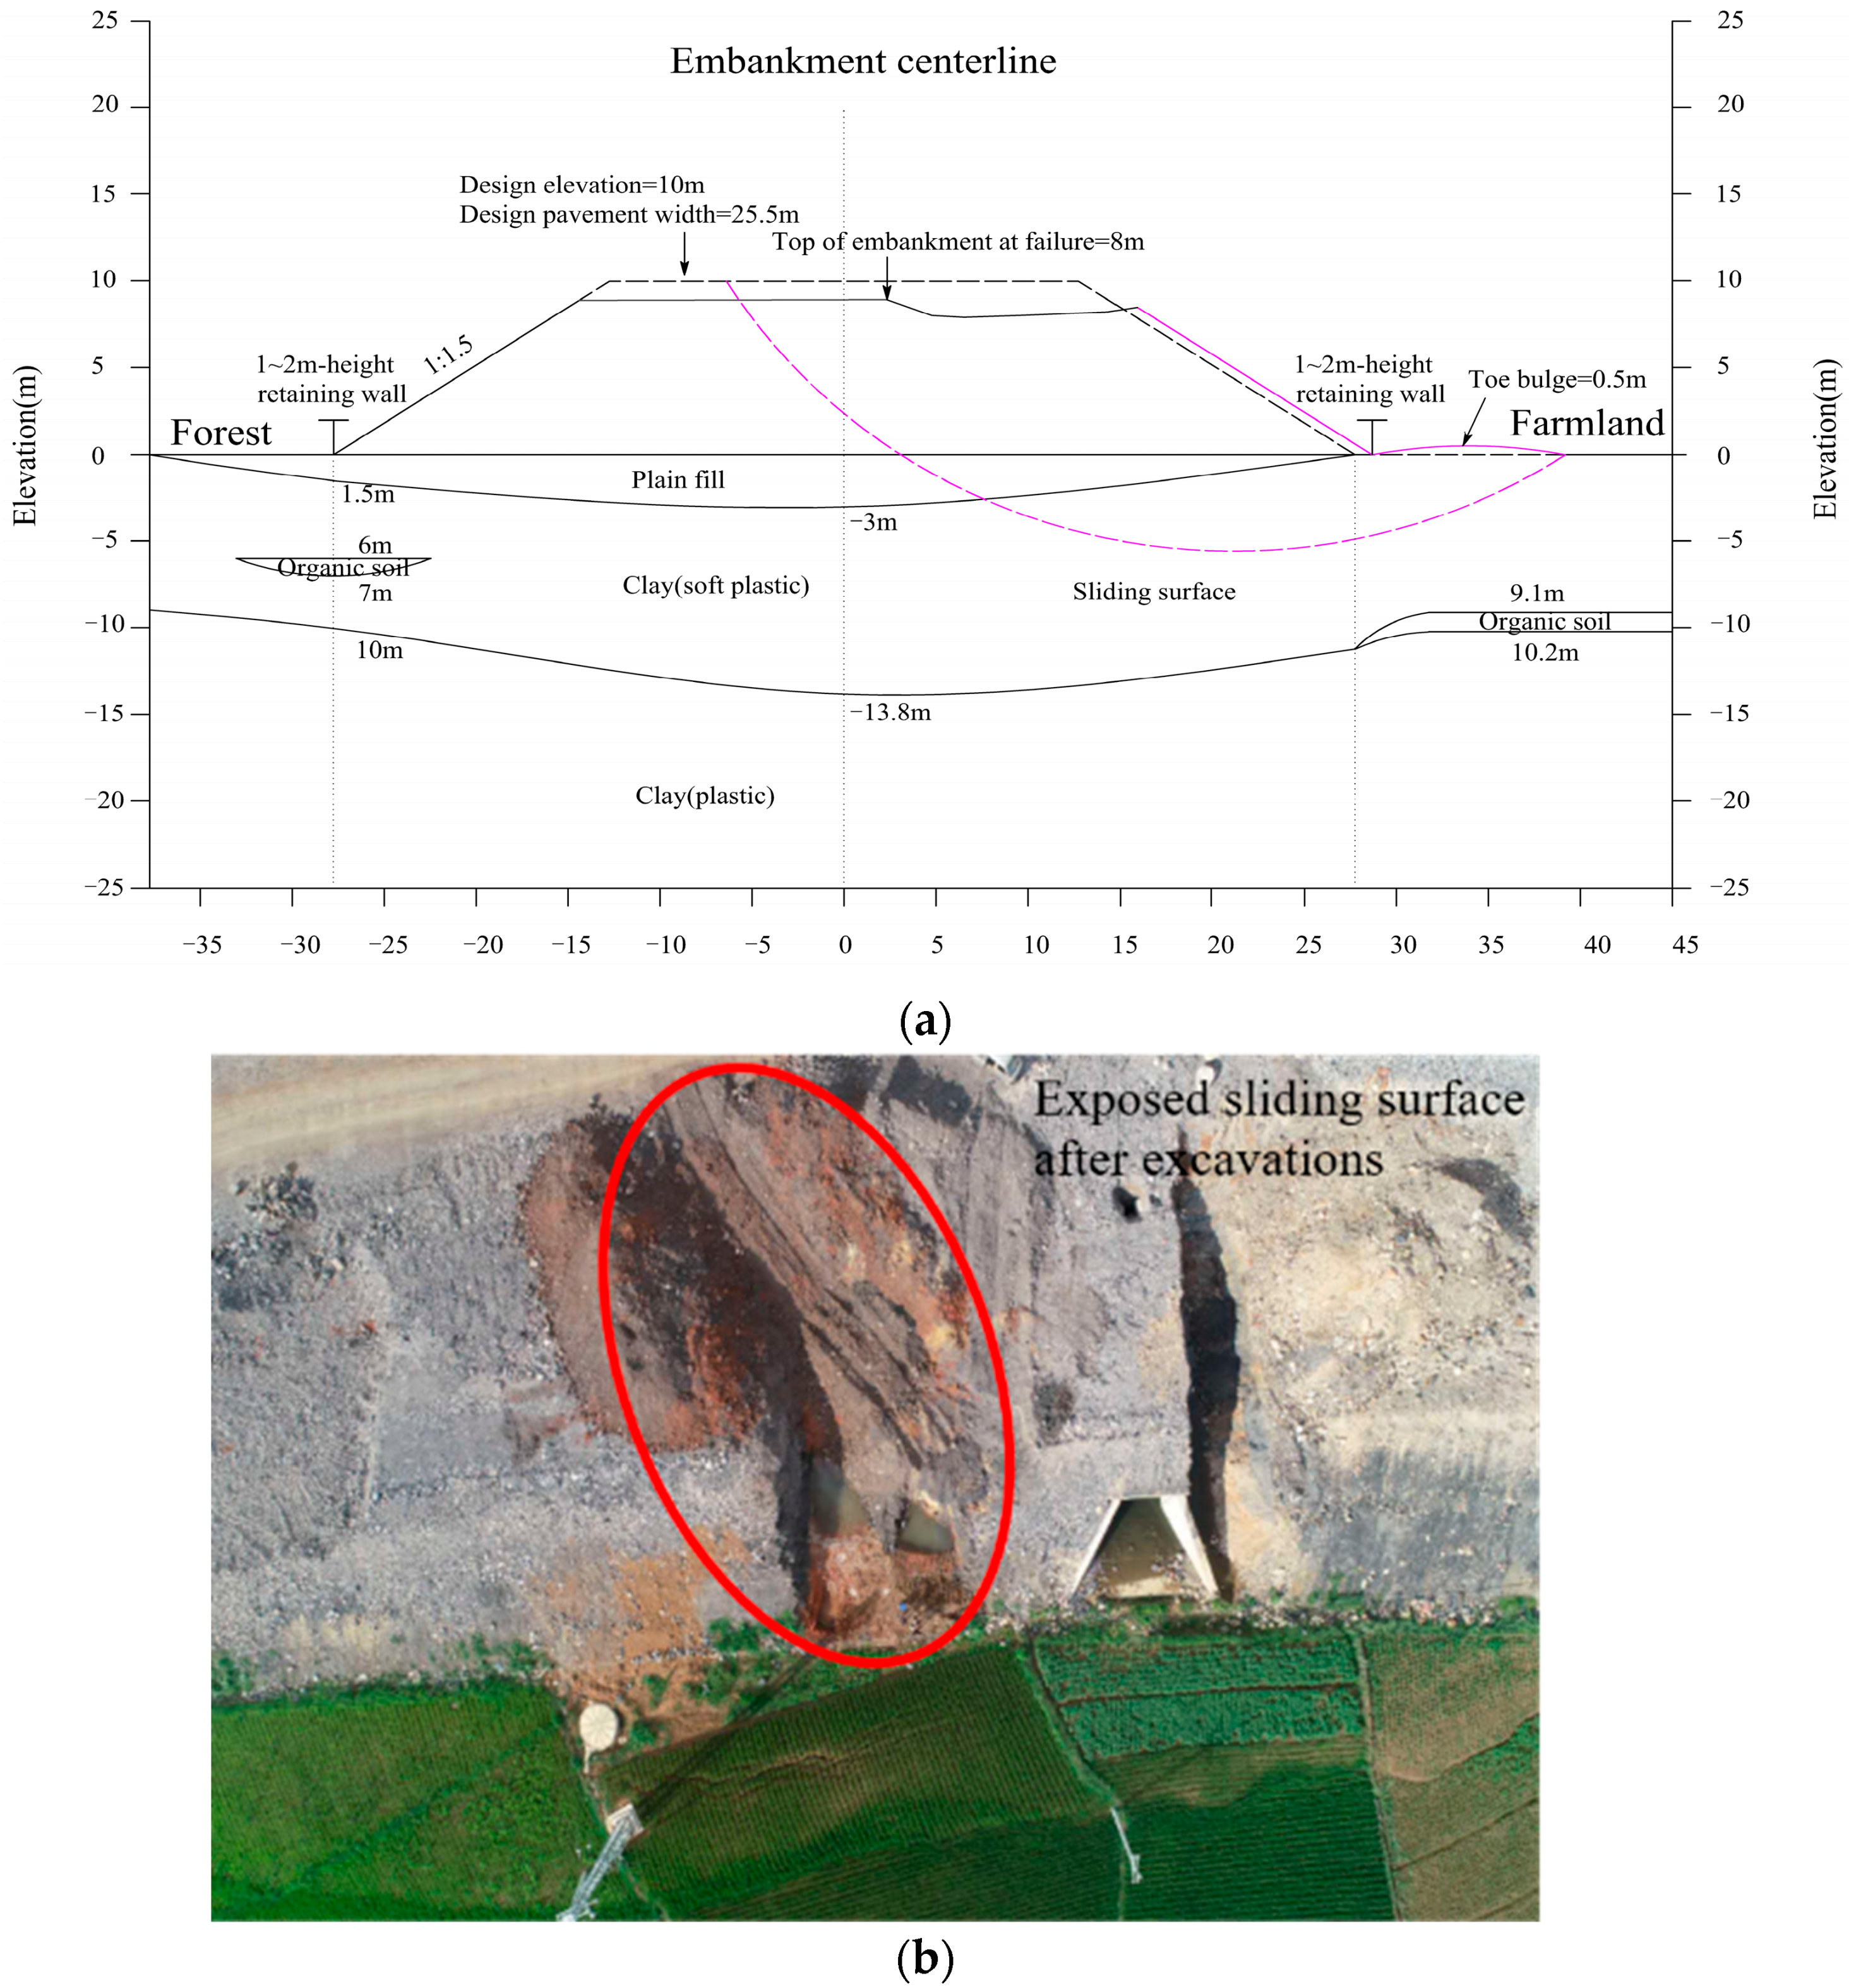
For illustration,
Figure 3a displays a typical case of the failed embankment at K13 + 380 with its stratum profile. Among them, the purple dashed line represents the sliding surface of the embankment failure, and the purple solid line represents the actual embankment position after the embankment failure. The primary physicomechanical properties of the soil layers are listed in
Table 1 (the values of
c and
φ were measured by the consolidated undrained test). Note that the vegetation on both sides of the embankment slope is different, although the soil profile of the embankment slope is almost symmetrical. The left feet of the embankment slope are densely covered by trees all year round, with developed plant roots increasing the cohesion of the soil within a greater depth. On the right feet of the embankment slope is farmland where the farmers rotate and irrigate, and the soil is loosened by human activity and easy for water infiltration. Therefore, only a creep failure with a subgrade settlement of 500 mm and a crack width of 300 mm occurs on the right side of the embankment slope. The creep failure leads to a significant lateral soil movement, producing a toe bulge with a height of 500 mm and posing a great threat to the nearby farmland and other existing structures. According to the observed starting and ending points of the failure surface (i.e., the upper point at the embankment top and the lower bulge point), the failure surface was initially predicted by the design institute and then validated when the failure surface was exposed before reconstructing the failed embankment (
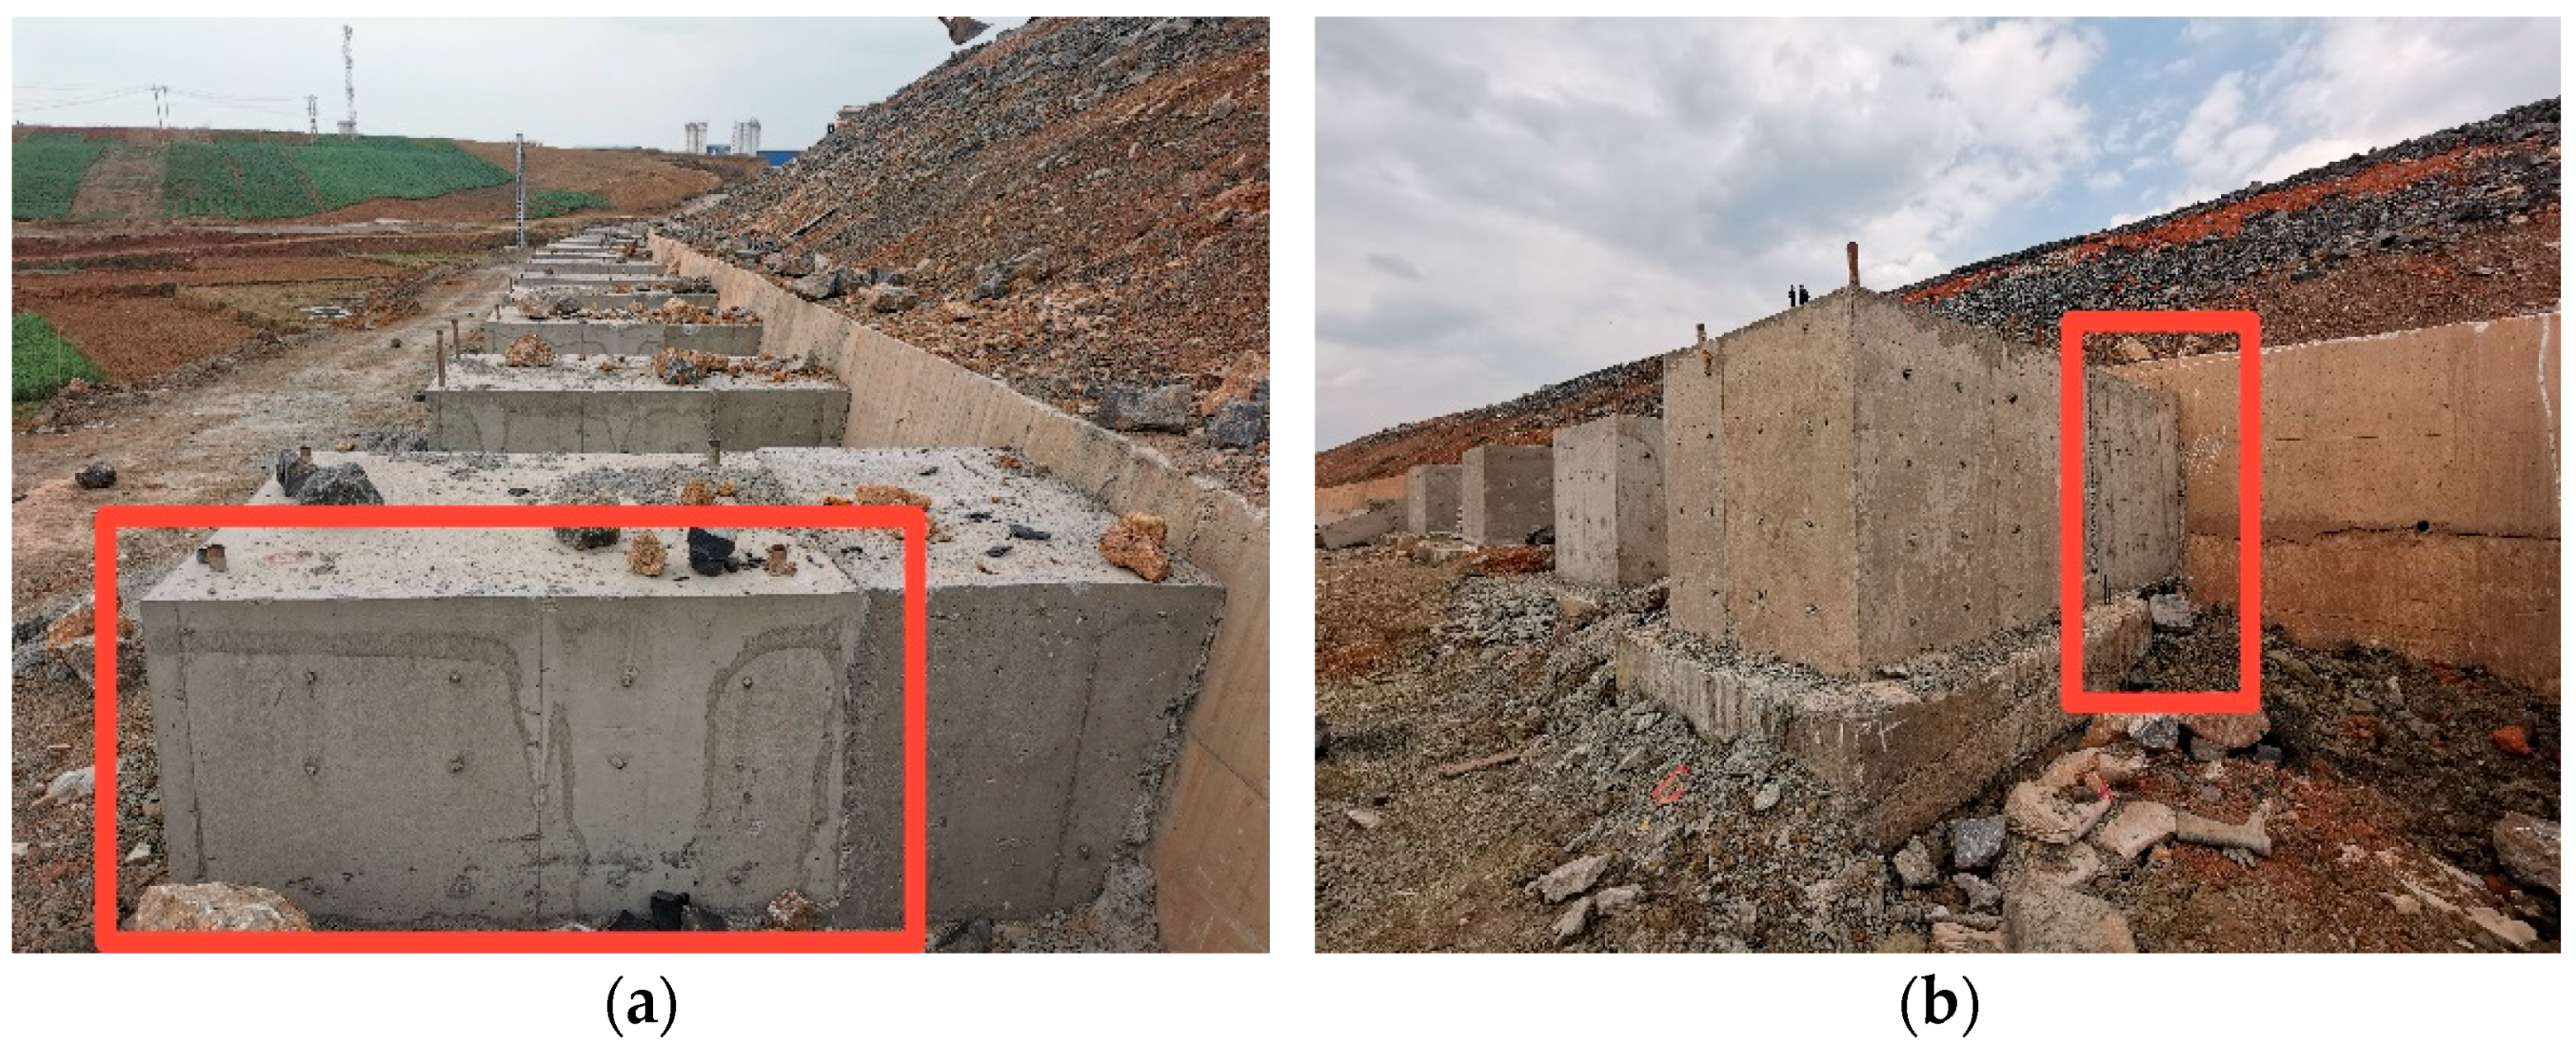
Figure 3b). To resist the embankment-induced lateral soil movement and avoid intruding into the farmland, a row of 1.2 m width square vertical cast in situ piles with a length of 24 m (penetrating the failure surface) were arranged at a pile spacing of 5 m in the original plan given by the design institute. They were embedded about 22~23 m, leaving a segment of 1~2 m above ground connected to retaining walls at the embankment toe by the C30 concrete to better resist the lateral soil movement (
Figure 4).
The original plan, however, did not sufficiently restrain the lateral soil movement and settlement of the embankment, as indicated by the in situ observations of the deformations of the embankment and the pile head. Hence, two modified plans were considered to further reinforce the embankments: (i) widen the vertical piles and (ii) change the pile installation angle to form battered piles. The first plan is a simple method and can satisfy the engineering demand; most of the lateral displacements of the pile after reinforcement are within 30 mm, and the pile head settlement is about 20 mm. This plan is traditional but may not be economically efficient just for safety considerations. The latter plan seems more promising to address this problem, only by changing the installation angle to realize the reuse of originally designed piles. However, the reinforcement effect of battered piles on resisting the lateral soil movement has not yet been clarified. The behaviors of battered piles in terms of the optimum pile inclination would undoubtedly be the concern of this investigation, which entails a related scaled model test before the full-scale in situ test. Considering that the depth of the pile tip located at the foot of the embankment is much deeper than the critical depth of the possible failure surface, the geometry of the slope failure surface only provides some reference as the background information but is no longer the focus of the subsequent investigation. Focusing on the pile behaviors, the embankment was directly represented by a loading near the pile applied by the lever loading system.
In addition, the type of soil was a secondary factor in the optimization of a feasibility investigation, especially when the pile was installed in strata with similar properties. Sand is used in the model test because its physical and mechanical parameters are easier to control, and it is favorable for duplicating the test. Conceivably, if the optimum inclination with a proper constraint can produce the best pile performances when the clay is changed to sand, it will probably also work for the clay. That is, the conclusion obtained by using sand would be little affected by stratification, or the tendency would be similar because of strata with similar properties.
This research aims to examine the performance of battered piles resisting the embankment-induced lateral soil movement by a series of reduced-scale model experiments of battered piles near the surcharges with a similarity ratio of 1:30. The effects of pile inclinations, surcharge magnitudes, and constraint conditions at the pile tip on the pile responses were considered in these experiments. The parameters for model design are listed in
Table 2. The ratios of the geometrical parameters are supposed to be 1:30. However, not all of them can be exactly equal to 1:30 (such as the pile spacing) because of some restrictions, e.g., the size of the test tank. Consequently, ratios of some parameters can only be designed close to the targeted similarity ratio, and their differences would not heavily impact the results. The similarity ratios of the length of the segment above ground and pile embankment distance vary from 1:25 to 1:50 because this study has many problematic embankment sections. Under this circumstance, the ratio of 1:30 is chosen as a representative value for them when conducting the test. Compared with the ratios of pile width and length, ratios of the length of the segment above ground and pile embankment distance have much less influence on the results. In addition, the similarity ratio is kept close to 1 for the parameters related to the mechanical properties (such as the elastic modulus of the pile and the unit weight of the soil mass).
3. Experimental Setup and Procedure
3.1. Experimental Setup
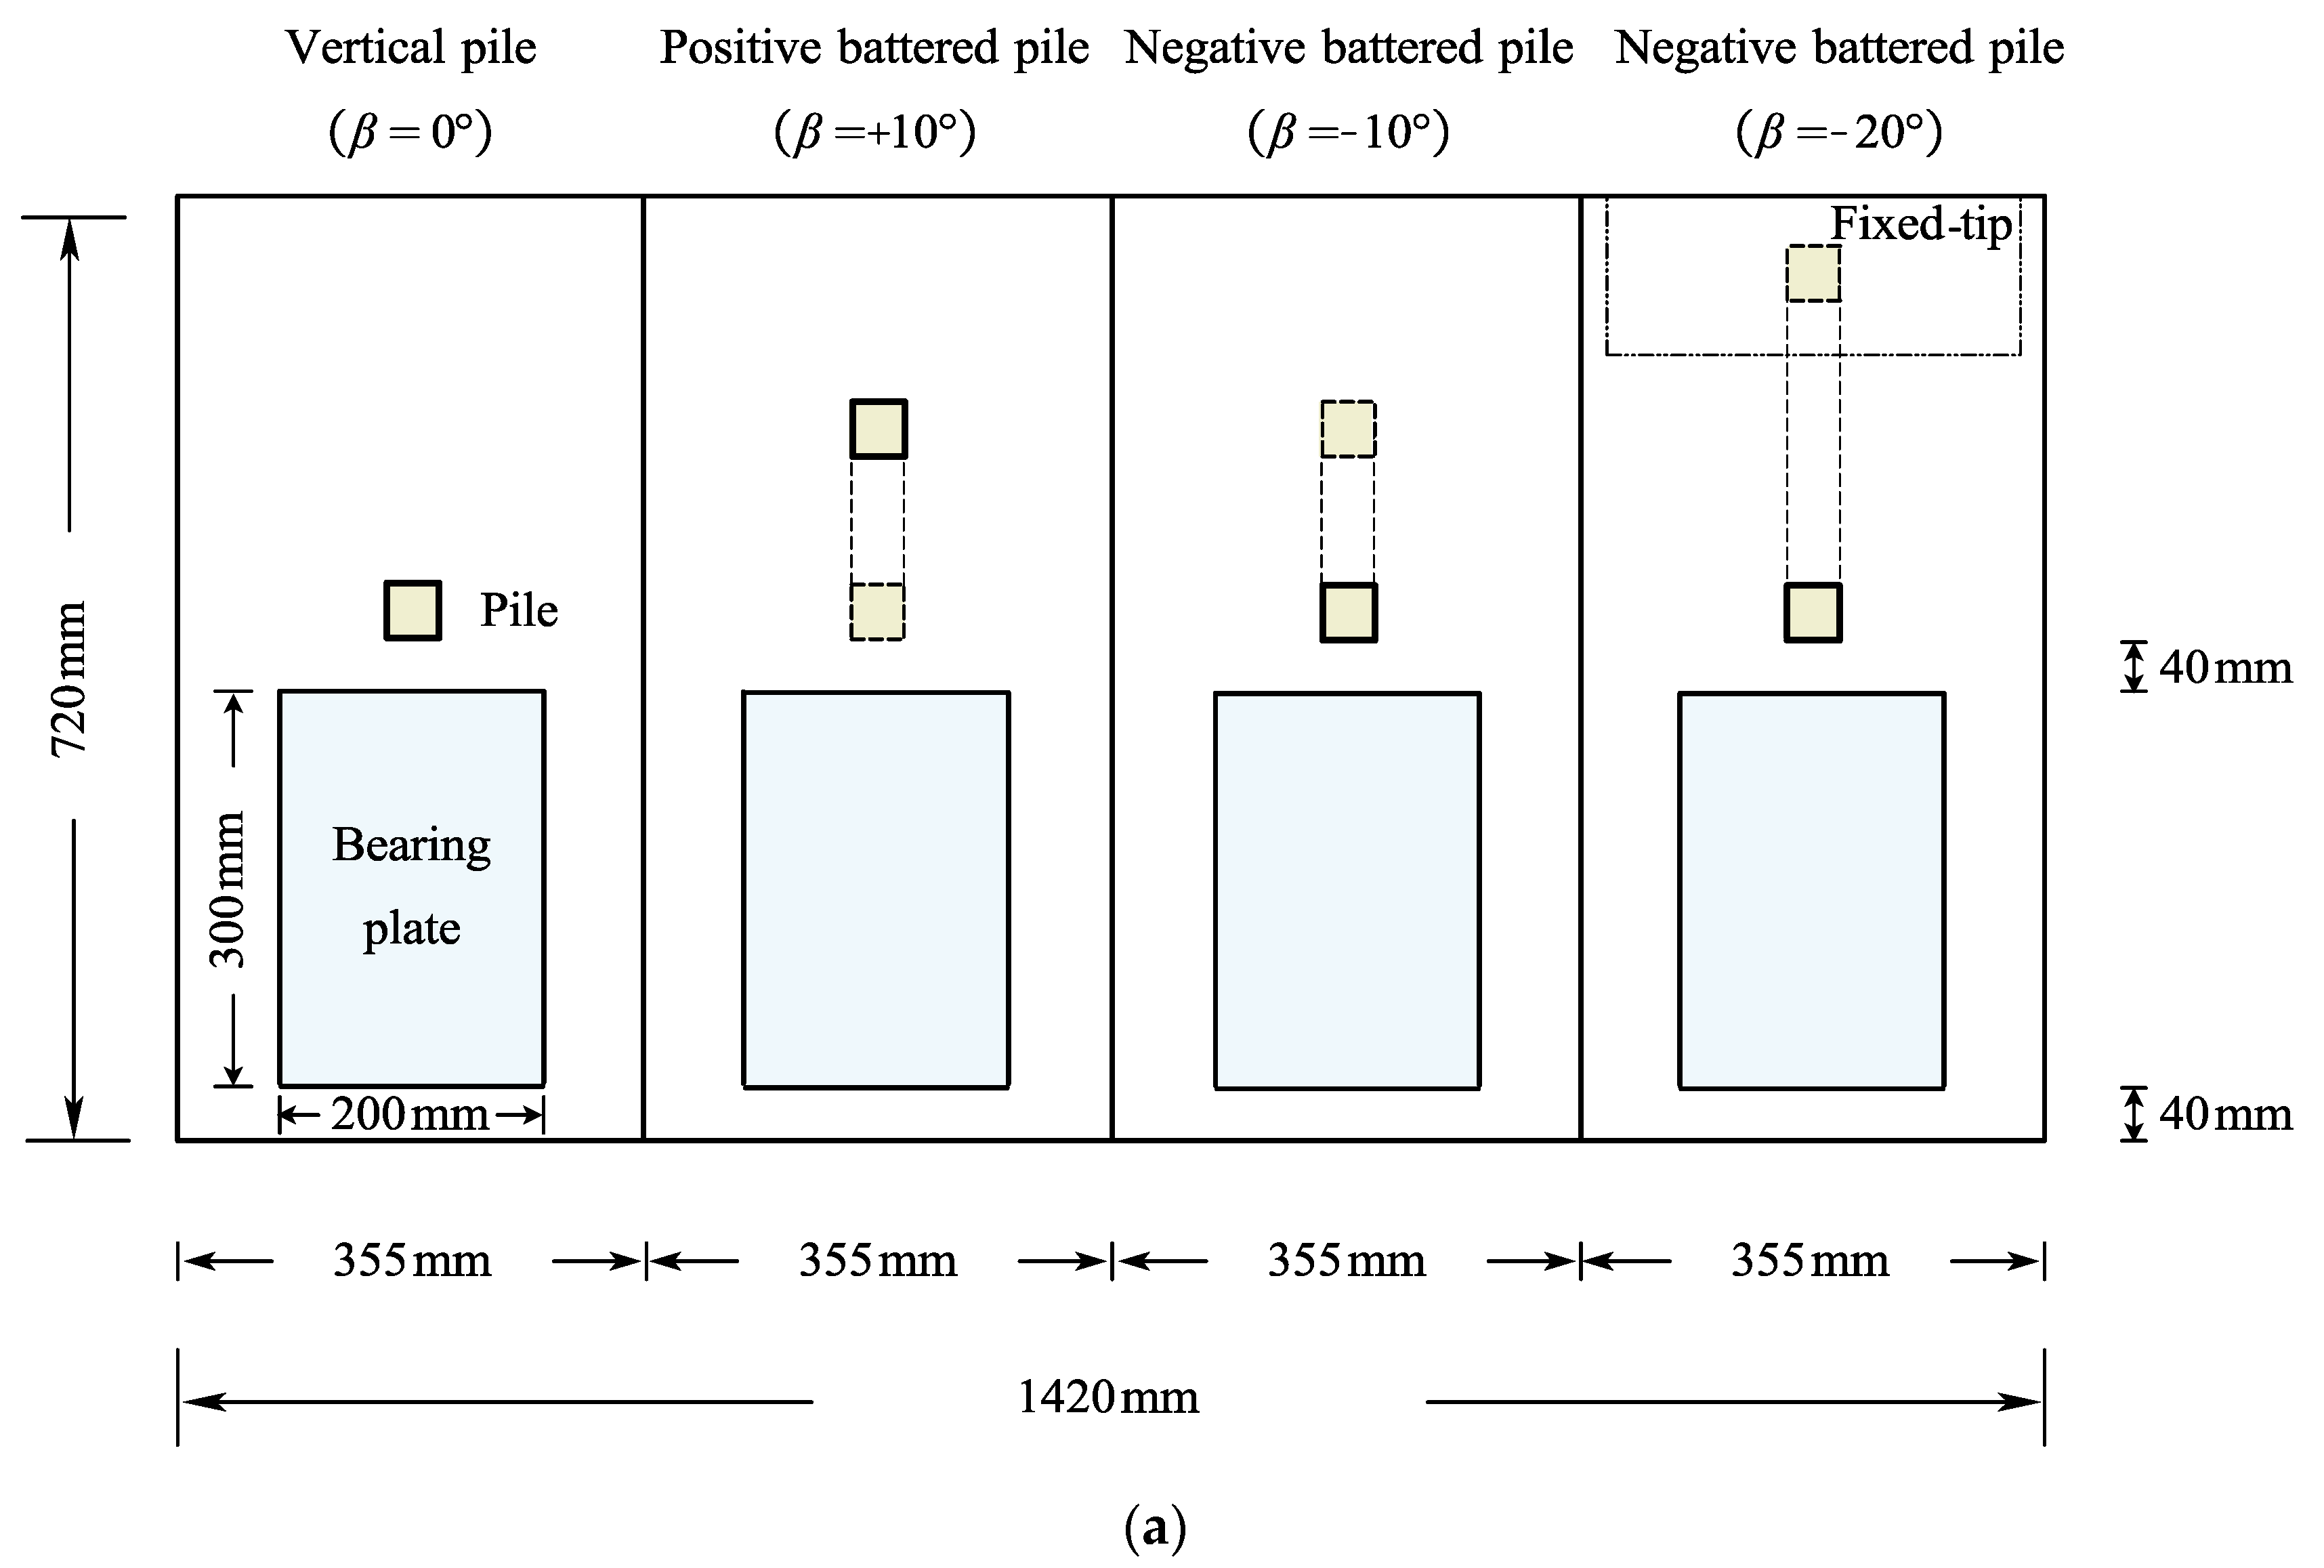
The model experiments were performed in a test tank (1420 × 720 × 1100 mm), mainly made of steel plates and angle steel, one side of which was a transparent glass marked with lines for observation and layered filling. As illustrated in
Figure 5, the test tank was divided into four regions by inserting rigid plates to conduct several experiments simultaneously. The distances between the model pile and test tank in and perpendicular to the direction of lateral soil movement are about 12 times (≥8~12 times) and 5 times (≥3~4 times) the diameter of the pile, respectively, suiting the purpose of diminishing the boundary effect [
31]. In addition, the interface between the inner wall and the soil was lubricated with Vaseline.
3.2. Soil
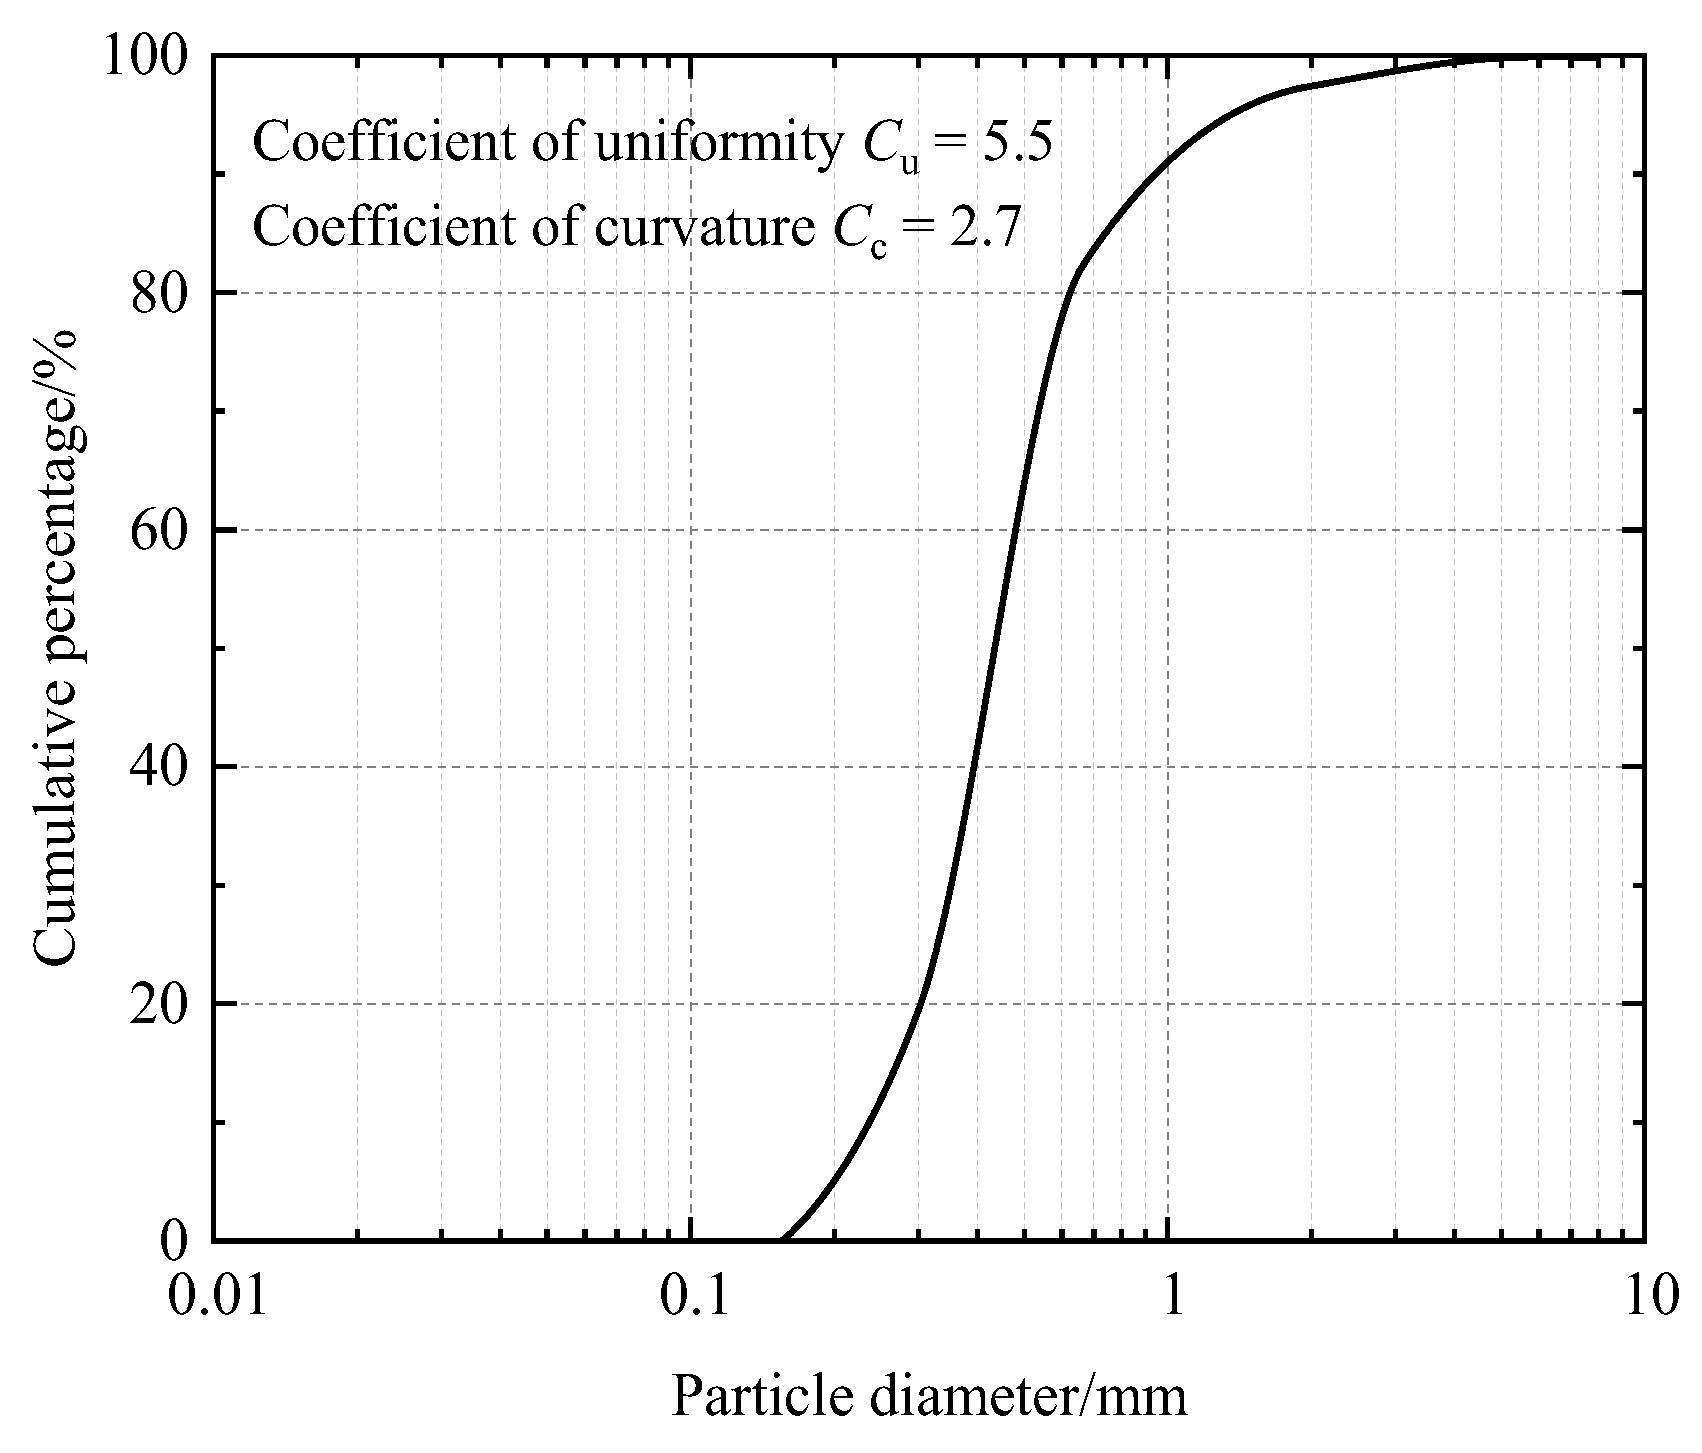
Fujian sand, the Chinese standard sand adopted in the experimental program, was classified as well-grade sand (SW with a uniformity coefficient
Cu = 5.5, curvature coefficient
Cc = 2.7, and angular soil particles) as per the Chinese code GB/T 2021 [
32] and the given grading curve (
Figure 6). The minimum and maximum relative densities of the sand were further tested according to the Chinese code GB/T 2019 [
33]. The test results indicated that the maximum and minimum dry unit weights of the well-graded sand were
γdmax = 18.2 kN/m
3 and
γdmin = 15.3 kN/m
3, respectively, (i.e., maximum void ratio
emax of 0.718 and minimum void ratio
emin of 0.441). The unit weight and moisture content of the fill were measured for each soil layer using the oven drying method [
33]. The average unit weight was
γ = 17.7 kN/m
3, and the average moisture content was
ω = 2.0% (i.e., the relative density
Dr = 65.8%, void ratio of
e = 0.536). In addition, the internal friction angle and specific gravity of the soil were
φ = 40° and
Gs = 2.68, respectively, given by the direct shear test (sampled from the cutting ring) and specific gravity test [
33]. The above parameters were also listed in
Table 3 for convenience of query. In addition, the compression modulus of the sand was not accurately measured in this study because it is more difficult to measure sand that can be easily disturbed than cohesive soil, and a value smaller than the actual one would probably be obtained by potential human error. Interested readers can further obtain the compression modulus (or elastic modulus) closer to the actual one from the engineering experience and relevant references such as codes [
34,
35,
36], handbooks [
37], and studies [
11,
38].
In this study, focusing on the effects of pile inclination and pile tip constraint rather than the effect of sand relative density, only a uniform density is required without reaching a specific relative density using a delicate sand-raining device. The soil sample was rained from approximately 1.5 m above the soil level in the test tank as in Suleiman et al. [
15] and Yuan et al. [
4], and the sand was evenly deposited and compacted in lifts to the designated depth. The uniformity of the fill was guaranteed by continuously checking the unit weight of the sample of each layer.
3.3. Model Pile
The model piles (40 × 40 × 800 mm) were made of cement mortar and steel bars, and the elasticity modulus and inertia moment were
Ep = 34.25 GPa (the simply–supported beam method) and
Ip = 2.13 × 10
−7 m
4, respectively. The model piles can be assorted as a rigid pile (
αL = 1.93 ≤ 2.5) as per the deformation coefficient of piles
α, obtained by
α = (
mb/
EpIp)
0.2 (unit: m
−1), where
b is the pile width,
EpIp is the flexural rigidity of the piles, and
m is the proportional coefficient of the subgrade reaction coefficient [
39]. In addition, the proportion of the pile diameter to the median particle diameter
d50 is approximately 100, far greater than the minimum requirement of 40 [
40]. As shown in
Figure 4b, a positive battered pile has embankment-induced horizontal thrusts acting in the same direction as the batter. In contrast, a negative battered pile has horizontal thrusts acting in the opposite direction to the batter [
41]. The piles were embedded about 760 mm, leaving a segment of 40 mm above ground under different pile inclinations (
β = −20°, −10°, 0°, +10°, and +20°), and the free tip boundary conditions were considered in these cases (namely, friction piles). Moreover, the fixed tip boundary condition was further considered in the cases of
β = −20° by inserting the pile tip into the cast-in-place concrete block fixed in the bottom of the test tank (namely, end–bearing piles). Considering that there are two cases with the same pile inclination,
β = −20°, but different constraint conditions at the pile tip, the case of
β = −20° in the following investigation mainly refers to the one with a free tip unless otherwise stated to avoid possible confusion. The model pile was installed by a batten framing scheme while filling sand in lifts. The battens of the front and back sides are used to locate the position perpendicular to the paper, and the ones in the same plane with PVC pipes are used to adjust the pile inclination. The position and inclination of the model pile will be checked after it is completely fixed.
Note that the concrete blocks at the pile tips do not necessarily mean pouring concrete blocks in the field. To avoid possible problems of test design, it is a simplification method for a model test to quantitatively evaluate the maximum benefit of driving the pile into a harder soil layer on the pile-bearing capacity.
3.4. Instrumentations
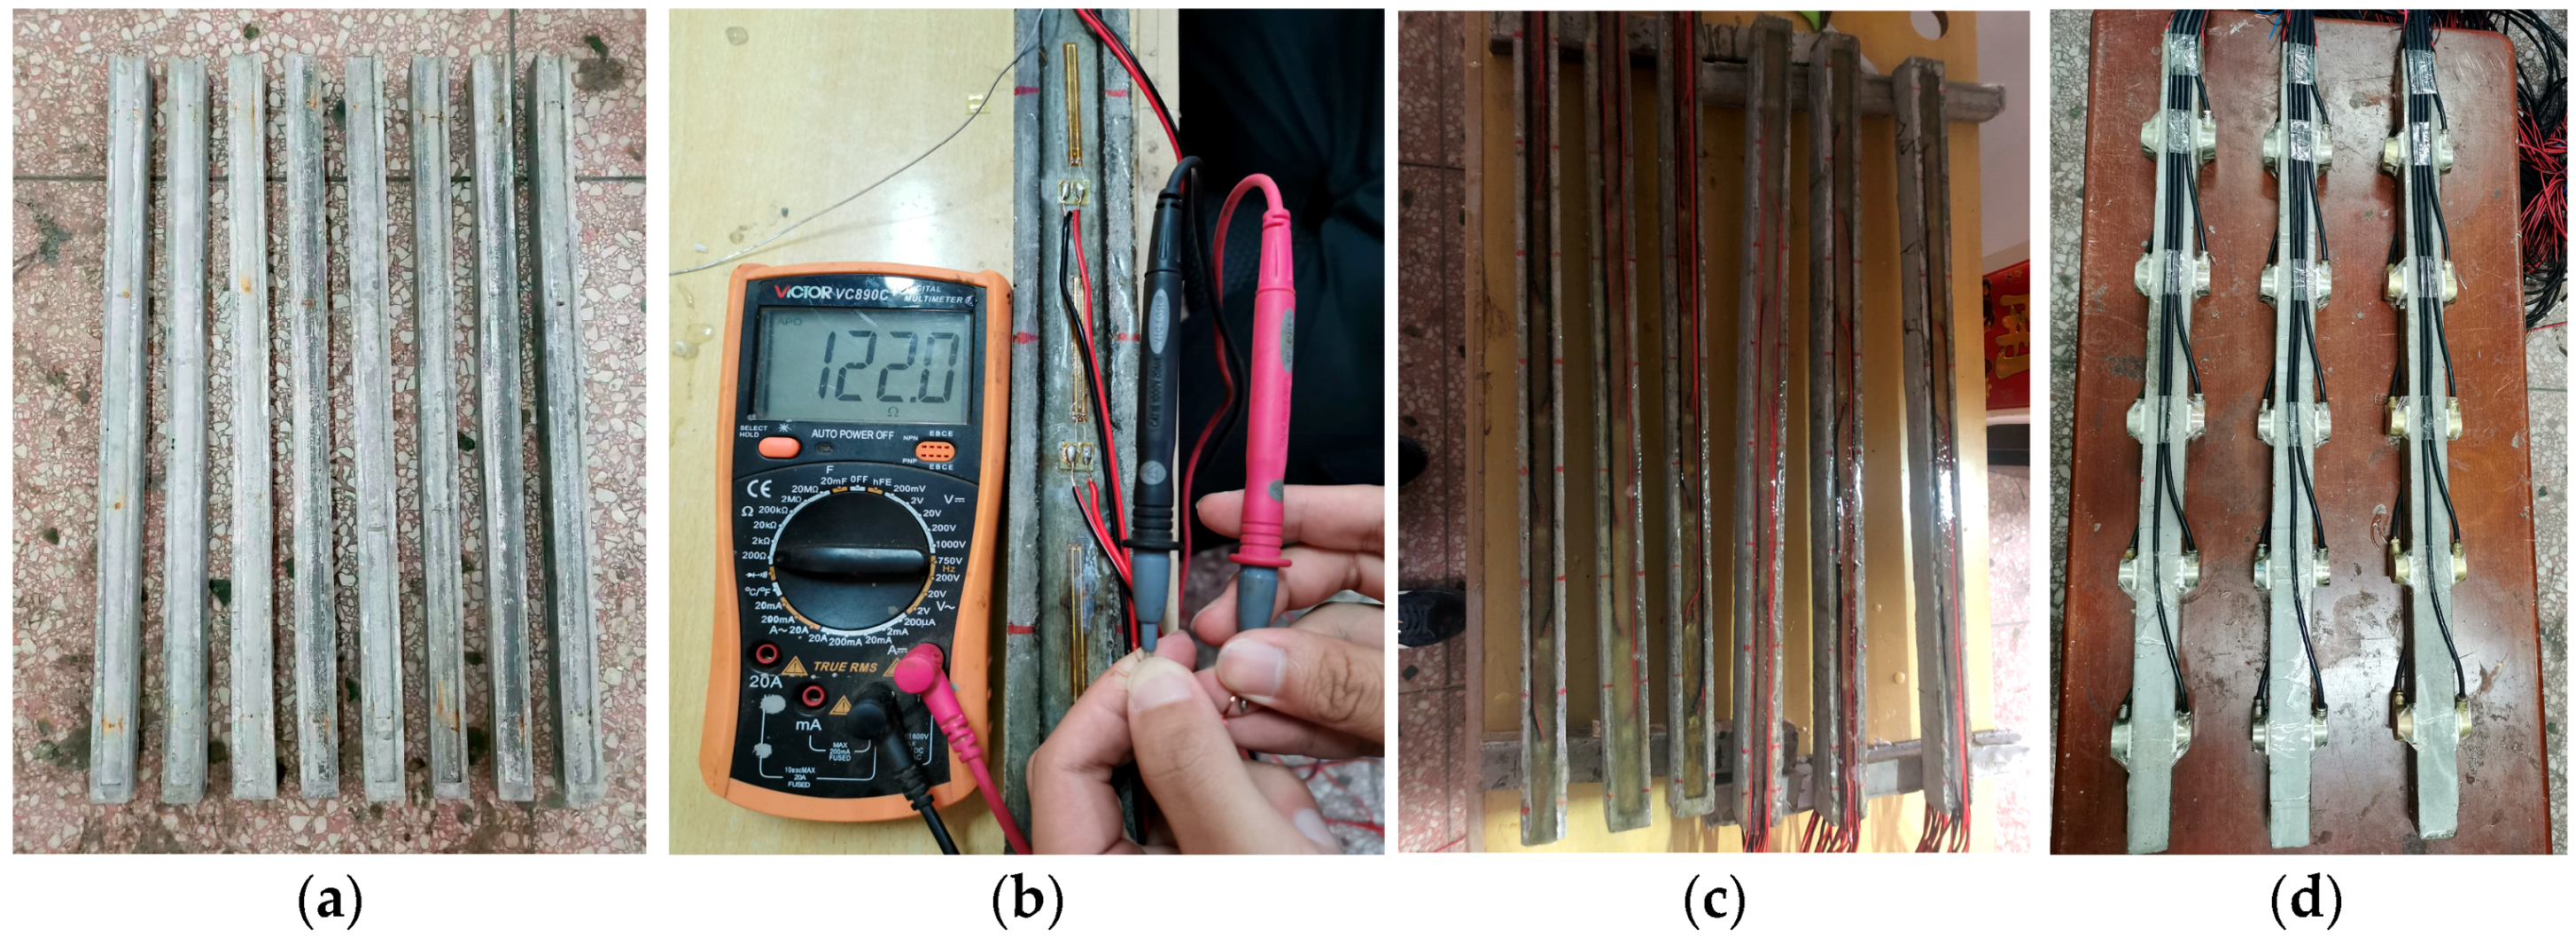
To measure the bending moments along the pile, the strain gauges (B × 120-50AA, electrical resistance type sensor with a precision of ±1% FS, i.e., ±1% full-scale) were symmetrically embedded in the predesigned grooves along the piles, so that its axis is parallel to the pile axis, and protected with thin coated transparent paper [
42]. The half-bridge connection was adopted to decrease the damage to the pile caused by the groove and the interference between strain gauge wires, and temperature compensation was used throughout the testing. After being installed, these sensors were first inspected by the multimeter, then sealed with polished epoxy resin, and finally connected to the data collection instrument (TDS–540) (
Figure 7). The correction was carried out before each measurement based on the instrument handbook. The earth pressure cells (DYB–2, electrical resistance stain type sensor with a range of 100 kPa and a precision of ±0.5%FS) were also symmetrically installed along the piles by the double-sided foam tape (
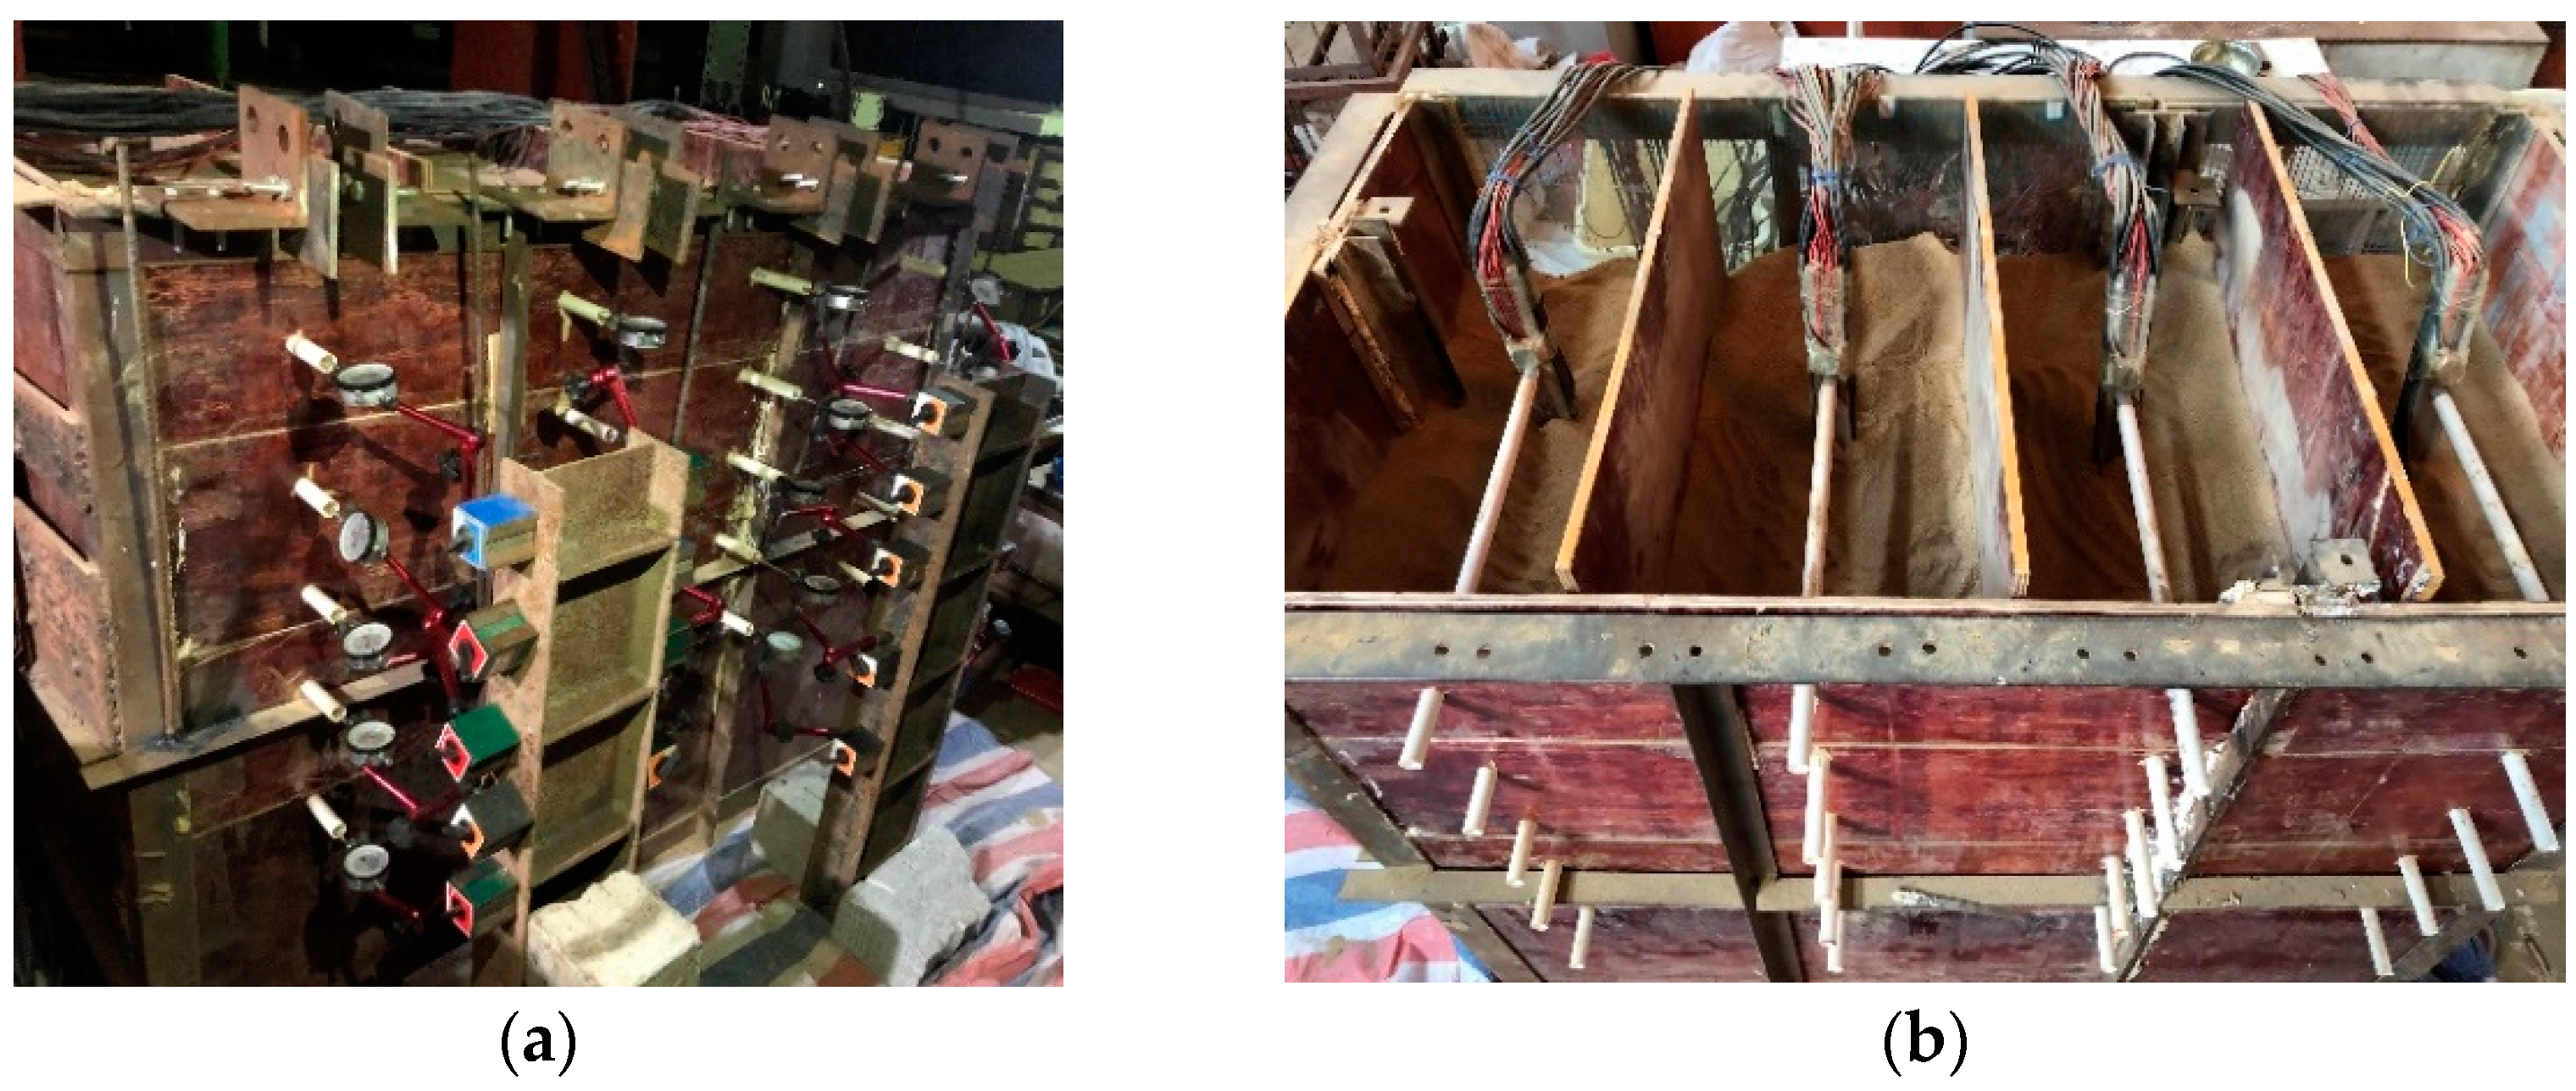
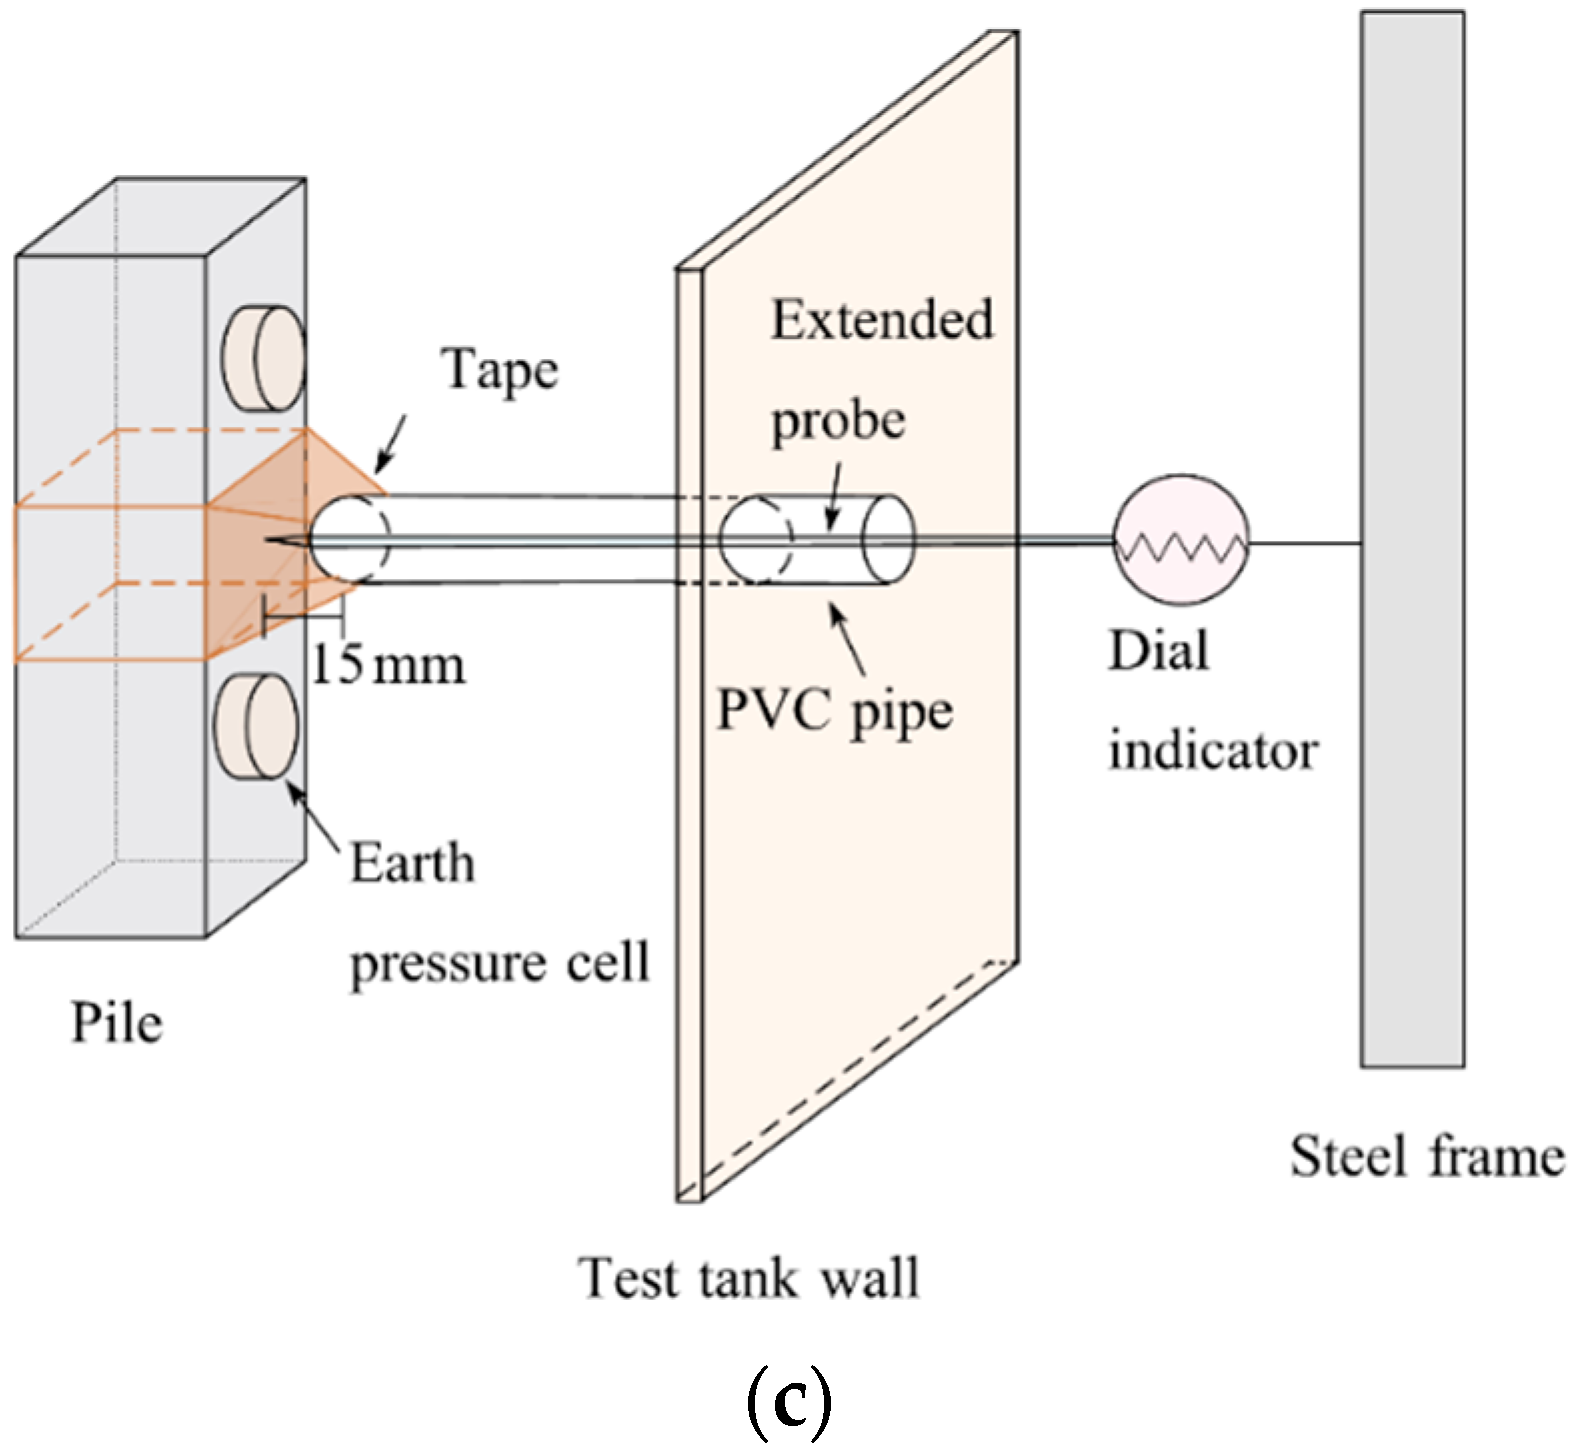
Figure 7d). The distances between the strain gauges and the pile head were 80, 180, 280, 380, 480, 580, 680, and 780 mm, respectively. The distances between the earth pressure cells and the pile head were 110, 260, 410, 560, and 710 mm, respectively; the distances between the dial indicators and the ground surface were −30 (above the ground surface), 90, 240, 390, 540, and 690 mm, respectively (
Figure 5). To capture the pile deflection profile and exclude the impact of sandy soil, the extended probes of dial indicators with a span of 10 mm were first embedded in rigid
ϕ 20 PVC (polyvinyl chloride) pipes at the designated elevations and then encapsulated by a small flexible tent (tensioned tape) (
Figure 8). Instead of directly contacting the model pile, a gap of about 15 mm (greater than the range of the dial indicators) between the piles and the PVC pipes was reserved for the flexible tent to exclude the influence of the PVC pipe encapsulating the dial indicator on the pile responses.
3.5. Test Procedure
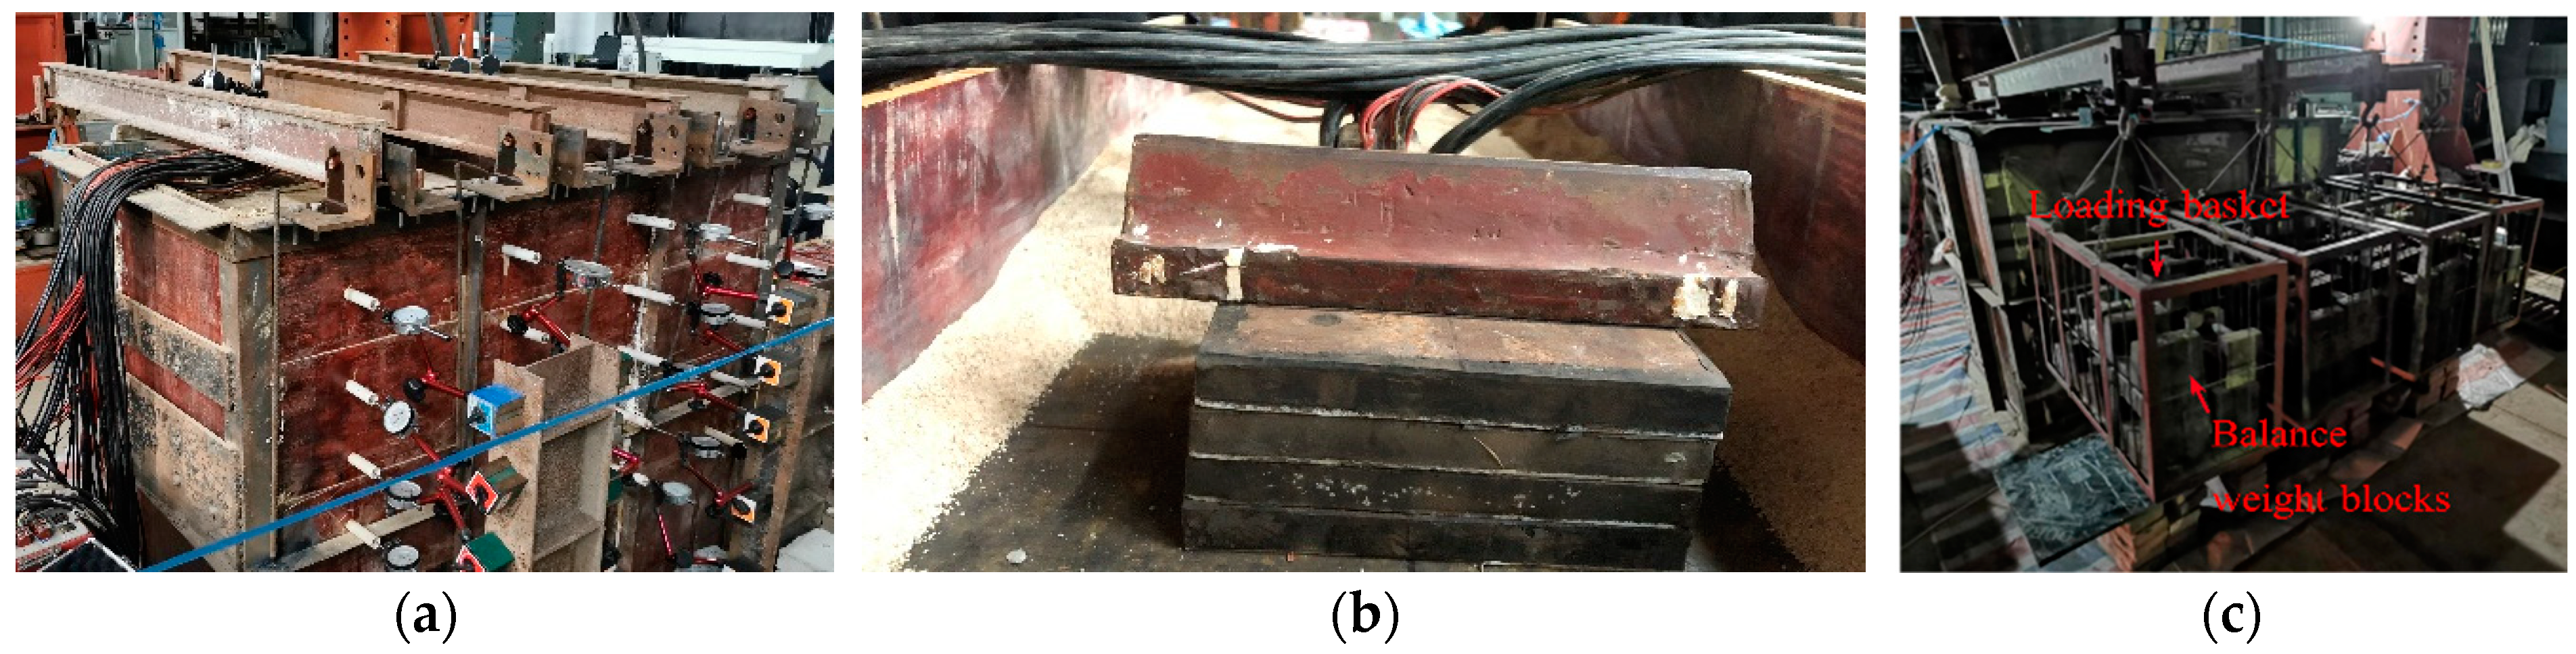
To minimize the error caused by the disturbance of loading and maintain the loading stress level, a lever loading system was designed, comprising the bearing plate under the pivot (angle steel), a one-end hinged lever (universal beam), and balance weight blocks (
Figure 9) [
43]. The surcharge load was imposed on the soil through the bearing plate with a length and width of 300 mm and 200 mm, respectively, and the net horizontal distance between the bearing plate and the model piles was 40 mm.
The surcharge loading was applied by manually adding several balancing weights of the same mass, 60 kg, on the lever system. To be specific, the initial uniformly distributed load caused by the self-weight of the lever loading system (comprising the pressure bearing plate, angle steel, universal beam, and loading basket) is p0 = 9.375 kPa; the increments of p1 = 25 kPa between different loading levels can be applied by adding a balance weight of 60 kg into the loading basket. Therefore, the total uniform distributed surcharge is p = p0 + p1 × (n − 1), where n represents the loading stages. To sum up, the surcharge of each stage is p = 9.375, 34.375, 59.375, 84.375, 109.375, 134.375, 159.375, and 184.375 kPa. Therefore, in this study, six groups of tests were tested under eight loads (five groups of free tip piles with pile inclinations β = −20°, −10°, 0°, +10°, and +20°, and one group of the fixed tip pile with a pile inclination β = −20°).
The vertical stress caused by the self-weight of the actual embankment is 179 kPa, and the idealized embankment surcharge in the model test should be designed to be slightly greater than the equivalent vertical stress caused by self-weight to include all the loading cases. However, due to the change in the physical and mechanical parameters of the pile-soil system in the scaled test (especially the reduction of pile size), the scaled surcharge that corresponds to a 10 m high embankment should be less than 179 kPa. The maximum vertical stress under the loading plate is 184.375 kPa, about 103% of the actual surcharge, which is applied by the lever system with seven balance weight blocks with a mass of 60 kg.
The data were noted before and after loading and collected every 30 min. The loading at every stage sustained at least 1 h, and the loading at the adjacent stage was initiated after the displacement was steady (the discrepancy between the last two notes of the dial indicators was less than 0.1 mm). The pile deflections can be directly measured by dial indicators, and the bending moments M can be derived from the data measured from the strain gauges, M = EpIp·(εt − εc)/b, εt and εc are the tension strain and compression strain, respectively. The region division of earth pressure and subgrade reaction is related to the depth of the rotation center, and the depth can be determined by the zero point of the earth pressure on the left side. The earth pressures can be directly obtained according to the data collected by the earth pressure cells at the left side of the pile above the rotation center. The subgrade reactions were estimated by the data collected by the earth pressure cells at the right side of the pile above the rotation center and the left side of the pile beneath the rotation center.
4. Results and Discussions
To generalize the results and conclusions, the depth
z, pile deflection
y, bending moment
M, earth pressure
pa, and subgrade reaction
pp are nondimensionalized as their corresponding dimensionless responses
zα,
yα,
Mα,
pa,α, and
pp,α, given by Equations (1) to (5), respectively. Particularly, the normalizations were realized on the basis of the coefficient of pile deformation,
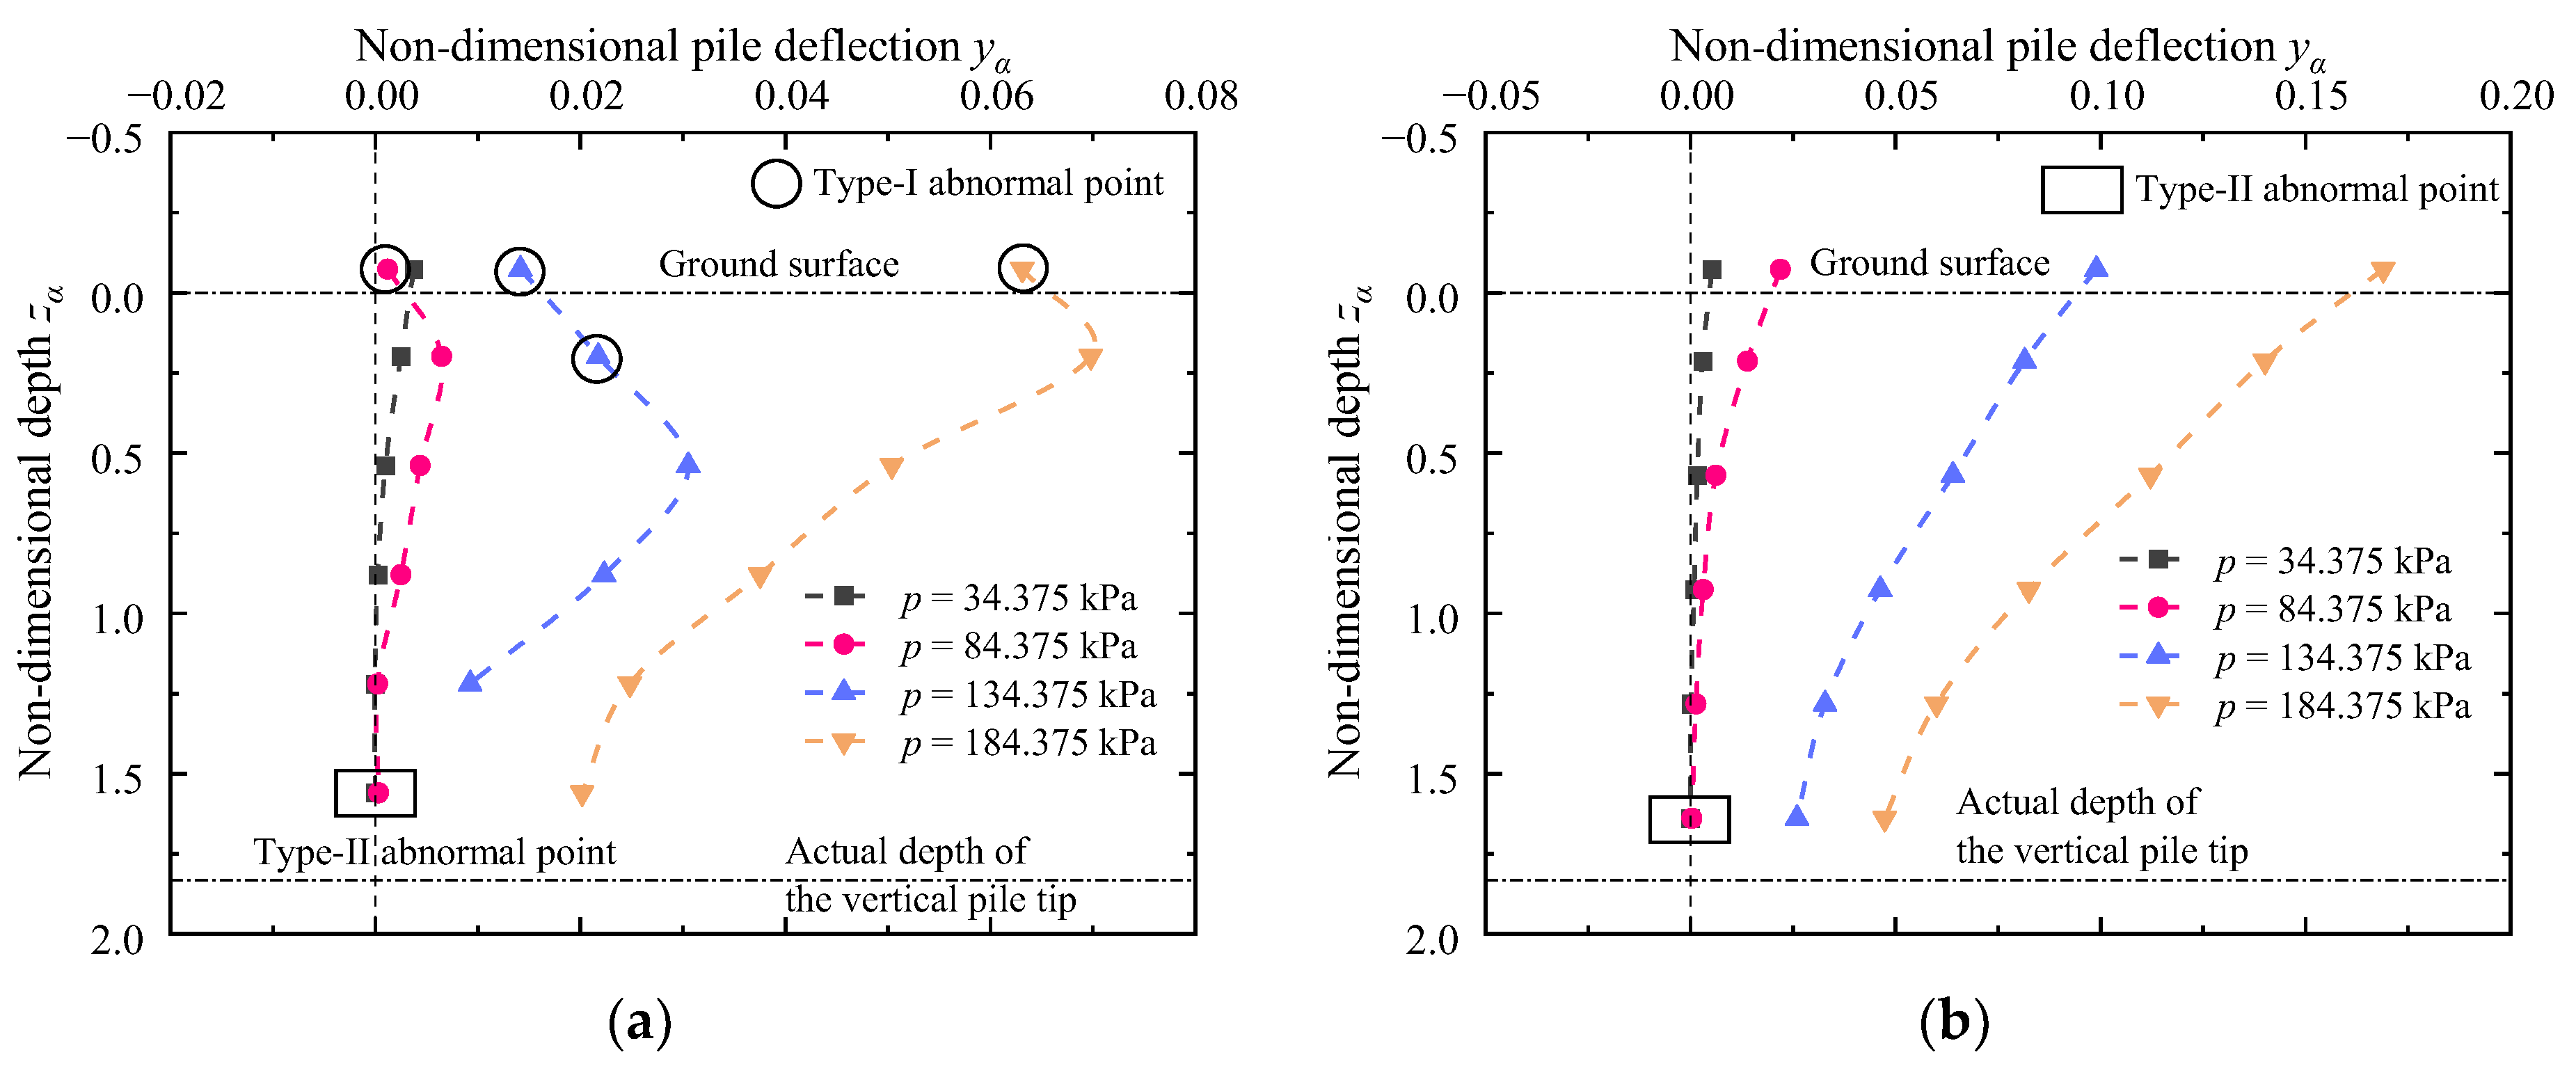
α. Note that some unexpected pile deflection points are observed in these experiments, and they can be classified into two types for different reasons. The type-I abnormal point occurred when the sagging probe of the dial indicator with untightened bolts lost close contact with the pile and was unexpectedly contacted or even stuck with the horizontal PVC pipe. In this scenario, the reading was not the real one. It can only be eliminated by tightening the bolt to guarantee a horizontal probe and expanding the diameters of the PVC pipe to guarantee the free movement of the probe. This type of abnormal point is erroneous and should be deleted. The type-II abnormal point was produced by the inherent limitation of the dial indicator because it can only read under compression. That is, it can only measure one-way displacement. Consequently, the reading of the dial indicator was always zero and did not change with the displacement of the pile, failing to reflect the actual deflection of the pile when the pile moved away from the dial indicator. This error can be minimized by setting a certain preload of compression on the dial indicator so that the probe can move with the pile when the pile departs away from the dial indicator. However, this method is not applicable for large displacement cases. In addition, if interested readers want to know the actual negative displacement, it can be approximately estimated based on the linear variation of displacement with the depth of a rigid pile.
4.1. Effect of Pile Inclinations
To quantitatively analyze the effect of pile inclinations under different surcharge magnitudes on the responses of pile and soil with the least figures, example cases of two surcharge magnitudes (p = 34.375 and 84.375 kPa) were given to avoid repeated data disclosure because of similar tendencies. Some data of the other surcharge cases (e.g., p = 134.375 and 184.375 kPa) will be mainly discussed in the following sections.
4.1.1. Pile Deflection
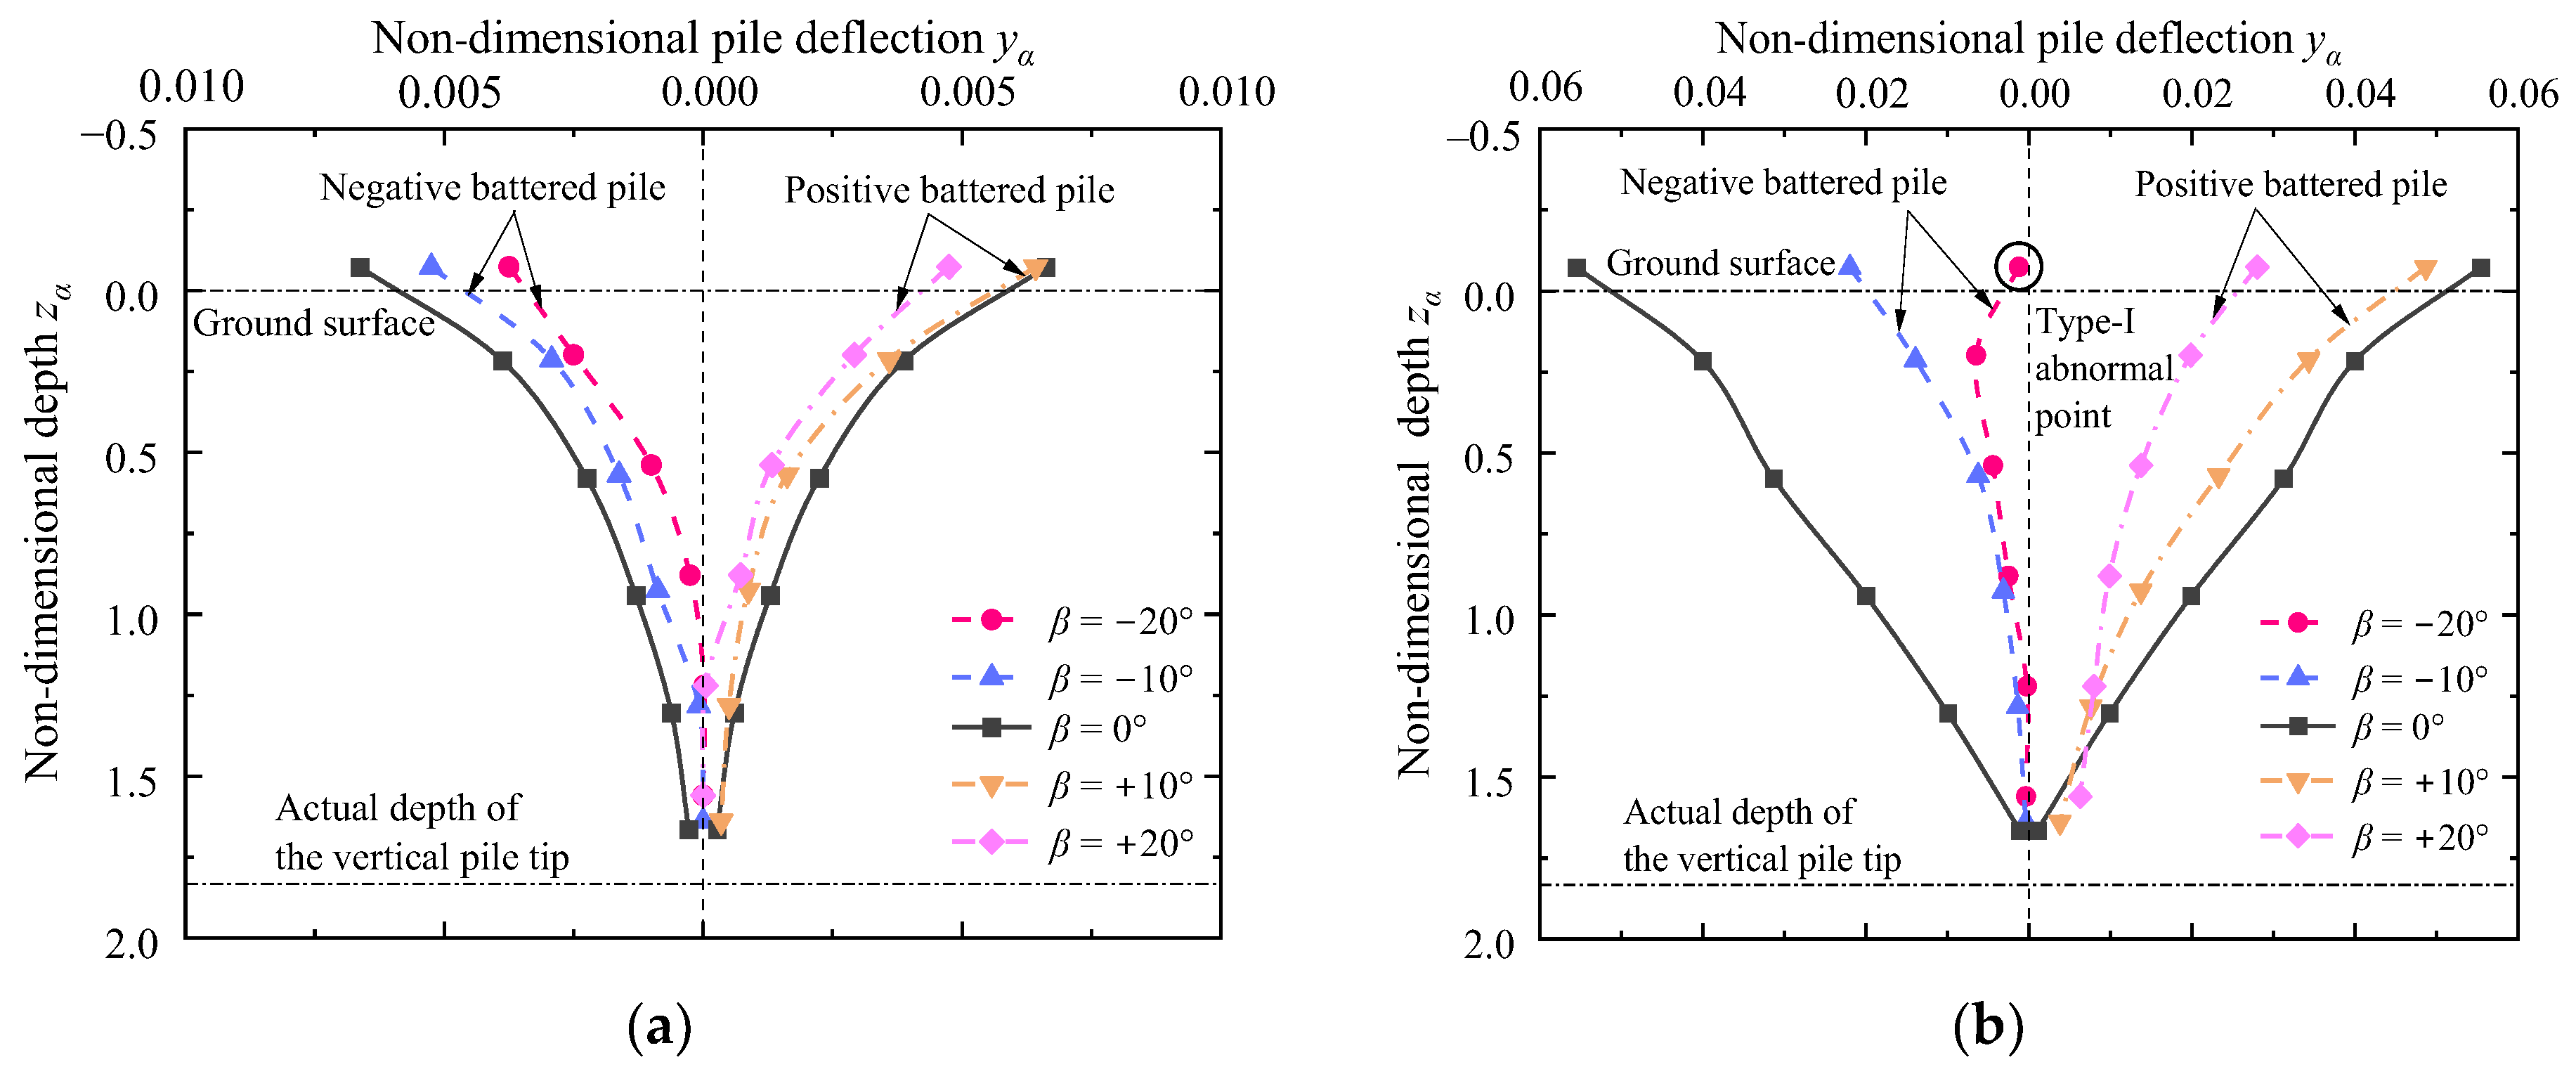
Figure 10 illustrates the variation of non-dimensional pile deflection with depth under different pile inclinations (
β = −20°, −10°, 0°, +10°, and +20°). All the deflection curves of the battered piles are enveloped by those of the vertical piles, indicating that all the deflections of the battered piles (
β ≠ 0°) are less than those of the battered piles (
β = 0°). For cases of negative pile inclinations, the variation of pile inclination from 0° to −10° and −20° would reduce the non-dimensional pile head deflection by 22.2% and 44.4%, respectively, when
p equals 34.375 kPa, and the reductions would be 60.3% and 98.2%, respectively, when
p equals 84.375 kPa. For cases of positive pile inclinations, the change of pile inclination from 0° to +10° and +20° would result in reductions of 3.7% and 29.6%, respectively, when
p equals 34.375 kPa, and the reductions would further increase to 12.2% and 49.5%, respectively, when
p equals 84.375 kPa. Note that the deflection at
zα = −0.07 in the case of
β = −20° and
p = 84.375 kPa is abnormally less than that of greater depth and regarded as the type-I abnormal point (
Figure 10b).
These observations reveal that battered piles are significantly superior to vertical piles in resisting lateral soil movement because their axial forces can provide additional horizontal resistance components, and particularly, the negative battered piles outperform the positive ones. The positive battered pile would provide better resistance than the vertical pile due to an increase in resisting passive wedge. In the case of the negative one, although there is a decrease in resisting passive wedge, the force that can produce the lateral displacement of interest is even smaller due to the pile inclination. The lateral thrusts on the pile should be first decomposed into the component of compression within the pile and the component normal to the pile, and only the latter can increase the lateral movements. More importantly, compared with positive battered piles, compression would be produced within the negative battered piles and surrounding soil to better mobilize lateral soil resistance [
22]. The greater the magnitude of the pile inclination, the better the lateral resisting capacity. On this basis, a further field test would be carried out to improve the stability of the embankment by replacing the vertical piles in the original plan with the negative battered piles.
In addition, it is undeniable that a rigid pile will rotate under lateral soil movement. However, it does not mean that a rotation failure would necessarily occur for a rigid pile. The rotation angle can be calculated from the displacement of the pile and the length of the pile. Only when the rotation angle or pile head deflection is greater than a certain value can it be regarded as rotation failure, and the rotation angles in most cases before the failure are relatively low.
4.1.2. Bending Moment
Figure 11 demonstrates the non-dimensional bending moment profiles of piles under different pile inclinations. Likewise, almost all the non-dimensional bending moments of the battered piles (
β ≠ 0°) are less than those of the vertical piles (
β = 0°). The variation of pile inclination from 0° to −10° and −20° would reduce the maximum non-dimensional bending moments by 50.8% and 71.8%, respectively, in the event of
p = 34.375 kPa, and reduce the maximum non-dimensional bending moment by 41.1% and 52.3%, respectively, in the event of
p = 84.375 kPa. The change of pile inclination from 0° to +10° and +20° would reduce the maximum non-dimensional bending moment by 14.0% and 44.9%, respectively, in the case of
p = 34.375 kPa, and reduce the maximum non-dimensional bending moment by 9.1% and 44.5%, respectively, in the case of
p = 84.375 kPa. Compared with the vertical piles, these observations have also proved the outstanding performance of the battered piles, especially the negative battered piles, in resisting lateral soil movement for similar aforementioned reasons.
Comparing
Figure 11a,b, there seem to be some differences in the shape of the bending moment profiles in the two loading stages, but the tendencies of the curves are not wholly changed. For instance, the bending moments in both cases increase first and then decrease along the depth direction. The apparent discrepancy is mainly caused by the varied location of the maximum bending moment. The depth of the maximum bending moment moves down from the middle and upper part of the pile to the middle part when the surcharge increases from
p = 34.375 to 84.375 kPa. The change can be more evidently observed in the following section,
Effect of Surcharge Magnitudes. It implies that the lateral movement caused by the embankment surcharge is relatively small and can be resisted only by the reaction of shallow foundation soils when
p = 34.375 kPa. However, with the gradual increase of surcharge, the reaction of the deeper foundation soil layer will be further mobilized.
4.1.3. Earth Pressure
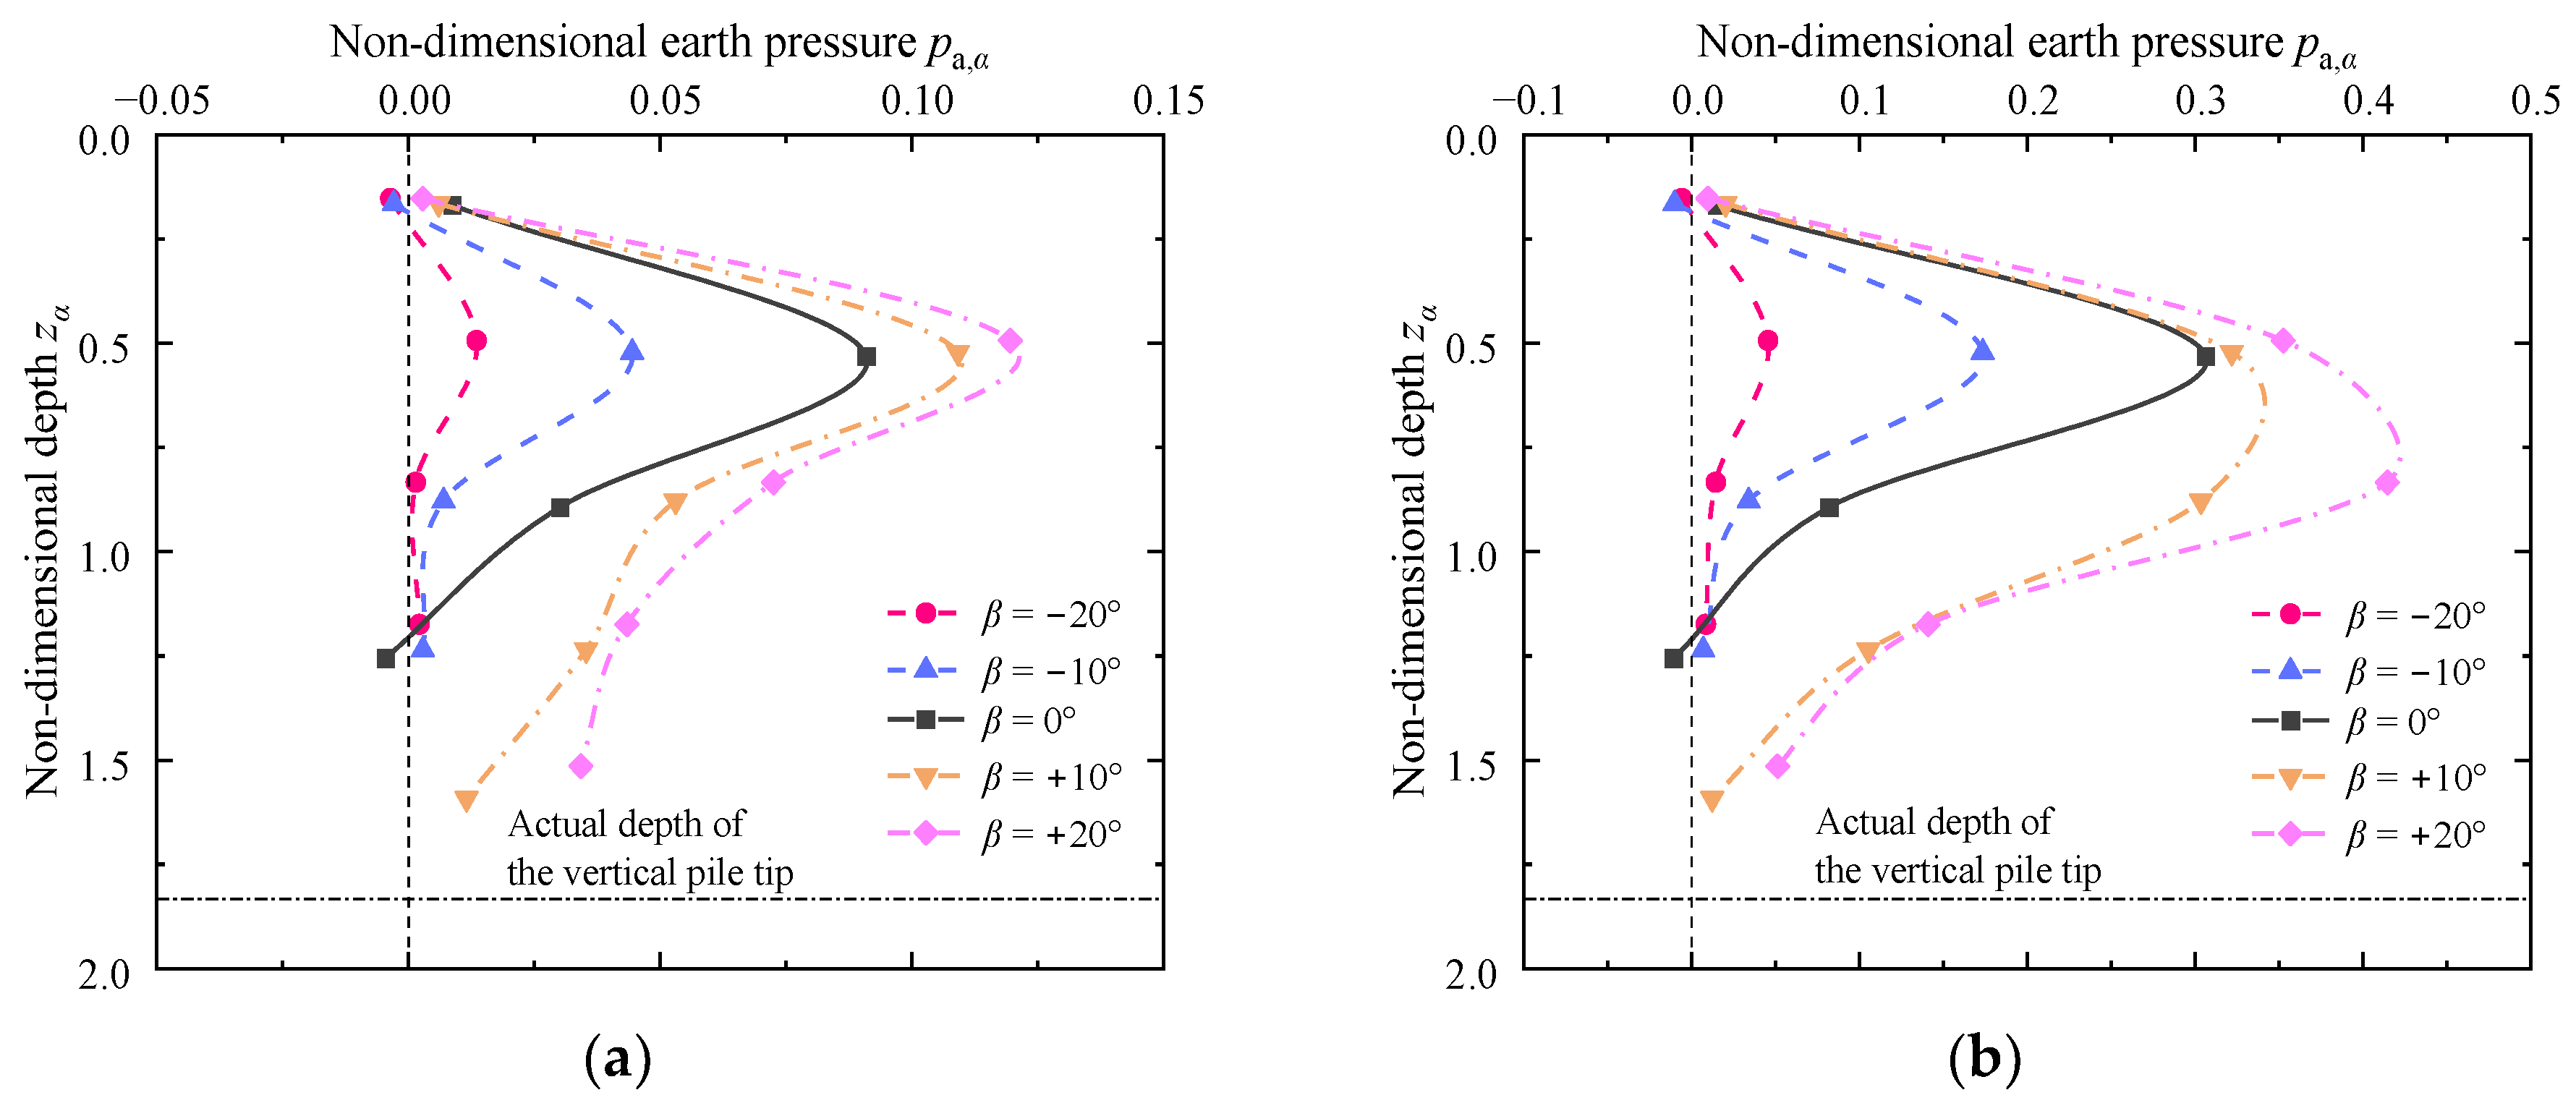
Figure 12 sketches the non-dimensional earth pressure profiles acting on the piles of different pile inclinations. For the case of
p = 34.375 kPa, the maximum non-dimensional earth pressure would increase from 0.01 to 0.12, while the pile inclination varies from −20° to +20°; as to the case of
p = 84.375 kPa, the maximum non-dimensional earth pressure would increase from 0.05 to 0.42, while the pile inclination varies from −20° to +20°. That is, the earth pressure on vertical piles is the intermedial of three types of piles rather than the limits. This characteristic is different from that of the pile deflection and bending moment, and the difference can be first interpreted by the greater stress transfer onto the pile because of the closer embankment-pile distance and then the additional self-weight of soil overlying the positive battered pile.
The earth pressures on these piles would all increase first and then decrease, and almost all the maximum earth pressure would appear at zα = 0.5. Moreover, the earth pressures on the negative battered piles decrease to zero near zα = 1.25, whereas those of the positive battered piles are close to zero near zα = 1.5. The common downtrend is attributed to the increased distances between a point of the pile and the surcharge with the depth. The greater depth of zero-earth pressure in the cases of positive battered piles can be interpreted by the greater overlying soil self-weight of the pile and the closer distance from the embankment when the pile tip of the positive battered pile is approaching the embankment. The elevated location of the zero-earth pressure with a shortened affected length of earth pressure on the piles indicates that the effect of embankment on the pile is greatly minimized for the negative battered piles.
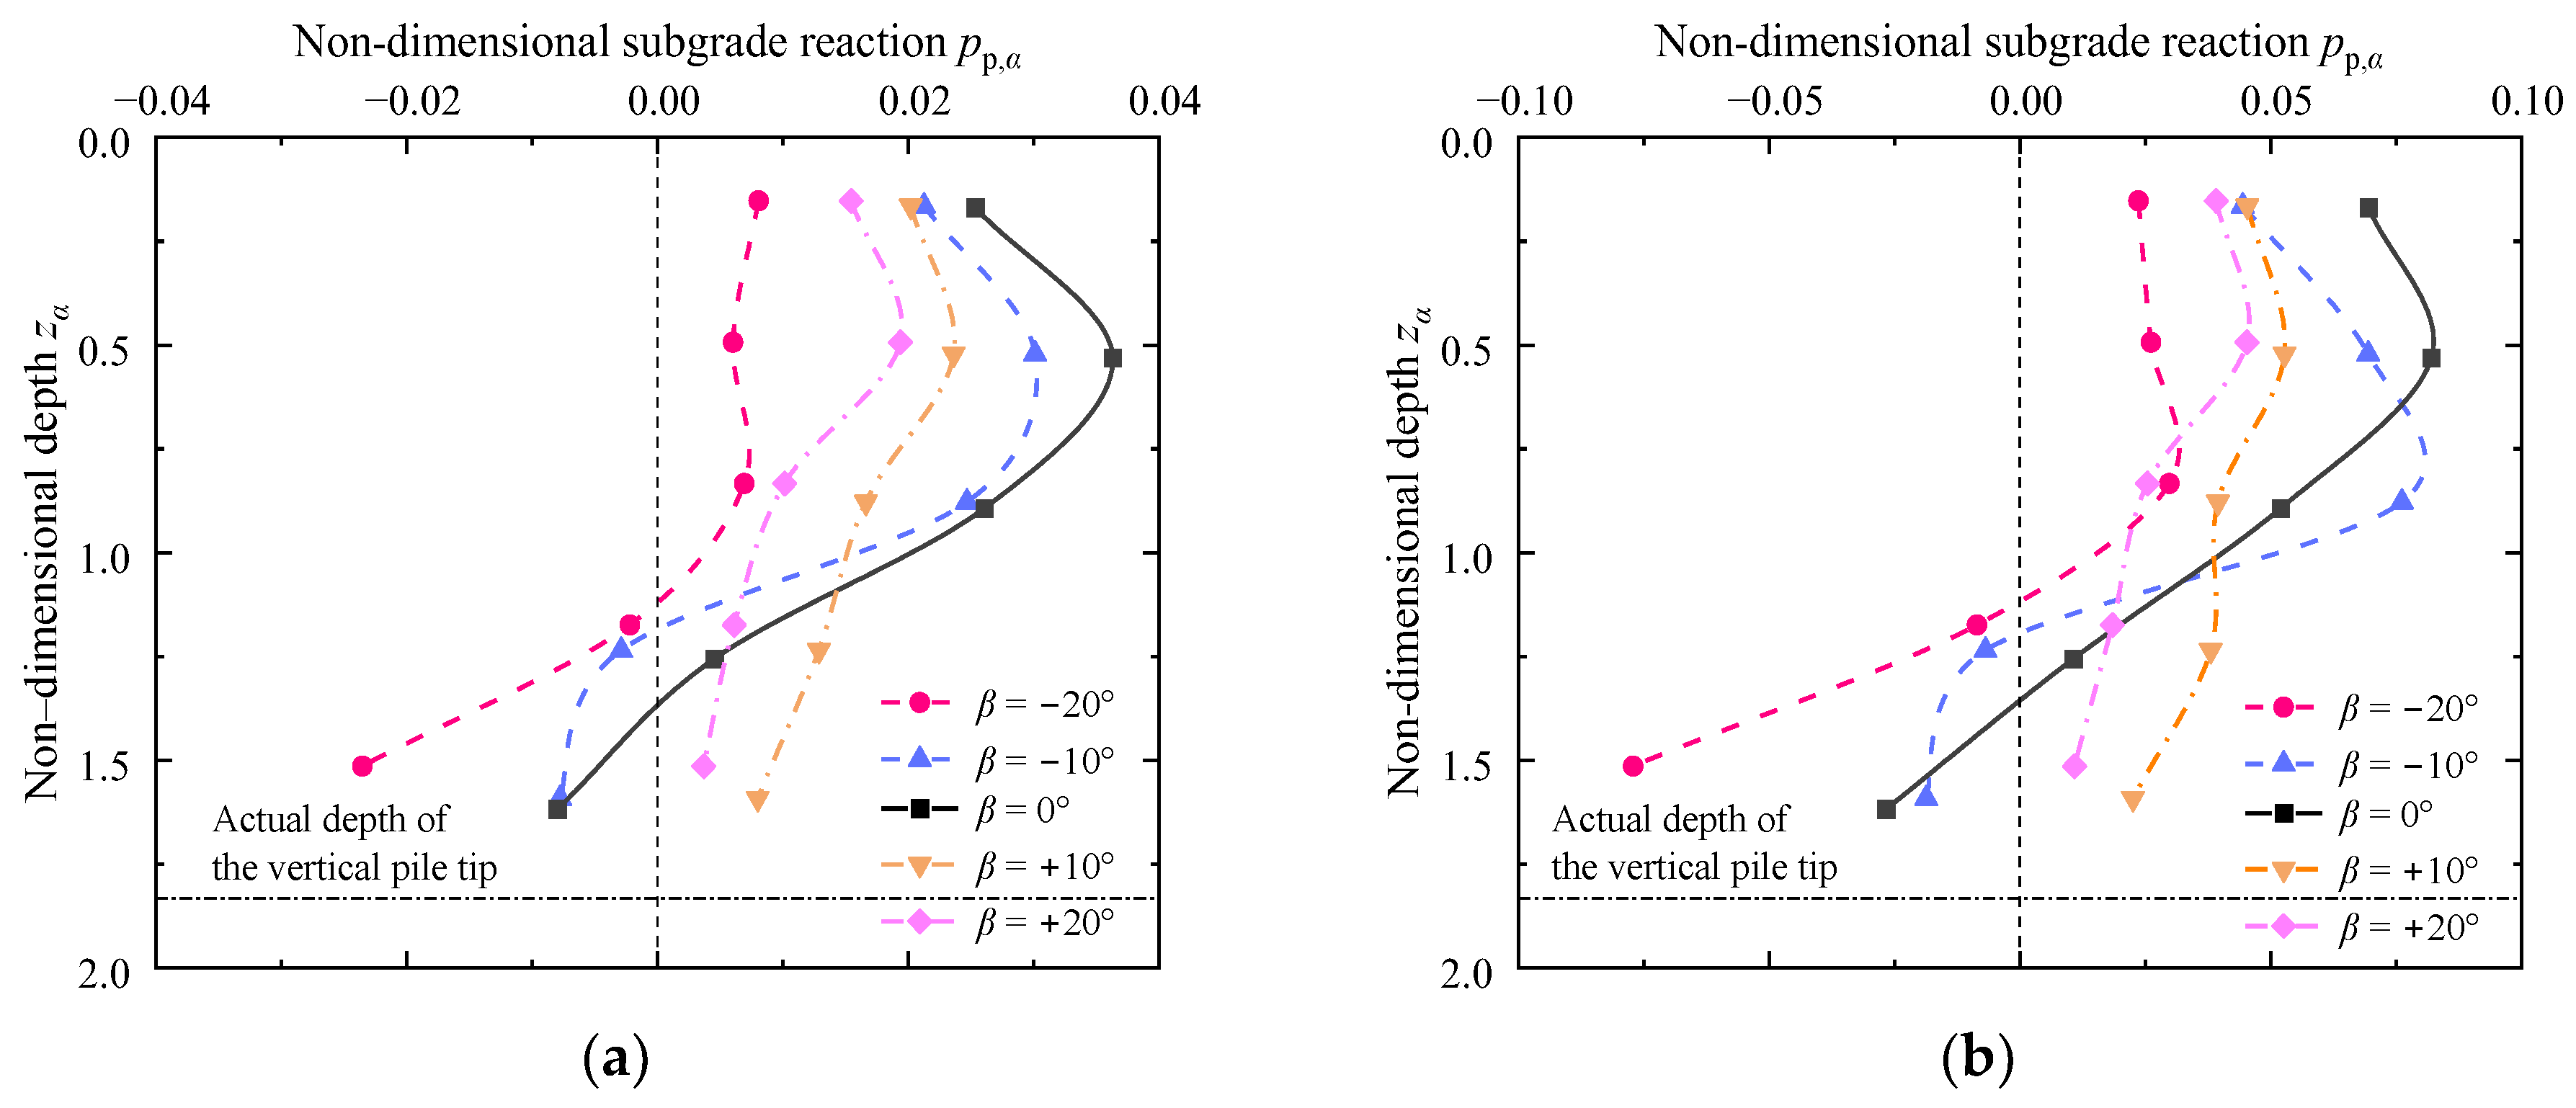
4.1.4. Subgrade Reaction
Figure 13 plots the non-dimensional subgrade reaction profiles under different pile inclinations, and the reaction always increases first and then decreases with increasing depth. Similar to the behavior of the pile deflection and bending moment, nearly all the subgrade reactions on the battered piles (
β ≠ 0°) are less than those on the vertical piles (
β = 0°). Interestingly, the locations of maximum subgrade reaction of the positive battered piles and vertical piles would keep constant at
zα = 0.5. However, the counterpart of the negative battered piles would drop down from
zα = 0.5 to 1.1 while the pile inclination varies from 0 to −20°. It indicates that negative battered piles can transfer the earth pressure to greater depth, and hence, the performance of the negative battered piles in resisting the lateral soil movement is significantly superior to others. Furthermore, the negative non-dimensional subgrade reaction indicates that the negative pile deflection would occur at the lower pile segment in the case of
β = −20°, which would be validated in the next section.
For an intuitive illustration of the influence of pile inclination on pile performance,
Table 4 summarizes the maximum responses (including the maximums of pile deflection, bending moment, earth pressure, and subgrade reaction) under different pile inclinations in the cases of
p = 34.375 and 84.375 kPa.
4.2. Effect of Surcharge Magnitudes
Similarly, example cases of two pile inclinations were given in this section because of similar tendencies.
4.2.1. Pile Deflection
Figure 14 illustrates the variations of non-dimensional pile deflection with depth under different surcharge magnitudes (
p = 34.375, 84.375, 134.375, and 184.375 kPa). There are significant positive relationships between the non-dimensional pile deflection and surcharge magnitudes. For the case of
β = −10°, the non-dimensional pile head deflection increases from 0.005 to 0.022, 0.099, and 0.169, while the surcharge load varies from 34.375 to 84.375, 134.375, and 184.375 kPa, respectively. Again, some type-I abnormal points for the case of
β = −20° during the loading (
Figure 14a) are observed as a result of the same aforementioned reason.
Moreover, instead of a continuing decrease in non-dimensional pile deflections, the non-dimensional pile deflection maintains zero below the non-dimensional depth of zα = 1.25 in the cases of p = 34.375 and 84.375 kPa. The decrease in these two cases can be explained by the possible occurrence of negative non-dimensional pile deflection, indicating that the pile may be rotating about the point of zα = 1.25. In this scenario, the data below the non-dimensional depth of zα = 1.25 are displayed as zero and are considered type-II abnormal points. In addition, the deflections at the pile tip in the cases of p = 134.375 and 184.375 kPa are not equal to zero, indicating that both translation and rotation would occur under large surcharge loads.
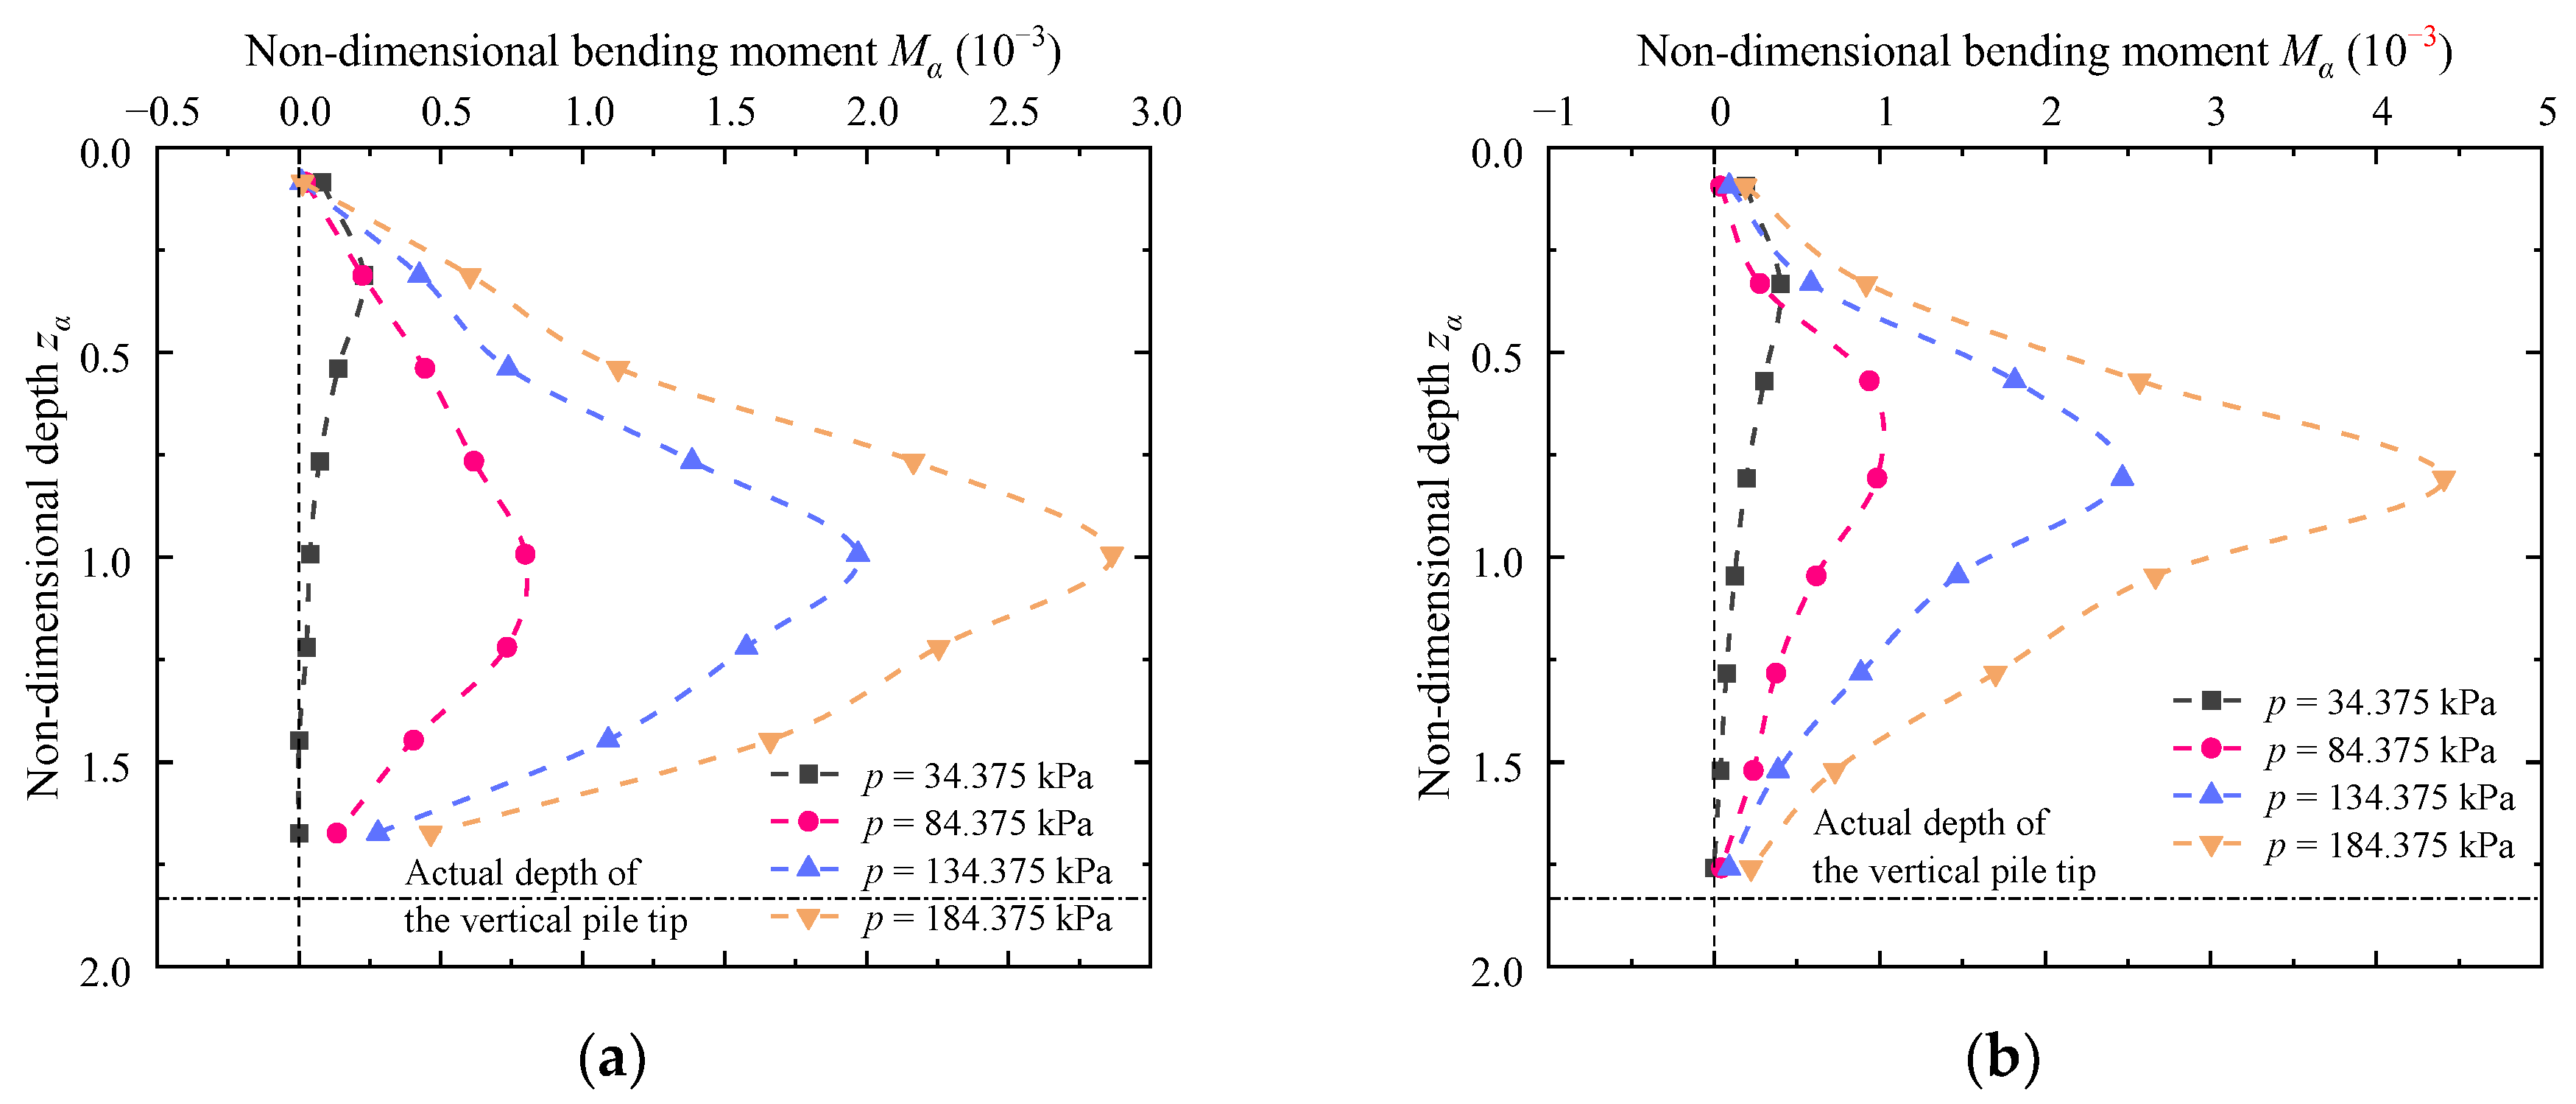
4.2.2. Bending Moment
Figure 15 demonstrates the non-dimensional bending moment profiles of piles under different surcharge magnitudes, increasing first and then decreasing as the depth increases. There are significant positive relationships between the bending moment and surcharge magnitude. The maximum non-dimensional bending moment increases from 0.229 × 10
−3 to 2.865 × 10
−3 (from 0.40 × 10
−3 to 4.41 × 10
−3) in the case of
β = −20° (
β = −10°) while the surcharge load varies from 34.375 to 184.375 kPa. In addition, the location of the maximum bending moments of the negative battered piles (
β = −20° and −10°) for the case of
p = 34.375 kPa appears near
zα = 0.3. However, it would appear in the middle of somewhere between
zα = 1 and
zα = 0.8 for different surcharges (
p = 84.375, 134.375, and 184.375 kPa). In addition, the locations of the maximum bending moments in the case of
β = −20° are deeper than those in the case of
β = −10°, indicating that the negative battered pile of greater inclination can transfer the earth pressure to a deeper depth.
4.2.3. Earth Pressure
Figure 16 depicts the non-dimensional earth pressure profiles on the battered piles under different surcharge magnitudes. The earth pressure would increase first and then decrease, and all the maximum earth pressures appear approximately at
zα = 0.5. In addition, as anticipated, the earth pressure increases with the surcharge load. While the surcharge load increases from 34.375 to 84.375, 134.375, and 184.375 kPa, the maximum non-dimensional earth pressure increases from 0.01 to 0.05, 0.11, and 0.17 in the case of
β = −20° and varies from 0.04 to 0.17, 0.33, and 0.45 in the case of
β = −10°, respectively.
4.2.4. Subgrade Reaction
Figure 17 illustrates the non-dimensional subgrade reaction profiles under different surcharge magnitudes. As anticipated, the subgrade reaction increases with the surcharge loads. The subgrade reactions increase first and then decrease, and the maximum subgrade reactions appear at
zα = 1.1 and 0.75 in the cases of
β = −20° and −10°, respectively. While the surcharge load varies from 34.375 to 84.375, 134.375, and 184.375 kPa, the maximum non-dimensional subgrade reaction increases from 0.01 to 0.04, 0.08, and 0.13 in the case of
β = −20° and varies from 0.03 to 0.08, 0.13 and 0.19 in the case of
β = −10°, respectively.
For an intuitive illustration of the influence of surcharge magnitudes on pile performance,
Table 5 summarizes the maximum responses (including the maximums of pile deflection, bending moment, earth pressure, and subgrade reaction) under different surcharge magnitudes in the cases of
β = −20° and −10°.
4.3. Effect of Constraint Conditions at the Pile Tip
4.3.1. Pile Deflection and Bending Moment
Figure 18 gives the non-dimensional depth versus non-dimensional pile deflection curves and non-dimensional bending moment profiles of the negative battered piles (
β = −20°) under different constraint conditions at the pile tip (free-tip and fixed-tip). The non-dimensional pile deflections and non-dimensional bending moments for cases of a fixed tip are significantly less than those of a free tip with the same surcharge load.
The reductions of the maximum non-dimensional bending moments due to fixed tip boundary conditions under different surcharge loads are 86.7%, 53.0%, 59.4%, and 48.5%, respectively. Moreover, the distribution pattern of the bending moment profiles under free tip boundary conditions is quite different from that under fixed tip boundary conditions. The former increases first and then decreases, and the maximum bending moment appears approximately at zα = 1; the latter is M-shaped with two extreme positive bending moments at zα = 0.5 and 1.25. Furthermore, considerable negative bending moments would happen at the bottom of fixed tip piles, and their values are significantly greater than the positive bending moments.
4.3.2. Earth Pressure and Subgrade Reaction
Figure 19 demonstrates the variations of the non-dimensional earth pressure and subgrade reactions with depth on the negative battered piles (
β = −20°) under different constraint conditions at the pile tip (free tip and fixed tip). As expected, the non-dimensional earth pressure and subgrade reaction under fixed tip boundary conditions would be less than those under free tip boundary conditions. In addition, the constraint condition at the pile tip would little affect the location of the maximum non-dimensional earth pressures. However, the locations of the maximum non-dimensional subgrade reactions and zero non-dimensional subgrade reactions would move downward while the restriction on the pile tip is released to the free tip boundary condition.
For an intuitive illustration of the influence of the pile tip constraint conditions on pile performance,
Table 6 summarizes the maximum responses (including the maximums of pile deflections, bending moment, earth pressure, and subgrade reaction) under different pile tip constraint conditions in the case of
β = −20°.
5. Conclusions
This study has designed a reduced-scale model experiment to explore the performance of battered piles resisting lateral soil movement in a test tank filled with sandy soil. To minimize the error caused by the disturbance of loading and maintain the loading stress level, a lever loading system was designed, comprising the bearing plate under the pivot (angle steel), a one-end hinged lever (universal beam), and balance weight blocks. High sensitivity sensors (i.e., the dial indicators, strain gauges, and earth pressure cells) were instrumented to record the responses of the pile and the embankment (i.e., pile deflection and strain, earth pressure, and subgrade reaction). Moreover, the effects of pile inclinations, surcharge magnitudes, and constraint conditions at the pile tip on pile responses are considered. On account of these test observations, the consequences can be drawn as follows:
- (i)
The battered piles are significantly superior to the vertical piles in resisting lateral soil movements, and the negative battered piles outperform the other piles, providing a feasible alternative solution to the reinforcement project. In particular, the effect of the pile inclination on the maximum responses of the pile-soil system under different surcharge loads is intuitively given in tabular forms. In this way, a quantitative understanding of this effect is helpful to the preliminary design of the project and provides a certain basis for the follow-up field tests.
- (ii)
The value of earth pressure on the vertical piles is not the maximum but is intermedial to the ones of the battered piles. This characteristic is different from that of the pile deflection and bending moment, and the difference can be first interpreted by the greater stress transfer onto the pile because of the closer embankment-pile distance and then the additional self-weight of soil overlying the positive battered pile.
- (iii)
Almost all the maximum earth pressure would appear at zα = 0.5, but the earth pressure vanishes earlier for the negative battered piles; the earth pressures on the negative battered piles decrease to zero near zα = 1.25, whereas those of the positive battered piles are close to zero near zα = 1.5. Consequently, the effect of embankment on the pile is minimized for the negative battered piles.
- (iv)
The negative battered pile of greater inclination can transfer the earth pressure to a deeper depth; the locations of maximum bending moments in the case of β = −20° are deeper than those in the case of β = −10°.
- (v)
Because of greater energy dissipated by a stronger constraint, the responses under the fixed tip boundary conditions are significantly less than those under free tip boundary conditions. The fixed tip is thus more favorable, but considerable negative bending moments, even significantly greater than the positive bending moments, would occur at the lower part.
This article explores the performance of battered single piles in a sand test tank to resist lateral soil movement using model testing methods. However, there has been no discussion on composite piles under active loads, such as pile raft foundations [
44,
45,
46], as well as issues related to unsaturated soil [
43,
47] and moisture migration [
48,
49,
50], which still need to be further addressed.


