Abstract
The radar scattering characteristics of extended objects are an important parameter for perception and tracking algorithms in automated driving tasks. Therefore, high-fidelity sensor models are required to simulate and evaluate typical driving scenarios in virtual testing applications. While the general analysis of typical scattering centers of passenger cars is well studied, there are only a few publicly available reports that analyze specific features of the scattering characteristics of different vehicle types. Hence, this work presents detection distributions derived from systematic measurements for six different vehicle types, conducted with a commercial automotive radar on a proving ground. In particular, the contribution of underbody reflections to the respective radar signatures is analyzed, which are caused by multipath propagation via the road surface. The measurements reveal distinctive differences between the scattering characteristics of different vehicles, which are attributed to the respective underbody geometry.
1. Introduction
Precise and robust environmental perception and tracking algorithms are essential sensing processes enabling automated driving functions. Both require information about the spatial extent of objects for detection, classification and tracking. With the improving resolution of modern radar sensors, their contribution towards automated driving functions increases significantly [1].
To accelerate the design and development cycles and to cope with the tremendous requirements regarding safety assurance, virtual test methods and high-fidelity sensor models are needed [2,3]. Simulating the complex signatures of extended targets is particularly challenging due to the underlying richness of the physical effects. The sensor receives superposed backscatter from multiple reflection centers on the target, leading to temporal and spatial fluctuations that depend on the range resolution and the angular resolution of the sensor [4]. Therefore, the extraction of scattering centers is a widely addressed and well-studied research field. Schuler et al. extract virtual scattering centers of vehicles by using ray-tracing simulations [5]. Another way to analyze the backscatter of objects is to perform systematic measurements, e.g., by rotating the sensor around the object [6] or by placing the object under test on a turntable [7]. Andres et al. [8] use synthetic aperture radar (SAR) to extract the location of scattering centers. For passenger cars, most reflections are detected along their contour [9]. Main scattering centers are located at the wheels, light units, pillars, outside mirrors and the license plate [6,8]. Multipath propagation leads to indirect detections of scattering centers, caused by reflections via the road surface. Altogether, the entity of scattering effects shapes scattering characteristics that can then be integrated into target models [10,11,12,13,14].
Until today, there are only a few reports in the literature that analyze the radar scattering fingerprints of different vehicles. Elster et al. [15] show that the body shape of vehicles has a major influence on the respective radar cross section (RCS) value and the spatial location of the detection with the highest RCS value per measurement cycle. However, they do not analyze the accumulated distributions of all received target detections for the different vehicles. When vehicles are observed under certain aspect angles, many detections spread across the entire bounding box of a vehicle [16]. This raises the question if multipath propagation causes additional detections, e.g., at the underbody. Consequently, this might result in different scattering characteristics for different types of vehicles, depending on the geometry of the respective underbody.
Therefore, this paper analyzes the influence of underbody detections and investigates whether the underbody detections enable radar-based fingerprinting of different vehicle types. Section 2 briefly describes the experimental setup for the conducted test campaign. In Section 3.1, the contribution of underbody detections to the scattering characteristics of vehicles is analyzed using microwave absorbers. Section 3.2 presents the measurement results for six different vehicles: First, for each vehicle, the spatial distribution of detections as well as the RCS distribution are analyzed and their correlation with the geometry of the respective underbody is discussed. Then, the arithmetic mean numbers of target detections per measurement cycle are compared for variable distances between the sensor and the target. Finally, the reflectivity of the different vehicle underbodies is directly compared by visualizing the distribution of detections and their RCS values in longitudinal direction.
2. Materials and Methods
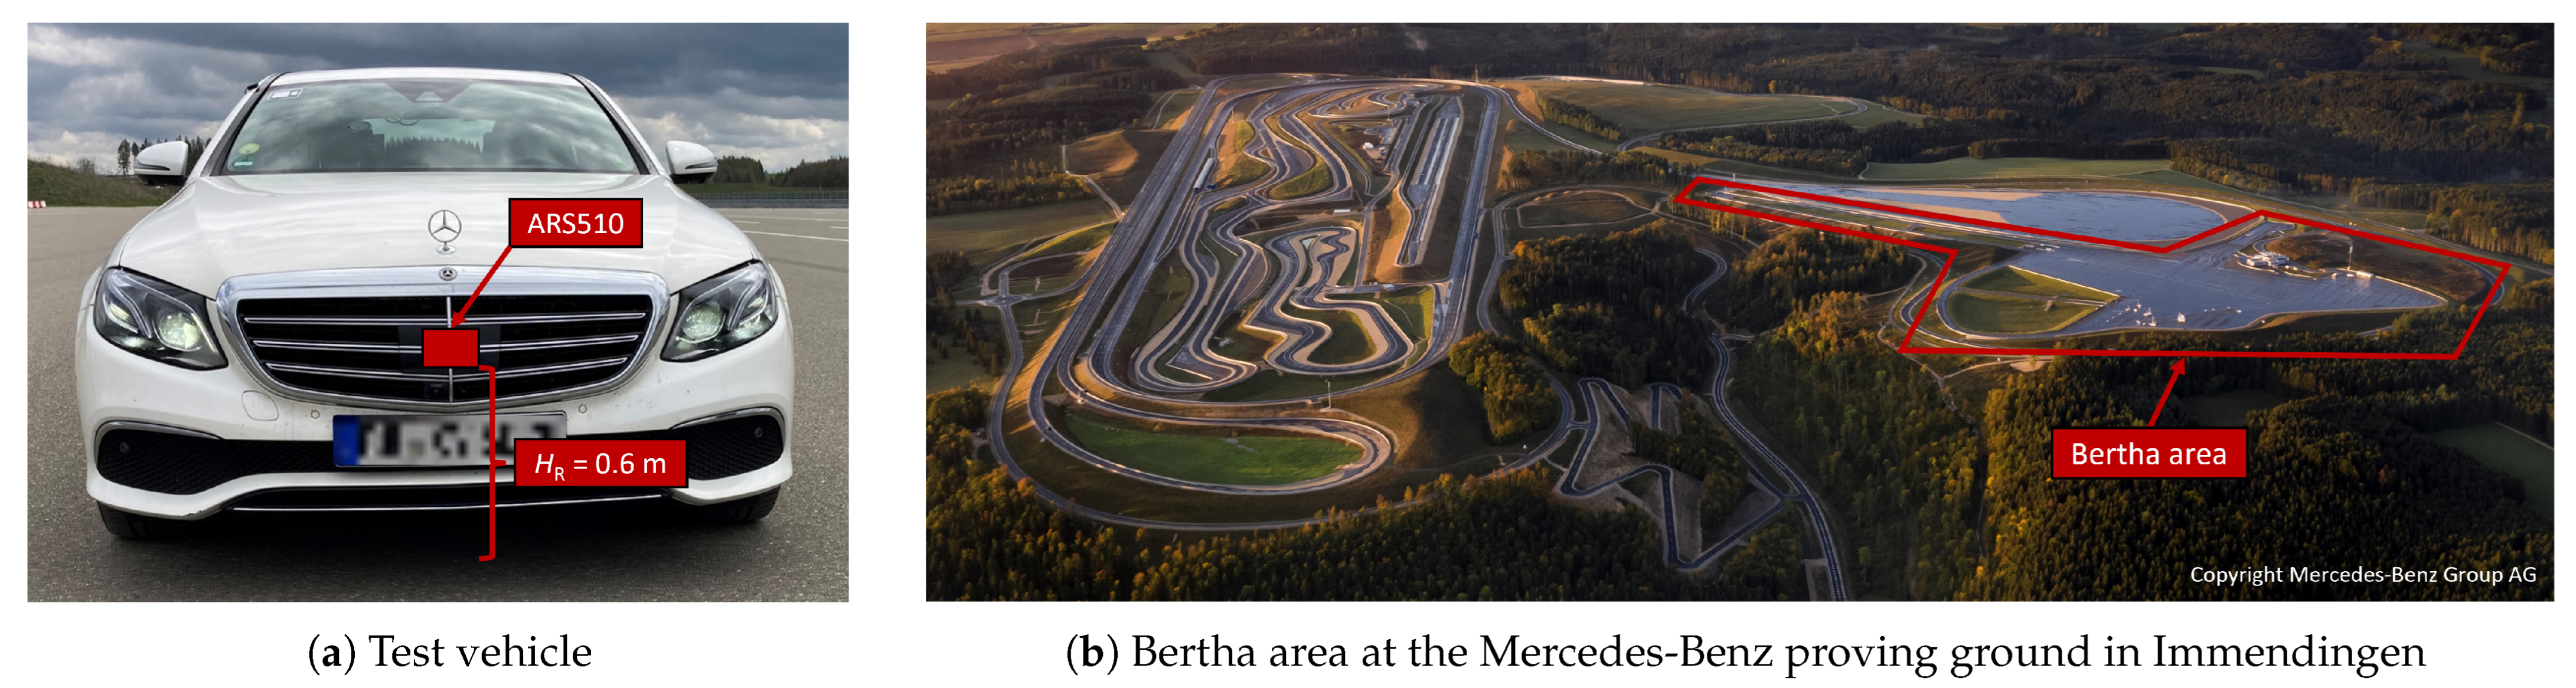
The test vehicle (W213 E-class, Figure 1a) was equipped with an ARS510, a commercial automotive long-range radar [17], mounted at the center of the front bumper at a mounting height of . The measurements were conducted at the Mercedes-Benz proving ground [18] in Immendingen, Germany (Figure 1b), to ensure well-defined measurement conditions without disruptive effects from other traffic participants or infrastructure (e.g., guardrails or light poles). There are more than 30 different test circuits with tracks over a total surface area of 520 hectares. The tests were conducted in the Bertha area, which is used to test driver assistance systems and autonomous vehicles. This area is long and up to wide.
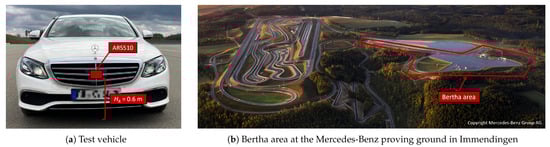
Figure 1.
Images of the test vehicle (a) and the proving ground (b).
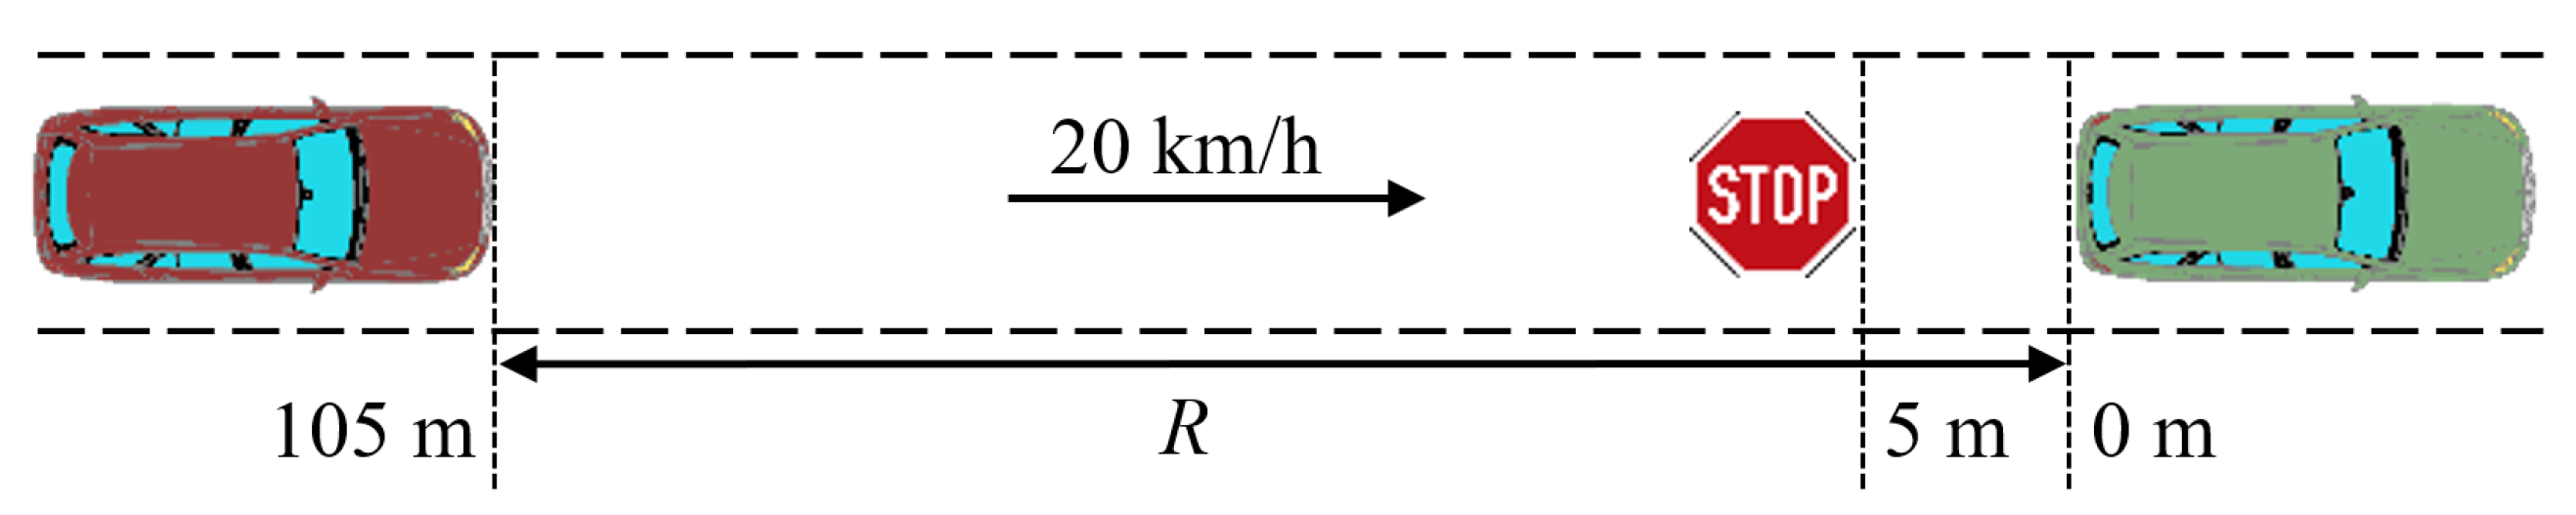
Figure 2 illustrates the selected test scenario: the test vehicle drives at a constant speed of 20 km/h towards a static vehicle in the same lane. The distance R varies from to , while the resulting aspect angle remains approximately constant at a value of 0°. Under these conditions, it is expected that the influence of underbody reflections is most clearly visible, because the vehicle is located in several range cells of the radar sensor. Therefore, multiple detections per vehicle can be measured due to the range resolution of the sensor. Additionally, the symmetry of vehicles in the longitudinal direction is beneficial to evaluate the reflectivity of different regions of the underbody. Ten repetitions were recorded for each set of measurements. Each recording was truncated at a distance of to eliminate undesirable effects caused by the braking maneuver of the test vehicle. The object list provided by the sensor was used to extract all radar detections from the target vehicle and transform them into the target coordinate system.
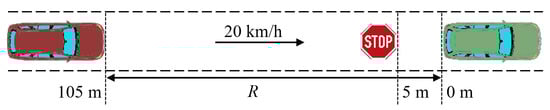
Figure 2.
Illustration of the test scenario: The test vehicle (red) drives along a straight route towards a static vehicle (green) in the same lane.
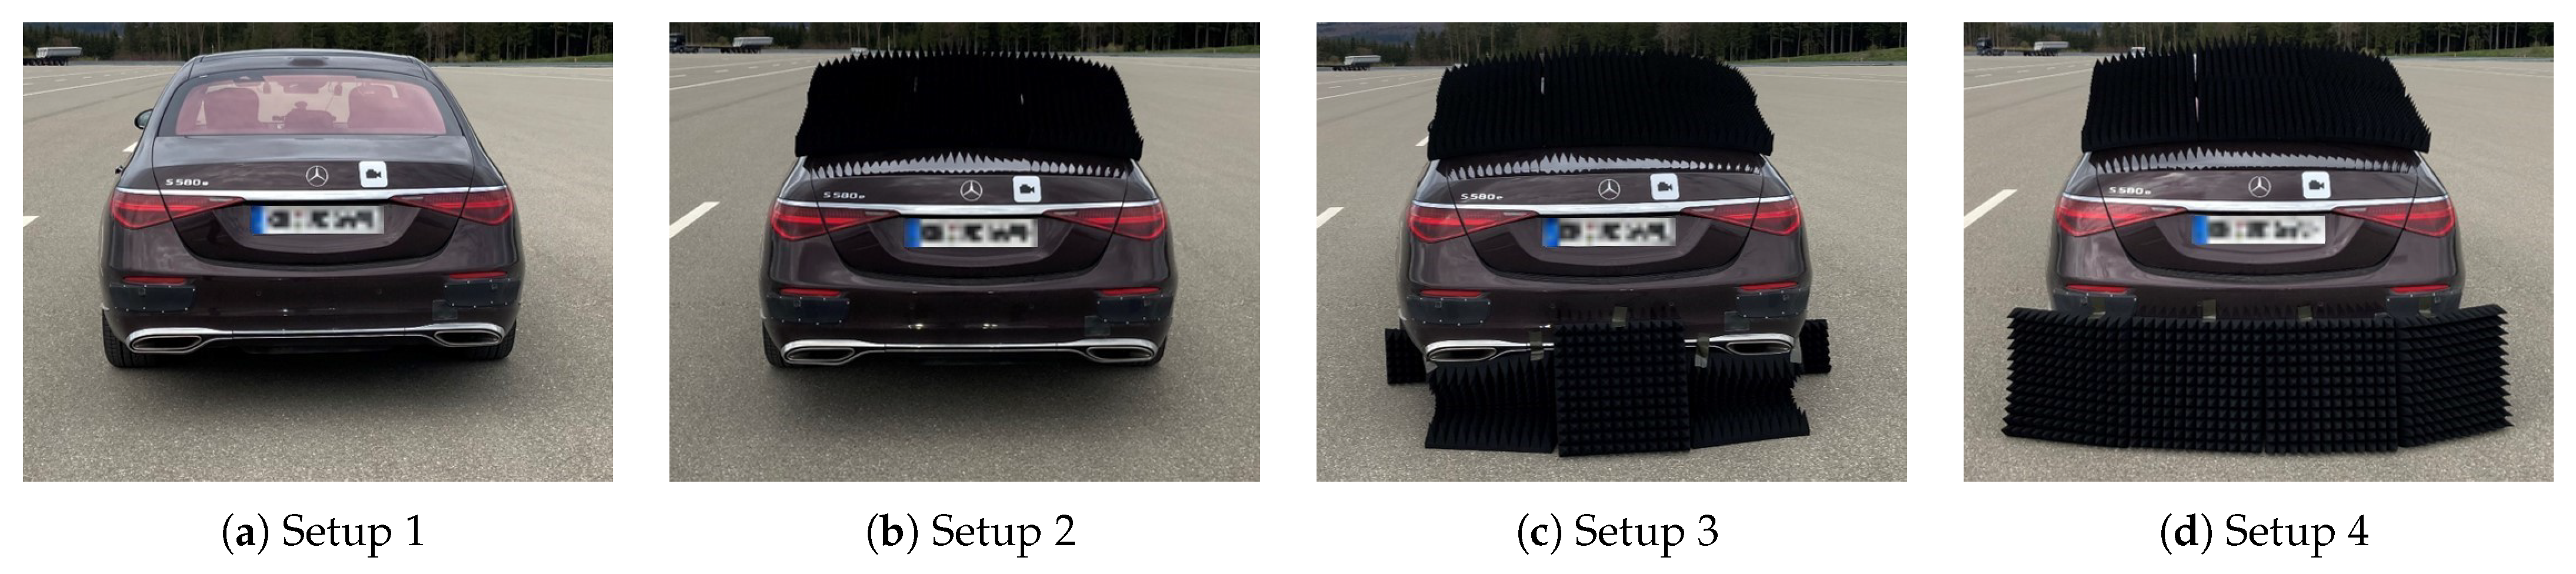
To evaluate the contribution of underbody detections to the scattering characteristics of vehicles, pyramidal microwave absorbers with a height of were placed for different measurement runs in different positions at the target vehicle (Figure 3). In the first setup depicted in Figure 3a used as a reference, the target detections were recorded without microwave absorbers. Then, absorbers were positioned on the rear window as shown in Figure 3b, to identify the influence of reflections from the C-pillar and the roof. In the third setup depicted in Figure 3c, additional absorbers were placed underneath the rear bumper to obstruct the propagation path under the car. Finally, the absorbers underneath the rear bumper were repositioned to cover the tailpipes as well, as illustrated in Figure 3d.
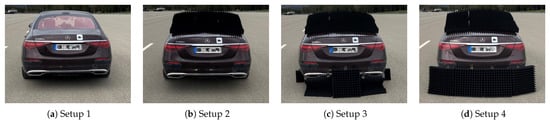
Figure 3.
Illustration of the measurement setup to analyze the influence of underbody detections. Microwave absorbers were placed in different positions to identify the origin of measured target detections.
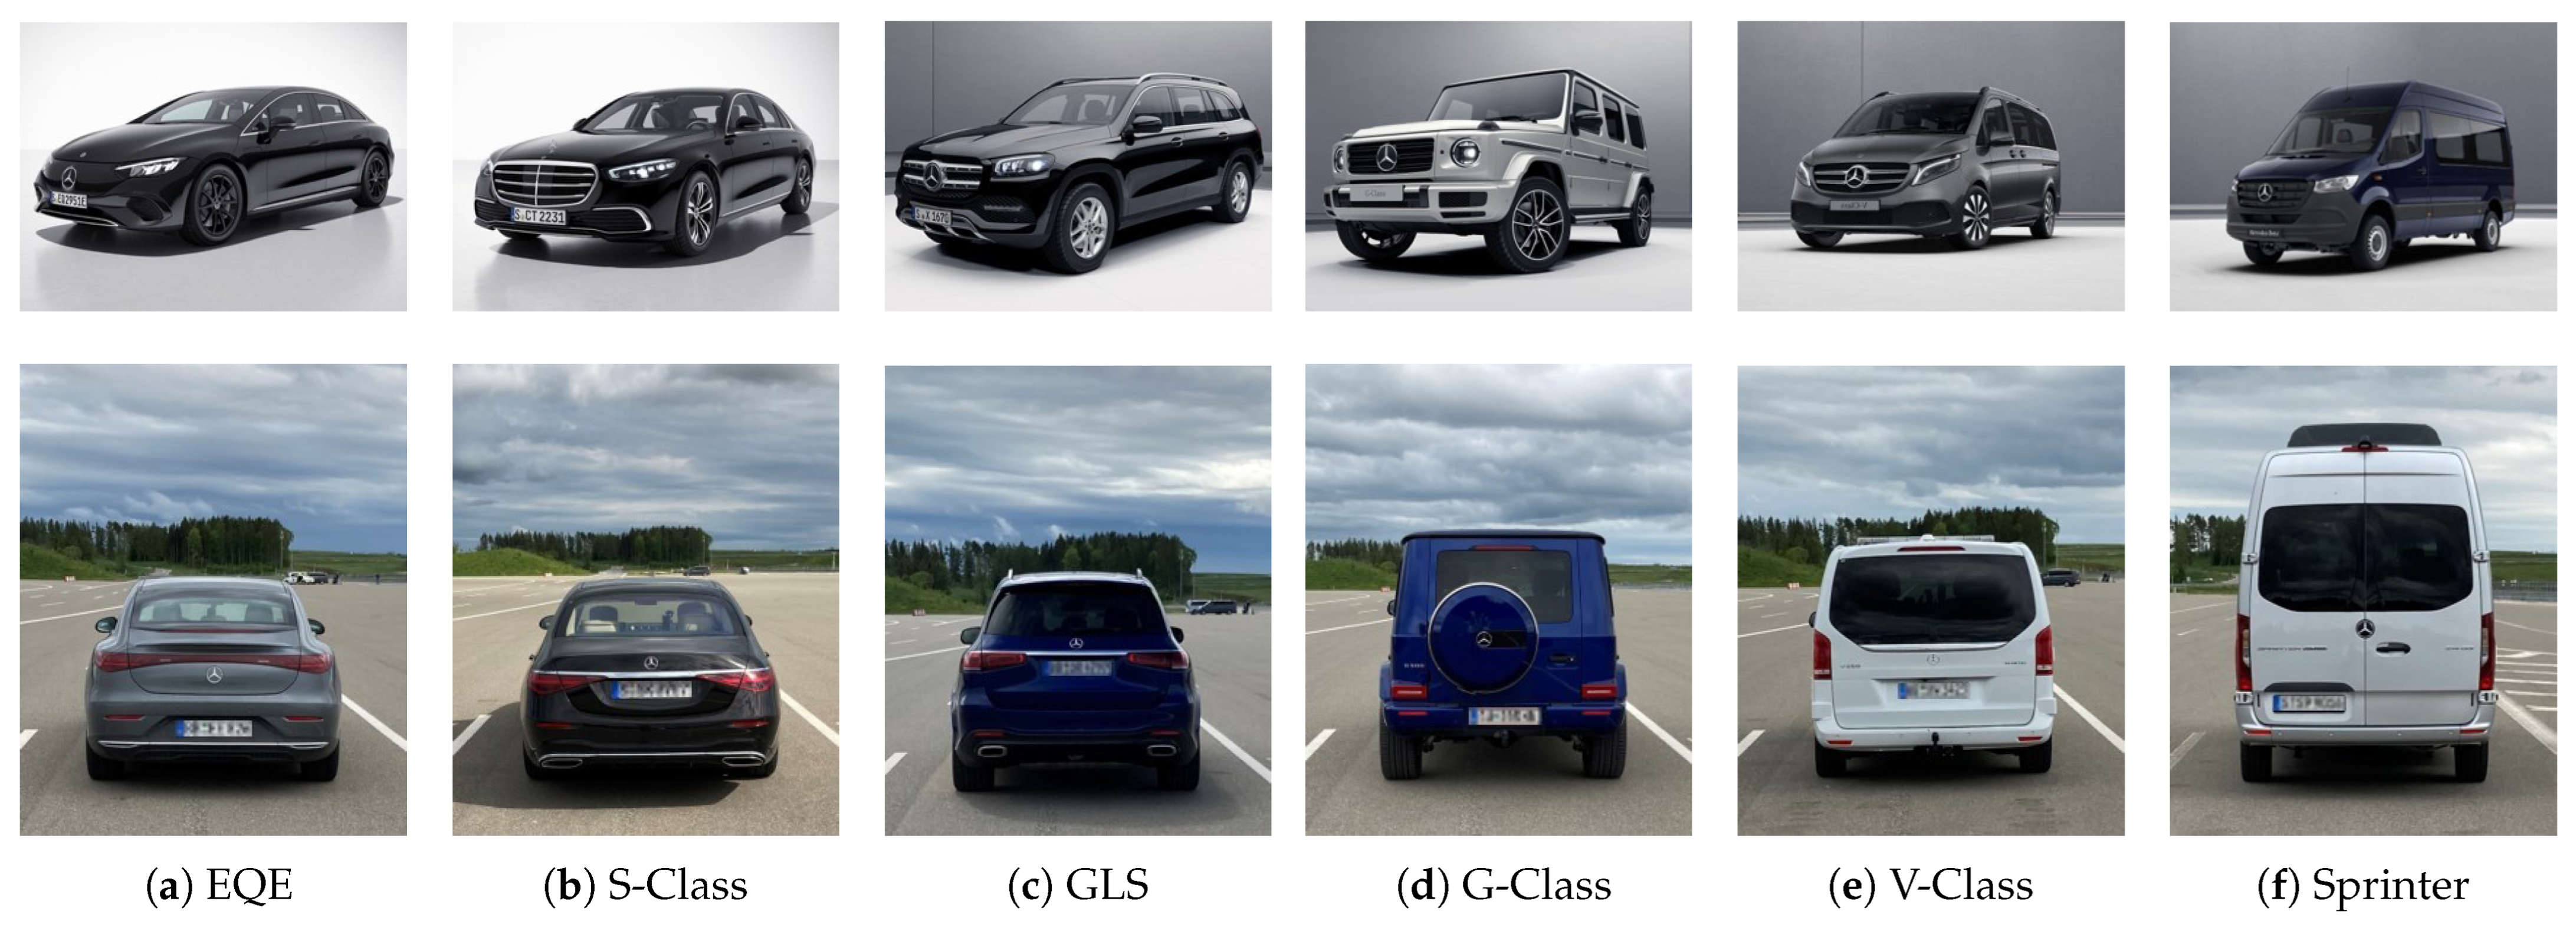
Next, the target detections from different vehicle types were recorded. Six different vehicles from Mercedes-Benz were used as target vehicles (Figure 4), they were selected to represent a variety of body shapes, ground clearances and powertrains: Two limousines—one with a combustion engine (S-Class S580, model year 2020) and one battery-electric vehicle (EQE 350, model year 2022), one SUV (GLS 580, model year 2020), one off-road vehicle (G-Class G500, model year 2018) and two Vans (V-Class V250, model year 2014, and Sprinter Mobility 23, model year 2018). With the exception of the Sprinter, all vehicles have roughly similar lengths L and widths W (Table 1), but different heights H and body shapes. The space between the road surface and the underbody influences potential multipath propagation underneath the car. The ground clearance Z is defined by the height of the lowest part of the underbody except for the wheels, which might be different than the height of other underbody parts, bumper and side skirts. Therefore, it is difficult to identify a single parameter that characterizes the geometric boundary conditions for multipath propagation. However, the authors expect that these height differences are negligible compared to the geometry and materials of the underbody, due to the limited resolution of the radar sensor. In addition, the vehicles have different powertrains, which could affect the underbody reflections.
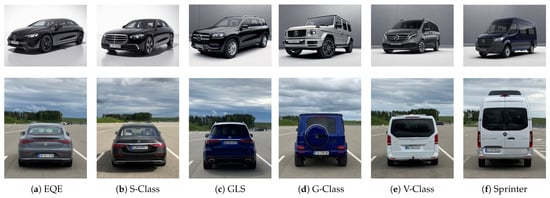
Figure 4.
Illustration of the different vehicle types that were used as targets in the front view (top row) and rear view (bottom row).

Table 1.
Dimensions of the target vehicles.
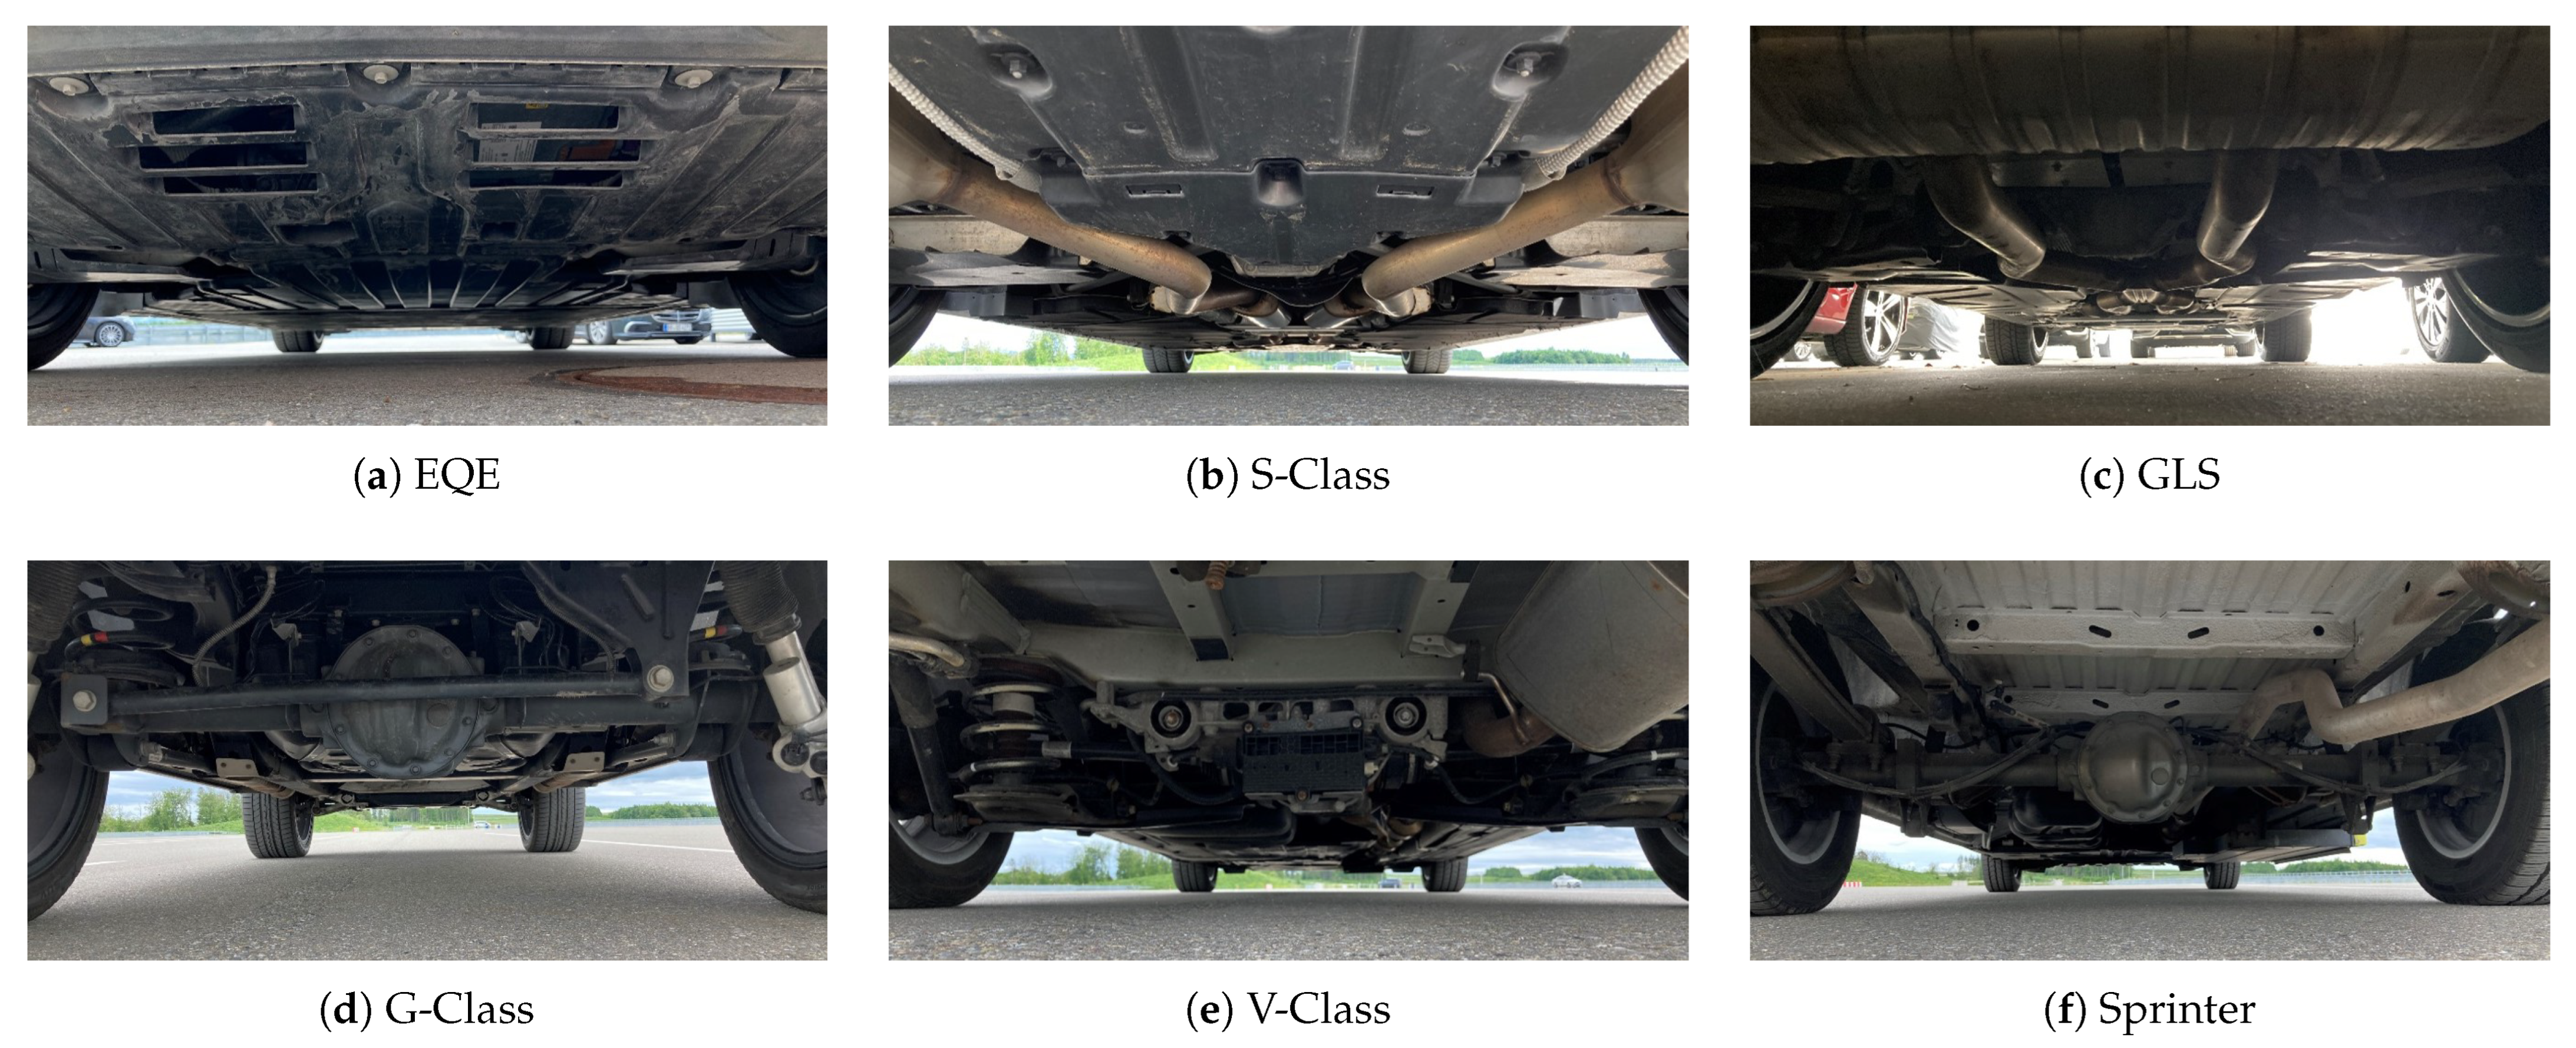
Figure 5 shows photographs of the underbody for each target vehicle. For the S-Class and the GLS, pipes and catalysts of the exhaust aftertreatment system are clearly visible. Since the EQE does not have a combustion engine, the underbody is rather flat without any visible parts that might cause strong reflections, except for the wheels. Compared to the other vehicles, the underbodies of the G-Class, V-Class and Sprinter show distinct differences: The rear axle, wheel suspensions and chassis frame are clearly visible, which might lead to strong backscattering.
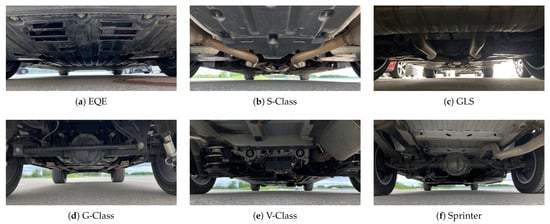
Figure 5.
Photographs of the underbody for the different vehicles.
3. Results and Discussion
3.1. Contribution of Underbody Detections to the Overall Scattering Characteristics of Vehicles
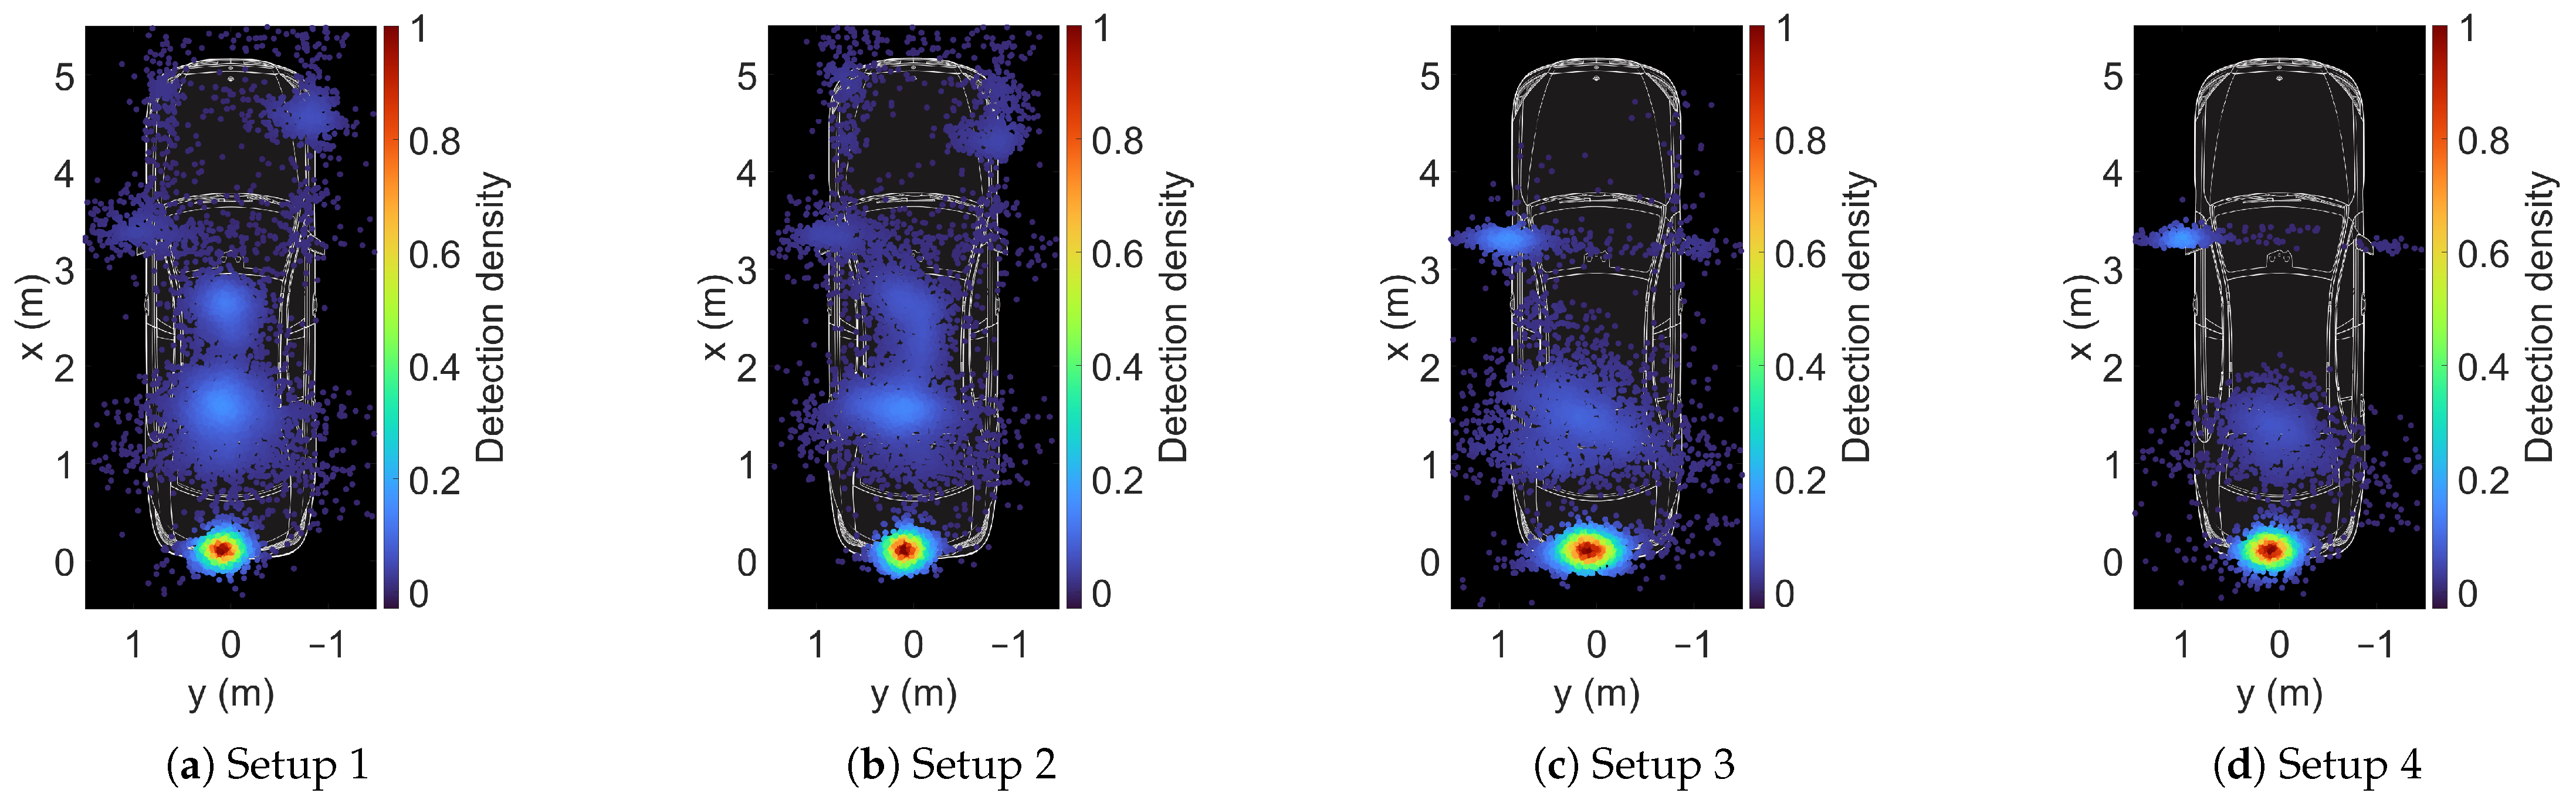
As a first step, the contribution of underbody detections to the backscattering of vehicles was investigated using microwave absorbers, as illustrated in Figure 3. Figure 6 illustrates the accumulated radar detections during ten measurement runs across the two-dimensional projection of the bounding box in a false-color representation. The detection density was estimated using two-dimensional histogram smoothing [19]. Without any absorbers (Setup 1), the detections were distributed over the entire bounding box of the vehicle, and the highest detection density was located at the rear bumper. When absorbers were placed on the rear window (Setup 2), no major change in the detection distribution was noticeable. The detection density in the region of the rear window was slightly lower compared to the previous measurement. Upon placing additional absorbers between the road surface and the bumper (Setup 3), the amount of detections in the front part of the vehicle decreased significantly. A group of detections was measured at the left side mirror at . There is still an accumulation of detections at , but with a lower detection density. When the exhaust trims were also covered by the absorbers (Setup 4), this accumulation of detections was significantly reduced. We conclude that some detections are caused by reflections within the exhaust system. We speculate that the remaining detections at might result from residual reflections of the absorbers on the rear window.
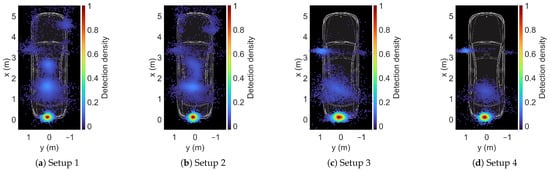
Figure 6.
Spatial detection distributions for the four measurement setups using microwave absorbers.
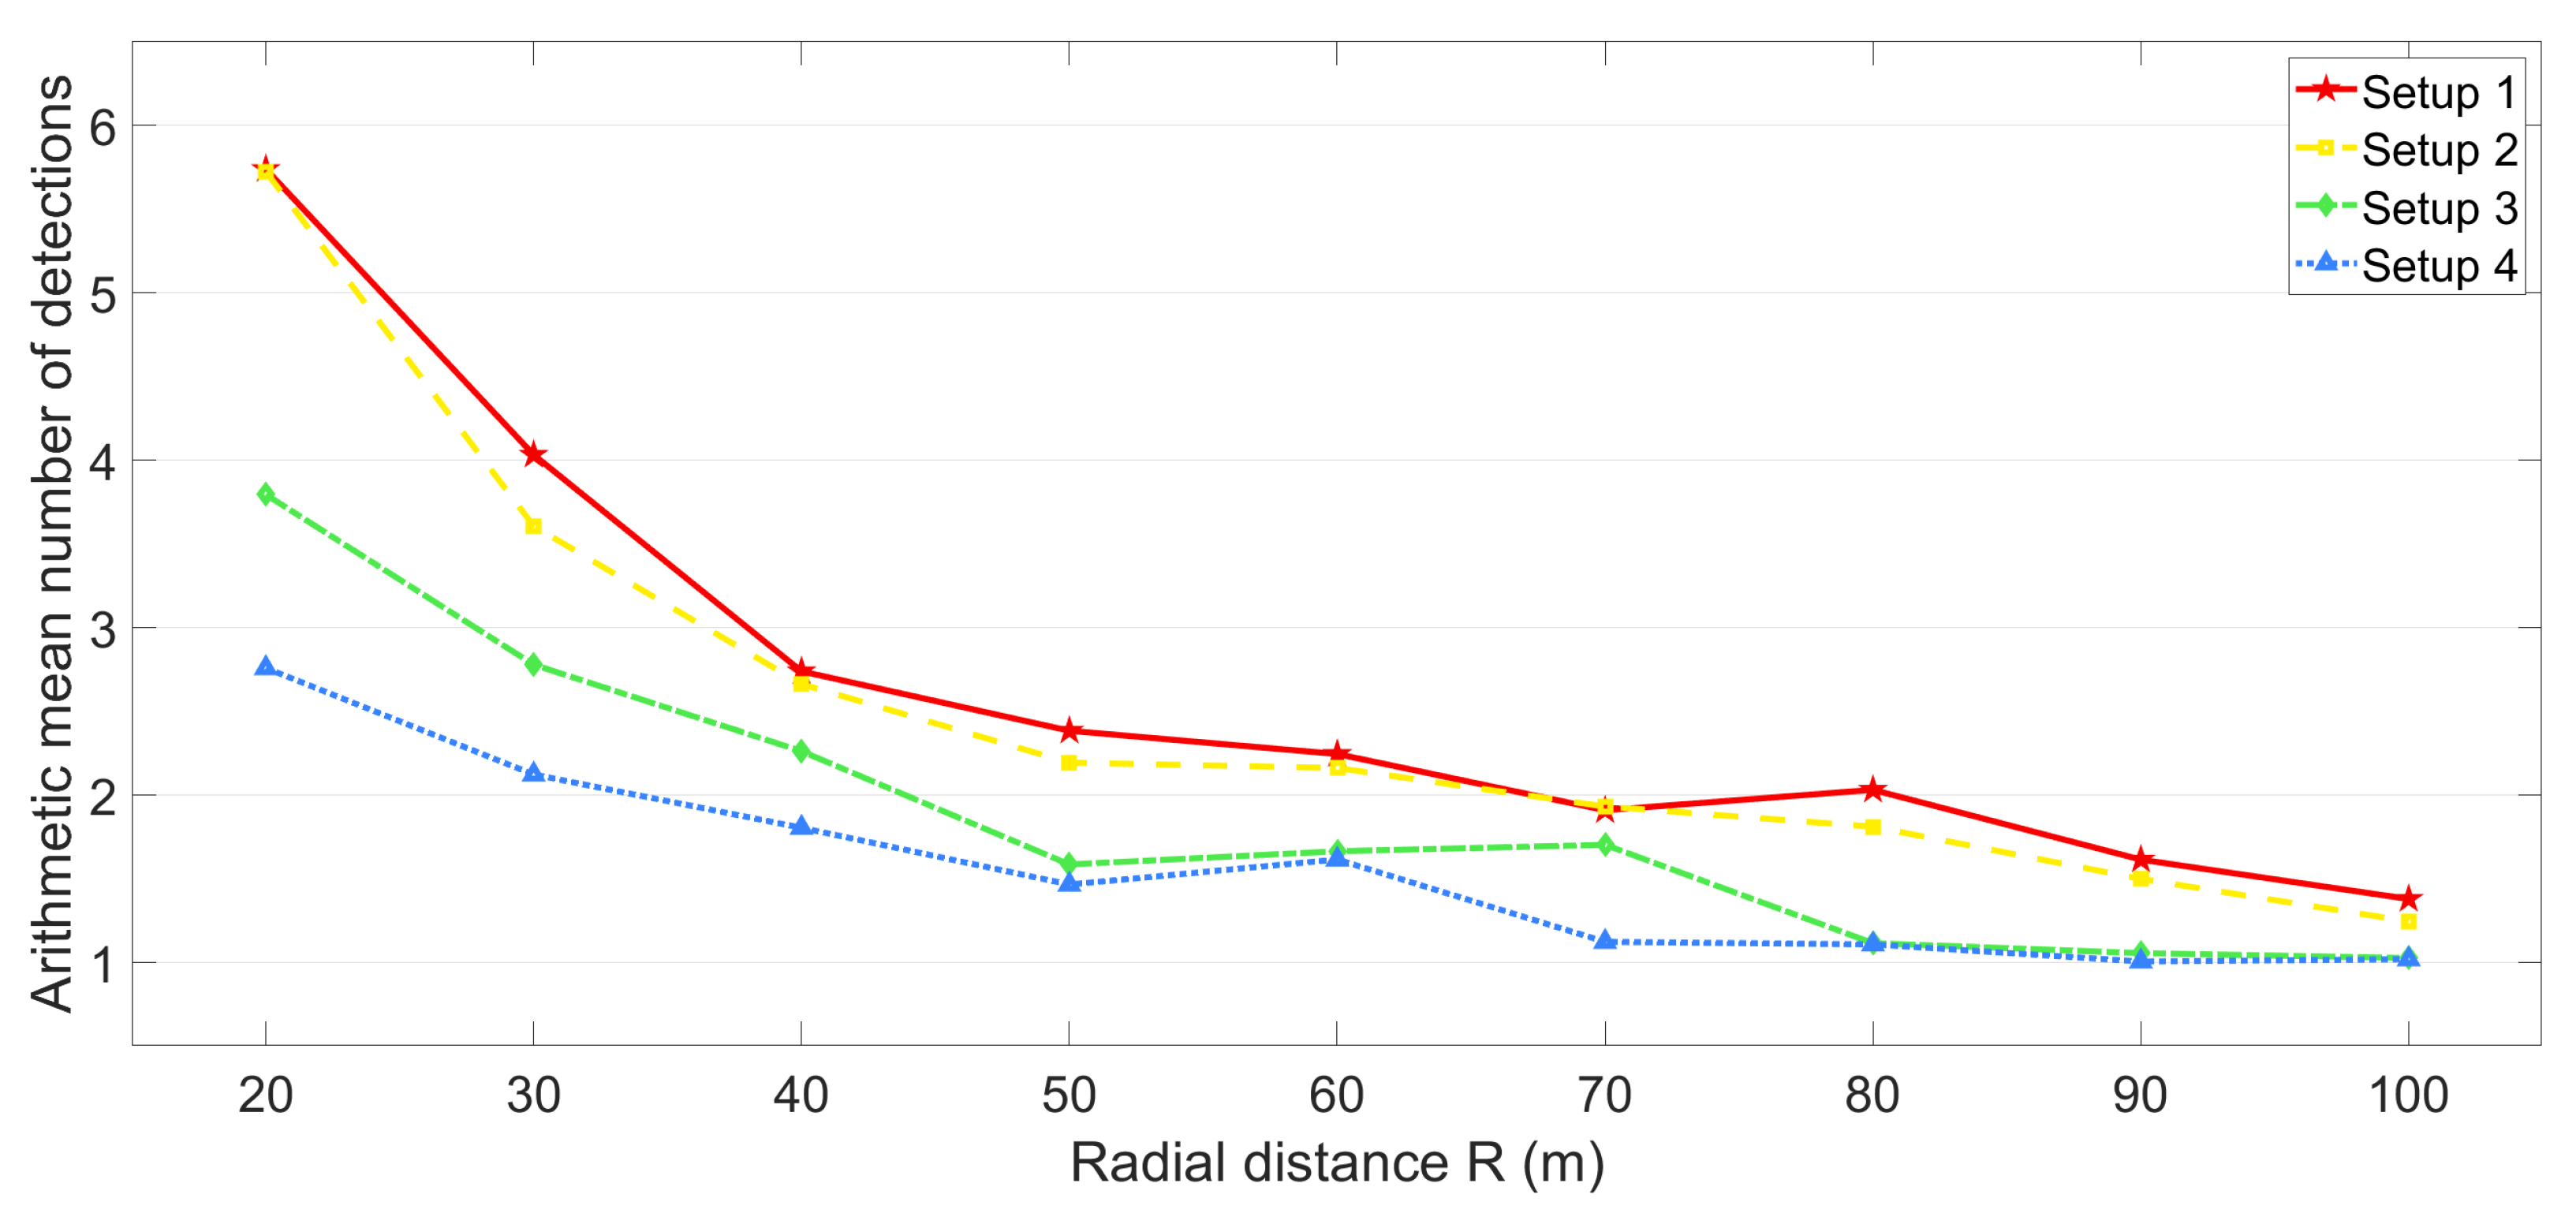
Figure 7 illustrates the arithmetic mean number of target detections per measurement cycle around fixed distances R between ego-car and target car. The absorbers on the rear window (Setup 2) had almost no influence on this relationship (red solid curve and yellow dashed curve). It seems that the reflections from the C-pillar and the roof have little influence on the scattering characteristics. By additionally obstructing the propagation path underneath the vehicle (Setup 3), the number of detections was significantly reduced across all distances (green dash-dotted curve). This proves that some of the target detections were caused by multipath propagation via the road surface. When the tailpipes were also covered (Setup 4), a further reduction in target detections was observed (blue dotted curve). The number of detections was greater than two only for distances less than , including a significant number of detections from the side mirror. In summary, this shows that the underbody has a noticeable influence on the scattering characteristics of vehicles.

Figure 7.
Arithmetic mean number of target detections for the measurement setups using microwave absorbers around fixed distances R.
3.2. Scattering Characteristics of Different Vehicle Types
This section examines, whether the underbody detections enable a radar-based fingerprinting of different vehicle types. First, the spatial distribution of the target detections as well as their RCS values were analyzed for each vehicle. Due to the limited sensor resolution, multiple scattering centers can fall into the same range bin. Therefore, it is not possible to associate every accumulation of detections unambiguously with a specific part of the vehicle. Nevertheless, the detection density can be used to identify regions with high reflectivity. In addition, the RCS values can be used to compare the reflectivity of the different underbodies.
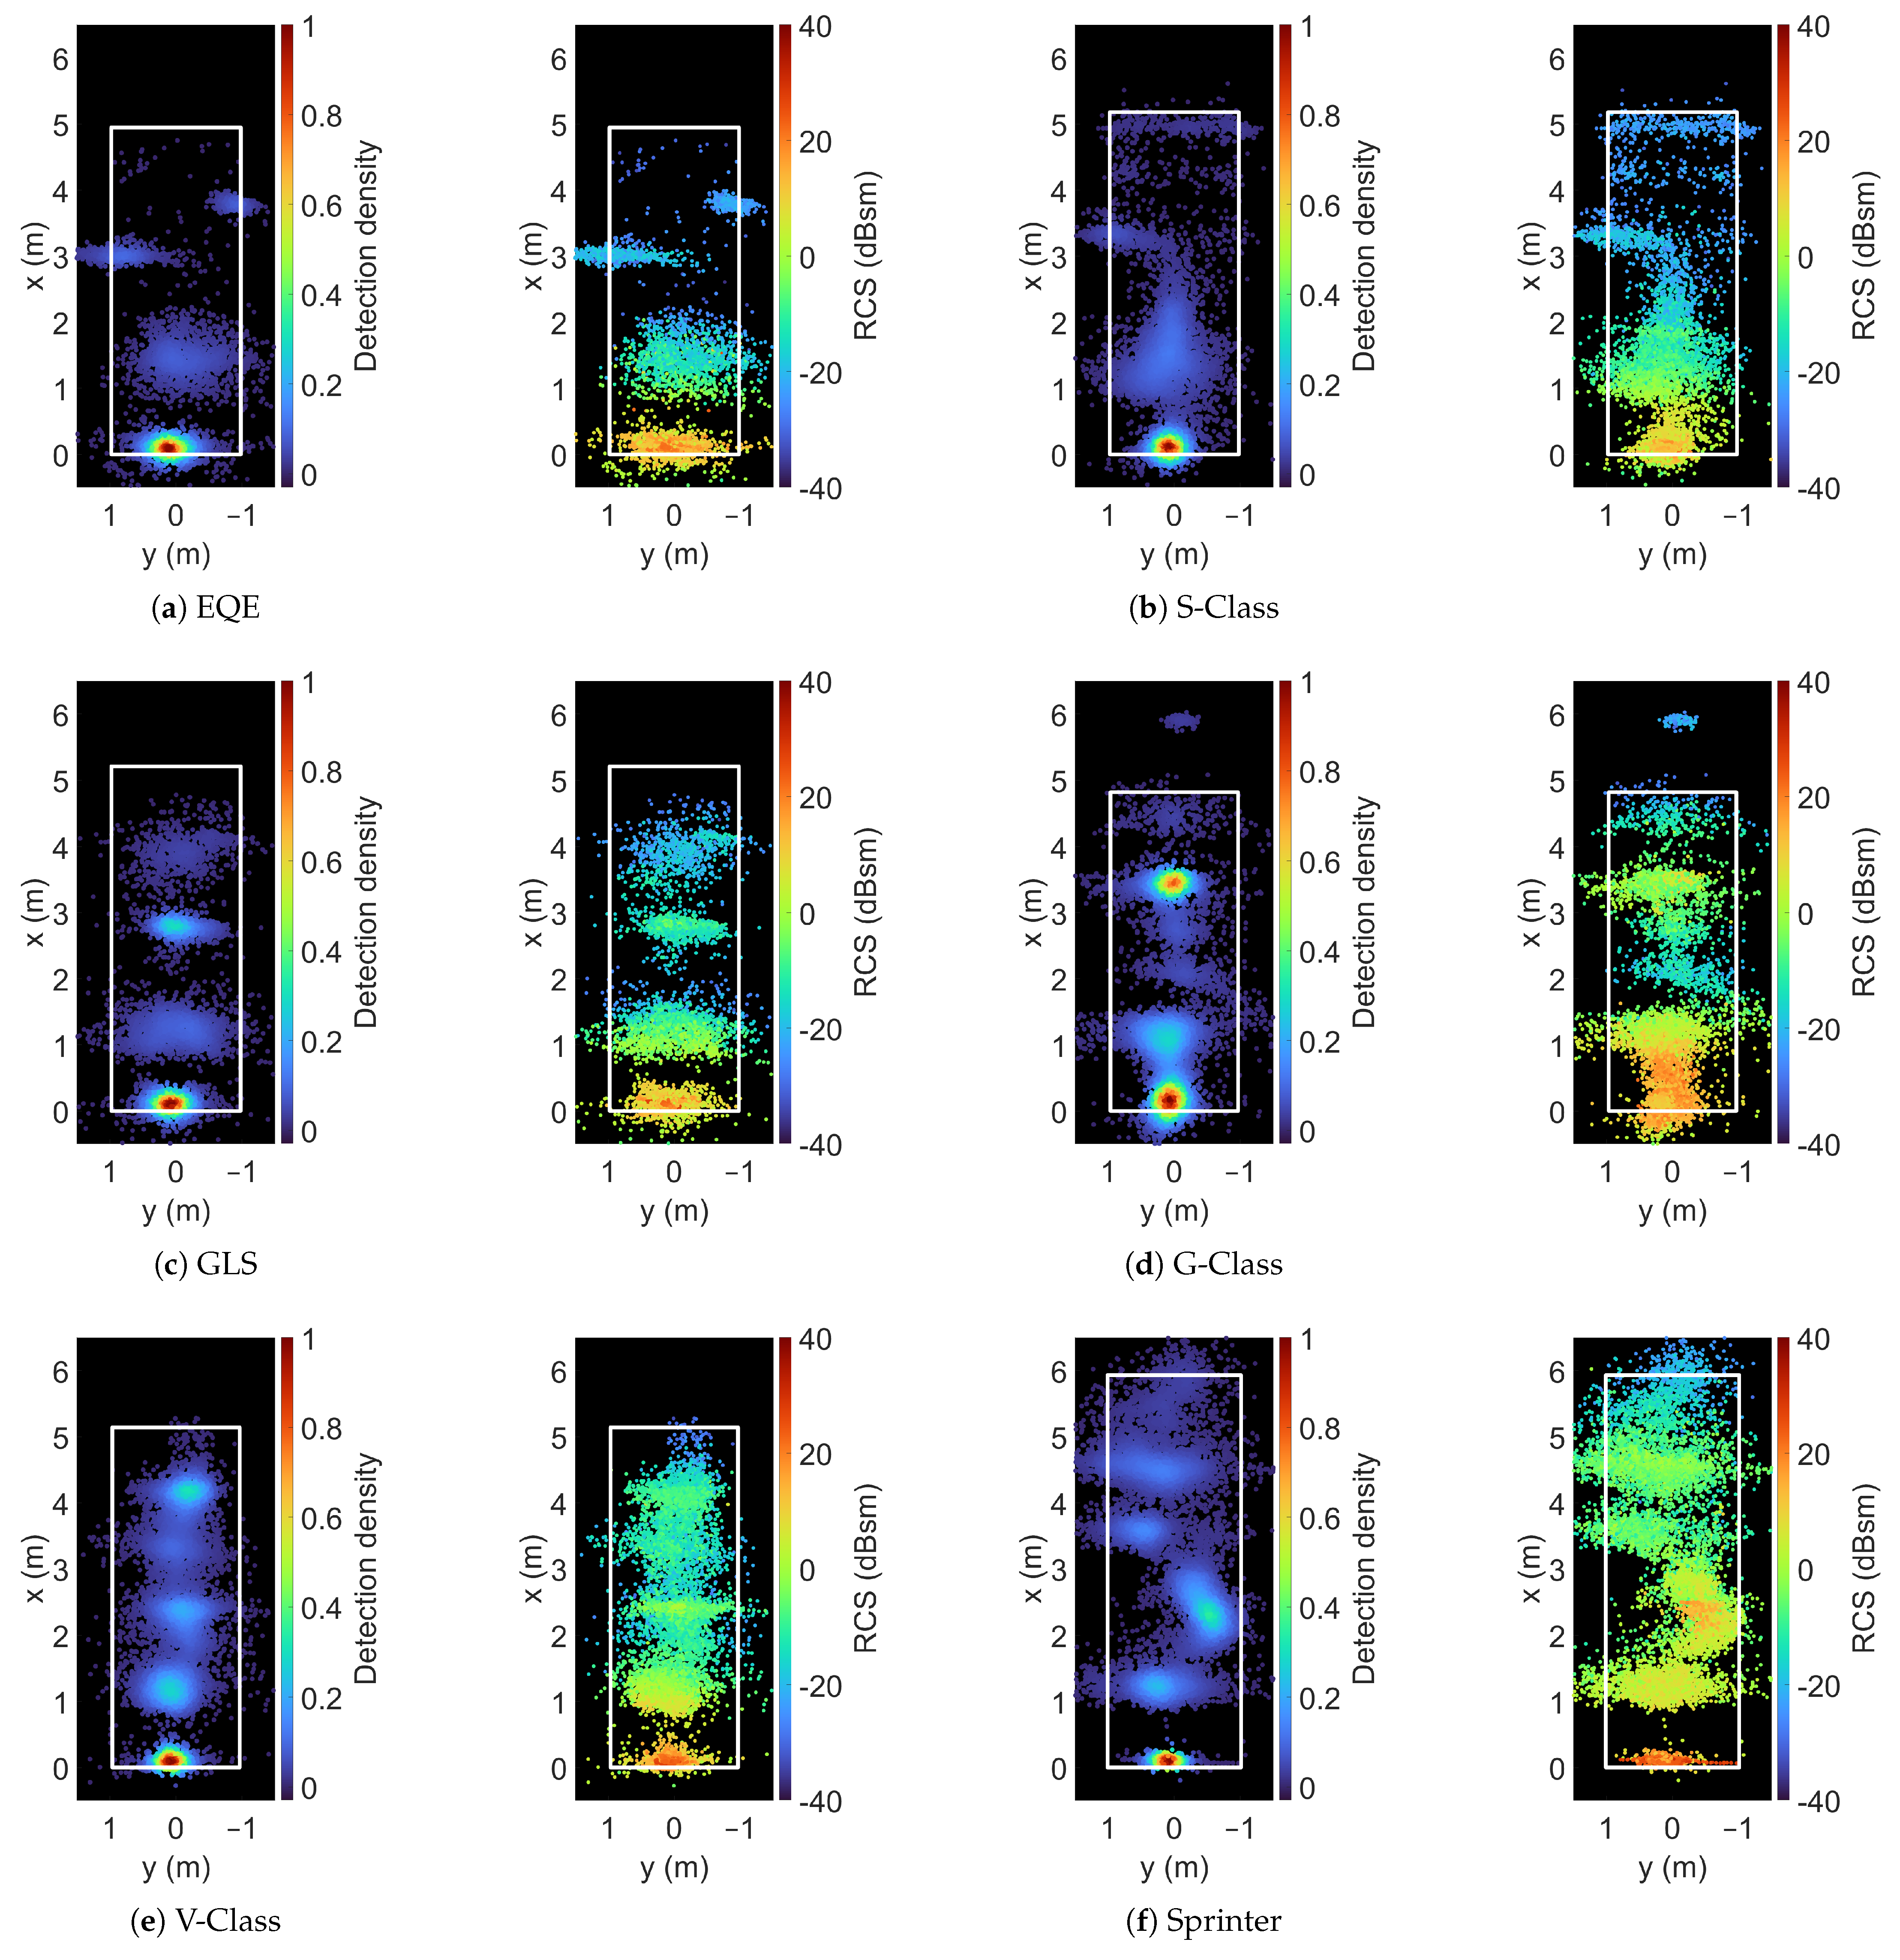
In Figure 8, the spatial distribution of target detections as well as their RCS values are illustrated for the six different vehicles. As expected, the highest detection densities were located at the rear bumper at with RCS values between and . All vehicle types showed a similar formation of detections at distances between and . As evaluated in Section 3.1, these detections were caused by a superposition of backscatter from the underbody, the tailpipes, the C/D-pillar and the roof. The fact that the detection densities and RCS values of the S-Class and the GLS were similar in this region supports the assumption that the C/D-pillar and the roof are of minor influence since the D-pillar of the GLS is located in the same range cell as the rear bumper. The RCS values in the same region, for the EQE, were approximately lower, which is attributed to the non-existent tailpipes and exhaust pipes. For the G-Class, the V-Class and the Sprinter, the accumulation of detections between and were concentrated in a smaller area and had approximately larger RCS values compared to the S-Class and the GLS. These increased RCS values are consistent with the fact that the rear axle, wheel suspensions and chassis frames are clearly visible and cause stronger backscatter. In the front part of the vehicles, further significant differences are visible: While the detections for the S-Class were distributed over the entire bounding box, the GLS showed two point clouds at and . The detections at were concentrated in a small area and had slightly increased RCS values up to , which is significantly higher compared to the detections at the same distance for the S-Class. These detections seem to stem from the exhaust system, as they are located in an area of exhaust pipes and catalytic converters. For the EQE, only two minor accumulations of detections were located at and , which were probably caused by the left side mirror and the right front wheel. It seems as if the flat underbody without any prominent geometries leads to reduced backscatter and therefore fewer target detections. For the G-Class, a very high density of detections was seen at with RCS values up to . These detections may probably be caused by the side of a horizontal metal plate below the front axle, which is a few centimeters lower than the rest of the underbody. The detections for the V-Class were distributed more evenly compared to the G-Class. Two regions with slightly higher detection densities and increased RCS values can be seen at and . However, due to the limited sensor resolution, it remains uncertain if these can be associated with specific underbody parts. For the Sprinter, the detections were spread over almost the entire bounding box and most detections came with high RCS values between and . A high concentration of detections with RCS values up to was located at the right side of the vehicle at . This backscatter was presumably caused by the side of a metal plate, which is used as a footstep to facilitate the entrance to the vehicle.

Figure 8.
Spatial detection distribution and RCS distribution for the different vehicle types. The white rectangles illustrate the target bounding box.
In a further evaluation step, the number of recorded target detections for the vehicles was analyzed (Table 2). For each car, the measurement data from ten recorded repetitions were accumulated, resulting in a total number of more than 3000 recorded measurement cycles. The number of target detections varied between 5527 and 14,731, resulting in remarkable differences for the arithmetic mean number of target detections per measurement cycle: The values for the S-Class and GLS were very similar (2.36 and 2.22), but only 1.78 detections per measurement cycle were detected on average for the EQE. Therefore, the question arises as to whether this is related to the powertrain. On the other hand, the light duty vehicles G-Glass, V-Class and Sprinter generated considerably more detections per measurement cycle (3.13, 3.75 and 4.87, respectively). The standard deviation for the number of detections from individual measurement runs was between 0.08 and 0.26. Therefore, the deviations between single repetitions were smaller than the differences between different vehicle types.
Table 2.
Number of recorded measurement cycles and target detections, arithmetic mean and standard deviation of target detections per measurement cycle.
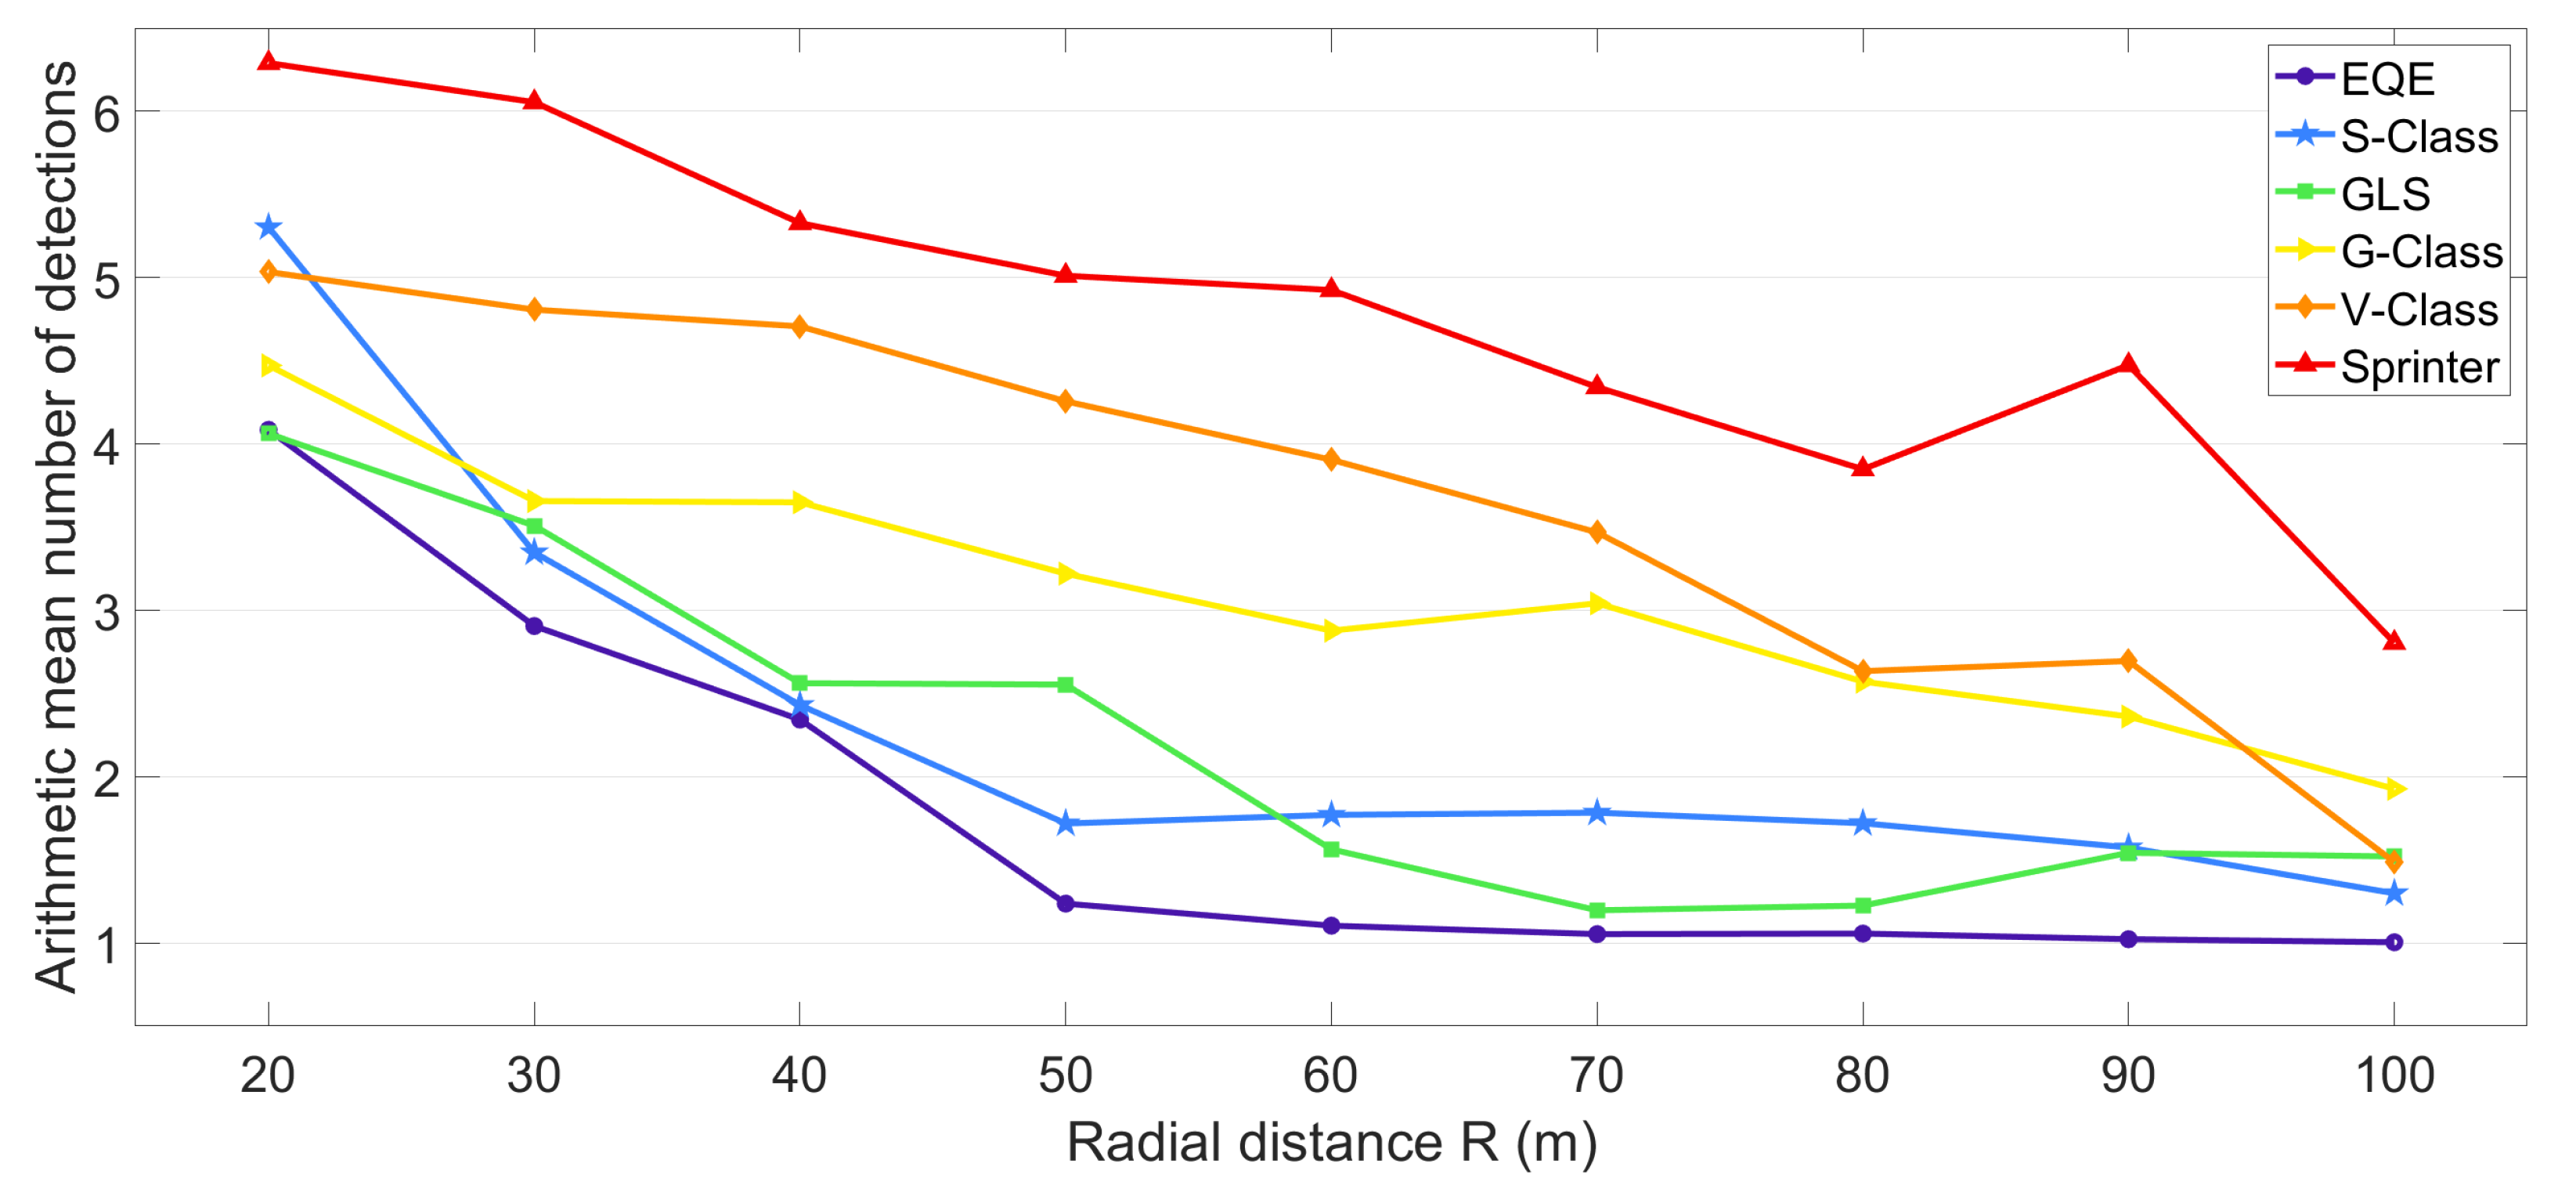
For a more detailed analysis, the arithmetic mean number of detections was calculated around fixed distances R, which are illustrated in Figure 9. In general, the number of target detections increased for shorter distances. For all vehicles except the Sprinter, the number of target detections rose from 1…2 detections at up to 4…5 detections at . For the Sprinter, 2.8 target detections per cycle were already recorded at and the number of detections rose up to 6.3 detections per measurement cycle at . This observation is associated with the significantly longer length of , while the length of all other vehicles falls in the range between and (Table 1). However, the curves display distinct differences: The types S-Class and the GLS (blue and green curve) reveal very similar behavior, while only one target detection was received above a distance of for the EQE (purple curve). For smaller distances, the increase in the number of detections behaved similarly to the S-Class and the GLS. For both, the G-Class (yellow curve) and the V-Class (orange curve), the number of target detections increased more rapidly than for the three previous vehicle types. While the numbers of detections from both vehicles were similar for distances between and , the number of detections for the V-Class were 28% higher compared to the G-Class for shorter distances. For the Sprinter (red curve), the number of target detections was the highest across all distances. Apparently, the different ground clearances and vehicle underbodies caused diverse backscatter intensities (RCS values) of the received radar signal. Therefore, the distance at which the radar sensor is capable of detecting underbody reflections varied, resulting in different point cloud sizes at different distances.
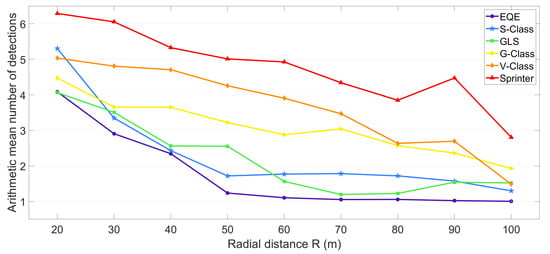
Figure 9.
Arithmetic mean number of target detections for different vehicles types around fixed distances R.
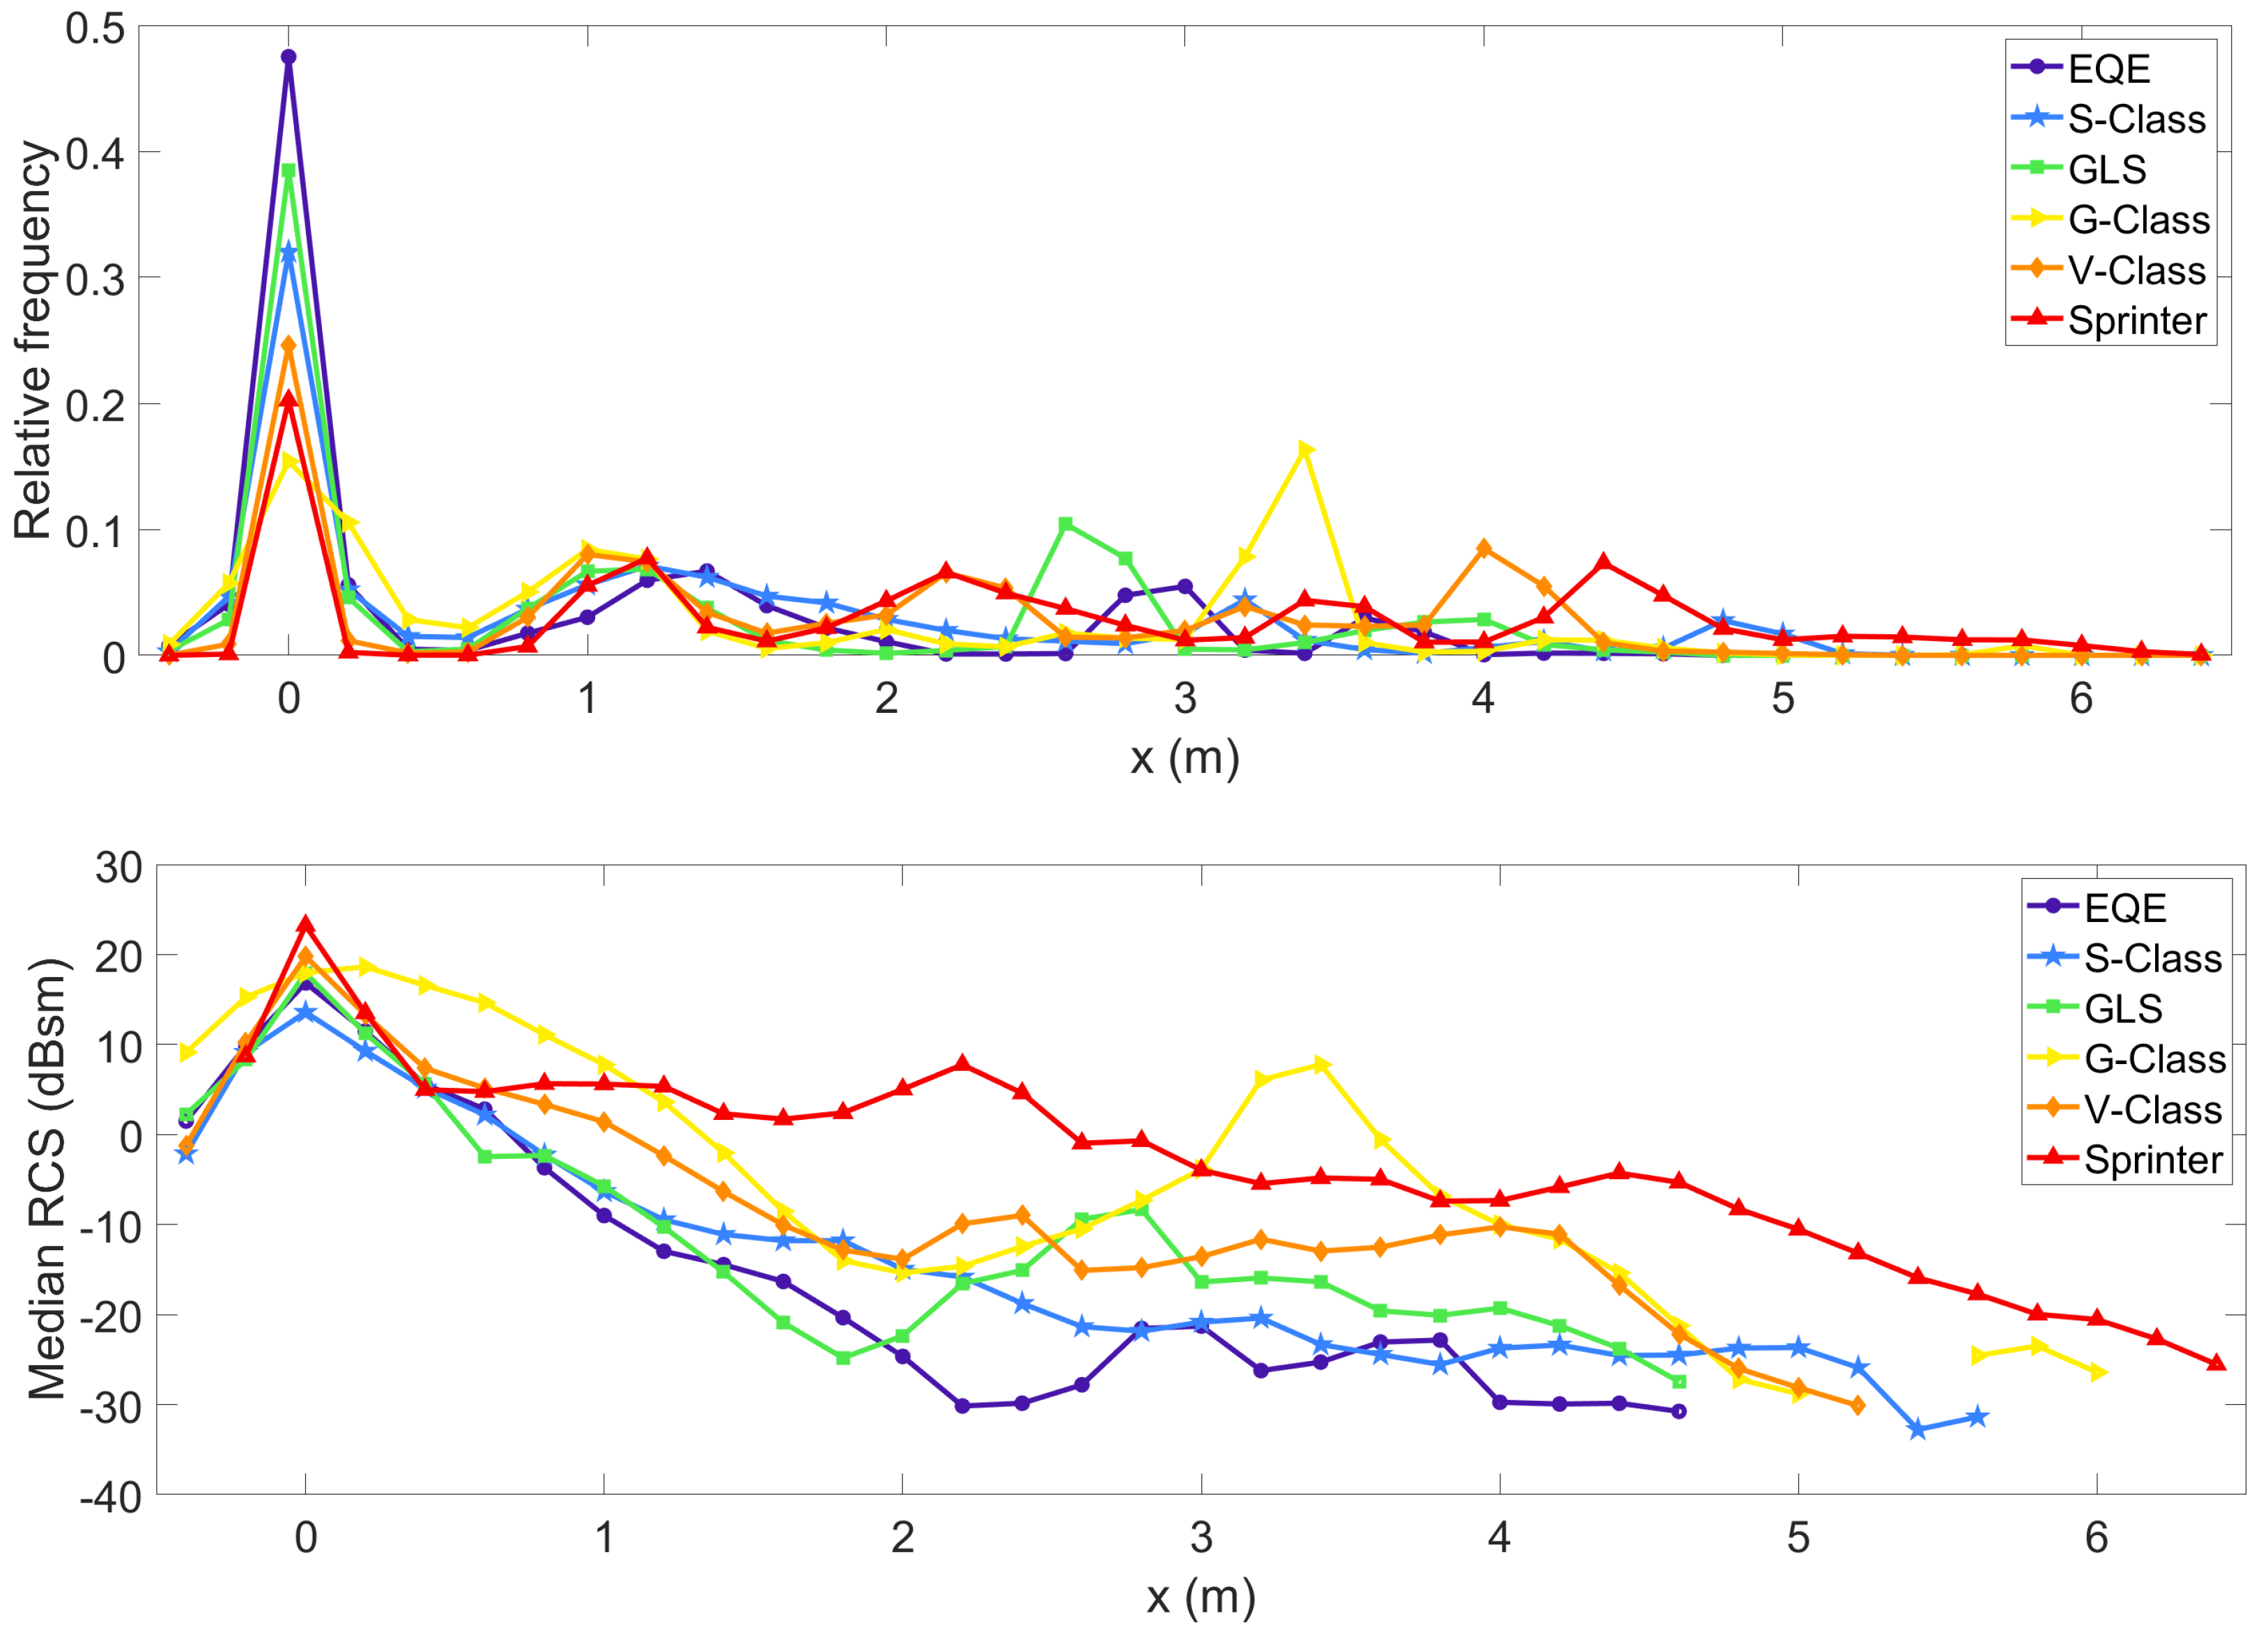
In order to compare the reflectivity of different vehicle underbodies directly, the spatial distribution of detections and their RCS values are analyzed in the longitudinal direction. Therefore, the number of detections and their RCS values were assigned to their longitudinal position x, which was discretized into bins of size . Then, the relative frequency of detections was calculated by dividing the number of detections in each bin by the total number of detections. Subsequently, the median of the RCS values was calculated for each bin. Figure 10 illustrates the relative frequency of target detections and their RCS values for the different vehicle types. As expected, the strongest scattering appeared at the rear bumper at , with the fractional relation to the total number of target detections being very different for each vehicle. For the EQE (purple curve), the detections on the rear bumper accounted for almost of all target detections, as comparatively few detections were measured at the underbody. On the other hand, the detections in the same region for the Sprinter (red curve) accounted for only of all target detections. The fractional relations are consistent with the arithmetic mean number of detections per measurement cycle, with the G-Class (yellow curve) being an exception. This is related to the fact that the target detections from the G-Class at were distributed more widely compared to the other vehicles, which might stem from the geometry of the tailgate since a spare wheel carrier is attached there. The fractional contribution of detections at was similar for all vehicles, but the RCS values of the G-Class (yellow curve), V-Class (orange curve) and Sprinter (red curve) were approximately higher than those of the other vehicles. The remaining detections were distributed very differently for the different vehicle types. For example, the high relative frequency of detections for the GLS (green curve) at and for the G-Class (yellow curve) at are clearly visible. In general, the RCS values of the underbody detections decreased over the length of the vehicles. However, increased RCS values were observed in areas with a high relative frequency of detections. Overall, the EQE (purple curve) showed very low RCS values over the entire length of the vehicle, while the Sprinter (red curve) showed consistently high reflectivity values.
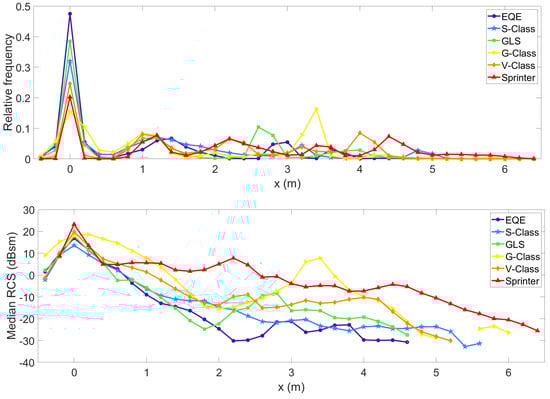
Figure 10.
Relative frequency (top) and median RCS values (bottom) of target detections in longitudinal direction x for the six vehicle types.
4. Conclusions
The aim of this work was to analyze the scattering behavior of different vehicle types under certain drive scenarios. A special focus was placed on the influence of underbody detections caused by multipath propagation via the road surface. In the first part, microwave absorbers were used to show that reflections at the underbody have a significant impact on the measured target detections. When comparing measurements for different vehicle types, significant differences in the number of detections, their spatial distributions, and their RCS values were revealed. Due to the limited sensor resolution, it was not always possible to assign all detection clusters unambiguously to specific vehicle components. However, the number of detections at different distances as well as the RCS distributions enabled a general comparison of the reflectivity of the underbody for different vehicles. It became apparent that the geometry of the underbody has a major and distinctive influence on the scattering characteristics. For example, significantly fewer detections were recorded for a battery-electric vehicle compared to similar vehicle types with a combustion engine, which is attributed to the absence of the exhaust system and the resulting flat underbody. In addition, significantly more detections and higher RCS values were measured for vehicles where, for example, the rear axle, wheel suspension or chassis frame are clearly visible.
It is worth noting that the six vehicle types studied here represent only a small fraction of cars on public roads. Therefore, in the real world, a wide range of scattering characteristics is to be expected, depending on the vehicle design, powertrain concept, exhaust aftertreatment components, axle geometry and ground clearance. Depicting such differences in models presents a big challenge and requires complex simulation methods with detailed CAD models. A simpler and still relevant approach towards fingerprinting radar scattering of cars could be to group into types of vehicles (e.g., combustion vs. electric engine) and assign coarse reflectivities to the underbody using stochastic models.
Due to the limited sensor resolution, it is expected that the influence of underbody detections will mainly be visible for certain incident angles, e.g., when following a vehicle in front in urban traffic or on highways. However, anticipating further improvements in sensor resolution, the influence of underbody detections is likely to become more important for other traffic scenarios as well, such as at intersections. The ability to detect and characterize parts of the underbody is a unique characteristic of radar sensors and differentiates them from other sensor principles. Therefore, the systematic analysis of radar scattering is important to evaluate the possibility of improving the performance of automated driving functions.
Author Contributions
Formal analysis, P.A.; Investigation, P.A.; Methodology, P.A.; Project administration, F.H.; Supervision, J.D. and M.A.H.; Validation, P.A.; Visualization, P.A.; Writing—original draft, P.A.; Writing—review & editing, P.A., F.H. and M.A.H. All authors have read and agreed to the published version of the manuscript.
Funding
This research was funded by the German Federal Ministry for Education and Research (BMBF) under the project acronym VIVID with grant number 16ME0172.
Institutional Review Board Statement
Not applicable.
Informed Consent Statement
Not applicable.
Data Availability Statement
Not applicable.
Conflicts of Interest
The authors declare no conflict of interest.
Abbreviations
The following abbreviations are used in this manuscript:
| SAR | synthetic aperture radar |
| RCS | radar cross section |
References
- Waldschmidt, C.; Hasch, J.; Menzel, W. Automotive Radar—From First Efforts to Future Systems. IEEE J. Microw. 2021, 1, 135–148. [Google Scholar] [CrossRef]
- Wachenfeld, W.; Winner, H. The Release of Autonomous Vehicles. In Autonomous Driving; Springer: Berlin/Heidelberg, Germany, 2016; pp. 425–449. [Google Scholar]
- Sovani, S. Simulation Accelerates Development of Autonomous Driving. Atz Worldw. 2017, 119, 24–29. [Google Scholar] [CrossRef]
- Andres, M.; Feil, P.; Menzel, W.; Bloecher, H.L.; Dickmann, J. Analysis of Automobile Scattering Center Locations by SAR Measurements. In Proceedings of the 2011 IEEE RadarCon (RADAR), Kansas City, MO, USA, 23–27 May 2011; pp. 109–112. [Google Scholar]
- Schuler, K.; Becker, D.; Wiesbeck, W. Extraction of Virtual Scattering Centers of Vehicles by Ray-Tracing Simulations. IEEE Trans. Antennas Propag. 2018, 56, 3543–3551. [Google Scholar] [CrossRef]
- Abadpour, S.; Diewald, A.; Pauli, M.; Zwick, T. Extraction of Scattering Centers Using a 77 GHz FMCW Radar. In Proceedings of the 2019 12th German Microwave Conference (GeMiC), Stuttgart, Germany, 25–27 March 2019; pp. 79–82. [Google Scholar]
- Buddappagari, S.; Schwind, A.; Stephan, R.; Hein, M. Monostatic RCS Measurements of Representative Road Traffic Objects in the 76 …81 GHz Frequency Band. In Proceedings of the 2020 IEEE Radar Conference (RadarConf20), Florence, Italy, 21–25 September 2020; pp. 1–6. [Google Scholar]
- Andres, M.; Feil, P.; Menzel, W. 3D-Scattering Center Detection of Automotive Targets Using 77 GHz UWB Radar Sensors. In Proceedings of the 2012 6th European Conference on Antennas and Propagation (EUCAP), Prague, Czech Republic, 26–30 March 2012; pp. 3690–3693. [Google Scholar]
- Berthold, P.; Michaelis, M.; Luettel, T.; Meissner, D.; Wuensche, H.-J. Radar Reflection Characteristics of Vehicles for Contour and Feature Estimation. In Proceedings of the 2017 Sensor Data Fusion: Trends, Solutions, Applications (SDF), Bonn, Germany, 4–6 September 2017; pp. 1–6. [Google Scholar]
- Bühren, M.; Yang, B. Simulation of Automotive Radar Target Lists using a Novel Approach of Object Representation. In Proceedings of the 2006 IEEE Intelligent Vehicles Symposium, Meguro-Ku, Japan, 13–15 June 2006; pp. 314–319. [Google Scholar]
- Buddendick, H.; Eibert, T.; Hasch, J. Bistatic Scattering Center Models for the Simulation of Wave Propagation in Automotive Radar Systems. In Proceedings of the German Microwave Conference Digest of Papers, Berlin, Germany, 15–17 March 2010; pp. 288–291. [Google Scholar]
- Knill, C.; Scheel, A.; Dietmayer, K. A Direct Scattering Model for Tracking Vehicles with High-Resolution Radars. In Proceedings of the 2016 IEEE Intelligent Vehicles Symposium (IV), Gothenburg, Sweden, 19–22 June 2016; pp. 298–303. [Google Scholar]
- Berthold, P.; Michaelis, M.; Luettel, T.; Meissner, D.; Wuensche, H.-J. An Abstracted Radar Measurement Model for Extended Object Tracking. In Proceedings of the 2018 21st International Conference on Intelligent Transportation Systems (ITSC), Maui, HI, USA, 4–7 November 2018; pp. 3866–3872. [Google Scholar]
- Eder, T.; Hachicha, R.; Sellami, H.; van Driesten, C.; Biebl, E. Data Driven Radar Detection Models: A Comparison of Artificial Neural Networks and Non Parametric Density Estimators on Synthetically Generated Radar Data. In Proceedings of the 2019 Kleinheubach Conference, Miltenberg, Germany, 4–7 November 2019; pp. 1–4. [Google Scholar]
- Elster, L.; Holder, M.; Rapp, M. A Dataset for Radar Scattering Characteristics of Vehicles Under Real-World Driving Conditions: Major Findings for Sensor Simulation. IEEE Sens. J. 2023, 23, 4873–4882. [Google Scholar] [CrossRef]
- Haag, S.; Duraisamy, B.; Koch, W.; Dickmann, J. Radar and Lidar Target Signatures of Various Object Types and Evaluation of Extended Object Tracking Methods for Autonomous Driving Applications. In Proceedings of the 2018 21st International Conference on Information Fusion (FUSION), Cambridge, UK, 10–13 July 2018; pp. 1746–1755. [Google Scholar]
- Continental AG; ARS510. Available online: https://www.continental-automotive.com/en-gl/Passenger-Cars/Autonomous-Mobility/Enablers/Radars/Long-Range-Radar/ARS510 (accessed on 19 June 2023).
- Mercedes-Benz AG; Immendingen Test Center. Available online: https://group.mercedes-benz.com/innovation/specials/ immendingen-2.html (accessed on 26 July 2023).
- Eilers, P.; Goeman, J. Enhancing scatterplots with smoothed densities. Bioinformatics 2004, 20, 623–628. [Google Scholar] [CrossRef] [PubMed]
Disclaimer/Publisher’s Note: The statements, opinions and data contained in all publications are solely those of the individual author(s) and contributor(s) and not of MDPI and/or the editor(s). MDPI and/or the editor(s) disclaim responsibility for any injury to people or property resulting from any ideas, methods, instructions or products referred to in the content. |
© 2023 by the authors. Licensee MDPI, Basel, Switzerland. This article is an open access article distributed under the terms and conditions of the Creative Commons Attribution (CC BY) license (https://creativecommons.org/licenses/by/4.0/).