Article

An Improved Impact Damage Monitoring Method for High-Speed Trains Using Lamb Waves and Multi-Task Learning

School of Traffic & Transportation Engineering, Central South University, Changsha 410075, China
*
Author to whom correspondence should be addressed.
Appl. Sci. 2023, 13(18), 10235; https://doi.org/10.3390/app131810235
Submission received: 18 August 2023 / Revised: 8 September 2023 / Accepted: 11 September 2023 / Published: 12 September 2023

Abstract

:
High-speed trains may be subjected to various forms of physical impacts during long-term operation, causing structural damage and endangering driving safety. Therefore, impact damage monitoring remains a daunting challenge for the stable operation of high-speed train structures. The existing methods cannot simultaneously detect the location and severity of impact damage, which poses challenges to structural integrity assessment and preventive maintenance. This article proposes an impact damage monitoring method based on multi-task 2D-CNN. Sensor data fusion is performed using a 2D image processing method to convert a 1D impact damage signal into a 2D grayscale image. The fused grayscale image contains information related to the location and severity of impact damage. A damage detection framework was established using multi-task 2D-CNN for feature extraction, impact location classification, and impact energy quantification. This model can learn the commonalities and characteristics of each task by sharing network structure and parameters and can effectively improve the accuracy of each task. Compared with single-task learning, multi-task learning performs better on the metrics of the impact location task recognizing the impact energy task and reduces the training time by 30.83%. With a reduced number of samples, the performance of multi-task learning is more stable and can still effectively identify the location and severity of impact damage.

1. Introduction

The rapid development of high-speed trains has attracted great attention. Structural health monitoring (SHM) plays a significant role in ensuring structural integrity [1]. As high-speed trains operate in a complex environment for a long time, each structure of the high-speed train is often impacted by foreign bodies such as gravel, ice, and snow, which may cause microscopic damage. Under the strong load of high-speed trains, the initial damage will expand rapidly and eventually cause serious security incidents. As a result, it is critical to create an effective method to monitor the location and severity of impact damage [2]. Due to the characteristics of Lamb waves, such as long-distance transmission, easy driving and receiving, and sensitivity to defects, SHM based on Lamb waves shows great potential in damage monitoring [3].
Accurate prediction of damage location is an indispensable part of structural safety assessment, so many algorithms have been proposed to locate the impact source. The imaging algorithm [4] and time difference of arrival (TDOA) algorithm [5] are the most basic and popular algorithms. Chen [6] defined the damage index based on nonlinear Lamb waves and proposed an imaging method for carbon fiber-reinforced plastic (CFRP) laminate impact damage. Su et al. [7] proposed a location imaging method using the Hilbert spectrum of Lamb waves. Zhu et al. [8] estimated the impact position by calculating the guided wave arrival time difference obtained from the theoretical model and experiments. Holford et al. [9] performed wavelet decomposition of the Lamb wave and calculated the arrival time of the direct wave to identify the damage location. Gao [10] pointed out the limitation that only when the sensor network has sufficient density can the imaging algorithm ensure the impact damage location accuracy. Although the TDOA method is widely used, the positioning accuracy depends on the prior information on Lamb wave propagation speed in the structure [11]. However, the propagation speed of Lamb waves in the structure is usually unknown and changes rapidly with changes in the environment, such as temperature or applied stress [12,13], which are difficult to estimate. In addition, these methods need to extract damage characteristics from complex signals and then establish a physical formula with clear physical significance to determine the damage location. Commonly used damage indicators are time of flight (TOF) [14], normalized amplitude [15], and energy ratio [16]. Frequently, the extraction of these features requires mastering the traditional signal processing methods and acquiring the professional knowledge of experts in relevant fields. However, Lamb wave signals are formed by coupling direct waves, various reflected waves, and noise through a nonlinear system, which makes it challenging to extract appropriate features based on experience. So, we certainly need to create a data-driven impact damage monitoring method without prior knowledge.
Deep learning is widely used in SHM due to its ability to construct complex nonlinear mapping relationships [17,18,19,20,21]. The convolutional neural network (CNN) is a kind of deep neural network that can learn the relevant characteristics from massive historical data to reduce the workload of damage feature selection and solve the disadvantages of the conventional means of relying on expert experience [22,23,24,25]. In the field of impact monitoring, by stacking the network layer of the CNN, it is possible to realize the automatic extraction of deep-level features based on massive historical data without the need for a priori physical information such as wave speed and empirical feature knowledge to identify the location of the impact damage and the impact damage energy. Wu [26] used continuous wavelet transform to transform the original data into a two-dimensional time-frequency image and applied a 2D-CNN to identify the damage location. Zhang [27] put forward a model based on time-varying damage characteristics combined with a 1D-CNN to locate the damage. Su [28] made use of the traditional Fourier transform to analyze the characteristics of the original signal in the frequency domain, and then constructed a 2D-CNN to locate the damage to CFRP structures. Pandey [29] used a 1D-CNN for the damage detection in thin aluminum plates, and the damage location error was about 7%. Rautela [30] used two independent CNNs to determine the existence and location of the damage, which adds a lot of work. However, none of the above studies can simultaneously identify the damage location and severity of the damage. In the field of structural health monitoring, accurate damage severity identification is the foundation of structural integrity assessment and preventive maintenance [31]. The current damage diagnosis models all perform a single damage diagnosis task, and different damage diagnosis tasks require different model structures. Although this can realize damage diagnosis, it ignores the connection between different damage diagnosis tasks, which will occupy a large amount of hardware and software resources in practical applications, resulting in low computational efficiency. In multi-task learning, it is mainly considered that different tasks actually have certain correlations [32]. Multi-task learning trains the model parameters of multiple tasks at the same time, forcing the model to learn the features and complementary information shared among the tasks, and the tasks play the role of regularization, thus reducing the risk of overfitting and improving the generalization ability [33]. Generally multi-task learning outperforms single-task learning due to the presence of implicit data augmentation mechanisms in multi-task learning, and multi-task learning effectively increases the number of training instances. The actual collection of Lamb wave signals is inevitably affected by changes in the surrounding environment and sensor acquisition errors, resulting in a certain degree of noise in the collected Lamb wave signals. When we train the model only on the impact damage location task, our goal is to obtain good accuracy on the impact damage location task, and it is easy to ignore the noise and generalization performance associated with the data and assume the risk of overfitting on the impact damage location task. Similarly, when we train the model only on the impact damage severity task, our goal is to obtain good accuracy on the impact damage severity task, easily ignoring the noise and generalization performance associated with the data and taking the risk of overfitting on the impact damage severity task. The impact damage location task and the impact damage severity task have different noise patterns, and learning both tasks at the same time averages out the noise patterns, reduces the risk of overfitting, and results in better model performance.
Therefore, an impact damage monitoring method based on a multi-task 2D-CNN is proposed in this paper. The interaction mechanism of Lamb waves with different impact locations and severities is studied on the test platform. To realize multi-sensor data fusion, the original impact damage data are transformed into a grayscale image by a novel image processing method. A monitoring frame capable of simultaneously detecting impact position and energy is built through a multi-task 2D-CNN. This network structure has multiple impact damage detection tasks, part of the network structure and parameters are shared, and the commonness and characteristics of each task can be learned. This network structure considers the link between the impact damage location identification task and the impact damage energy identification task by extracting features common to both and suppressing features that are not relevant to task identification. Subsequently, each task-specific network utilizes the common features before continuing to learn, resulting in improved recognition accuracy for each task. In addition, the prior knowledge of wave velocity and the expert knowledge of feature extraction are no longer necessary information. Therefore, the model parameters and calculation time are reduced, and the accuracy of each task is improved.
The content of this paper is arranged as follows: Section 2 describes the multi-task damage diagnosis framework and the data processing method in detail. The experiments are shown and discussed in Section 3. Section 4 presents the multi-task damage classification test and results discussion. Section 5 gives the conclusions of this paper.

2. Methodology

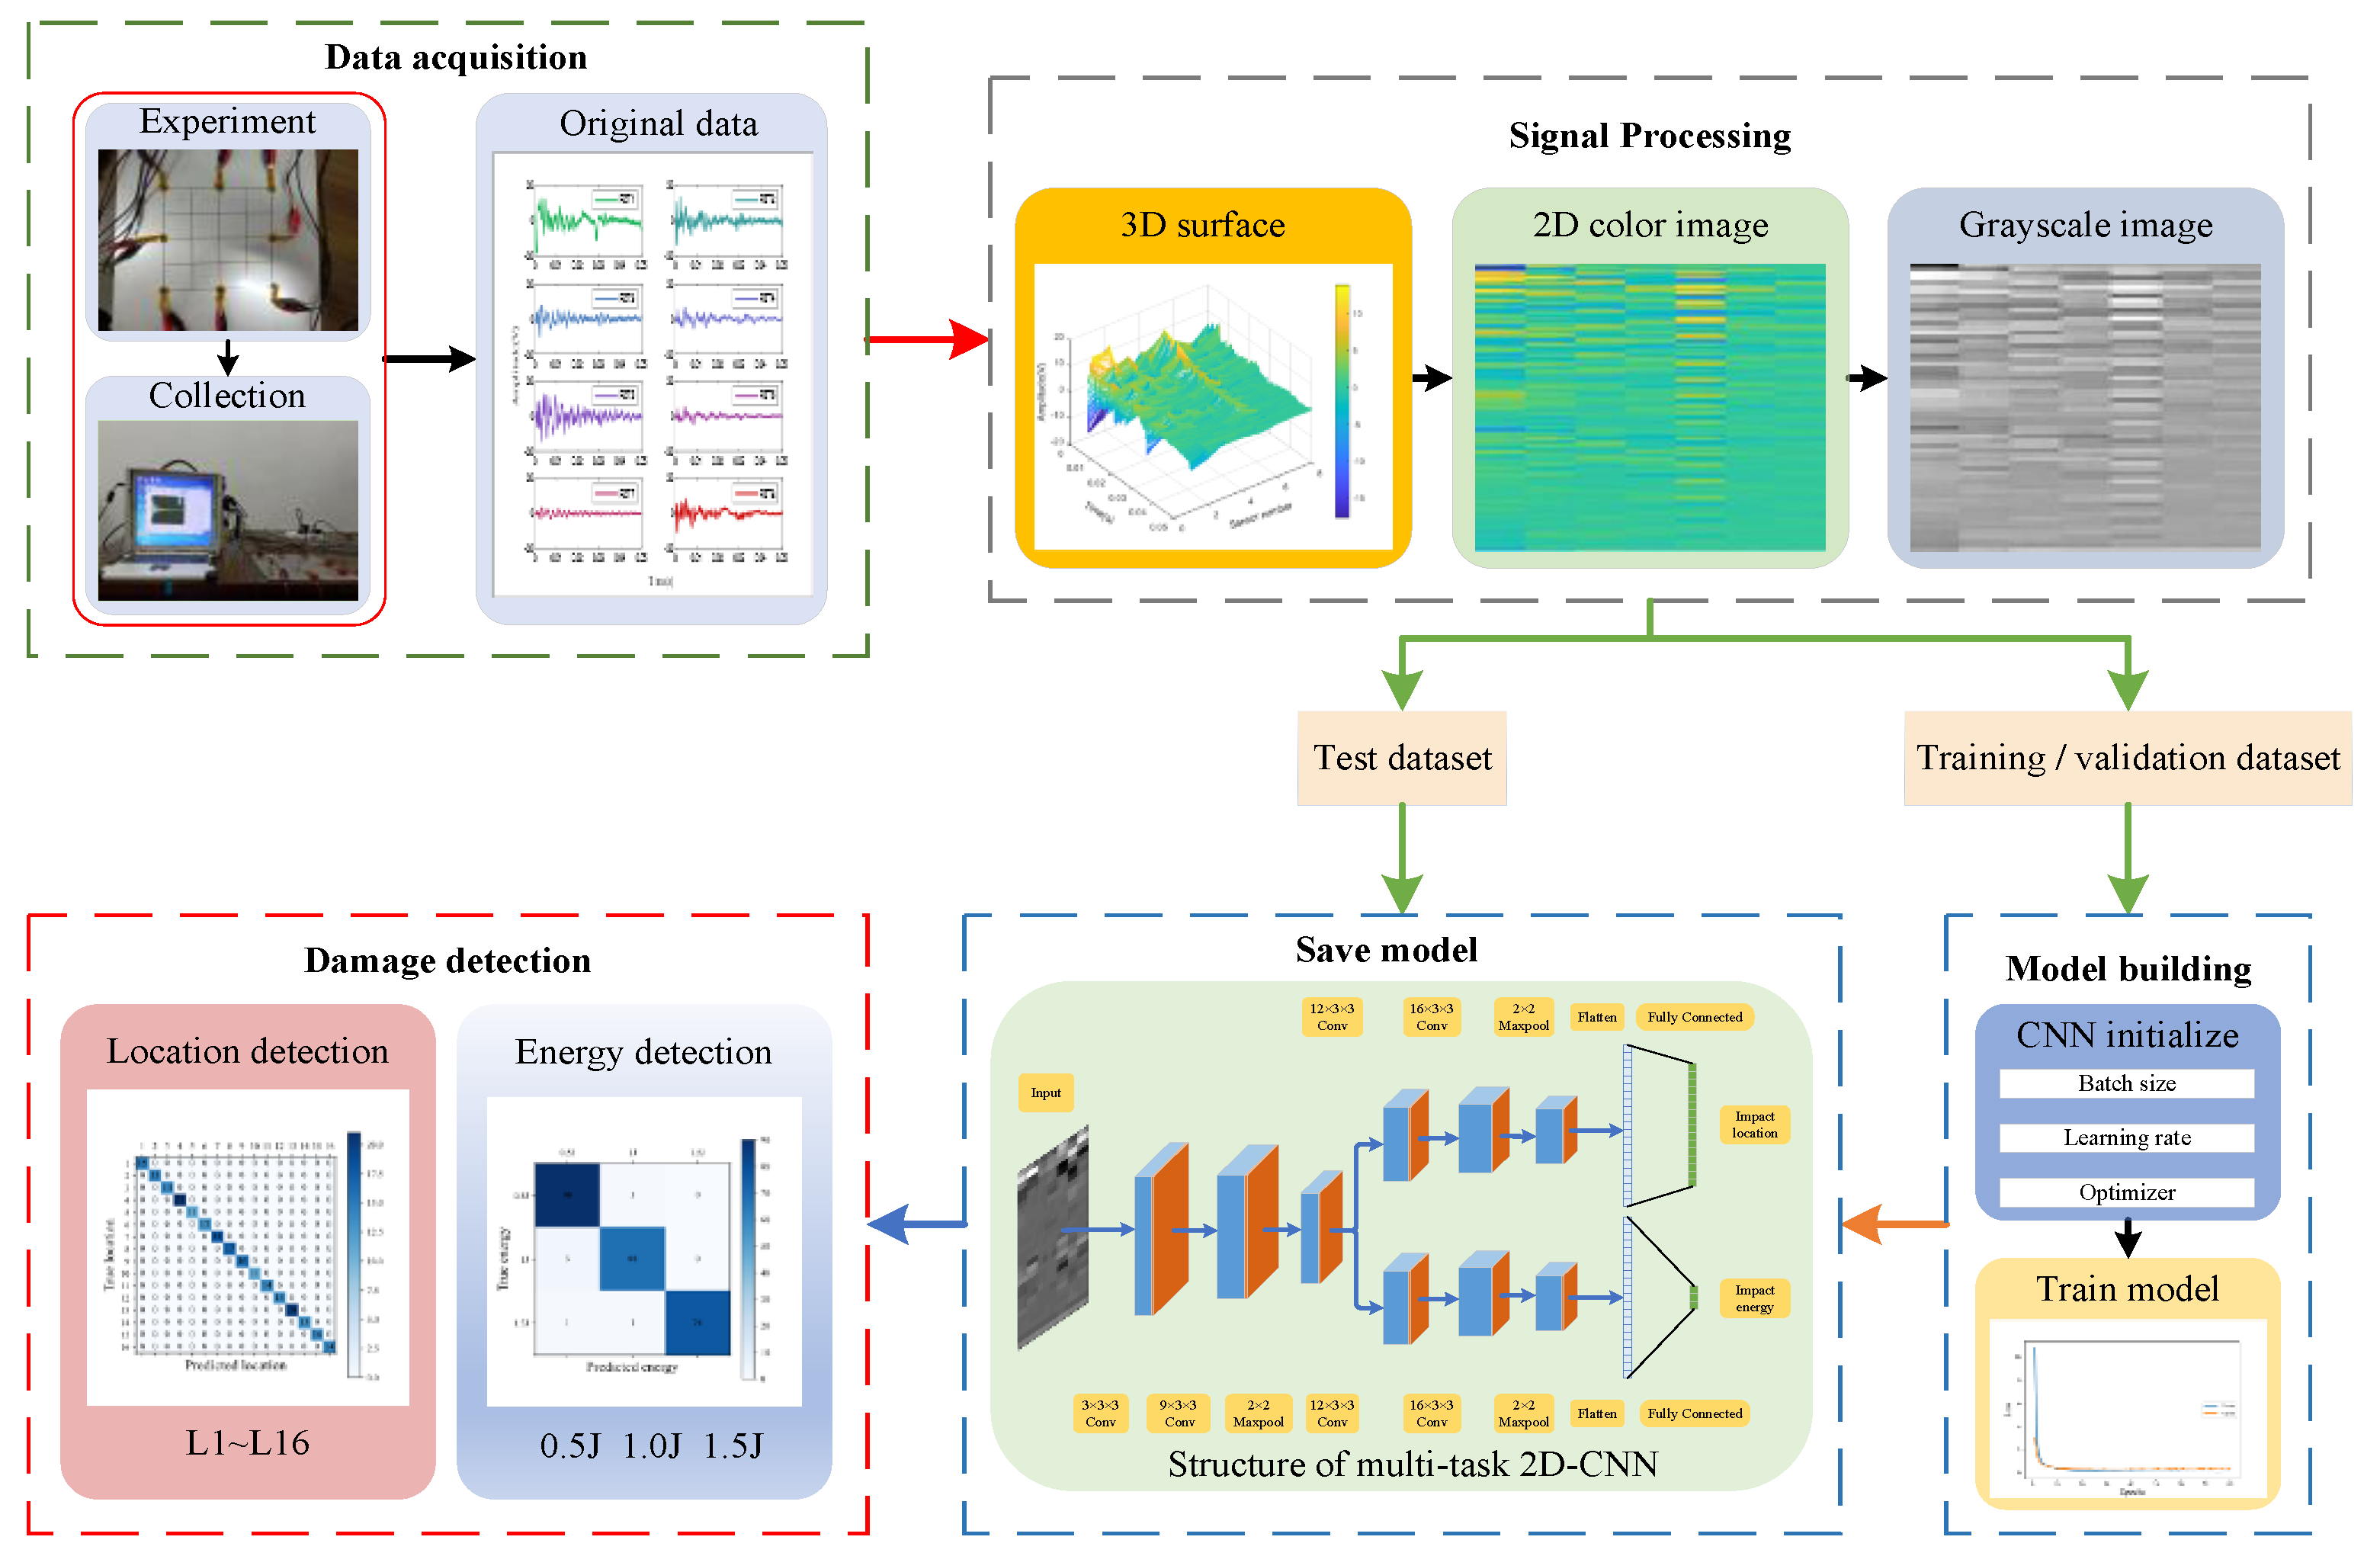
2.1. Impact Damage Monitoring Framework

Considering that the traditional damage monitoring method based on Lamb waves needs prior structural information and manual experience, an impact damage monitoring framework based on a multi-task 2D-CNN is established. For the proposed impact damage monitoring framework, the data processing flow and model structure are designed as shown in Figure 1. Figure 1 indicates that the workflow of the method roughly includes the original data acquisition stage, signal processing stage, and multi-task network damage detection stage. Detailed instructions are as follows.
(1)
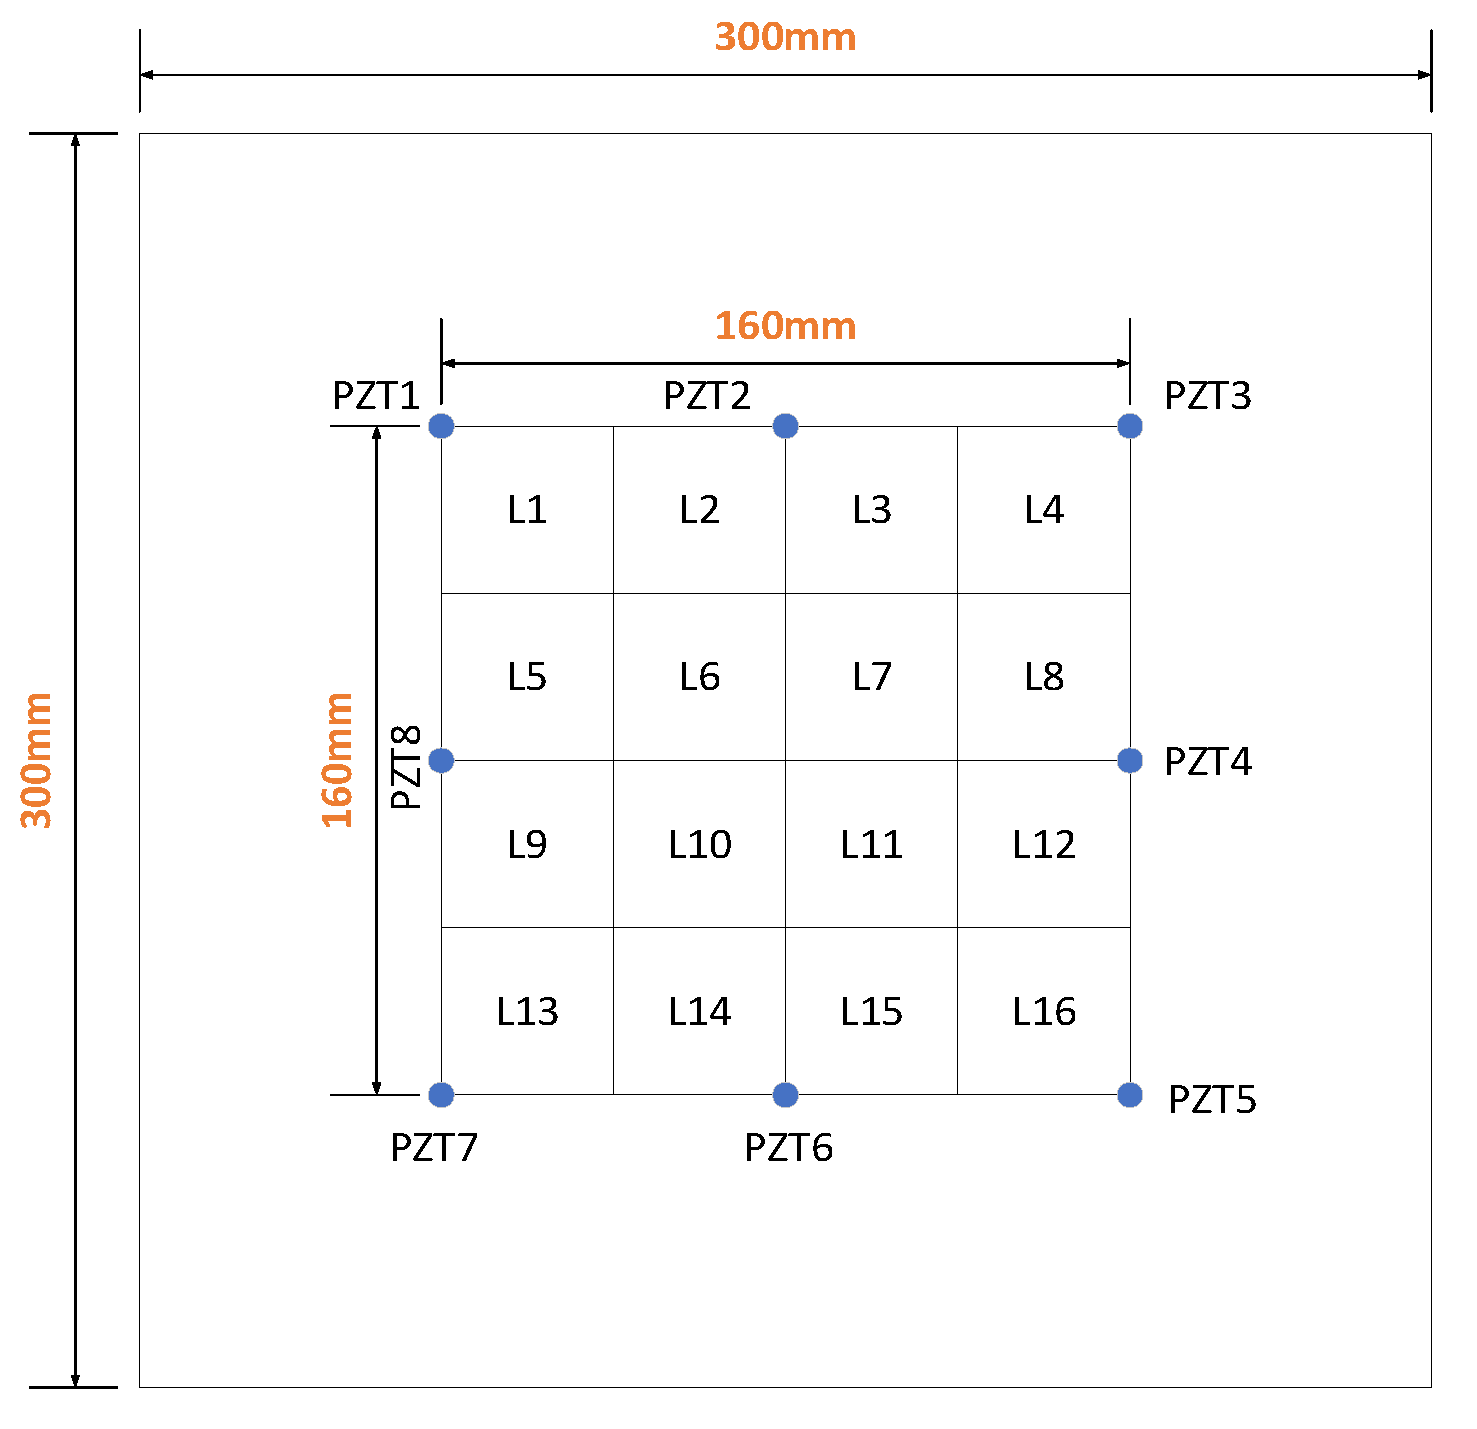
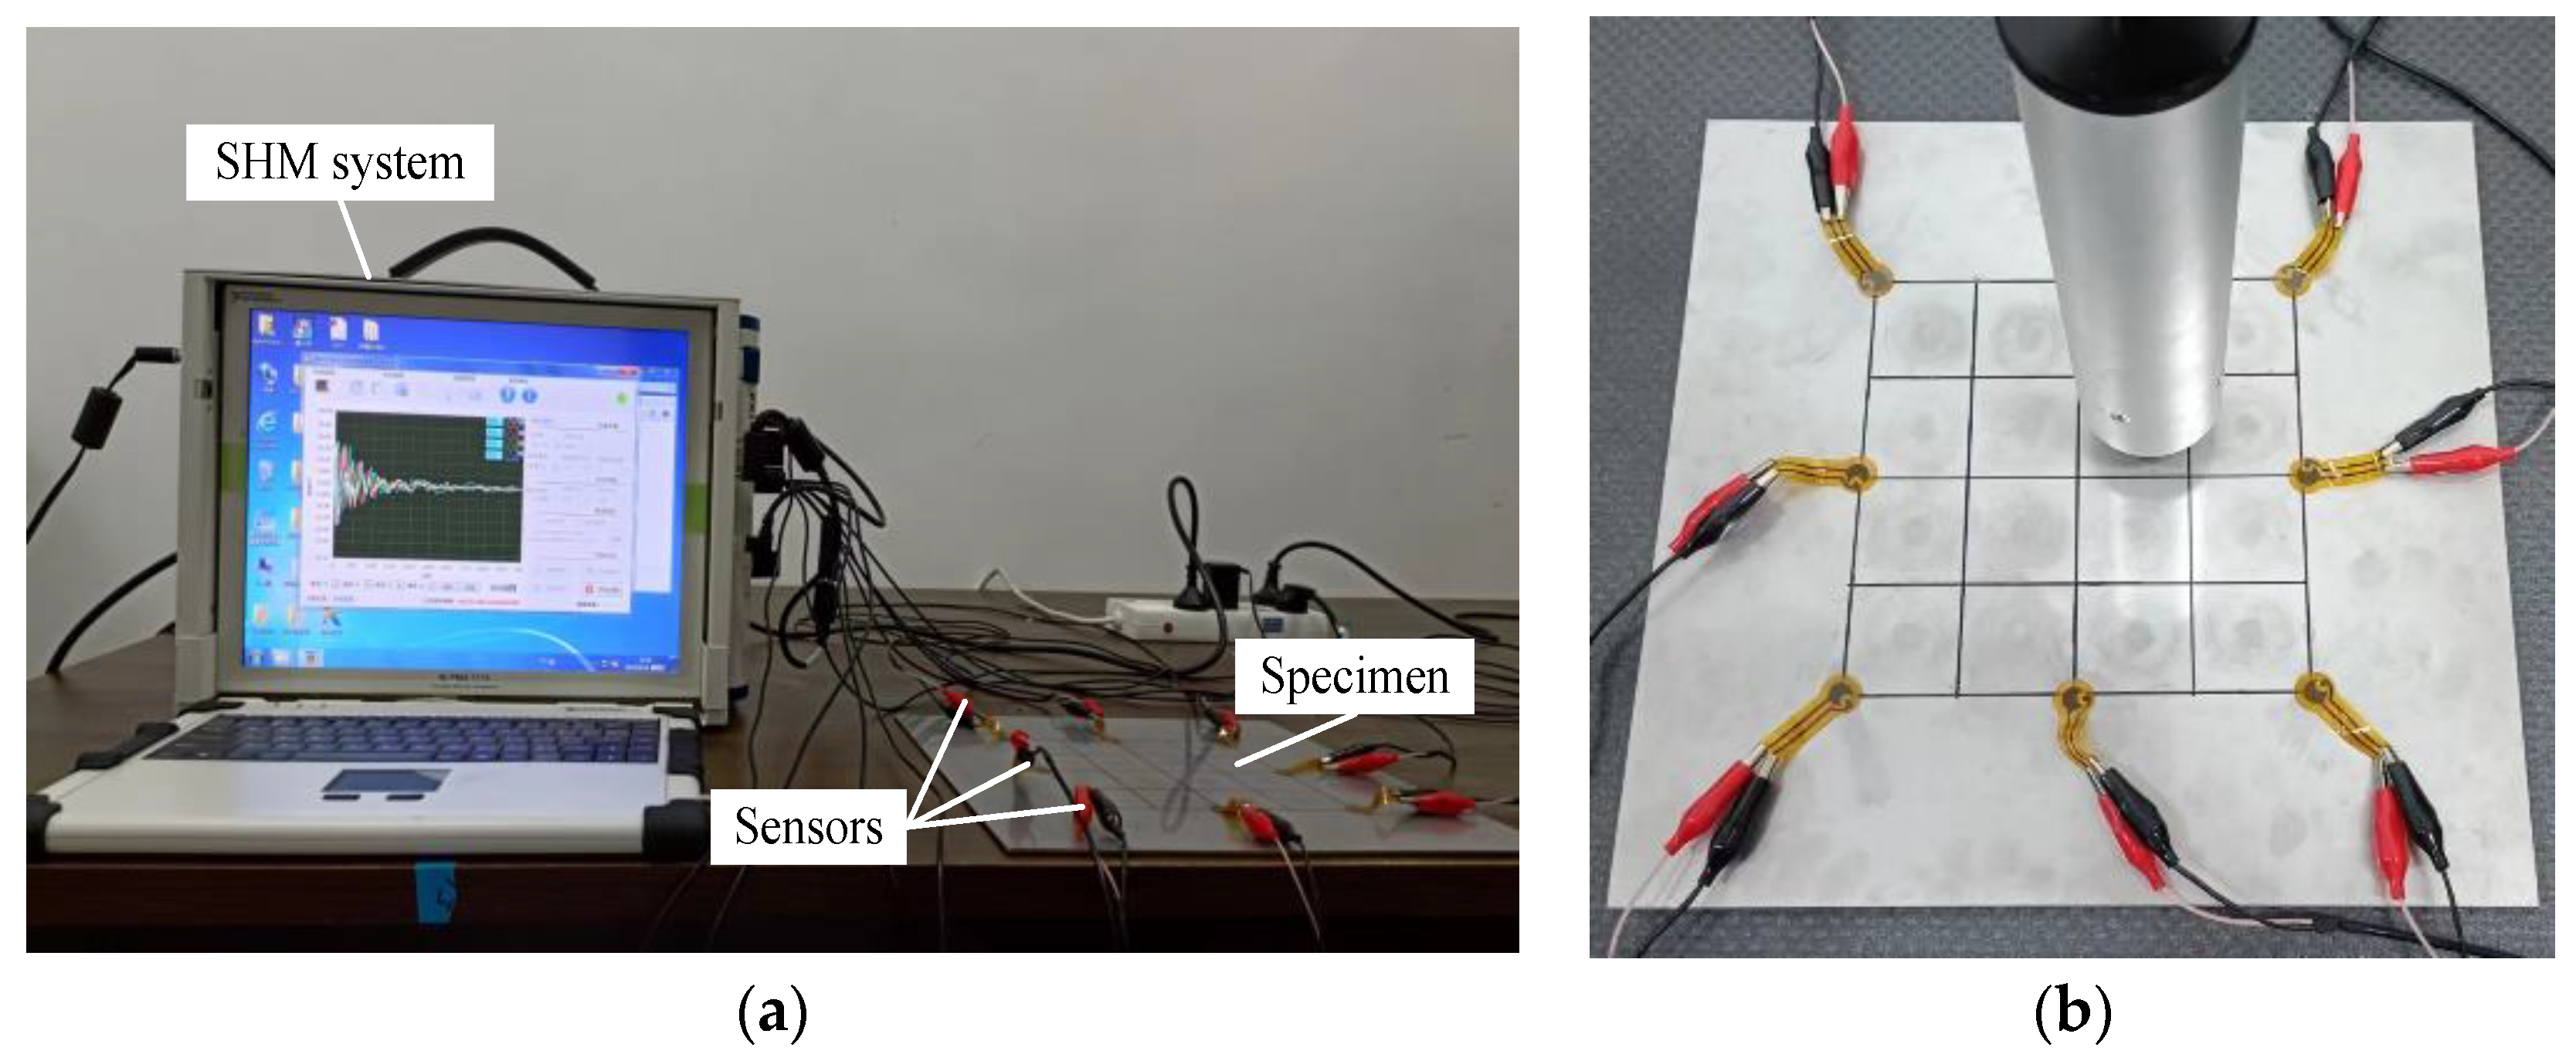
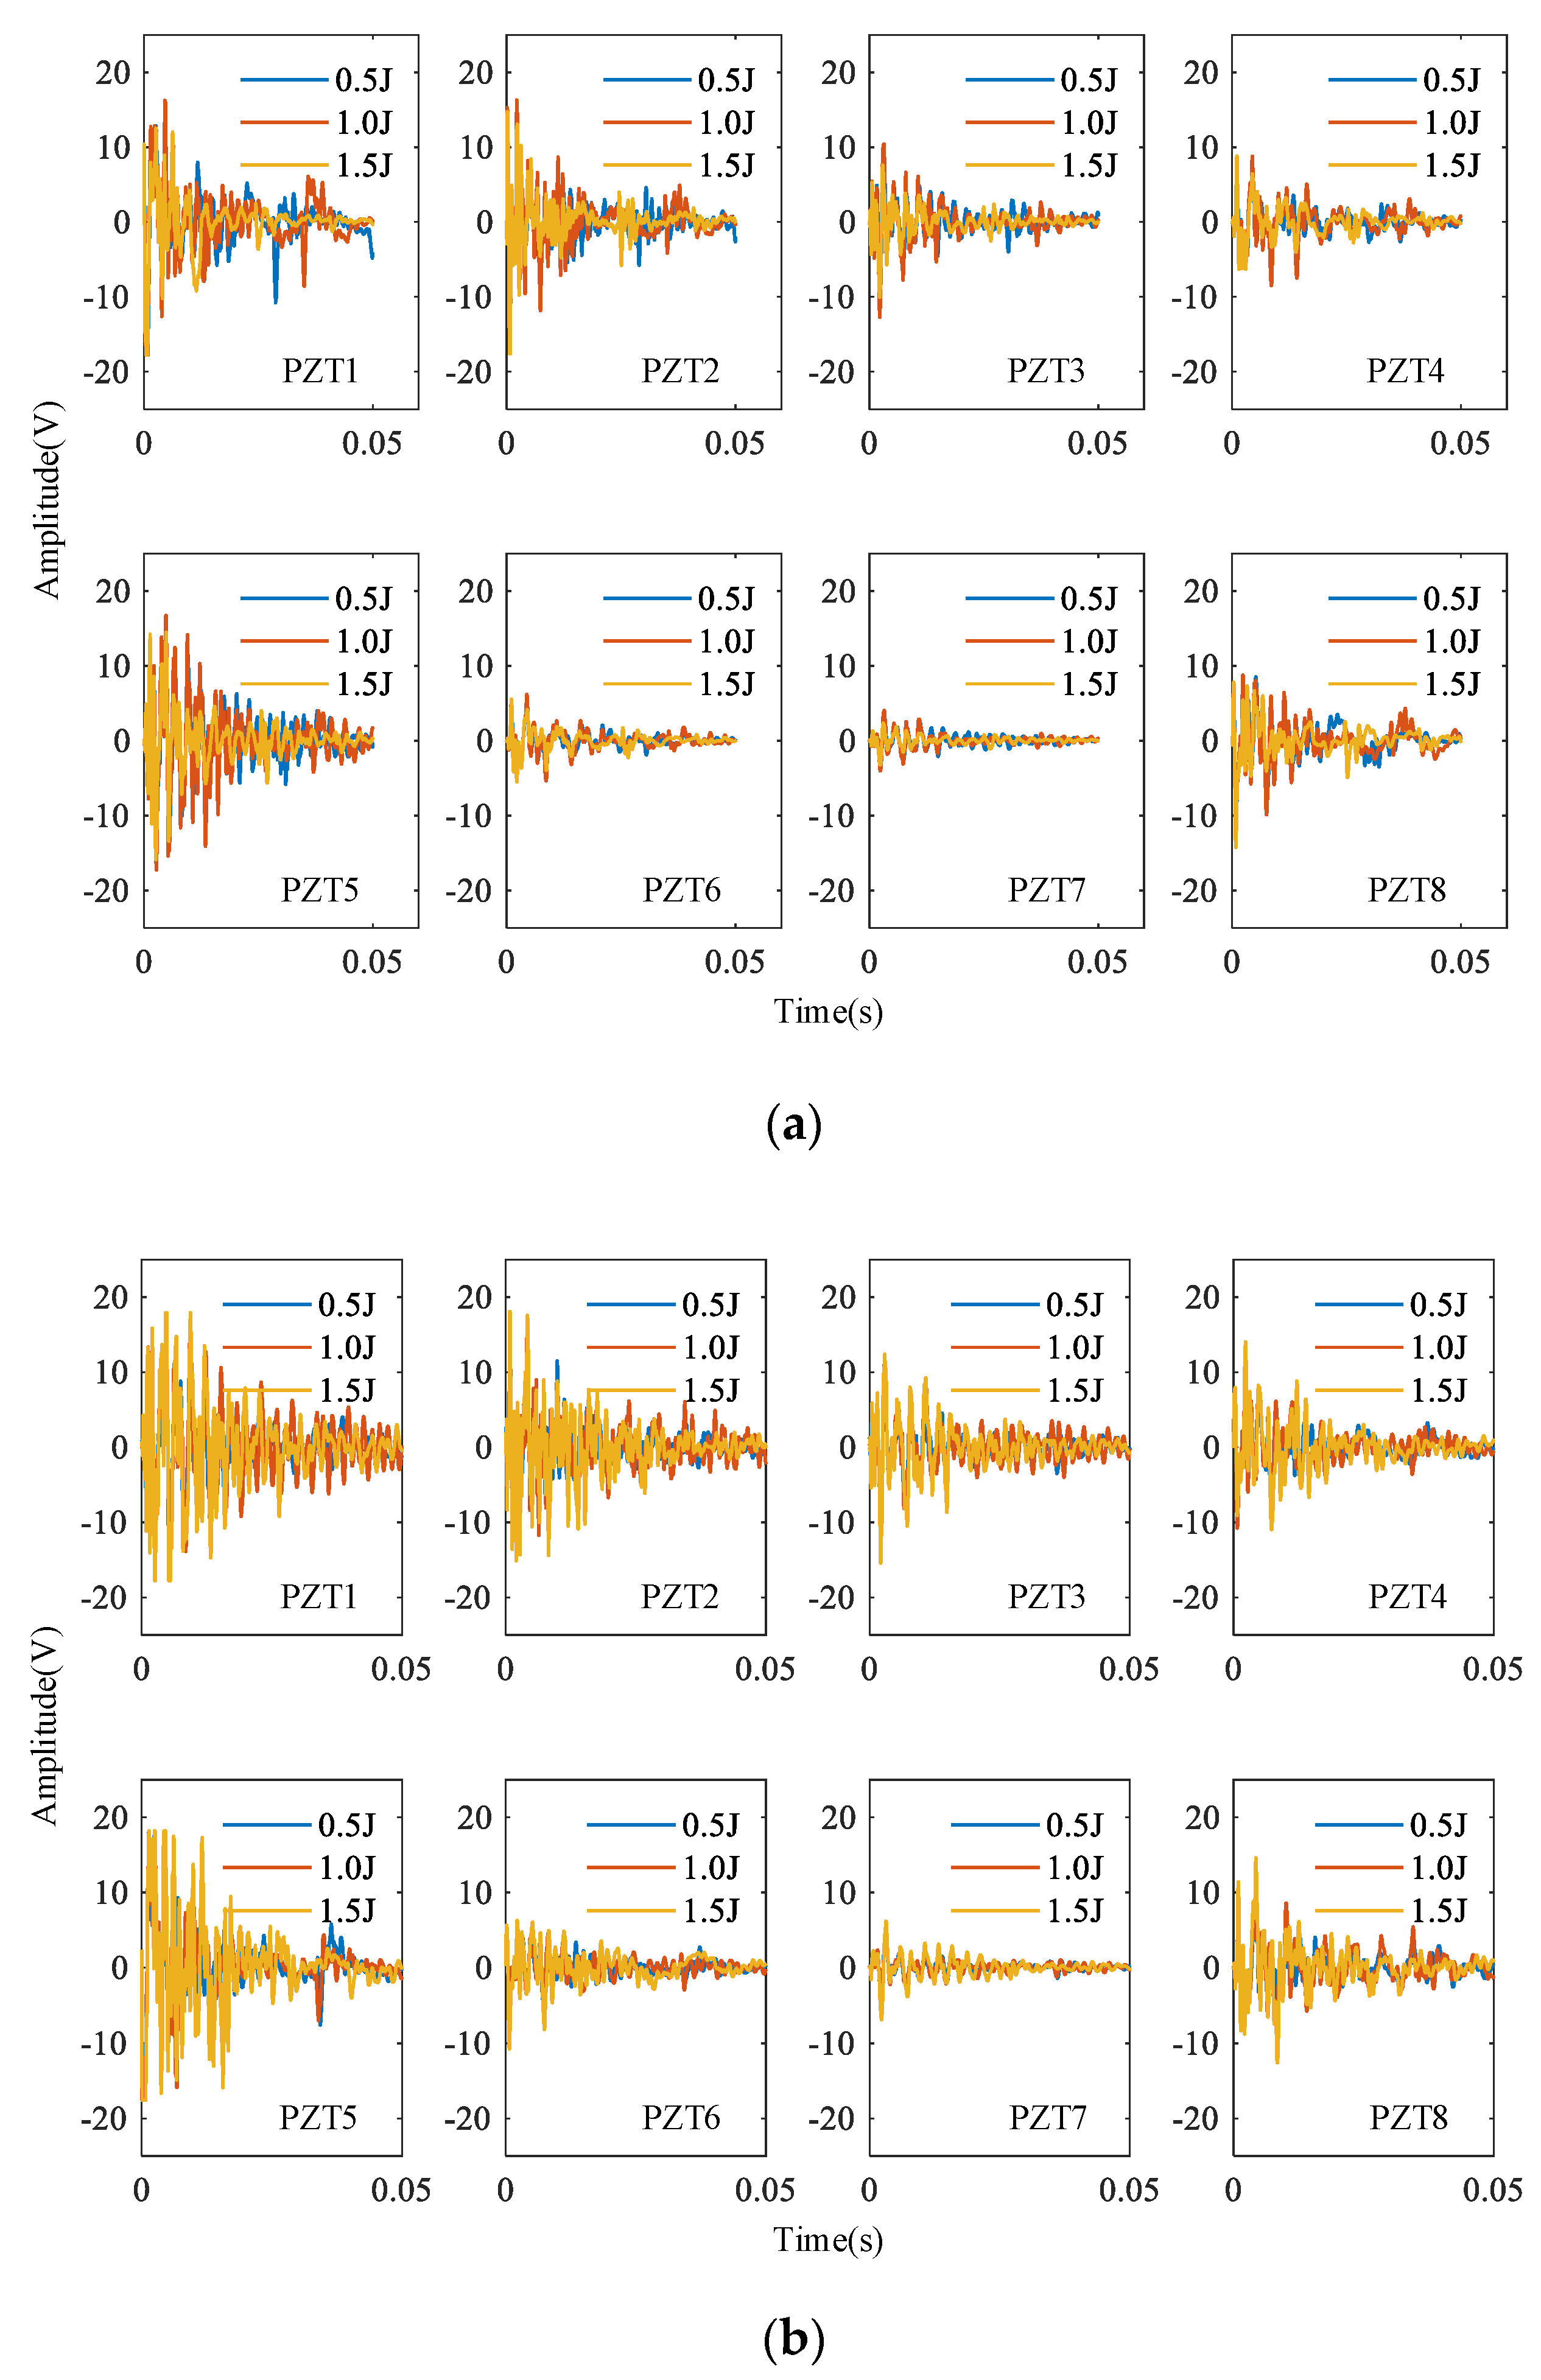
Original data acquisition stage: The impact damage monitoring method that is data-driven needs a lot of data, and Lamb wave data can be used to reflect the impact damage information. PZT sensors are pasted on the tested structure to receive Lamb wave signals. Spring impact hammers are used to apply impact loads to simulate impact damage. Lamb wave signals with different impact locations and different impact energies are collected.
(2)
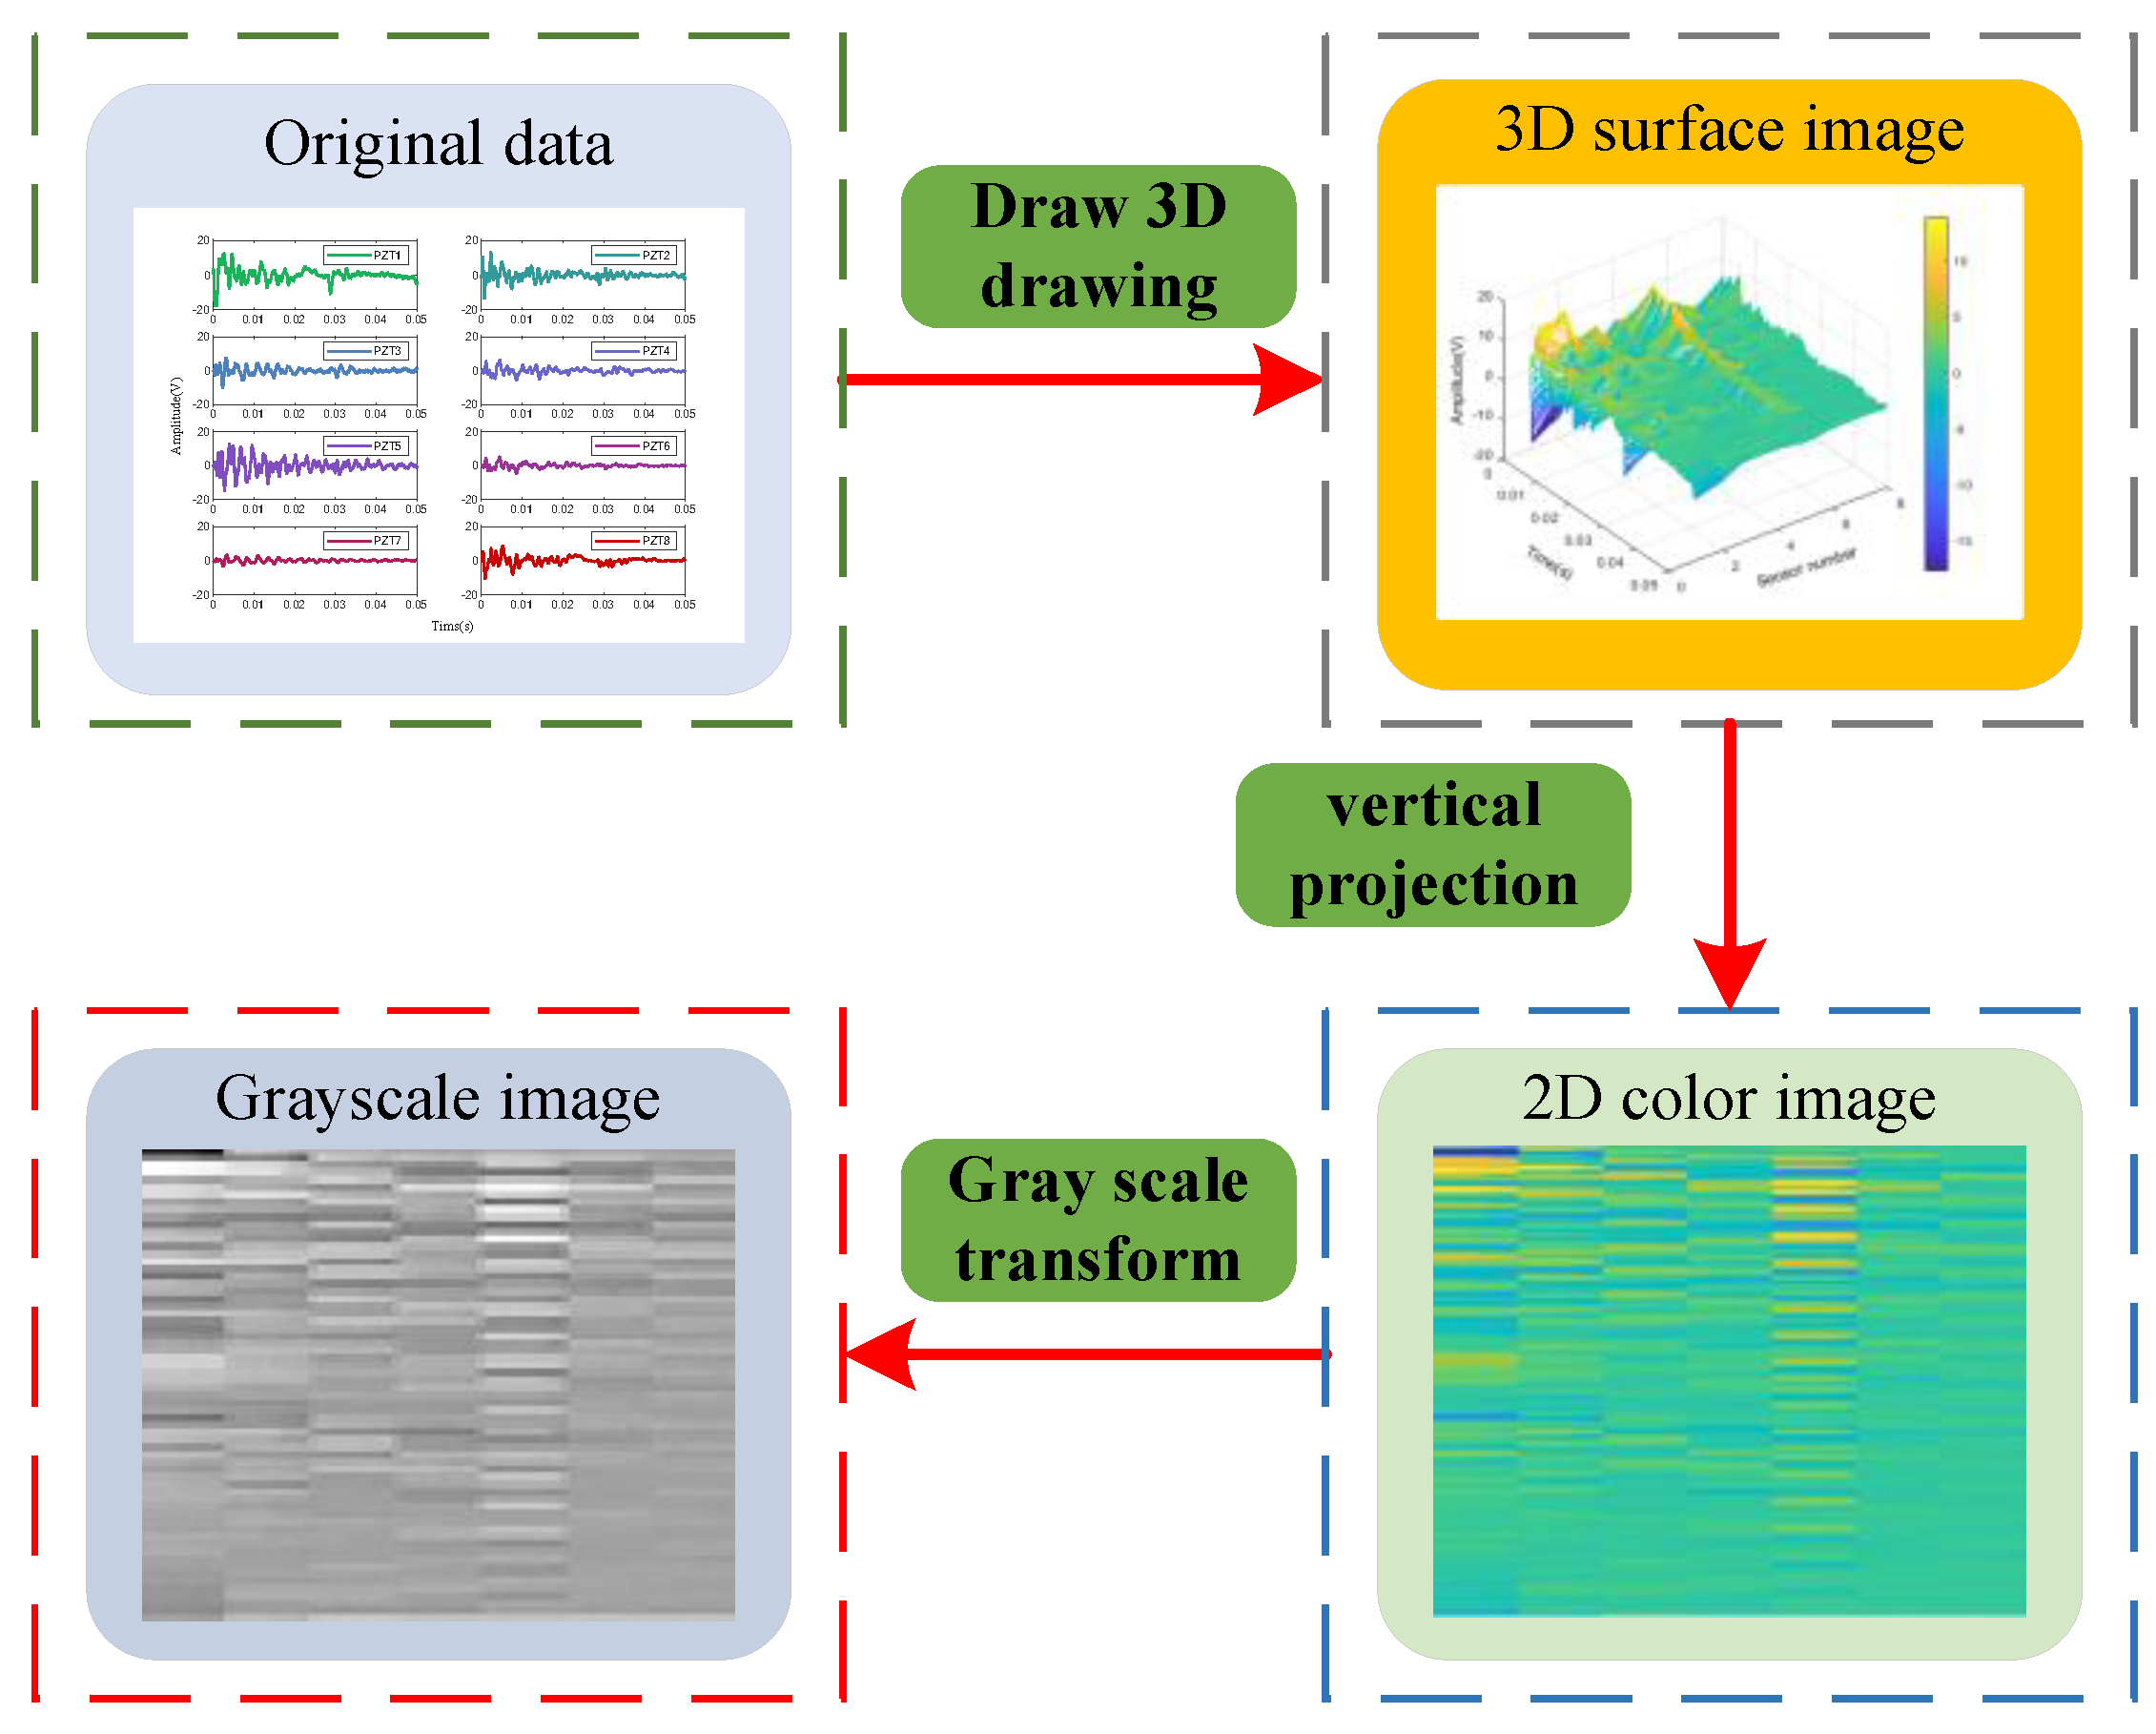
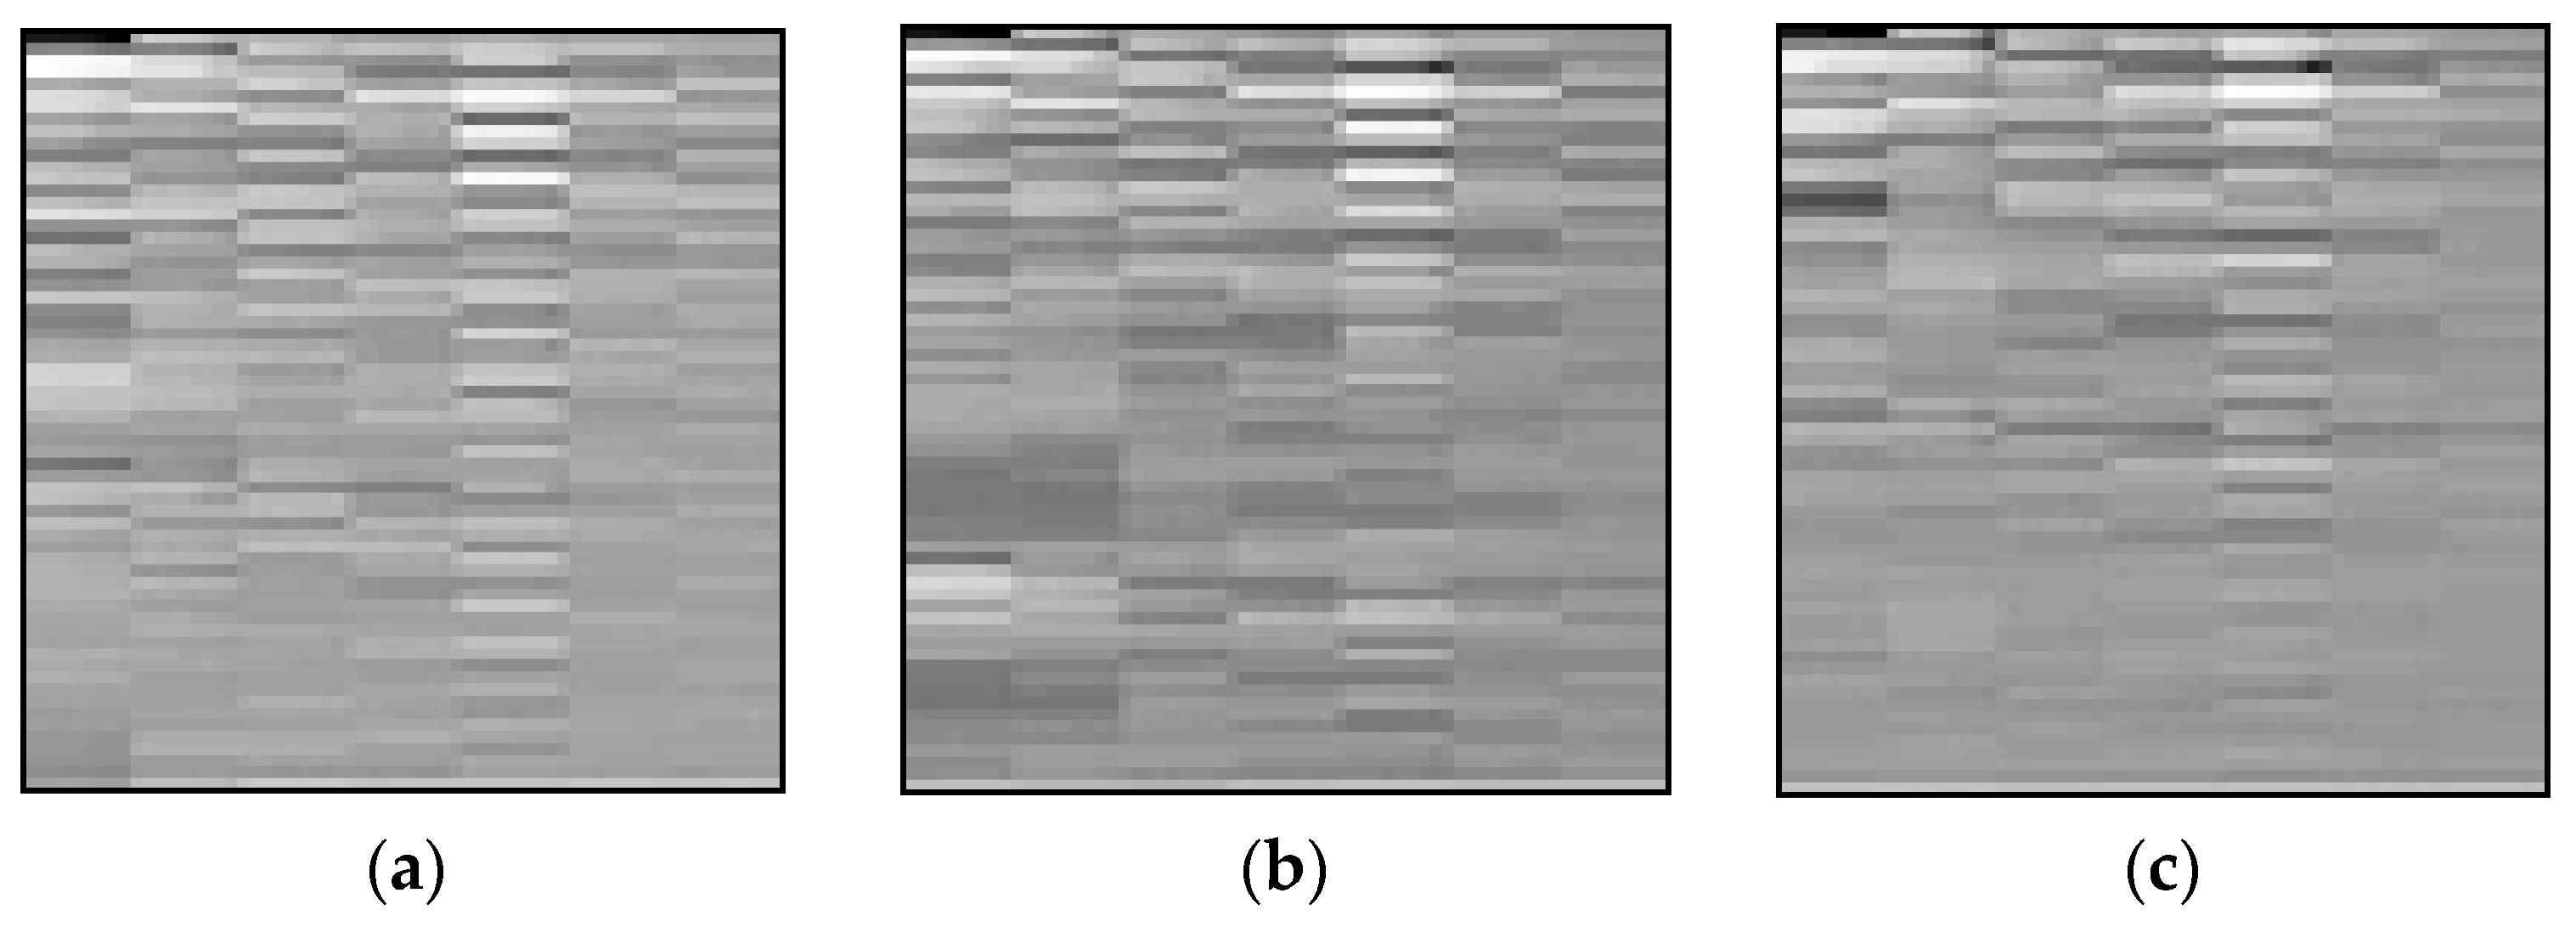
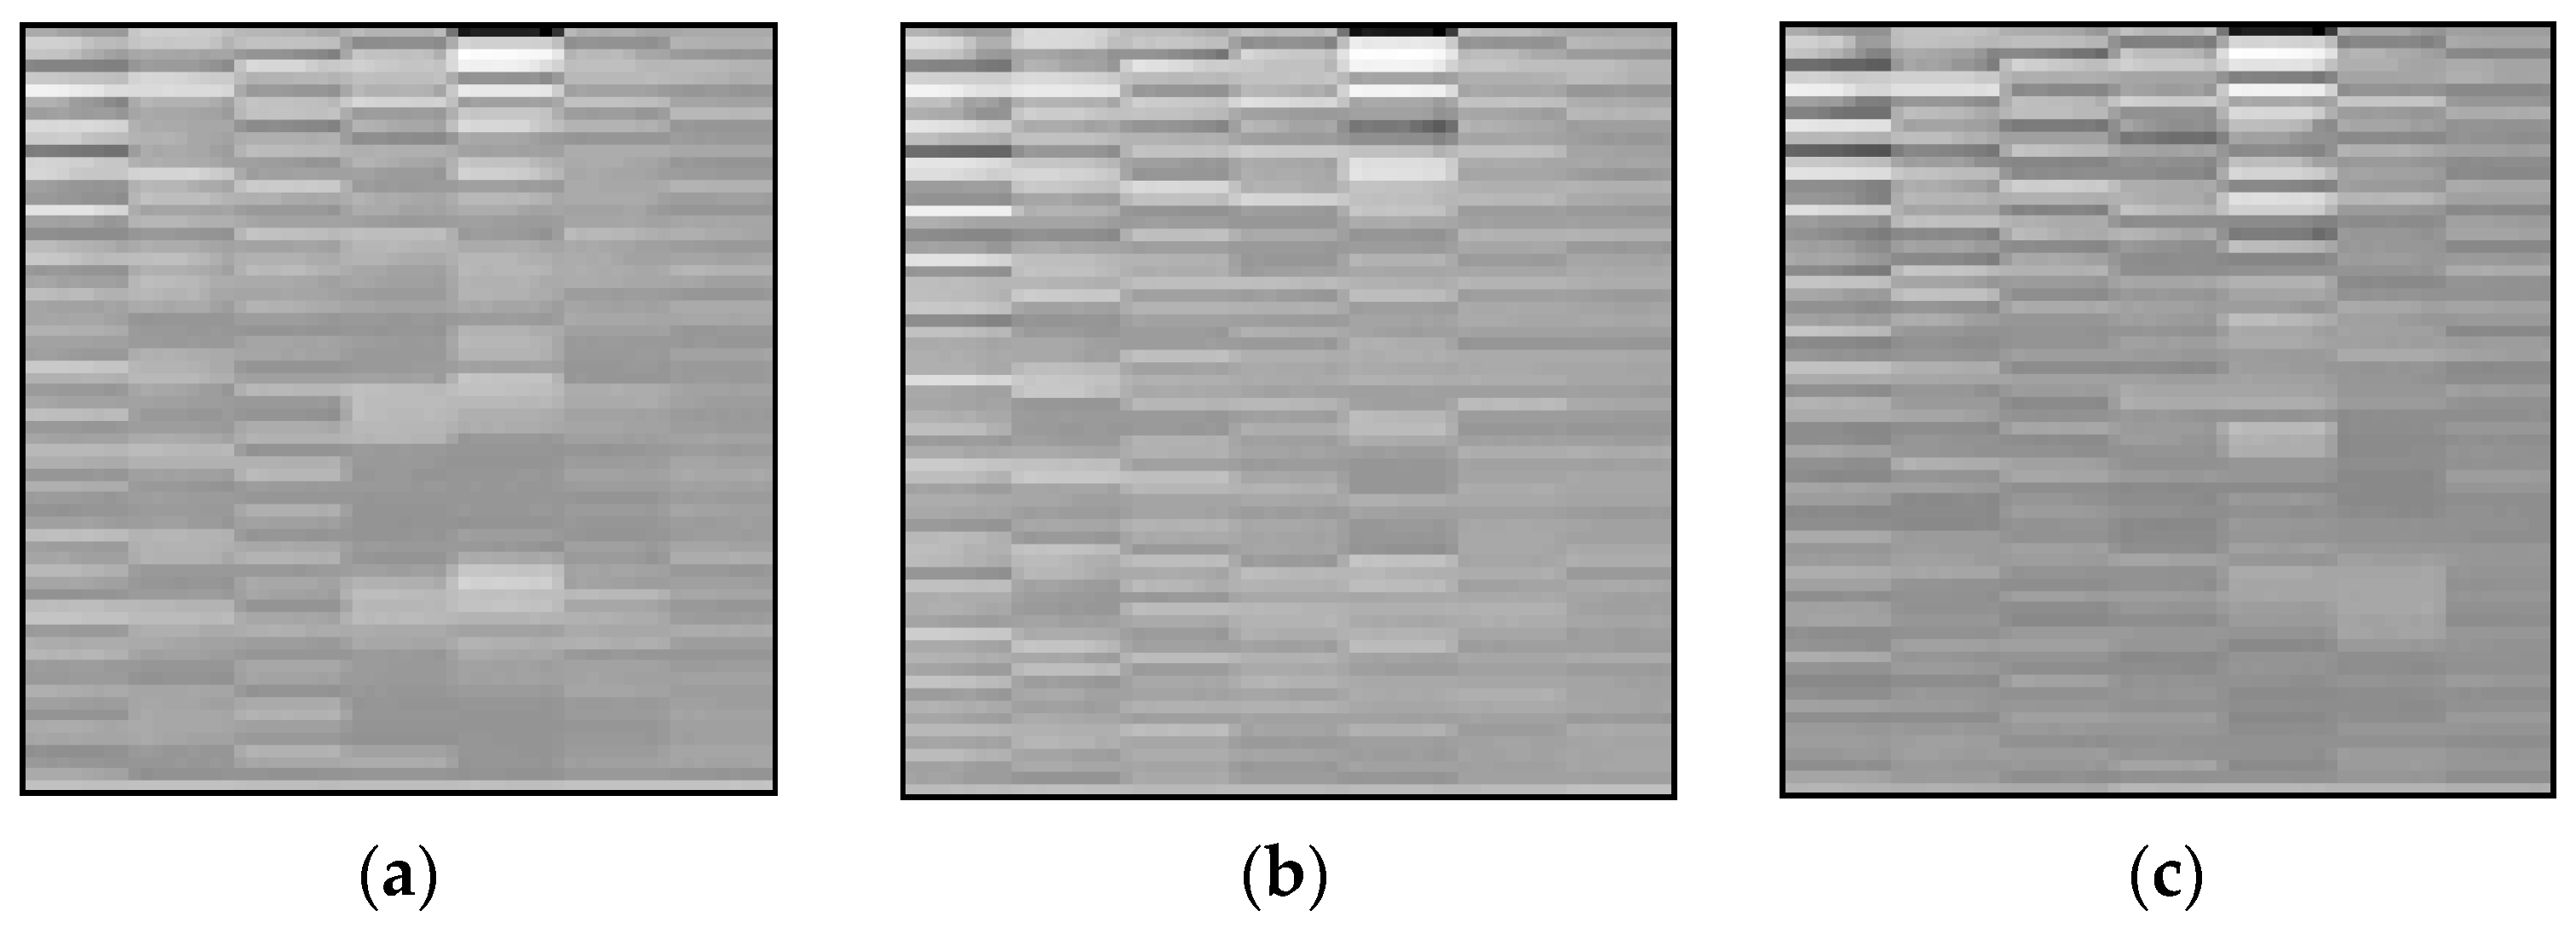
Signal processing stage: Lamb wave signals collected by each sensor are one-dimensional time domain signals. In order to achieve multi-sensor data fusion, a three-dimensional surface maps method is applied to integrate the information of all the sensor data. Vertical projection transformation converts a three-dimensional image to a two-dimensional color image. The gray image algorithm is used to convert color images into gray images and is used for model training and diagnosis.
(3)
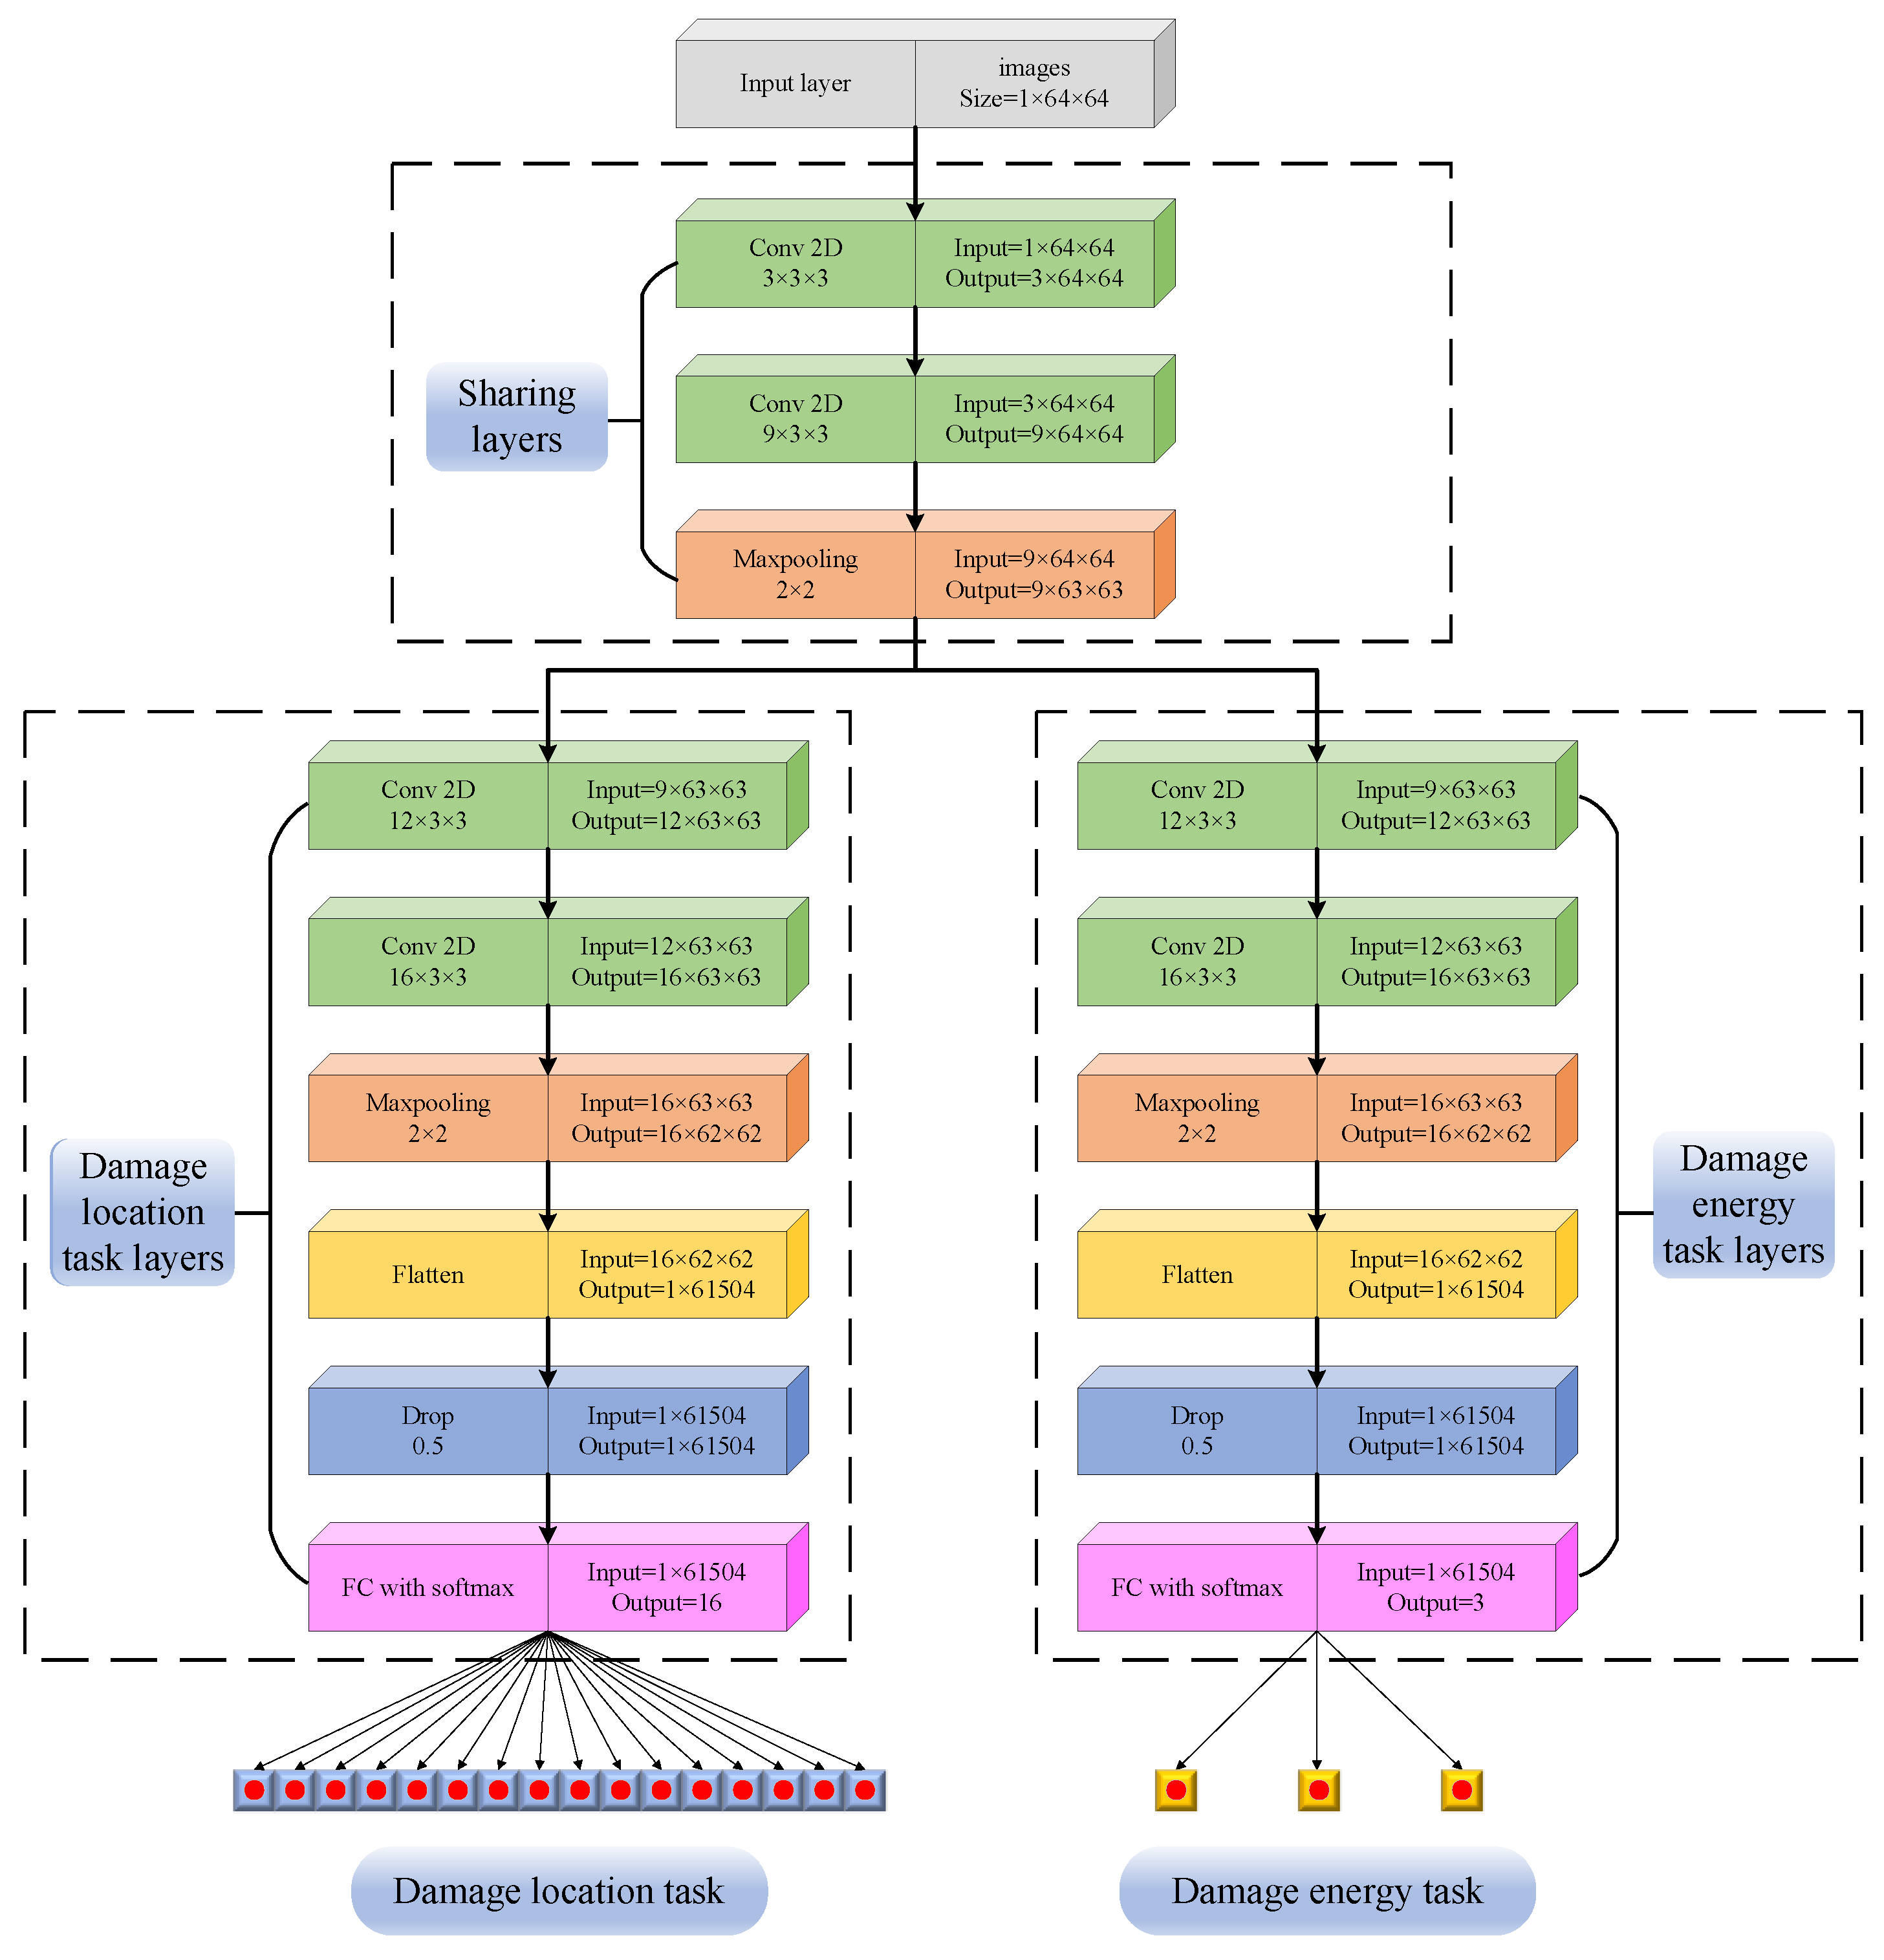
Impact damage detection stage: Input the gray image data into the multi-task 2D-CNN model to train the model and adjust the parameters of the multi-task 2D-CNN model through verification. The damage feature information is extracted from the gray image. The two classification tasks of the model are used to monitor the impact damage location and energy.
In this paper, a multi-task 2D-CNN is built in the PyTorch framework. The quantitative proportions of the training set, validation set, and test set are set to 8:1:1 by the holding out method. The training set is used to train the network, the validation set is used to verify the network performance, and the test set is used to test the network performance.

2.2. Signal Processing Stage

It is difficult to accurately monitor the impact damage to large structures with single sensor information. Monitoring signal fusion can reflect more impact damage information, which is an important way to improve diagnostic accuracy. Therefore, the measured data of multiple sensors are fused in a novel way to obtain more impact information. The specific conversion process is shown in Figure 2:
The impact signal received by the sensor network is drawn as a three-dimensional surface diagram of sensor number-time-voltage amplitude by mesh algorithm. On the sensor channel dimension, the values between the two sensors are generated through linear interpolation. In the three-dimensional surface map, the color reflects the voltage amplitude of sensor data, and multiple sensor data points are connected through a straight line to achieve multi-sensor data fusion. Then, the 2D color image is obtained by vertical projection to the plane composed of the sensor number and time of the 3D surface map. In the 2D color images, eight vertical dividing lines can be observed, representing the impact signals received by the sensors numbered 1–8 from left to right. The image points between each demarcation line are generated by linear interpolation during the drawing of the 3D surface and then transformed by projection. The 2D color images retain the time information, amplitude information of each sensor data point, and the relationship between each sensor. The 2D color images have three color component values R ij , G ij , B ij , ( i = 1 , 2 , 3 , m , j = 1 , 2 , 3 , n ) , where m and n represent the number of points in a row and the number of points in a column of a color image, respectively. It is also necessary to carry out grayscale processing on the image to make the proposed multi-task 2D-CNN model easy to train and iterate. The grayscale value signal I ij is defined with Formula (1):
I ij = R ij 299 / 1000 + G ij   587 / 1000 + B ij 114 / 1000
After the 2D color image is converted to a gray image, the number of data are reduced, which improves the calculation efficiency. Multi-sensor data fusion is realized, which provides a data set for the subsequent multi-task 2D-CNN model. The impact position information is related to time, and the relative position relationship of I ij represents the time domain information, such as the propagation time and arrival time, so the damage location can be realized. I ij expresses the signal amplitude of the Lamb wave, which is related to the impact energy and can realize the impact energy monitoring.

2.3. Impact Damage Detection Stage

In order to simultaneously monitor energy and position, a multi-task CNN is used to solve the problem. Compared with single-task learning, multi-task learning has the following advantages: (1) Multiple tasks in a model can reduce memory consumption; (2) the forward calculation results of multiple tasks can be obtained at one time to improve the calculation efficiency; (3) associated tasks can improve each other’s performance by sharing information and complementing each other.
The structure of the multi-task 2D-CNN proposed in this paper is shown in Figure 3. All parameters of the convolution layer and pooling layer used in this model can be clearly found in Figure 3. The model consists of two classification tasks. One is to detect the location of impact damage and the other is to detect the energy of impact damage. The classification task of damage location and the classification task of damage energy share the same weight components. In Figure 3, two tasks share two convolution layers and one pooling layer. The classification task of damage location and the classification task of damage energy have the same structure. In this paper, a total of 16 damage locations and 3 different levels of impact energy are included. The number of neurons in the full connection layer of the damage location task is the same as that of the damage location. The number of neurons in a fully connected impact energy task is the same as the number of impact severity categories. For classification tasks, the softmax activation function is generally used as the activation function of the fully connected layer. In addition, a drop mechanism is added to both full connection layers to prevent overfitting and improve robustness. The value is set to 0.5.
The back-propagation algorithm is used to update the parameters of the convolution neural network to minimize the loss function for the purpose of classification and recognition. The cross-entropy loss function is often used in classification problems and the mathematical formula is shown as Formula (2):
J = 1 N i = 1 N j = 1 K y j i log ( y ^ j i )
In Formula (2), when the i t h sample belongs to class j , y j i is equal to 1. Otherwise, y j i is equal to 0. In addition, y ^ j i represents the probability that the i t h sample is the j t h class, N is the total number of samples, and K is the total number of classes.
The loss functions of both tasks are multi-category cross-entropy loss functions, and the losses of both tasks are added up as the loss functions of the whole convolutional neural network, as shown in Formula (3).
L o s s = L o s s _ l o c c a t i o n + L o s s _ e n e r g y
L o s s _ l o c c a t i o n is the cross-entropic loss of impact damage location task calculated according to Formula (3). L o s s _ e n e r g y is the cross-entropic loss of impact damage energy task according to Formula (3).

3. Experiment

In this section, related experiments were carried out and the original Lamb wave data set was collected. A steel plate with dimensions 300 mm × 300 mm × 2 mm was considered as the specimen. The mechanical properties are shown in Table 1. As shown in Figure 4, 8 PZT sensors, namely, PZT1~PZT8, were pasted on the surface of the steel plate. Table 2 shows the parameters of the PZT sensor. The sensor network composed of 8 PZT sensors covered the entire impact area. The impact damage was conducted in a 160 mm square and divided into 16 subregions; each was a 40 mm square, numbered L1~L16, representing different damage locations. Damage degree is very important for structural health assessment and is an indispensable assessment index. Therefore, this paper used spring impact hammers with energies of 0.5, 1.0, and 1.5 J to apply impact loads to simulate impact damage at different severities. The SHM system (Nanjing Smart Monitoring Technology Co., Ltd., Nanjing, Jiangsu Province, China) was used to collect Lamb wave signals. The acquisition frequency was set to 100 kHz to sample 5000 data points. This signal length can cover most impact signals. The specific experimental settings are shown in Figure 5.
Each subregion was subjected to 50 repeated impacts with the same energy level, resulting in a total of 50 × 3 × 8 × 16 Lamb wave signals. Some of the original signals collected are shown in Figure 6. Figure 6a shows the raw signals collected by each sensor after impact with 0.5, 1.0, and 1.5 J impact hammers at position L1, and Figure 6b shows the raw signals collected by each sensor after impact with 0.5, 1.0, and 1.5 J impact hammers at position L16. Figure 6 shows that the changes in impact damage location and energy were not intuitive to the change in original signal. Using the original signal to estimate the location and energy of impact damage was difficult. In addition, the sensitivity of different PZT sensors to the impact changes was inconsistent. When the impact position was closer to a PZT sensor, the changes in received Lamb wave signals caused by impact energy were more serious than other sensors. Therefore, imaging processing was generally required to achieve multi-sensor data fusion.
In order to achieve multi-sensor data fusion, the signal processing method mentioned in Section 2.2 was used to convert the collected original signal into the gray image as the input dataset of the multi-task 2D-CNN. In the grayscale image, eight vertical dividing lines can be clearly observed, representing the impact signals received by the sensors numbered 1–8 in order from left to right. The grayscale values between each demarcation line were obtained by linear interpolation to generate image points during the stage of drawing the 3D surface map, followed by projection transformation and grayscale transformation. The magnitude of the grayscale value is affected by the impact energy and the impact location. The grayscale values on the dividing line represent the magnitude of the Lamb wave amplitude received by the sensor, and the grayscale values between the dividing lines preserve the effect of the change in impact location. The relative position relationship of the gray value contains the time domain information of the Lamb wave, such as the propagation time and arrival time, which contains the information about the impact location. Figure 7a–c shows the grayscale images obtained by processing the impacts of the three impact hammers of 0.5, 1.0, and 1.5 J at the L1 position, respectively. Since the PZT 1 is the closest to the L1 position, the amplitude of the signal received by the PZT 1 is the largest, and so the image points between the first and second dividing lines in the grayscale images have the darkest color. Similarly, Figure 8a–c shows the grayscale images obtained by processing the impacts of the three types of impact hammers of 0.5, 1.0, and 1.5 J, respectively, at the position of L16. Since the PZT 5 is the closest to the position of L16, the amplitude of the signals received by the PZT 5 is the largest, and thus the color of the image points in the grayscale images is the darkest between the 5th demarcation line and the 6th demarcation line. In addition, when impact hammers with different impact energies impact at the same location, there will be a difference in the grayscale value of the grayscale image. The larger the impact energy, the larger the gray value of the grayscale image will be, and the color of the grayscale image will be darker. Therefore, it can be seen that the colors of Figure 7a–c are deepened with the increase in impact energy, and the colors of Figure 8a–c are deepened with the increase in impact energy.

4. Results and Discussion

4.1. Multi-Task 2D-CNN Training

A total of 2400 sample images were obtained through the experiment in Section 3. The network was trained by the stochastic optimization method of adaptive momentum. The training algorithm was the Adam algorithm. The number of epochs was 80, the learning rate was 0.0001, and the batch size was 30. As shown in Figure 9 and Figure 10, the loss of the network decreased with the epochs and converged rapidly in 40 cycles. The correct rate of the two classifiers increased with the epochs and converged rapidly in 10 and 40 cycles. In addition, there was a slight fluctuation in the whole training curve, which indicated that the whole training process was very stable.
T-SNE is a nonlinear dimension reduction algorithm that overcomes the shortcomings of data congestion and the poor visualization effect after dimensionality reduction by other methods [34]. It effectively realizes data dimensionality reduction and data visualization by mapping a low-dimensional manifold structure from high-dimensional data. Figure 11a,b shows the dimension-reduced visualization results of impact position before and after training in the training set. Figure 11c,d shows the dimension-reduced visualization results of impact energy before the training and after the training by the training set. Each color in the graph represents a class. The sample numbers in different categories are random, and the total is equal to the sample numbers by the training set. The distribution of samples was chaotic before the training, and after the training, the distribution of samples became categorized. The visualization results of feature vectors based on the t-SNE algorithm show that the multi-task 2D-CNN proposed in this paper can effectively extract hidden features about impact location and impact energy. The extracted feature vectors have good in-class compactness and between-class separateness, thus realizing sample classification and recognition.

4.2. Model Evaluation and Comparison

The constructed test set was fed into the trained network model to obtain the confusion matrices for the location classification task and the energy prediction task, as shown in Figure 12. For the damage location classification task, because the confusion matrix for damage location classification had elements of 0 at all positions except the diagonal, all damage locations of the 240 damage samples in the test set were correctly predicted with 100% accuracy for both single-task learning and multi-task learning. All damage locations of the 240 damage samples in the test set were correctly predicted for both single-task learning and multi-task learning. From this, it can be calculated that the accuracy of the damage location classification task was 100% in both cases. In the impact energy classification task, single-task learning incorrectly predicted eight samples with 96.67% accuracy. Multi-task learning incorrectly predicted only 4 samples, and the remaining 236 samples were all correctly predicted with an accuracy of 98.33%. It can be seen that the accuracy of multi-task learning in predicting the magnitude of impact energy was significantly higher than that of single-task learning. Precision, recall, and F1-score were used to evaluate the damage classification results. For both single-task learning and multi-task learning, the accuracy of the test set in the damage location classification task was 100% and hence, the precision, recall, and F1-score were also 100%. Table 3 shows the accuracy, recall, and F1 score for the damage energy classification task for each energy damage. From the table, it can be seen that all the indexes of multi-task learning were stronger than single-task learning, which indicated that multi-task learning can closely link multiple tasks, and the features between multiple tasks complemented each other, which ultimately improves the prediction accuracy and performance of the network. Therefore, the proposed means of simultaneous impact damage location prediction and impact damage energy prediction is feasible.
In practice, single-task learning consumes a lot of hardware and software resources, resulting in slow computation. Therefore, we compared the training times of multi-task learning and single-task learning, as shown in Table 4. Compared with single-task learning, multi-task learning took less time to train and computed faster, reducing the total training time by 30.83%.
To verify the validity of the proposed model for impact damage location prediction and impact energy prediction, it was compared with other commonly used machine learning algorithms in pattern recognition. Nine commonly used empirical characteristic indexes were extracted from signals [35]. Empirical features were input into support vector machines (SVMs), decision trees (DTs), and random forest (RF) model training and testing. The results of each model in the test set are shown in Table 5. The accuracy of the proposed model in impact damage location prediction and impact damage energy prediction was the highest. This also indicates that the model can extract more effective characteristics for impact damage signals, and it can provide better decision-making references for non-professionals and reduce learning difficulties.
In general, it may not be possible to collect many samples in real engineering applications. In this paper, comparative experiments with small samples were conducted to discuss the stability of multi-task learning. Experiments were conducted in this paper using 50% and 25% samples. The confusion matrices for the location prediction task and the energy prediction task obtained from the experiments using 50% of the samples are shown in Figure 13. The confusion matrices for the location prediction task and the energy prediction task obtained from the experiments using 25% of the samples are shown in Figure 14. In Figure 13, the damage location classification task with single-task learning predicted two samples incorrectly with an accuracy of 98.33%. Multi-task learning predicted only one sample incorrectly, with an accuracy of 99.16%. In the impact energy classification task, single-task learning incorrectly predicted eight samples with an accuracy of 93.33%. Multi-task learning incorrectly predicted only 3 samples, and the remaining 117 samples were all correctly predicted with an accuracy of 97.50%. In Figure 14, the damage location classification task with single-task learning predicted one sample incorrectly with an accuracy of 98.33%. Multi-task learning predicted one sample incorrectly, with an accuracy of 99.16%. In the impact energy classification task, single-task learning incorrectly predicted seven samples with an accuracy of 88.33%. Multi-task learning incorrectly predicted only 3 samples, and the remaining 57 samples were all correctly predicted with an accuracy of 95.00%. As shown in Figure 15 and Table 6, the accuracy of multi-task learning in predicting the location of impact damage and the magnitude of the impact energy was significantly higher than that of single-task learning when the number of samples was reduced. In addition, the prediction accuracies of both single-task learning and multi-task learning decreased to a certain extent, but the decrease in the prediction accuracy of multi-task learning was lower than that in single-task learning, which indicates that there is an implied data enhancement mechanism in multi-task learning, which can effectively increase the number of training instances. This makes the prediction accuracy of multi-task learning higher and more stable than single-task learning and less dependent on the number of samples.
As shown in Table 7, when the number of samples decreased to 50%, compared to single-task learning, multi-task learning took less time to train and computed faster, reducing the total training time by 26.64%. As shown in Table 8, when the number of samples decreased to 25%, compared to single-task learning, multi-task learning took less time to train and computed faster, reducing the total training time by 30.19%. The experimental results show that multi-task learning has higher accuracy than single-task learning for both multiple samples and fewer samples, as well as better stability and shorter training time.

5. Conclusions

In this paper, a structural impact damage monitoring method based on Lamb waves and a multi-task 2D-CNN is proposed. Within the detection framework, a new image processing method is proposed for multi-sensor data fusion by converting the raw Lamb wave signals into grayscale images. A multi-task 2D-CNN is established for feature extraction, impact location classification, and impact energy quantification. According to the experimental results, the impact damage detection method has excellent performance in monitoring the impact damage to aluminum alloy. The specific conclusions are as follows:
(1)
A new image processing method is proposed to closely link the sensor signals from multiple channels and finally convert the original Lamb wave signal into a grayscale image to realize multi-sensor data fusion. The constructed grayscale image contains rich impact information, so it is used as the input to the multi-task 2D-CNN.
(2)
The multi-task 2D-CNN can automatically extract deep-level damage features without physical a priori information, and the accuracy of the impact damage location identification and impact energy identification are higher than traditional machine learning methods.
(3)
The multi-task 2D-CNN can understand the commonality and characteristics of each task by sharing the network structure and parameters. Experimental results show that the model can effectively recognize the location and severity of impact damage simultaneously. Compared with single-task learning, multi-task learning performs better on various metrics of the impact energy task, reducing the training time by 30.83%.
(4)
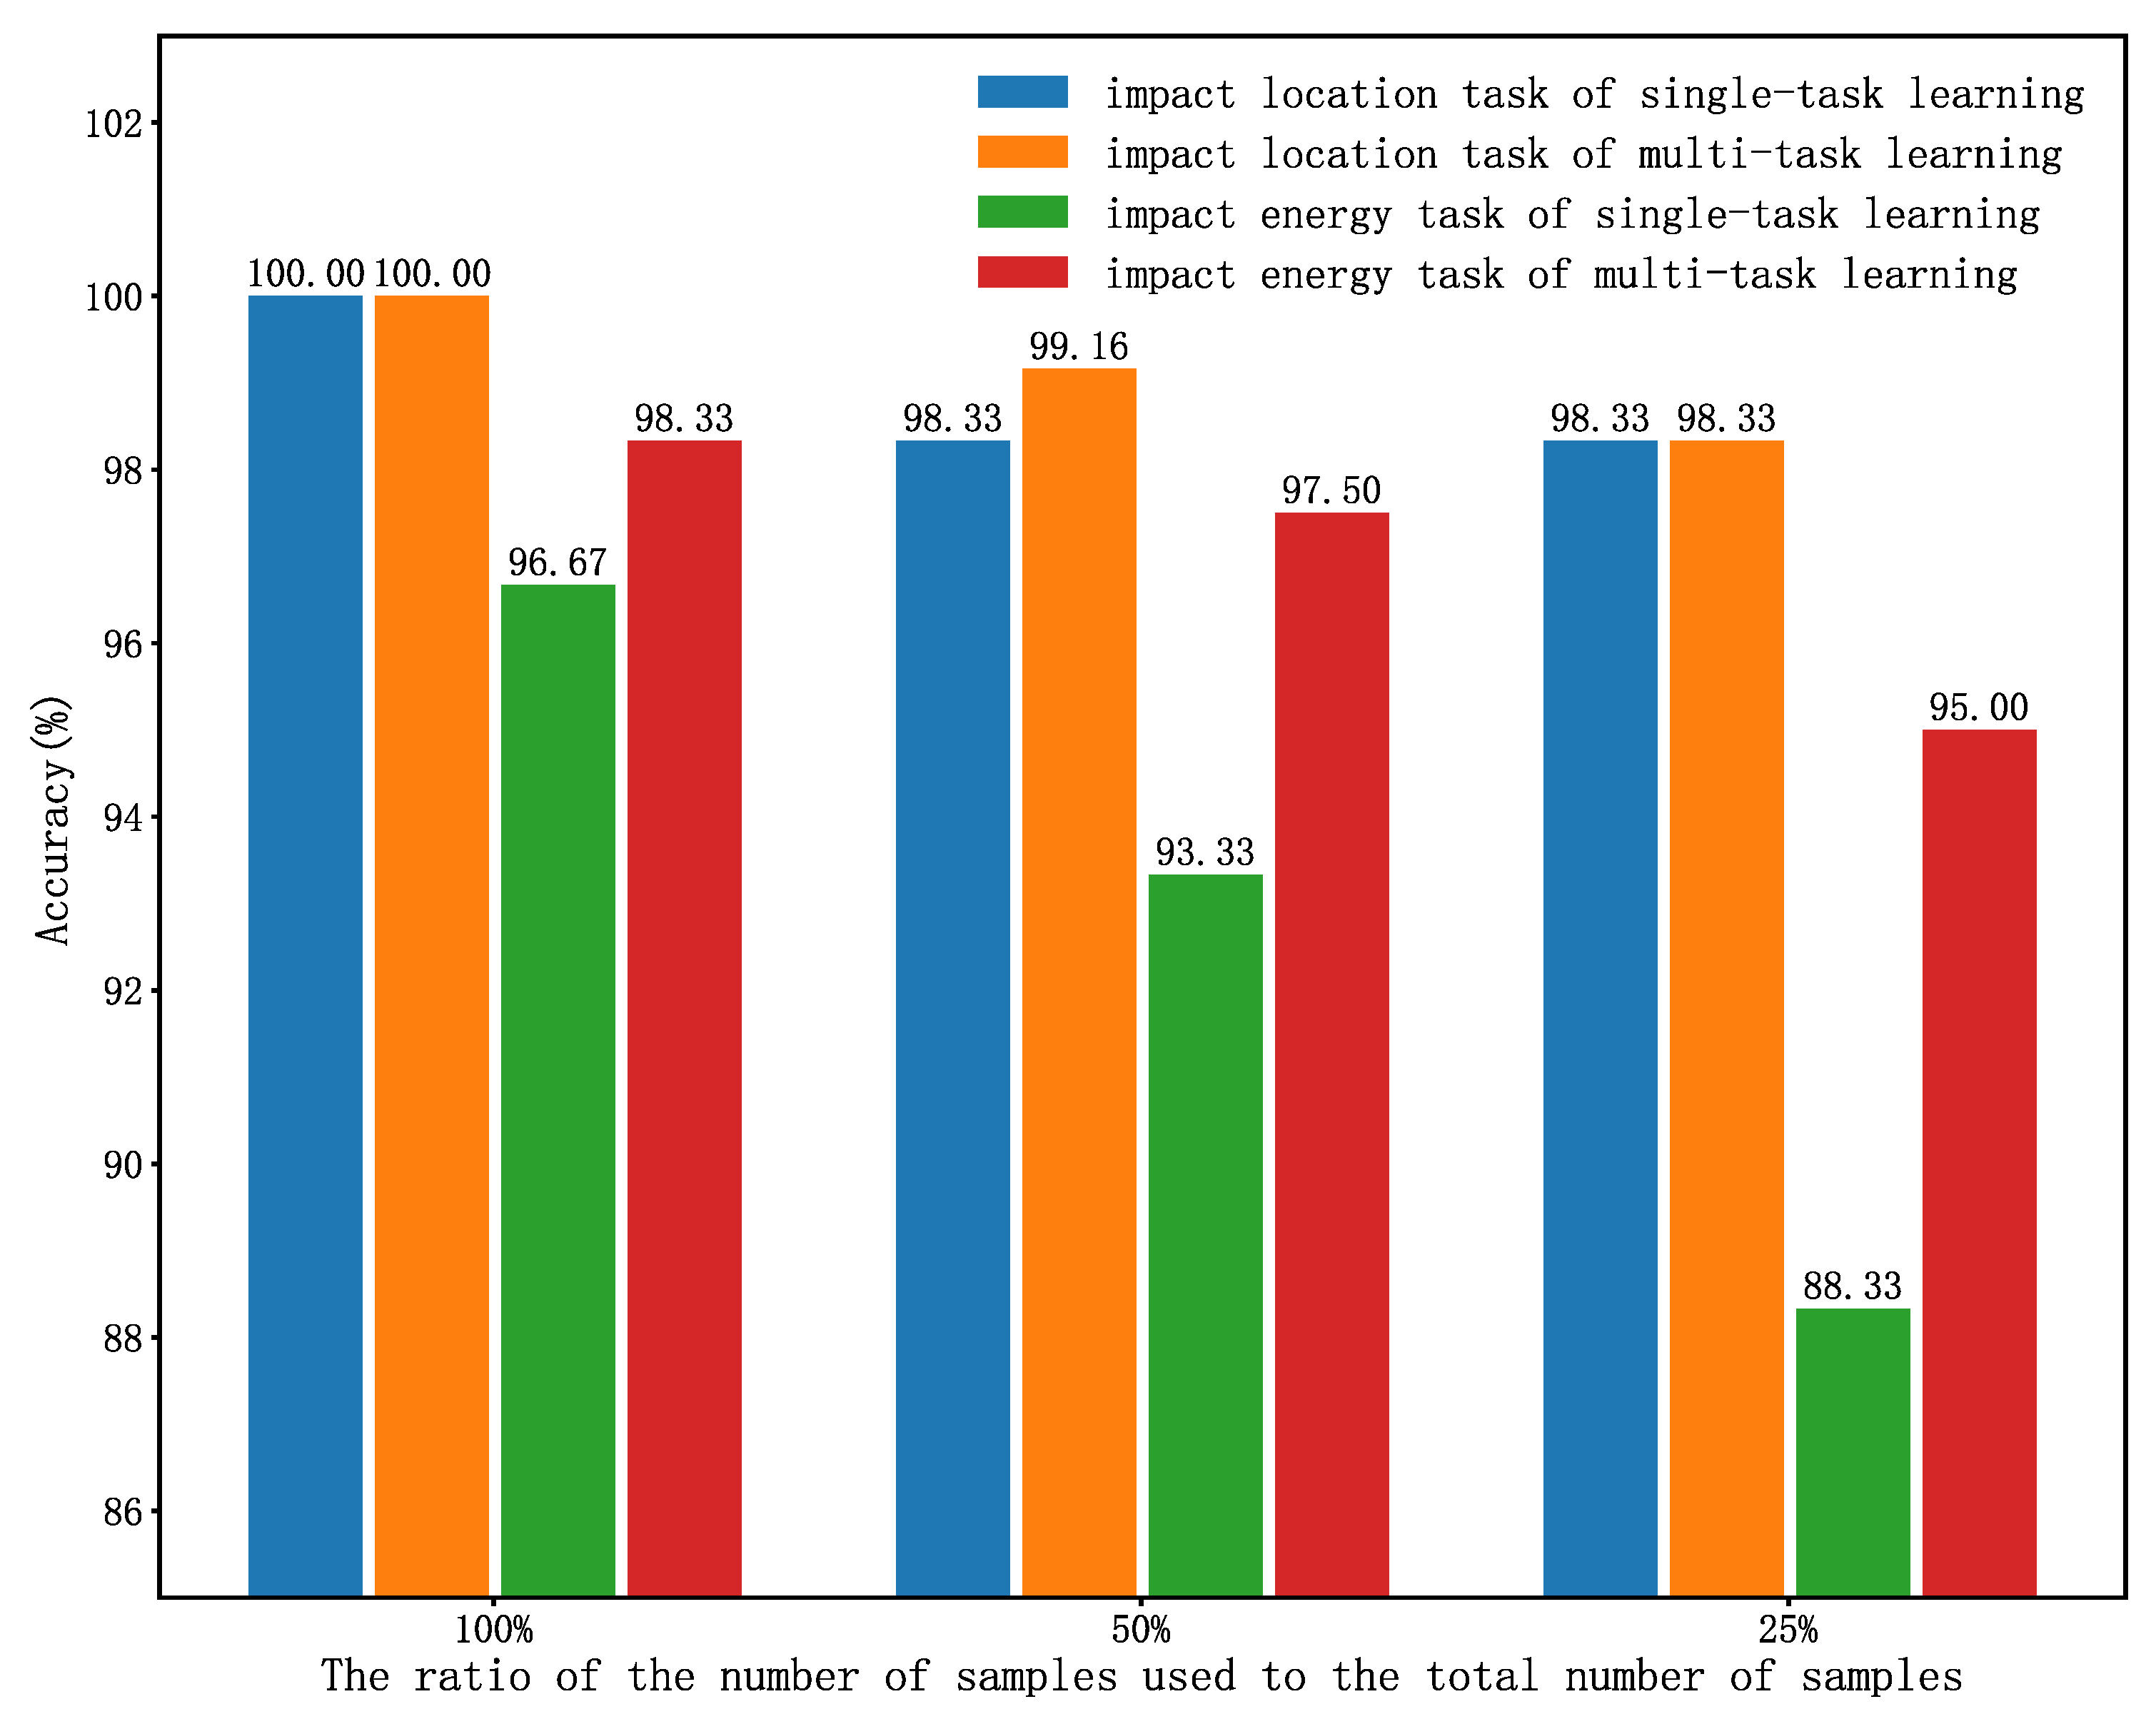
In the case of reducing the number of samples, the accuracy degradation of multi-task learning is small compared to single-task learning, which proves that there is an implicit data enhancement mechanism in multi-task learning, which can effectively increase the number of training instances, making multi-task learning prediction accuracy higher and more stable, and more independent of the number of samples.
Considering that the prior knowledge of Lamb wave propagation velocity and expert knowledge of feature extraction are no longer necessary information, the proposed method has a strong advantage in the impact damage identification of irregular structures under severe service environment exposure.

Author Contributions

Conceptualization, J.Y.; methodology, Z.G. and J.Y.; software, Z.G. and X.Z.; validation, J.Y. and T.W.; formal analysis, J.X.; investigation, J.X.; resources, T.W.; data curation, J.Y. and Z.G.; writing—original draft preparation, J.Y. and Z.G.; writing—review and editing, J.Y. and Z.G.; supervision, T.W. All authors have read and agreed to the published version of the manuscript.

Funding

This work is supported by Joint Funds of the National Natural Science Foundation of China (Grant No. U2268205).

Institutional Review Board Statement

Not applicable.

Informed Consent Statement

Not applicable.

Data Availability Statement

Data requirements can be directed to the corresponding author.

Conflicts of Interest

The authors declare no conflict of interest.

References

  1. Yüksel, K.; Kinet, D.; Moeyaert, V.; Kouroussis, G.; Caucheteur, C. Railway monitoring system using optical fiber grating accelerometers. Smart Mater. Struct. 2018, 27, 105033. [Google Scholar] [CrossRef]
  2. Khodaei, Z.S.; Aliabadi, M.H.F.; Shen, Y.; Cesnik, C.E.S.; Banerjee, S.; Shrestha, S.; Ostachowicz, W.M.; Malinowski, P.H.; Wandowski, T.; Rocha, B.; et al. Structural Health Monitoring for Advanced Composite Structures; World Scientific Publishing: Singapore, 2017. [Google Scholar]
  3. Yang, B.; Xuan, F.-Z.; Chen, S.; Zhou, S.; Gao, Y.; Xiao, B. Damage localization and identification in WGF/epoxy composite laminates by using Lamb waves: Experiment and simulation. Compos. Struct. 2017, 165, 138–147. [Google Scholar] [CrossRef]
  4. Su, C.; Jiang, M.; Liang, J.; Tian, A.; Sun, L.; Zhang, L.; Zhang, F.; Sui, Q. Damage Localization of Composites Based on Difference Signal and Lamb Wave Tomography. Materials 2020, 13, 218. [Google Scholar] [CrossRef]
  5. Schäfer, F.; Janovsky, R. Impact sensor network for detection of hypervelocity impacts on spacecraft. Acta Astronaut. 2007, 61, 901–911. [Google Scholar] [CrossRef]
  6. Chen, Z.; Xu, G.; Lu, W.; Li, C.; Lu, C. Nonlinear lamb wave imaging method for testing Barely Visible Impact Damage of CFRP laminates. Appl. Acoust. 2022, 192, 108699. [Google Scholar] [CrossRef]
  7. Su, C.; Jiang, M.; Liang, J.; Tian, A.; Sun, L.; Zhang, L.; Zhang, F.; Sui, Q. Damage Identification in Composites Based on Hilbert Energy Spectrum and Lamb Wave Tomography Algorithm. IEEE Sens. J. 2019, 19, 11562–11572. [Google Scholar] [CrossRef]
  8. Zhu, K.; Qing, X.P.; Liu, B. A two-step impact localization method for composite structures with a parameterized laminate model. Compos. Struct. 2018, 192, 500–506. [Google Scholar] [CrossRef]
  9. Holford, K.M.; Eaton, M.J.; Hensman, J.J.; Pullin, R.; Evans, S.L.; Dervilis, N.; Worden, K. A new methodology for automating acoustic emission detection of metallic fatigue fractures in highly demanding aerospace environments: An overview. Prog. Aerosp. Sci. 2017, 90, 1–11. [Google Scholar] [CrossRef]
  10. Gao, F.; Zeng, L.; Lin, J.; Shao, Y. Damage assessment in composite laminates via broadband Lamb wave. Ultrasonics 2018, 86, 49–58. [Google Scholar] [CrossRef]
  11. Kundu, T.; Nakatani, H.; Takeda, N. Acoustic source localization in anisotropic plates. Ultrasonics 2012, 52, 740–746. [Google Scholar] [CrossRef]
  12. Harley, J.B. Predictive Guided Wave Models Through Sparse Modal Representations. Proc. IEEE 2016, 104, 1604–1619. [Google Scholar] [CrossRef]
  13. Liu, C.; Harley, J.B.; Bergés, M.; Greve, D.W.; Oppenheim, I.J. Oppenheim. Robust ultrasonic damage detection under complex environmental conditions using singular value decomposition. Ultrasonics 2015, 58, 75–86. [Google Scholar] [CrossRef] [PubMed]
  14. Yang, J.; Su, Y.; He, Y.; Zhou, P.; Xu, L.; Su, Z. Machine learning-enabled resolution-lossless tomography for composite structures with a restricted sensing capability. Ultrasonics 2022, 125, 106801. [Google Scholar] [CrossRef] [PubMed]
  15. He, J.; Huo, H.; Guan, X.; Yang, J. A Lamb wave quantification model for inclined cracks with experimental validation. Chin. J. Aeronaut. 2021, 34, 601–611. [Google Scholar] [CrossRef]
  16. Gao, F.; Shao, Y.; Hua, J.; Zeng, L.; Lin, J. Enhanced wavefield imaging method for impact damage detection in composite laminates via laser-generated Lamb waves. Measurement 2021, 173, 108639. [Google Scholar] [CrossRef]
  17. Donda, K.; Zhu, Y.; Merkel, A.; Fan, S.-W.; Cao, L.; Wan, S.; Assouar, B. Ultrathin acoustic absorbing metasurface based on deep learning approach. Smart Mater. Struct. 2021, 30, 085003. [Google Scholar] [CrossRef]
  18. Humer, C.; Höll, S.; Kralovec, C.; Schagerl, M. Damage identification using wave damage interaction coefficients predicted by deep neural networks. Ultrasonics 2022, 124, 106743. [Google Scholar] [CrossRef]
  19. Jiang, K.; Han, Q.; Du, X. Lost data neural semantic recovery framework for structural health monitoring based on deep learning. Comput. Aided Civ. Infrastruct. Eng. 2022, 37, 1160–1187. [Google Scholar] [CrossRef]
  20. Liu, G.; Li, L.; Zhang, L.; Li, Q.; Law, S.S. Sensor faults classification for SHM systems using deep learning-based method with Tsfresh features. Smart Mater. Struct. 2020, 29, 075005. [Google Scholar] [CrossRef]
  21. Zhou, L.; Chen, S.-X.; Ni, Y.-Q.; Jiang, L. Pitch-catch UGW-based multiple damage inference: A heterogeneous graph interpretation. Smart Mater. Struct. 2022, 31, 015005. [Google Scholar] [CrossRef]
  22. Ewald, V.; Venkat, R.S.; Asokkumar, A.; Benedictus, R.; Boller, C.; Groves, R.M. Perception modelling by invariant representation of deep learning for automated structural diagnostic in aircraft maintenance: A study case using DeepSHM. Mech. Syst. Signal Process. 2022, 165, 108153. [Google Scholar] [CrossRef]
  23. Qian, C.; Ran, Y.; He, J.; Ren, Y.; Sun, B.; Zhang, W.; Wang, R. Application of artificial neural networks for quantitative damage detection in unidirectional composite structures based on Lamb waves. Adv. Mech. Eng. 2020, 12, 1687814020914732. [Google Scholar] [CrossRef]
  24. Ribeiro, M.G.D.; Kubrusly, A.C.; Ayala, H.V.H. Damage Detection in Composite Plates with Ultrasonic Guided-waves and Nonlinear System Identification. In Proceedings of the 2020 IEEE Symposium Series on Computational Intelligence (SSCI), Canberra, ACT, Australia, 1–4 December 2020. [Google Scholar]
  25. Ziaja, D.; Nazarko, P. SHM system for anomaly detection of bolted joints in engineering structures. Structures 2021, 33, 3877–3884. [Google Scholar] [CrossRef]
  26. Wu, J.; Xu, X.; Liu, C.; Deng, C.; Shao, X. Lamb wave-based damage detection of composite structures using deep convolutional neural network and continuous wavelet transform. Compos. Struct. 2021, 276, 114590. [Google Scholar] [CrossRef]
  27. Zhang, S.; Li, C.M.; Ye, W. Damage localization in plate-like structures using time-varying feature and one-dimensional convolutional neural network. Mech. Syst. Signal Process. 2021, 147, 107107. [Google Scholar] [CrossRef]
  28. Su, C.; Jiang, M.; Lv, S.; Lu, S.; Zhang, L.; Zhang, F.; Sui, Q. Improved Damage Localization and Quantification of CFRP Using Lamb Waves and Convolution Neural Network. IEEE Sens. J. 2019, 19, 5784–5791. [Google Scholar] [CrossRef]
  29. Pandey, P.; Rai, A.; Mitra, M. Explainable 1-D convolutional neural network for damage detection using Lamb wave. Mech. Syst. Signal Process. 2022, 164, 108220. [Google Scholar] [CrossRef]
  30. Rautela, M.; Senthilnath, J.; Moll, J.; Gopalakrishnan, S. Combined two-level damage identification strategy using ultrasonic guided waves and physical knowledge assisted machine learning. Ultrasonics 2021, 115, 106451. [Google Scholar] [CrossRef]
  31. Sattarifar, A.; Nestorović, T. Damage localization and characterization using one-dimensional convolutional neural network and a sparse network of transducers. Eng. Appl. Artif. Intell. 2022, 115, 105273. [Google Scholar] [CrossRef]
  32. Zhang, Y.; Yang, Q. An overview of multi-task learning. Natl. Sci. Rev. 2018, 5, 30–43. [Google Scholar] [CrossRef]
  33. Vandenhende, S.; Georgoulis, S.; Van Gansbeke, W.; Proesmans, M.; Dai, D.; Van Gool, L. Multi-Task Learning for Dense Prediction Tasks: A Survey. IEEE Trans. Pattern Anal. Mach. Intell. 2020, 44, 3614–3633. [Google Scholar] [CrossRef] [PubMed]
  34. Jin, Y.; Hou, L.; Chen, Y.; Lu, Z. An effective crack position diagnosis method for the hollow shaft rotor system based on the convolutional neural network and deep metric learning. Chin. J. Aeronaut. 2022, 35, 242–254. [Google Scholar] [CrossRef]
  35. Xie, J.; Li, Z.; Zhou, Z.; Liu, S. A Novel Bearing Fault Classification Method Based on XGBoost: The Fusion of Deep Learning-Based Features and Empirical Features. IEEE Trans. Instrum. Meas. 2021, 70, 3506709. [Google Scholar] [CrossRef]
Figure 1. General framework of the proposed multi-task 2D-CNN approach.
Applsci 13 10235 g001
Figure 2. Flow chart of the 2D image processing method.
Applsci 13 10235 g002
Figure 3. The structure of multi-task 2D-CNN.
Applsci 13 10235 g003
Figure 4. Schematic layout of test plate and sensor.
Applsci 13 10235 g004
Figure 5. Experimental setup. (a) Experimental instrument; (b) experimental impact.
Applsci 13 10235 g005
Figure 6. Lamb wave signals are received by sensor arrays at different impact energies. (a) Impact damage at location L1; (b) impact damage at location L16.
Applsci 13 10235 g006
Figure 7. Grayscale images of different impact energies at location L1. (a) 0.5 J; (b) 1.0 J; (c) 1.5 J.
Applsci 13 10235 g007
Figure 8. Grayscale images of different impact energies at location L16. (a) 0.5 J; (b) 1.0 J; (c) 1.5 J.
Applsci 13 10235 g008
Figure 9. Loss curve of the multi-task 2D-CNN.
Applsci 13 10235 g009
Figure 10. Accuracy curve of two classification tasks in the training set and validation set. (a) Accuracy curve of location; (b) accuracy curve of energy.
Applsci 13 10235 g010
Figure 11. Visual effect of feature dimensionality reduction via T-SNE. (a) Location classification task before training; (b) location classification task after training; (c) energy classification task before training; (d) energy classification task after training.
Applsci 13 10235 g011
Figure 12. Confusion matrix. (a) Damage location confusion matrix for single-task learning; (b) damage energy confusion matrix for single-task learning; (c) damage location confusion matrix for single-task learning; (d) damage energy confusion matrix for single-task learning.
Applsci 13 10235 g012
Figure 13. Confusion matrix obtained from 50% of the samples. (a) Damage location confusion matrix for single-task learning; (b) damage energy confusion matrix for single-task learning; (c) damage location confusion matrix for single-task learning; (d) damage energy confusion matrix for single-task learning.
Applsci 13 10235 g013
Figure 14. Confusion matrix obtained from 25% of the samples. (a) Damage location confusion matrix for single-task learning; (b) damage energy confusion matrix for single-task learning; (c) damage location confusion matrix for single-task learning; (d) damage energy confusion matrix for single-task learning.
Applsci 13 10235 g014aApplsci 13 10235 g014b
Figure 15. Comparison of accuracy among different numbers of samples.
Applsci 13 10235 g015
Table 1. Mechanical parameters of test steel plate.
ParameterDensityElastic ModulusPoisson Ratio
Value7.93 (g/cm³)195 (GPa)0.247
Table 2. Parameters of the sensor used.
PZT Sensor ModelDiameter (mm)Thickness (mm)Density (g/m3)
PZT-5180.487.80
Table 3. Performance indicators of impact energy classification task.
ModelEnergyPrecision (%)Recall (%)F1-score (%)
Single-task learning0.5 J95.7498.9097.29
1.0 J97.0592.9694.96
1.5 J97.4397.4497.43
Multi-task learning0.5 J95.7910097.85
1.0 J10095.7797.84
1.5 J10098.7199.35
Table 4. Comparison of model training times between single-task and multi-task learning.
Comparison ParametersSingle-Task Learning (Impact Location/Energy)Multi-Task LearningReduction
Training time16.68 s
17.63 s
23.73 s30.83%
Total time34.31 s23.73 s
Table 5. Accuracy comparison of different models.
ModelLocationEnergy
SVM94.79%90.83%
DT93.33%87.08%
RF96.67%94.16%
Single-task learning100%96.67%
Multi-task learning100%98.33%
Table 6. Accuracy decreases of different models with different numbers of samples.
ModelLocation with 50% SamplesLocation with 25% SamplesEnergy with 50% SamplesEnergy with 25% Samples
Single-task learning1.67%1.67%3.34%8.34%
Multi-task learning0.84%1.67%0.83%3.33%
Table 7. Comparison of model training times between single-task and multi-task learning with 50% samples.
Comparison ParametersSingle-Task Learning (Impact Location/Energy)Multi-Task LearningReduction
Training time8.63 s
8.56 s
17.19 s26.64%
Total time12.61 s12.61 s
Table 8. Comparison of model training times between single-task and multi-task learning with 25% samples.
Comparison ParametersSingle-Task Learning (Impact Location/Energy)Multi-Task LearningReduction
Training time4.49 s
4.42 s
8.91 s30.19%
Total time6.22 s6.22 s
Disclaimer/Publisher’s Note: The statements, opinions and data contained in all publications are solely those of the individual author(s) and contributor(s) and not of MDPI and/or the editor(s). MDPI and/or the editor(s) disclaim responsibility for any injury to people or property resulting from any ideas, methods, instructions or products referred to in the content.

