You are currently viewing a new version of our website. To view the old version click .
Applied Sciences
  • Article
  • Open Access

5 September 2023

Disease Severity Index in Parkinson’s Disease Based on Self-Organizing Maps

,
,
,
and
1
Department of Medical Sciences, University of Beira Interior, Rua Marquês de D’Ávila e Bolama, 6201-001 Covilhã, Portugal
2
Department of Electromechanical Engineering, University of Beira Interior, Rua Marquês de D’Ávila e Bolama, 6201-001 Covilhã, Portugal
3
Department of Neurology, Federal University of Piaui, Teresina 64049-550, Brazil
4
C-MAST—Center for Mechanical and Aerospace Science and Technologies, Rua Marquês de D’Ávila e Bolama, 6201-001 Covilhã, Portugal

Abstract

Parkinson’s disease is a progressive neurodegenerative condition whose prevalence has significantly increased. This work proposes the development of a severity index to classify patients from symptoms, mainly motor ones, using an Artificial Neuronal Network (ANN) trained by the Self-Organizing Maps (SOMs) algorithm. The FOX Insight database was used, which offers data in the form of questionnaires answered by patients or caregivers from all over the world, with information regarding this pathology. After pre-processing the data, a set of 597 questionnaires containing 28 defined questions was selected. The symptoms were individually analyzed after mapping and divided into four classes. In class 1, most symptoms were not present. In class 2, the presence of certain symptoms demonstrated early milestones of the disease. In class 3, symptoms related to the patient’s mobility, in particular pain, stand out among the most reported. In class 4, the intense presence of all symptoms is observed. To test the tool, data were used from some of these patients, who answered the same questionnaire at different times (simulating medical appointments). The presented severity index to classify patients allowed identifying the current stage of the disease allowing the follow-up. This AI-based decision-support tool can help medical professionals to predict the evolution of Parkinson’s disease, which can result in longer life quality of patients, in terms of symptoms and medication requirements.

1. Introduction

Parkinson’s disease (PD) is a progressive neurodegenerative condition that impacts the motor system, manifesting in distinctive symptoms such as resting tremor, bradykinesia, muscle rigidity, and impaired postural reflexes. The World Health Organization (WHO) reports that the prevalence of this condition significantly increases with age, affecting 1% of the population over 60 years old and up to 4% of those over 80 years old. This represents a staggering number of more than 8.5 million people worldwide, and the figure is expected to continue growing due to the rising life expectancy of the global population [,].
PD poses numerous challenges, with early diagnosis being particularly crucial. While clinical examinations can aid in disease classification, they often fail to provide precise indications, primarily due to the existence of various PD subtypes. This heterogeneity complicates the clinical framework and early diagnosis, making it difficult to establish a specific and personalized initial treatment, which is essential for enhancing patients’ quality of life [,]. Artificial Neural Networks (ANNs) have gained widespread use in the medical field, showing promising results in diagnosing and classifying various diseases, including Alzheimer’s disease [], cancer [], chronic kidney disease [], tuberculosis [], and many others. Techniques such as Convolutional Neural Networks (CNNs) [], Recurrent Neural Networks (RNNs), and Long Short-Term Memory (LSTM) [] enable rapid processing of large datasets, empowering healthcare professionals to identify patterns and relationships among variables, leading to more effective diagnostic and treatment decisions. Within this context, machine learning techniques have emerged as valuable tools for predicting Parkinson’s disease [], allowing models to learn from data and identify relevant patterns to distinguish between healthy individuals and those with the disease. Classification algorithms such as Support Vector Machines (SVMs) [,] have been particularly instrumental in discriminating between patients with PD and healthy controls based on clinical, imaging, or specific biomarker characteristics.
A promising approach for predicting and detecting Parkinson’s disease (PD) at an early stage involves the use of a machine learning technique known as Self-Organizing Maps (SOMs). These are unsupervised Artificial Neural Networks (ANNs) comprising uni- or bidimensional neurons capable of adjusting their synaptic weights through competitive learning. This enables the SOM to organize patient data into similar groups or clusters without requiring pre-labeled data [,].
In this study, we propose using the SOM in conjunction with a clustering algorithm to develop a severity score for PD, considering not only the neurological aspects that are typically addressed in other scales or indices, but also including symptoms from other organs and systems that play a crucial role in disease staging. By incorporating this comprehensive data analysis, clinicians gain access to accurate information, facilitating informed decision-making for appropriate medical interventions and, in turn, improving the overall quality of life for patients affected by this disease.

2. Materials and Methods

This study is observational, cross-sectional, and descriptive in nature. The primary objective is to develop a PD severity index by observing data from a population exhibiting characteristics of Parkinson’s disease (PD) []. The index is created through individualized analysis of symptoms reported by patients who have not yet received a formal diagnosis from a qualified healthcare professional at the time of data collection.
Data for this study were obtained from the FOX Insight longitudinal database dedicated to researching PD-related health and lifestyle routines []. FOX Insight contains over 53,000 data points in the form of monitors answered by patients or caregivers around the world, providing a wide range of information about motor and non-motor symptoms associated with PD. After data pre-processing, a methodology was used to categorize patients into different classes. The classification maintained all the gains of the modified scale by Hoehn and Yahr [], serving as a reference to maintain the heterogeneity of the results. Three groups of questions were selected, focusing on motor and non-motor symptoms, each with a specific disability. Group 1 consisted of questions related to the patient’s daily life, well-being, and self-care. Group 2 involved questions related to the patient’s mobility and typical activities during the previous week. Group 3 addressed issues related to motricity and self-care, which are related to “permanent disabilities”, where the patient has been living with it for a long time and causes a greater impact on their quality of life, as it is associated with the loss of autonomy of this patient. A detailed presentation of these data is available in Table 1.
Table 1. Presents the description of the questions selected to compose the input data of the ANN, as well as the group to which they correspond.

2.1. Coding of the Data

Group 1 comprises direct questions with binary responses, where participants answered either ‘Yes’ or ‘No’, subsequently coded as 0 for ‘No’ and 1 for ‘Yes’. In group 2, negative responses (‘No’) and affirmative responses with mild or soft intensity were coded as 0, whereas affirmative answers with moderate or severe intensity were coded as 1. For group 3, negative responses (‘No’) and affirmative responses with mild intensity were coded as 0, while affirmative answers with moderate, severe, and very severe intensity were coded as 1. The coding scheme is detailed in Table 2 for reference.
Table 2. Coding of the questions.

2.2. Included and Excluded Data

Initially, a total of 65 questions were carefully selected, based on their alignment with the scientific literature, which identifies these symptoms as significant clinical features present in the disease. Therefore, the included questions are extensively documented in medical literature as indicative of the disease, encompassing various aspects of daily life, such as difficulties in performing movements (right/left side), dressing, washing, and experiences related to both motor and non-motor symptoms (e.g., depression, anxiety). This process resulted in a dataset of 36,000 patients.
Following data pre-processing, which involved excluding questionnaires with incomplete or uncertain answers (e.g., “I prefer not to answer”), only the first available questionnaire from each respondent was retained. This final step yielded 28 pertinent questions and a dataset of 597 patients.

2.3. Selection of the Data Processing Methodology

The Self-Organizing Maps (SOMs) method was selected for this study, which consists of an unsupervised Artificial Neural Network (ANN) composed of uni- or two-dimensional neurons. These neurons can adapt their synaptic weights through a competitive learning process, forming prototypes or clusters with similar data [].
In the context of ANN learning, data are grouped into various categories. The winning neuron is determined based on the assigned input values, which are calculated using the Euclidean distance metric. This distance represents the shortest straight-line path between two points. Once the winning neuron is identified, a neighborhood is defined around it, allowing the winning neuron to interact with neighboring neurons and reinforce synaptic connections, establishing a cooperative network. By reinforcing these synaptic cooperations, the response of the winning neuron improves whenever the network receives patterns like those it was trained on [].
The Self-Organizing Map (SOM) technique groups similar events together. In this study, the elements represent PD-related questions directed at patients diagnosed with the disease or those suspected of having it. SOM functions by transforming high-dimensional information into a two-dimensional representation, creating a mapping from Rn to R2. Initially, a two-dimensional grid of neurons (m × n) was developed. These neurons are activated by the inputs of the neural network and can undergo movement within the grid, causing them to become proximate to each other during training. Each neuron is associated with coordinates in the space provided by the weight vector (W).
To initialize the weights of each neuron, we assign values corresponding to the severity levels generated by the responses to each question in the database. After the creation and initialization of the grid, an event from the database is applied to all neurons. Subsequently, the Euclidean distance between the event and each weight (neuron) in the grid is calculated []. For illustration, Figure 1 presents an example of a two-dimensional map of neurons.
Figure 1. Two-dimensional map.
The winning neuron serves as the center of the neighborhood function radius, which updates the vectors (W) throughout the training of the ANN. As SOM activates different areas of the map corresponding to similar input patterns, it produces a non-linear map based on the provided input information, generating a two-dimensional representation of the achieved neighborhood [].
For this study, a map size of 8 × 6, comprising a total of 48 neurons, was defined. Subsequently, the map was associated with the K-means algorithm to form prototype vectors for the input space and obtain the desired classes []. The unified distance matrix (U-Matrix) generated by the SOM calculates the distance between the weights (Wj) of neuron j and those of neighboring neurons. The result is a visual representation where rhombuses indicate the calculated distances. This proximity is then evaluated on a color scale, where dark colors (black) indicate proximity (i.e., many inputs activated these neurons), and light colors (yellowish) represent greater distance (i.e., few inputs activated these neurons). Figure 2a displays the U-Matrix visualization.
Figure 2. (a) U-Matrix; (b) classes formed by the K-means method.
Following the U-Matrix analysis, the K-means method was employed to create the data classes, as depicted in Figure 2b.
The numbering assigned to the map generated by K-means follows the order of intensity classification defined through individualized symptom analysis. The system randomly selects colors to differentiate one class from another.
The modified Hoehn and Yahr intensity scale is recognized for representing five distinct stages of PD [,]. However, stages 4 and 5 are considered advanced stages of the disease, characterized by severe debilitation and the need for full-time care and assistance. Therefore, for the K-means method, we chose to utilize four classes.
The index categorized patients into four classes based on their severity: class 1 as very mild, class 2 as mild, class 3 as moderate, and class 4 as severe. These severity classes were determined by the intensity of each symptom presented within each class.

3. Results

One study indicated that 75% of PD diagnoses occur in individuals over the age of 60, and the prodromal period of the disease can extend up to 10 years before a definitive diagnosis is made [].
The first step in the analysis involved performing descriptive statistics on the ages of patients within each class. Figure 3 graphically presents the age distribution (in years) of patients for each class, along with the corresponding statistical data. Remarkably, all classes (class 1, class 2, class 3, and class 4) exhibited ages well below the typical onset age reported in the literature for PD.
Figure 3. Descriptive statistics of the ages of the patients made up from the database.
Class 1 displayed the youngest patients, with a minimum age of 44 years, followed by class 2 with 45 years, class 3 with 43 years, and class 4 with 39 years. Additionally, class 1 had the lowest maximum age at 80 years, followed by class 3 with 86 years, class 2 with 87 years, and class 4 with 93 years.
Regarding the average age, class 1 had an average of 65 years, while both class 2 and class 3 had an average of 66 years, and class 4 had an average of 71 years. Classes 1, 2, and 3 displayed similar age dispersion, whereas class 4 demonstrated greater variability, with a standard deviation of 10 years. Figure 3 provides a visual representation of these data.

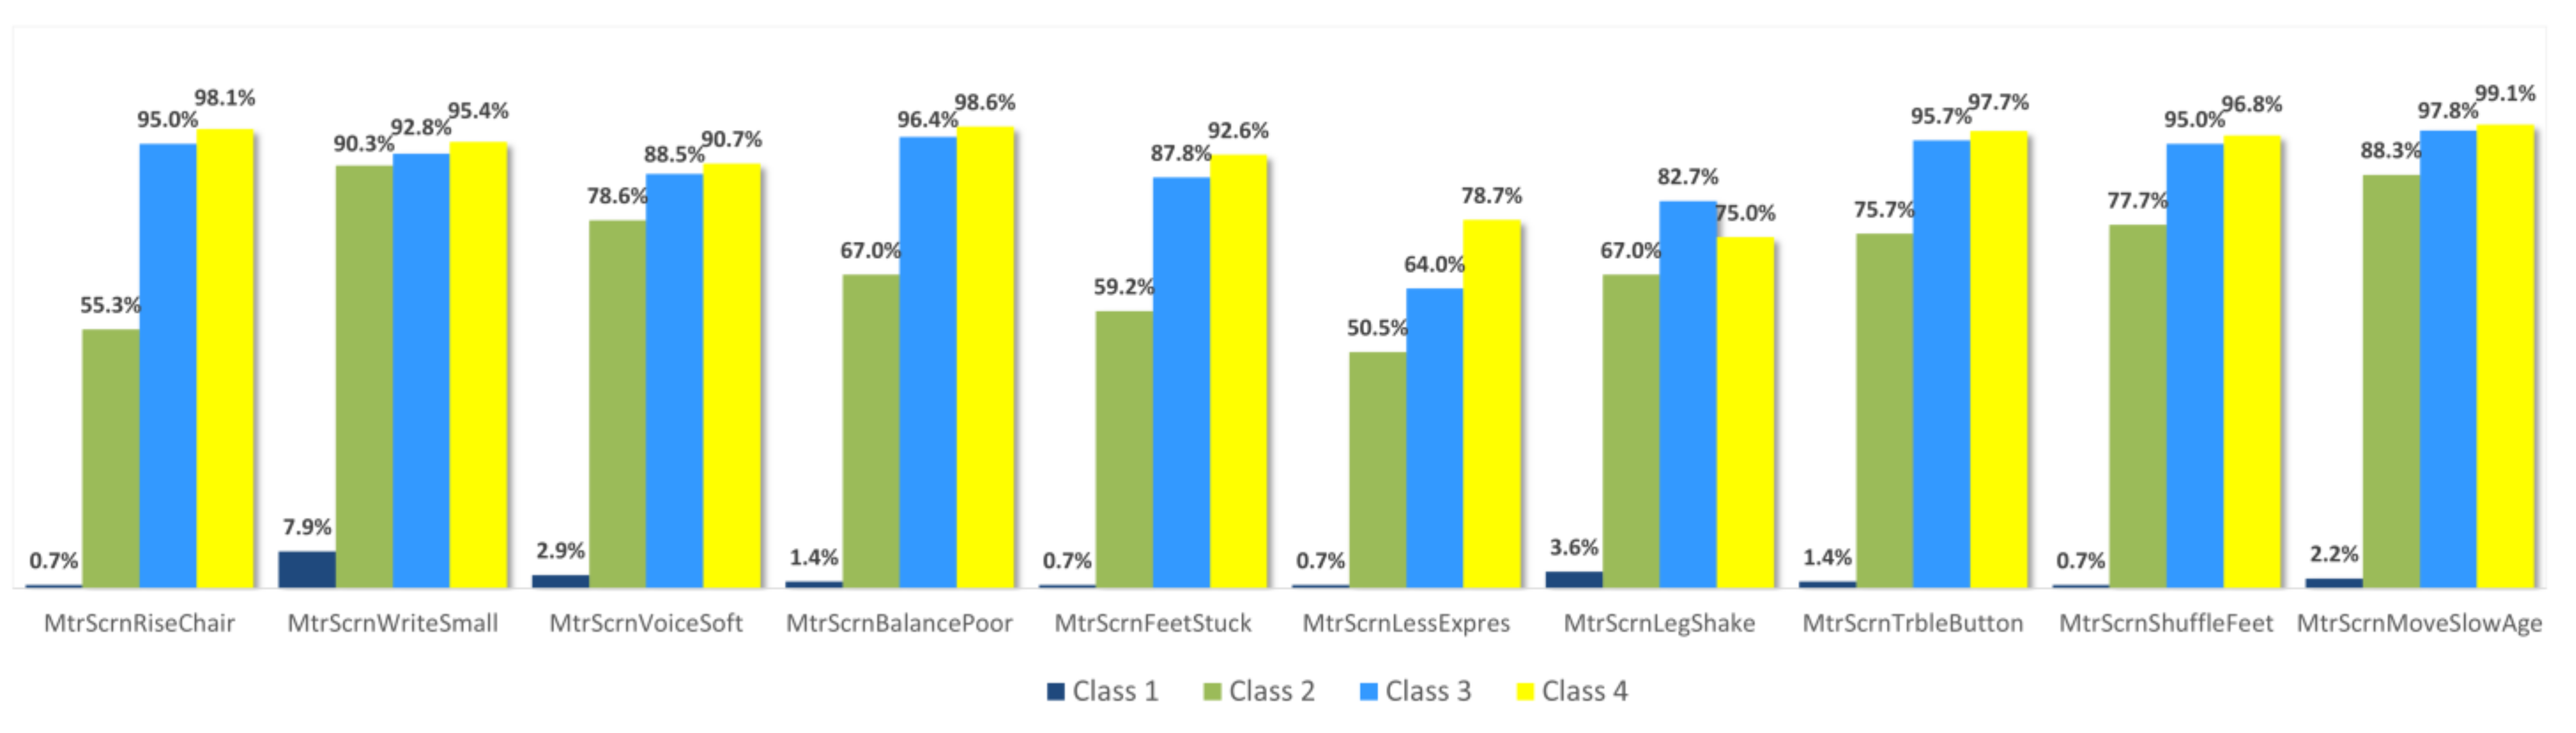
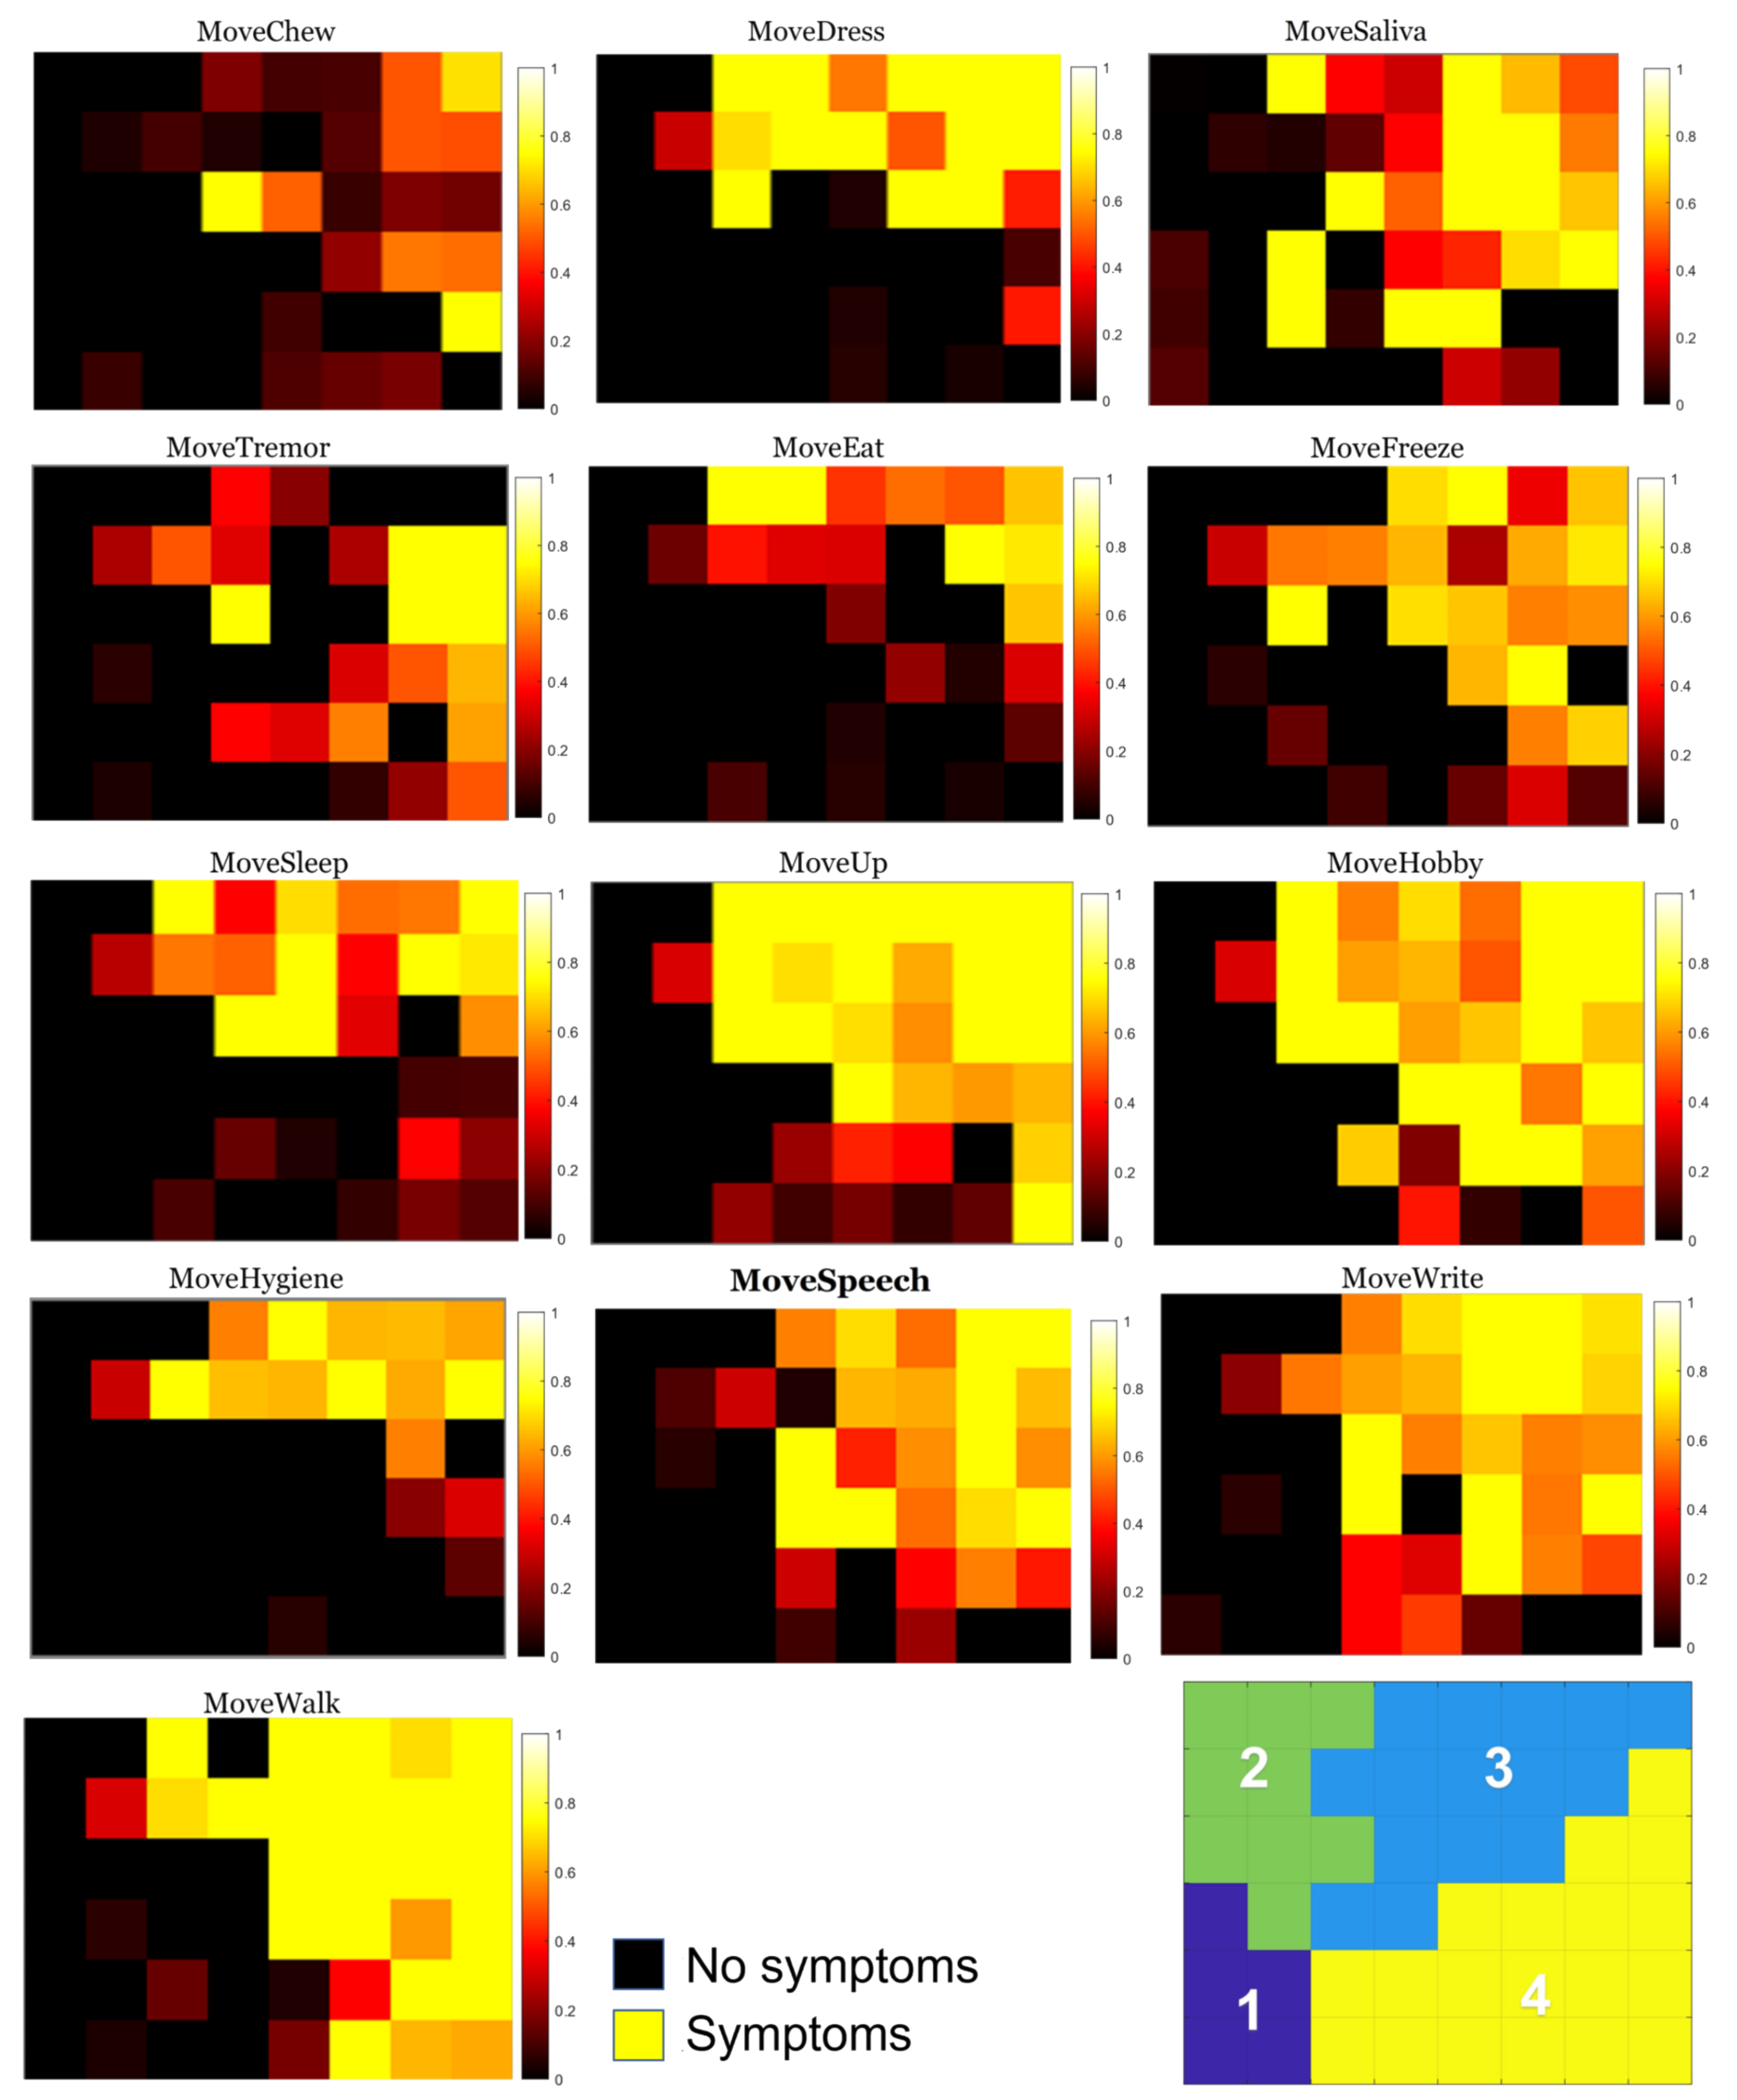
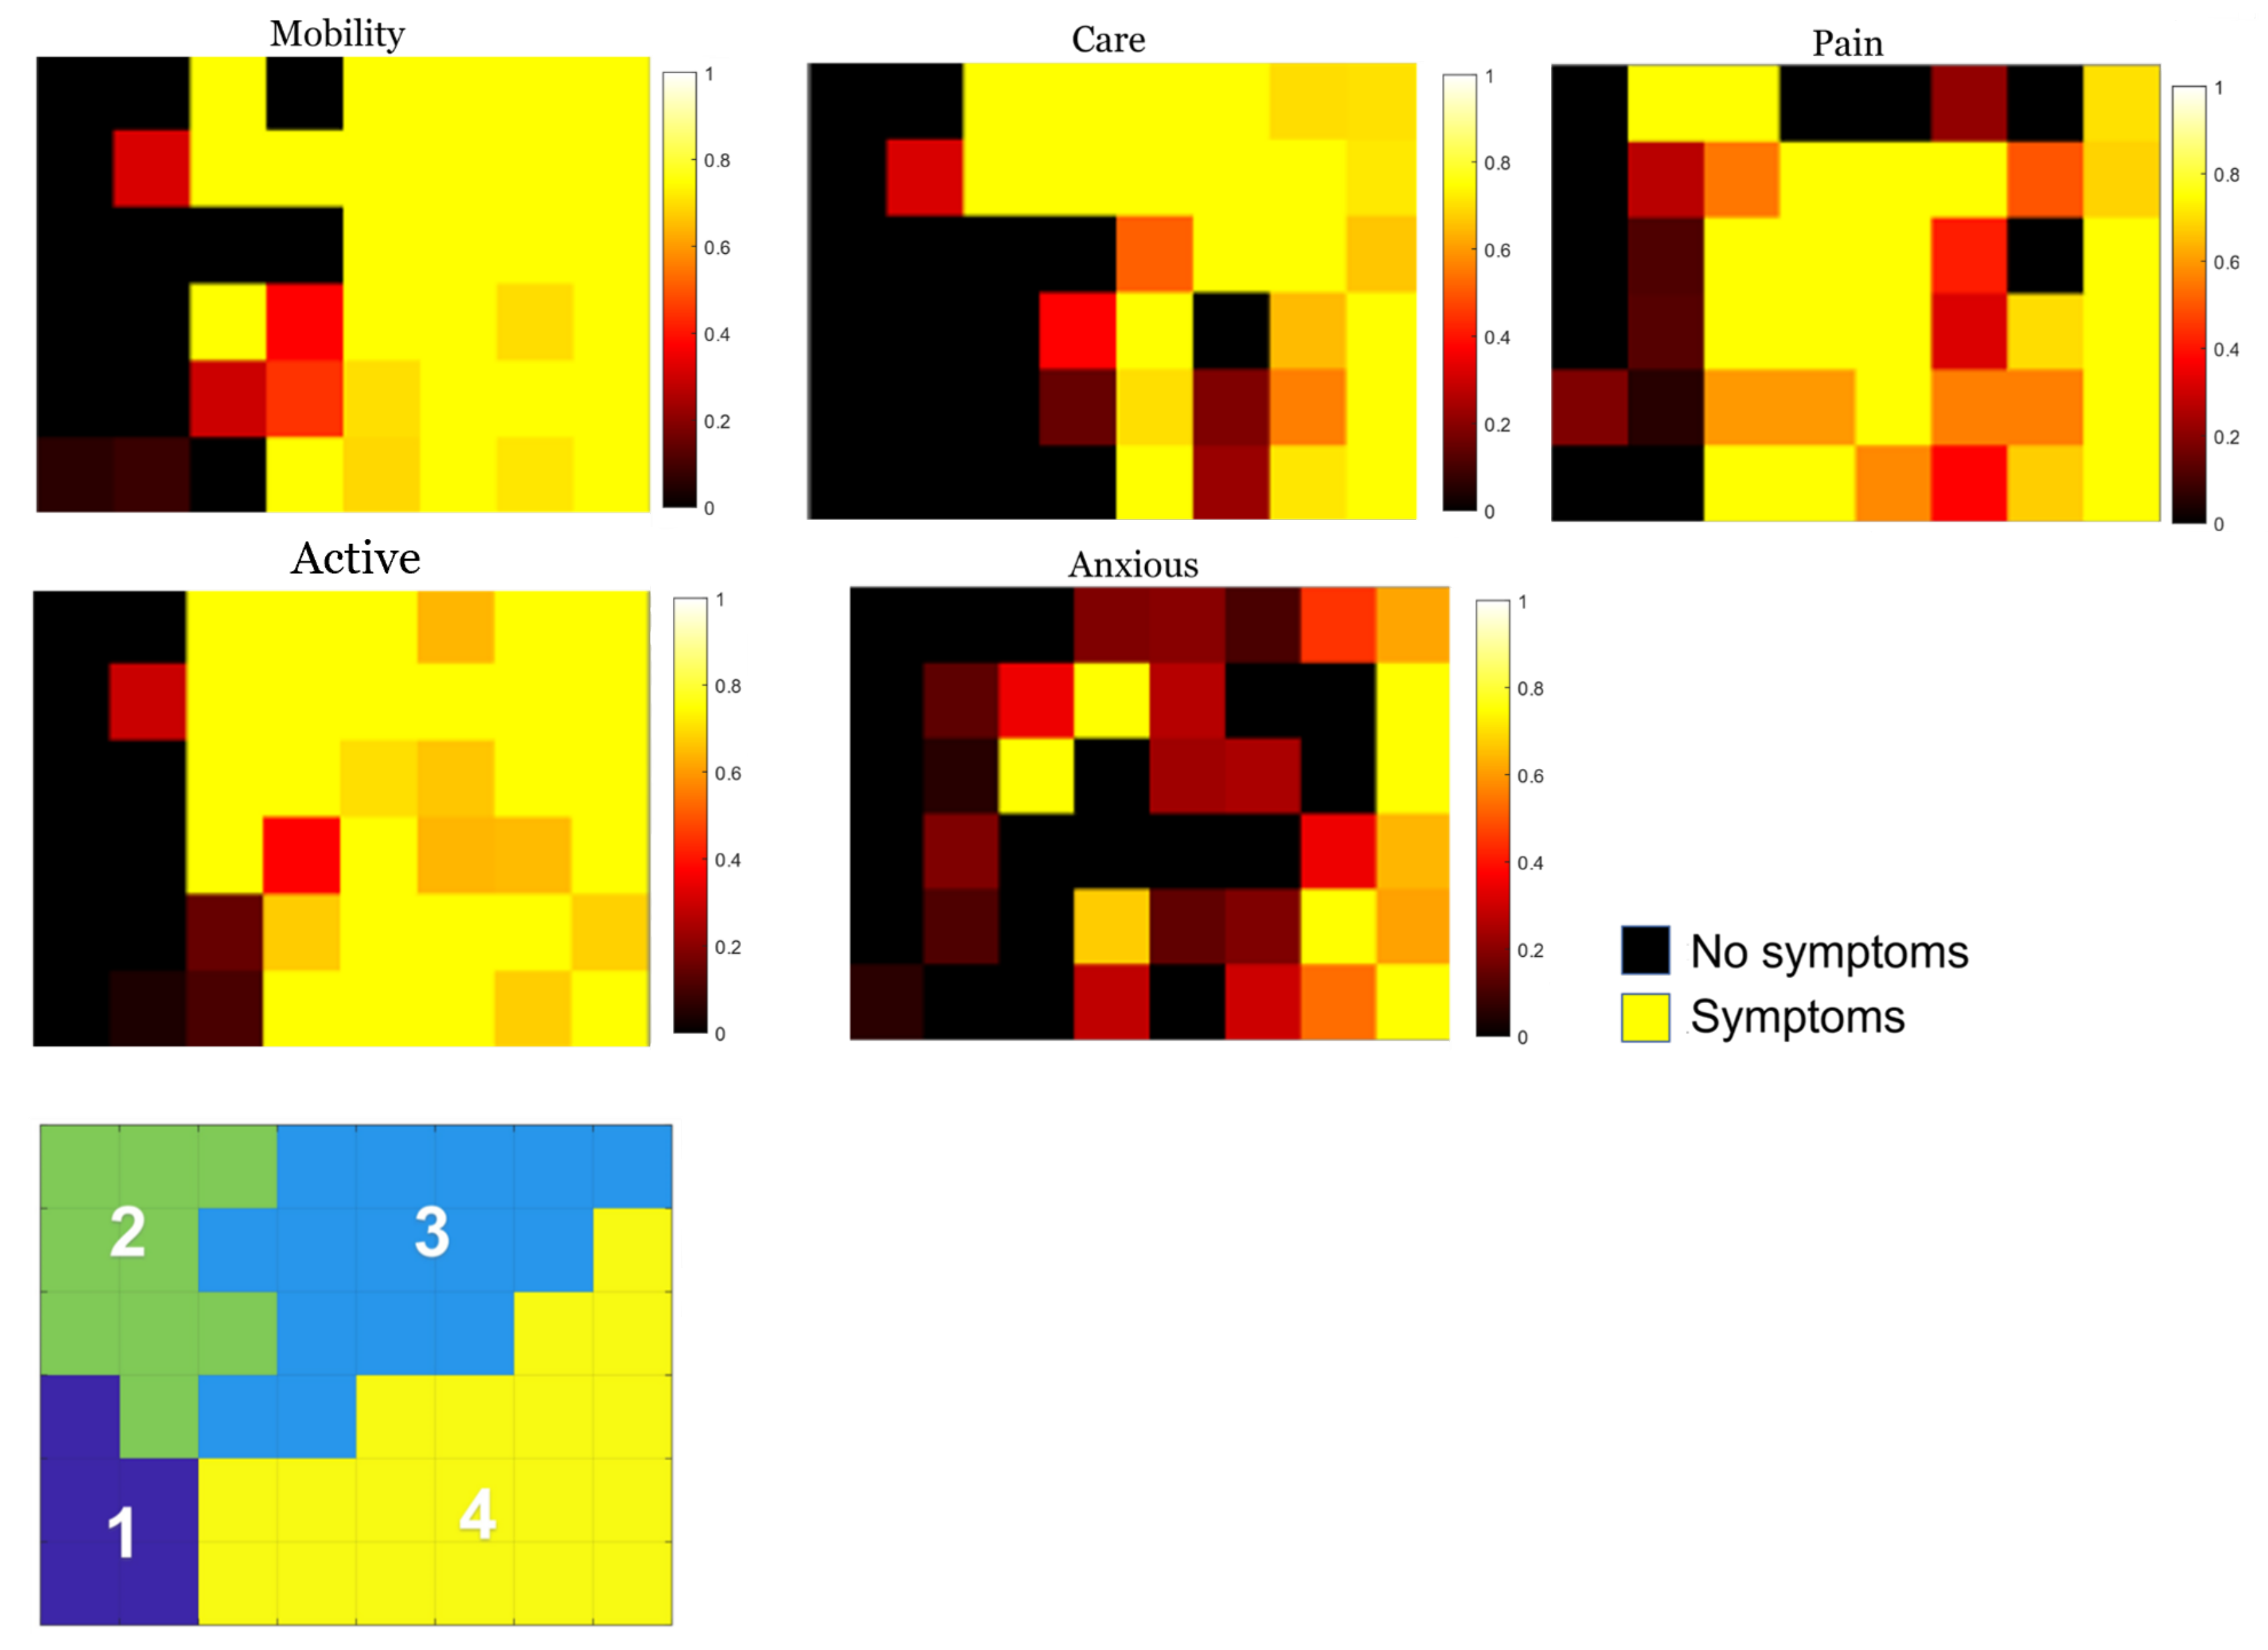
3.1. Individual Symptom Analysis

The entire study consisted of 28 questions. These questions are divided into three groups: group 1 (ten questions); group 2 (thirteen questions); group 3 (five questions). All groups of symptoms were distributed by the ANN in a severity index that was distributed in four existing classes.
In the analysis of group 1, symptoms related to events from the patient’s daily life will be presented. These symptoms do not necessarily indicate limitations but rather serve as indicators of the onset of PD symptoms. Figure 4 illustrates the image of the symptoms generated by SOM, where lighter colors represent the presence of symptoms, and darker colors indicate their absence. The figures revealed a higher prevalence of signaling intensity in classes 3 and 4, with relatively fewer class 1 and 2 neurons activated, thereby maintaining a predominance of signaling in the moderate (class 3) and severe (class 4) categories. For a more comprehensive understanding and data analysis, Figure 4 also displays these symptoms alongside the cluster image generated by the K-means algorithm.
Figure 4. Group 1 symptoms referring to the patient’s daily life, well-being, and self-care.
Figure 5 displays the four classes belonging to group 1. In class 1, it is evident that less than 1% of the patients exhibit limitations in their independence, and this is not strongly related to the symptoms addressed by the presented question. Moving on to class 2, there is a noticeable increase in positive responses to the presented symptoms, with percentages exceeding 51% for some symptoms, and reaching 90% for the characteristic of decreased handwriting in patients. As expected, classes 3 and 4 appear to be more severe, as the symptoms in these classes are more closely associated with the patient’s limitations. In most symptoms, these classes present higher percentages, hovering around 82%, and reaching as high as 98% for some symptoms in class 4. This class notably includes symptoms related to the loss of personal mobility and difficulties in self-care.
Figure 5. Percentage of the presence of group 1 symptoms by class.
In group 2, symptoms are presented based on the daily difficulties faced by the patients in the last seven days, with their intensity corresponding to the classification generated by each individual. This classification consists of four categories: “No” for the absence of difficulties, “Mild” for mild difficulties without the need for external help, “Moderate” for difficulties requiring support, and “Severe” for difficulties requiring constant assistance from another person. Figure 6 illustrates the indicators associated with group 2, showcasing neuronal activation in several classes, particularly highlighting the exacerbation of symptoms in classes 3 and 4 within this group.
Figure 6. Group 2 symptoms referring to the patients’ locomotion, and their usual activities in the last.
Notably, the presence of indicators in other classes is observed. This situation arises because, even though symptoms are related to a specific class, their intensity may vary depending on the severity of the disease. Figure 6 demonstrates this behavior, depicting markers that signify the intention of signaling for each class regarding a specific symptom in group 2, such as changes in speech, which can be regarded as an early marker of PD. Even in the early stages of the disease, vocal timbre variations can be identified through computational analysis when compared to data from individuals without the disease. Changes in speech may not be detectable by the patient, necessitating an acoustic analysis test for accurate diagnosis []. It is estimated that over 90% of PD patients exhibit signs of speech production and language alterations (dysprosody), as well as other speech difficulties such as hoarseness, decreased speech volume (dysphonia), and dysarthria, which result from impairments in the central or peripheral nervous system [].
Figure 6 shows the symptoms related to the accumulation of saliva or difficulty swallowing in classes 1 and 2 of the disease. However, these symptoms become more pronounced in classes 3 and 4, corresponding to the more advanced stages where the patient’s autonomy is reduced. Similarly, symptoms related to mobility demonstrate that the patient’s independence is a crucial factor affecting their quality of life. While there is little signaling of independence-related symptoms in classes 1 and 2, there is a substantial presence in classes 3 and 4, indicating the significant impact on the lives of people with PD.
In group 3, the symptoms are closely linked to the patient’s motricity and autonomy. Analyzing the symptoms based on the reported degrees of severity, it is evident that the weight of these issues directly influences their personal lives. The severity of symptoms is correlated with the limitations experienced by patients when answering the questionnaire, and the activities they can perform significantly impact their daily lives. Consequently, these factors are carefully considered in determining the “weight” of the chosen answers.
In its advanced stage, PD leads to impairment of motor functions, with muscle stiffness, tremors, and bradykinesia becoming more constant. In addition, the patient’s cognitive functions may be affected, resulting in an increased risk of falls, injuries, and increased risk of mortality [].
Correlated with symptoms related to self-care and mobility difficulties, motor symptoms significantly impact independence and the absence of primary and individual care for patients with PD. Classes 1 and 2 do not have significant reports of patients with these limitations, while classes 3 and 4 have more severe PD symptoms, with a greater presence of these limitations. This pattern indicates that the severity of these symptoms tends to increase as the disease progresses.
In the early stages of PD, patients may experience signs and symptoms of depression. In later stages, these signs may manifest as individual episodes of various neuropsychiatric disorders or comorbidities (e.g., apathy superimposed on cognitive impairment, depression accompanied by impulse disorders, or psychosis). Depression usually appears early in the disease, but being a neuropsychiatric symptom, it can be identified at any stage of PD [].

3.2. Validation of Results

A results validation process was carried out to validate the reliability of the ANN predictions. The data set was divided into training, validation, and test sets. This procedure aims to provide a model that generalizes predictions to new data, ensuring its reliability and applicability in research.
For the validation process of the results, 27 patients and a total of 199 complete data available on the platform were used. Among these patients, two were selected, which will be addressed later, to exemplify the validation. At this time, the periodicity of the responses offered was maintained, unlike what happened at the time of database training and data filtering. Subsequent questionnaires were maintained to map the evolution of the classes of these patients and verify the training achieved by the neural network. Figure 7 describes the organization of the ANN map. It also shows the location of each symptom in its class. Finally, the classes are shown by colors, as generated by the K-means algorithm: blue corresponds to class 1, green to class 2, light blue to class 3, and yellow to class 4.
Figure 7. Group 3 symptoms related to motricity and patient autonomy.
The ANN was constituted of a total of 48 neurons (see Figure 8), established by the choice and observation of the classifiers generated, each with its activations belonging to a dominant class, generated according to the activation and approximation obtained through the neuron. Validation tests were performed.
Figure 8. This figure represents the organization of the ANN ap and the location of symptoms in the severity classes of Parkinson’s disease, highlighting the arrangement of neurons that represent the symptoms associated with the pathology.
In Figure 9, the path taken by patient 1 on the map is observed. Initially, at the age of 61 years and 8 months, he was already classified with a severe severity index (class 4). In a second screening, approximately 1 year later, he showed a decline in the evolution of his condition and was classified with a moderate severity index (class 3). After 5 months, the severity index returned to the initial stage (class 4), having activated the same initial map neuron. At 63 years and 8 months, the patient was still in class 4, but with activation of a neuron further away from class 3. The brief regression of the disease from class 4 to class 3 may be due to poorly reported symptoms or even early medication use.
Figure 9. Path of patient 1 on the Parkinson’s disease severity map. It is possible to visualize the course of the disease over time. This longitudinal analysis of the data reveals important information about the disease.
Figure 10 shows the validation test for patient 2. His first classification of severity considered the activation of the class 4 neuron. After approximately 6 months, the patient shows a regression in the disease picture when he activates the class 3 neuron 11. After 5 months, when he answers a new questionnaire, even when signaling a distant neuron, he remains in the same class 3. After 6 months, when he answers the questionnaire again, he activates class 4 again. This patient shows a regression in the disease very simply in a short period and returns to signaling class 4, which may have occurred due to the use of medication, causing a significant temporary improvement.
Figure 10. Validation test for patient 2 on the Parkinson’s disease severity map. The image illustrates the validation test performed for patient 2, showing the severity rating over time.

4. Conclusions

The objective of this study was to develop a severity index for Parkinson’s Disease (PD) using an Artificial Neural Network. Despite utilizing a database not specifically tailored for this study, it was possible to validate the path of severity and disease progression based on the selected data.
The index categorized patients into four classes based on their severity: class 1 as very mild, class 2 as mild, class 3 as moderate, and class 4 as severe. These severity classes were determined not by the type of symptom but rather by the intensity of each symptom presented within each class. Interestingly, symptoms in group 3 exhibited the widest range of existing disease severity levels, indicating that this group may require special attention and consideration as a determining factor.
Non-motor symptoms of PD, particularly anxiety and depression, have emerged as significant indicators in the pursuit of early diagnosis. Two such symptoms are included in this group. One notable advantage of this severity scale is its practicality, as it automatically transforms various inputs into an illustrative index (depicted as an image). Qualified medical professionals can visually assess the geographic positions of neuron signaling on the map, observe their neighborhood relationships, and trace the paths traveled in each questionnaire. By doing so, clinicians can evaluate disease progression, and based on this evaluation, define appropriate medication requirements to enhance the patient’s quality of life.

Author Contributions

Conceptualization, S.M.A. and B.G.M.; methodology, S.M.A., S.B.M.N., B.G.M. and K.J.A.; software, S.M.A. and B.G.M.; validation, B.G.M., K.J.A. and P.D.G.; formal analysis, B.G.M., K.J.A. and P.D.G.; investigation, S.M.A., S.B.M.N. and B.G.M.; data curation, S.M.A., S.B.M.N., B.G.M. and K.J.A.; writing—original draft preparation, S.M.A., S.B.M.N. and B.G.M.; writing—review and editing, B.G.M., K.J.A. and P.D.G.; supervision, B.G.M. and P.D.G. All authors have read and agreed to the published version of the manuscript.

Funding

The authors would like to express their gratitude to Fundação para a Ciência e Tecnologia (FCT) and C-MAST (Centre for Mechanical and Aerospace Science and Technologies) for their support in the form of funding, under the project UIDB/00151/2020.

Institutional Review Board Statement

Not applicable.

Data Availability Statement

No new data were created or analyzed in this study. Data sharing is not applicable to this article.

Conflicts of Interest

The authors declare no conflict of interest.

References

  1. World Health Organization (WHO). Parkinson Disease. Available online: https://www.who.int/news-room/fact-sheets/detail/parkinson-disease (accessed on 1 July 2023).
  2. Seppi, K.; Ray Chaudhuri, K.; Coelho, M.; Fox, S.H.; Katzenschlager, R.; Perez Lloret, S.; Weintraub, D.; Sampaio, C.; Chahine, L.; Hametner, E.; et al. Update on treatments for nonmotor symptoms of Parkinson’s disease—An evidence-based medicine review. Mov. Disord. 2019, 34, 180–198. [Google Scholar] [CrossRef] [PubMed]
  3. Sivanandy, P.; Leey, T.C.; Xiang, T.C.; Ling, T.C.; Wey Han, S.A.; Semilan, S.L.A.; Hong, P.K. Systematic Review on Parkinson’s Disease Medications, Emphasizing on Three Recently Approved Drugs to Control Parkinson’s Symptoms. Int. J. Environ. Res. Public Health 2021, 19, 364. [Google Scholar] [CrossRef] [PubMed]
  4. The Lancet. Parkinson’s disease: A complex disease revisited. Lancet 2017, 390, 430. [Google Scholar] [CrossRef]
  5. Abbas, S.Q.; Chi, L.; Chen, Y.-P.P. Transformed Domain Convolutional Neural Network for Alzheimer’s Disease Diagnosis using Structural MRI. Pattern Recognit. 2022, 133, 109031. [Google Scholar] [CrossRef]
  6. Alenezi, F.; Armghan, A.; Polat, K. A multi-stage melanoma recognition framework with deep residual neural network and hyperparameter optimization-based decision support in dermoscopy images. Expert Syst. Appl. 2023, 215, 119352. [Google Scholar] [CrossRef]
  7. Singh, V.; Asari, V.K.; Rajasekaran, R. A Deep Neural Network for Early Detection and Prediction of Chronic Kidney Disease. Diagnostics 2022, 12, 116. [Google Scholar] [CrossRef] [PubMed]
  8. Luo, Y.; Tang, G.; Yuan, X.; Lin, Q.; Mao, L.; Song, H.; Xue, Y.; Wu, S.; Ouyang, R.; Hou, H.; et al. Combination of Blood Routine Examination and T-SPOT.TB Assay for Distinguishing Between Active Tuberculosis and Latent Tuberculosis Infection. Front. Cell. Infect. Microbiol. 2021, 11, 575650. [Google Scholar] [CrossRef] [PubMed]
  9. Mian, T.S. An Unsupervised Neural Network Feature Selection and 1D Convolution Neural Network Classification for Screening of Parkinsonism. Diagnostics 2022, 12, 1796. [Google Scholar] [CrossRef] [PubMed]
  10. Bhavekar, G.S.; Goswami, A.D. A hybrid model for heart disease prediction using recurrent neural network and long short term memory. Int. J. Inf. Technol. 2022, 14, 1781–1789. [Google Scholar] [CrossRef]
  11. Trabassi, D.; Serrao, M.; Varrecchia, T.; Ranavolo, A.; Coppola, G.; De Icco, R.; Tassorelli, C.; Castiglia, S.F. Machine Learning Approach to Support the Detection of Parkinson’s Disease in IMU-Based Gait Analysis. Gait Posture 2022, 97, 15–16. [Google Scholar] [CrossRef]
  12. Ai, L.; Wang, J.; Yao, R. Classification of parkinsonian and essential tremor using empirical mode decomposition and support vector machine. Digit. Signal Process. 2011, 21, 543–550. [Google Scholar] [CrossRef]
  13. Loconsole, C.; Cascarano, G.D.; Brunetti, A.; Trotta, G.F.; Losavio, G.; Bevilacqua, V.; Di Sciascio, E. A model-free technique based on computer vision and sEMG for classification in Parkinson’s disease by using computer-assisted handwriting analysis. Pattern Recognit. Lett. 2019, 121, 28–36. [Google Scholar] [CrossRef]
  14. Kohonen, T. Self-Organizing Maps; Springer: Berlin/Heidelberg, Germany, 2001. [Google Scholar] [CrossRef]
  15. Novis, S.; Machado, F.; Costa, V.B.; Foguel, D.; Cruz, M.W.; de Seixas, J.M. Applying an artificial neural network model for developing a severity score for patients with hereditary amyloid polyneuropathy. Amyloid 2017, 24, 153–161. [Google Scholar] [CrossRef] [PubMed]
  16. Wang, X.; Cheng, Z. Cross-Sectional Studies. Chest 2020, 158, S65–S71. [Google Scholar] [CrossRef] [PubMed]
  17. Bock, M.A.; Brown, E.G.; Zhang, L.; Tanner, C. Association of Motor and Nonmotor Symptoms With Health-Related Quality of Life in a Large Online Cohort of People With Parkinson Disease. Neurology 2022, 98, e2194–e2203. [Google Scholar] [CrossRef] [PubMed]
  18. White, D.R.; Speller, R.; Morgan, T.J.; Showalter, C.K.; Shope, T.B.; Rothenberg, L.N.; Pentlow, K.S. A SURVEY OF 20 CT SYSTEMS. J. Comput. Assist. Tomogr. 1979, 3, 573. [Google Scholar] [CrossRef]
  19. Łuczak, M. Hierarchical clustering of time series data with parametric derivative dynamic time warping. Expert Syst. Appl. 2016, 62, 116–130. [Google Scholar] [CrossRef]
  20. Haykin, S. Redes Neurais—Principios E Prática; Bookman: 2003. Available online: https://books.google.co.jp/books?hl=zh-CN&lr=&id=bhMwDwAAQBAJ&oi=fnd&pg=PP1&dq=Redes+Neurais%E2%80%94PriPrincip+E+Pr%C3%A1tica&ots=08zoPPPQNs&sig=aqvY-GdlV85uZSru8I4V9LRL5ec&redir_esc=y#v=onepage&q=Redes%20NNeurai%E2%80%94Principios%20E%20Pr%C3%A1tica&f=false (accessed on 3 July 2023).
  21. Victor Coelho Cascão, L. Modelos De Inteligencia Computacional Para Apoio À Triagem De Pacientes E Diagnostico Clinico De Tuberculose Pulmonar. Master’s Thesis, Universidade Federal do Rio de Janeiro, Rio de Janeiro, Brazil, 2011. Available online: http://pee.ufrj.br/teses/textocompleto/2011101801.pdf (accessed on 16 May 2023).
  22. Jayanth Krishnan, K.; Mitra, K. A Modified Kohonen Map Algorithm for Clustering Time Series Data. Expert Syst. Appl. 2022, 201, 117249. [Google Scholar] [CrossRef]
  23. Bloem, B.R.; Okun, M.S.; Klein, C. Parkinson’s disease. Lancet 2021, 397, 2284–2303. [Google Scholar] [CrossRef]
  24. Weintraub, D.; Aarsland, D.; Chaudhuri, K.R.; Dobkin, R.D.; Leentjens, A.F.; Rodriguez-Violante, M.; Schrag, A. The neuropsychiatry of Parkinson’s disease: Advances and challenges. Lancet Neurol. 2022, 21, 89–102. [Google Scholar] [CrossRef] [PubMed]
  25. Ali, L.; Zhu, C.; Zhang, Z.; Liu, Y. Automated Detection of Parkinson’s Disease Based on Multiple Types of Sustained Phonations Using Linear Discriminant Analysis and Genetically Optimized Neural Network. IEEE J. Transl. Eng. Health Med. 2019, 7, 1–10. [Google Scholar] [CrossRef] [PubMed]
  26. Berus, L.; Klancnik, S.; Brezocnik, M.; Ficko, M. Classifying Parkinson’s Disease Based on Acoustic Measures Using Artificial Neural Networks. Sensors 2018, 19, 16. [Google Scholar] [CrossRef] [PubMed]
  27. Wolff, A.; Schumacher, N.U.; Pürner, D.; Machetanz, G.; Demleitner, A.F.; Feneberg, E.; Hagemeier, M.; Lingor, P. Parkinson’s disease therapy: What lies ahead? J. Neural Transm. 2023, 130, 793–820. [Google Scholar] [CrossRef] [PubMed]
Disclaimer/Publisher’s Note: The statements, opinions and data contained in all publications are solely those of the individual author(s) and contributor(s) and not of MDPI and/or the editor(s). MDPI and/or the editor(s) disclaim responsibility for any injury to people or property resulting from any ideas, methods, instructions or products referred to in the content.

Article Metrics

Citations

Article Access Statistics

Multiple requests from the same IP address are counted as one view.