Article

Characterization of Chemical Composition and Antioxidant Activity of Eucalyptus globulus Leaves under Different Extraction Conditions

1
Department of Pharmaceutical Engineering, Institute of Agricultural and Life Science (IALS), Anti-Aging Bio Cell Factory Regional Leading Research Center (ABC-RLRC), Gyeongsang National University, Jinju 52725, Republic of Korea
2
Division of Applied Life Science (BK21 Four), Institute of Agricultural and Life Science (IALS), Anti-Aging Bio Cell Factory Regional Leading Research Center (ABC-RLRC), Gyeongsang National University, Jinju 52828, Republic of Korea
*
Author to whom correspondence should be addressed.
Appl. Sci. 2023, 13(17), 9984; https://doi.org/10.3390/app13179984
Submission received: 19 August 2023 / Revised: 1 September 2023 / Accepted: 2 September 2023 / Published: 4 September 2023
(This article belongs to the Section Chemical and Molecular Sciences)

Abstract

:
Eucalyptus globulus leaves contain various types of phenolic metabolites related to their antioxidant effects such as acids, catechin, flavonoids, and others. To optimize its antioxidative phenolic contents, E. globulus was extracted under various solvent conditions using 0, 10, 30, 50, 70, 90, and 100% ethanol. The 50% ethanol extract possessed the highest content of total phenolics with 497.7 mg GAE (gallic acid equivalent)/g extract. In contrast, the highest content of total flavonoids was evaluated in the 100% ethanol extract, having 169.3 mg QE (quercetin equivalent)/g extract. The antioxidant activity of various extraction conditions was assessed against the radical scavenging effect of DPPH (SC50 = 188.2~5841.7 μg/mL) and ABTS (SC50 = 14.2~171.3 μg/mL). The major chemical composition of E. globulus leaves was identified as including salicylic acid β-D-glucuronide (1), chlorogenic acid (2), epicatechin (3), 2″-O-galloylhyperin (4), isoquercitrin (5), isorhapontin (6), quercitrin (7), and quercetin-3-O-glucuronide (8) using LC-Q-TOF/MS analysis. Among them, the identified metabolites were clarified and their contents in the extracts were calculated via quantitative analysis using HPLC at 254 nm. The flavonoids (4, 5, 7, and 8) were determined to have an influence on the TPC, TFC, and antioxidant activity of E. globulus leaves. The results suggested that optimizing the extraction conditions can result in appropriate chemical composition and antioxidant activity.

1. Introduction

Eucalyptus globulus, commonly known as southern blue gum or blue gum, is a species of evergreen tree in the family Myrtaceae. E. globulus is widely distributed in regions with a Mediterranean climate, such as Australia, North America, and Europe, for various commercial usages [1,2]. The leaves of E. globulus are used to obtain an essential oil that can reduce respiratory symptoms associated with coughs, colds, and congestion; it also helps relieve muscle and joint pain when applied topically [3,4]. The essential oil obtained from the leaves contains several volatile compounds including terpenoids like cineole, pinene limonene, and aromadendrene [5,6]. As well as these volatile compounds, it contains various phenolics including chlorogenic acid, gallic acid, ferulic acid, ellagic acid, catechins, flavonoids, and others [7,8]. Some studies have found that Eucalyptus phenolics possess antioxidant, anti-inflammatory, and antimicrobial properties. Furthermore, Eucalyptus phenolics have neuroprotective effects and could be effective in preventing or delaying the onset of Alzheimer’s disease [9,10]. Overall, Eucalyptus phenolics possess various bioactivities and have potential applications in several industries, including as pharmaceuticals, cosmetics, and food [11,12].
In the body’s normal cellular metabolism, the production of reactive oxygen species (ROS) and other molecules can lead to oxidative stress [13,14]. However, the human body has several mechanisms to counteract oxidative stress and prevent damage to cells and tissues. There are several enzymatic pathways involving the reaction of superoxide anion (O2•−) to produce water and oxygen, including the superoxide dismutase (SOD) enzyme, catalase, and glutathione peroxidase [15,16], but the imbalance between the accumulation of ROS and the ability of a biological system to detoxify reactive intermediates leads to damaged proteins, nucleic acids, and lipids, and causes numerous diseases including cancer, insulin resistance, diabetes mellitus, cardiovascular diseases, atherosclerosis, Alzheimer’s, and Parkinson’s [17,18]. To prevent these oxidative procedures, antioxidants play an essential role in neutralizing the oxidative stress and damage caused by free radicals in human health by protecting cells and tissues [19,20]. Some of the representative antioxidants are known as phenolics, types of phytochemicals that consist of a cyclic benzene ring with a hydroxyl group attached to it in the chemical structure [21,22]. The benzene ring has a unique structure stabilized by resonance of the delocalized pi electrons in the structure. Due to these properties, phenolics play an important role in antioxidant effects by donating their electrons [23,24,25]. Phenolics have an appropriate polarity to be extracted using organic solvents available for nutraceuticals, functional foods, and cosmetics [26,27].
This study focused on the phenolic metabolites of E. globulus leaves optimized via solvent extraction using water and ethanol ratios. Total phenolic and flavonoid contents of extracts were assessed using the equivalents of gallic acid and quercetin, respectively. The radical scavenging effect of E. globulus leaves was also evaluated using DPPH and ABTS. Furthermore, the phenolics were identified using LC-Q-TOF/MS to select the most effective metabolite in the extract for the application of quantitative analysis to the different solvent extractions.

2. Materials and Methods

2.1. Plant Material and Chemicals

E. globulus leaves were collected from the local farm (Haman-gun, Republic of Korea). Gallic acid, quercetin, dimethyl sulfoxide, and Folin-Ciocalteu’s phenol reagent were purchased from Sigma Aldrich (St. Louis, MO, USA). Sodium carbonate, sodium nitrite, and aluminum nitrate were purchased from Daejung chemicals (Daejeon, Republic of Korea). For the quantitative analysis, identified authentic samples such as salicylic acid β-D-O-glucuronide (Toronto research chemicals Lnc., Toronto, ON, Canada), chlorogenic acid (ALFA AESAR, Ward Hill, MA, USA), epicatechin, quercitrin (Sigma Aldrich), quercetin-3-O-glucuronide, and 2″-O-galloylhyperin (Wuhan ChemFaces Biochemical Co., Ltd., Wuhan, China) were used. HPLC-grade water, ethanol, and acetonitrile from Fisher (Fisher Scientific Korea Ltd., Waltham, MA, USA) were used. All standards were extra-pure analytical grade.

2.2. Preparation of E. globulus Extracts

The collected E. globulus leaves (500 g) were dried in the shade for a week to remove moisture, then ground to obtain 42 g of powder. One gram of each sample was mixed with 0, 10, 30, 50, 70, 90, and 100% ethanol (10 mL) and sonicated for 3 h at room temperature. All extracts (1 mL) were directly filtered using a 0.2 μm syringe filter for HPLC and LC-Q-TOF/MS analysis. Except for the analyzed sample, all samples were evaporated and diluted with DMSO at a concentration of 20,000 μg/mL for TPC, TFC, and radical scavenging effect measurement. All the extractions were repeated five times.

2.3. Total Phenolic Content (TPC)

A TPC assay of each extract was carried out using the Folin-Ciocalteu method with gallic acid equivalent [28]. Gallic acid for the standard curve was prepared with DMSO at a concentration of 1000 μg/mL diluted two-fold stepwise until 31.25 μg/mL. An amount of 10 μL of each extract or gallic acid, 70 μL distilled water, and 20 μL of Folin-Ciocalteu’s phenol reagent were mixed and placed in the dark for 5 min. After the reaction, 100 μL of sodium carbonate (20%, w/v) was added and the mixture was incubated for 30 min. The reaction mixture for TPC was measured at 730 nm. The TPC was indicated as mg of gallic acid equivalents per 100 g of sample (mg GAE/100 g).

2.4. Total Flavonoid Content

A TFC assay was performed by slightly modifying the aluminum chloride colorimetric method [29]. Quercetin, as a calibration standard of TFC, was diluted with DMSO at a concentration of 50 μg/mL to prepare 40, 30, 20, and 10 μg/mL. Briefly, 120 μL of each extract or quercetin was mixed with 40 μL sodium nitrate (5%, w/v) and reacted for 6 min. A total of 10 μL of aluminum nitrate (10%, w/v) and 65 μL of distilled water were added. The mixture was incubated in the dark for 15 min and measured at 412 nm. The TFC was expressed as mg of quercetin equivalents per 100 g of sample (mg QE/100 g). All absorbance was measured using an iD3 spectrophotometer (Molecular devices, Sanjose, CA, USA).

2.5. DPPH Radical Scavenging Activity

The DPPH radical scavenging activity assay was conducted as described in a previous study [30]. Each extract condition was prepared from a stock solution ranging from 20,000 to 195.3 μg/mL by two-fold dilution. The DPPH radical solution was also prepared at 0.15 mM using ethanol immediately before the assay. Firstly, the E. globulus leaf extracts by concentrations (10 μL) and DPPH radical solution (190 μL) were placed onto a 96-well plate. The mixture was incubated for 30 min in the dark at room temperature. After the reaction, the mixture was measured at 517 nm to monitor the DPPH radical scavenging effects.

2.6. ABTS Radical Scavenging Activity

The ABTS radical scavenging activity was measured using the generated cation radical decolorization method [31]. Each different extract of E. globulus leaves was prepared in the same manner as for the DPPH assay (195.3~20,000 μg/mL). ABTS radical solution in water (7.5 mM) and 2.5 mM potassium persulfate were mixed and reacted to generate ABTS radicals for 18 h in the dark at 4 °C. The radical solution and the different extracts were placed onto a 96-well plate and incubated for 10 min. The mixture was measured at 715 nm to observe the decolorization of the ABTS radicals.

2.7. Qualitative Analysis of Metabolites Using Q-TOF/MS

E. globulus ethanol extracts (1 g/10 mL) were filtered using a 0.2 μm syringe filter and injected into a Poroshell 120 EC-C18 column (2.1 × 100 mm, 2.7 μm, Agilent, Santa Clara, CA, USA). The LC-Q-TOF/MS was a Shimadzu NEXERA LC (Kyoto, Japan) connected to a SCIEX X500R QTOF (Framingham, MA, USA). As the mobile phase, water containing 0.1% acetic acid (A) and acetonitrile (B) was used at a flow rate of 1 mL/min. For the solvent conditions, a gradient solvent system that constantly increased the proportion of mobile phase B from 0% to 100% over 60 min was used. The MS conditions were set at a capillary voltage of 5.5 kV and temperature of 450 °C in positive ionization mode. The collision energy was 10 V and the desolvation gas flow was 800 L/h. The turbo spray ionization was conducted under the following conditions: ion spray voltage, 5500 V; source temperature, 550 °C; curtain gas (N2) flow, 30 psi. The MS/MS data was set in a range from 100 to 10,000 Da in the mode of IDA-dependent. The identification of each peak on the BPI gram was performed using SCIEX OS V1.5 software.

2.8. Quantitative Analysis of Representative Metabolites Using HPLC

An HPLC (Agilent Technologies 1260 infinity, Santa Clara, CA, USA) was equipped with an autosampler, binary pump, and diode array detector for quantitative analysis. E. globulus extract was subjected to an analytical column (XBridge C18, 4.6 × 150 mm, 5 μm, Waters, Milford, MA, USA). The mobile phase procedures for the gradient solvent system using solvent A (water containing 0.1% acetic acid) and solvent B (acetonitrile) were carried out as follows: 0–5 min, 0% B; 6–20 min, 20% B; 20–40 min, 50% B; 40–60 min, 100% B with a flow rate of 1 mL/min. The detector wavelength was recorded at 254 nm. For the quantitative analysis of the principal metabolites (salicylic acid β-D-O-glucuronide, chlorogenic acid, epicatechin, 2″-O-galloylhyperin, isoquercitrin, isorhapontin, quercitrin, and quercetin-3-O-glucuronide), a calibration curve (R2 > 0.998) was derived from the concentrations (0–100 μg/mL) of all the individual standards by comparing the peak areas in the E. globulus extracts.

2.9. Statistical Analysis

All experiments were repeated thrice and data was analyzed using Sigma Plot (Version 10.0). Values were recognized to be significant when the p-value was less than 0.05.

3. Results and Discussion

3.1. Total Phenolic and Flavonoid Contents

In phytochemicals, phenolic compounds have the most antioxidative potential for oxidative reaction quenching by donating their electrons to the radicals [32,33,34]. TPC is determined by measuring the absorbance of the sample compared with gallic acid, which is commonly used as a standard compound typically [35].
As shown in Table 1, the highest and similar TPC values were exhibited in the 10, 30, 50, and 70% ethanol extracts with 422.0, 492.7, 497.7, and 448.5 GAE mg/g extract, respectively. The next highest TPC was in the 90% ethanol extract with 384.5 GAE mg/g extract. The 100% ethanol extract showed a TPC of 273.2 GAE mg/g extract. The lowest TPC value was estimated in the 0% ethanol extract. The TPC values of the 0 to 100% ethanol extraction conditions steadily increased until the 50% ethanol condition. Then, the TPC values decreased, confirming the lowest TPC value in the 100% ethanol condition. Among the extraction conditions of E. globulus leaves, the significantly polar (0% ethanol) or non-polar (100% ethanol) extractions were confirmed to have relatively low TPC values compared with the extractions using ethanol and water in comparable proportions (30, 50, and 70% ethanol).
Flavonoids generally belonging to phenolic compounds are secondary metabolites well known for their related antioxidant abilities [21]. The TFC values differed from those of the TPC of E. globulus leaf extraction conditions. The TFC values exhibited a higher aspect as the ratio of relatively non-polar solvent to ethanol increased. The order of TFC values according to the ethanol portions of 0, 10, 30, 50, 70, 90, and 100% was observed as follows; 32.5, 32.7, 40.4, 41.2, 66.5, 156.5, and 169.3 mg QE/g extract, respectively. Between the 0 and 50% ethanol extraction conditions, TFC values ranged from 32.5 to 41.2 mg QE/g extract, with similar values. The 70% ethanol extract showed a value of 66.5 mg QE/g extract, about 1.5-fold higher than the 0, 10, 30, and 50% ethanol conditions. Moreover, the highest TFC values were confirmed at 90% and 100% ethanol conditions with 156.5 and 169.3 mg QE/g extract. Overall, the results indicated that the optimum conditions for TPC and TFC differed depending on the extract solvent; TPC optimum conditions were 10~70% ethanol conditions (422.0~497.7 mg GAE/g extract), while TFC optimum conditions were the 90 and 100% ethanol conditions (156.5 and 169.3 mg QE/g extract). The best extract conditions showed at a moderate polarity for TPC and were non-polar for TFC.

3.2. DPPH and ABTS Radical Scavenging Effects

The DPPH and ABTS assays are commonly used to measure antioxidant capacity. The main differences between the two assays are their reaction mechanisms and type of radicals [36]. The radical reaction occurs as a single electron transfer (SET) to DPPH and a proton-coupled electron transfer (PCET) to ABTS. The radical type is primarily DPPH in solvents and ABTS in aqueous solutions known as sequential proton loss electron transfer (SPLET) [37].
Thus, the antioxidant ability of E. globulus leaves under different ethanol conditions was evaluated using their quenching potential against DPPH and ABTS radicals. As shown in Table 2, the highest antioxidative condition against DPPH radicals was 30% ethanol with 188.2 μg/mL of SC50 value, followed by 10%, 50%, and 70% ethanol conditions having SC50 values of 357.9, 505.3, and 509.3 μg/mL, respectively. Among the extraction conditions, relatively extreme polar or non-polar conditions showed more than 1000 μg/mL of SC50 value to exhibit little antioxidant ability. Specifically, these values were 5841.7 (0% ethanol), 1008.4 (90% ethanol), and 1304.7 μg/mL (100% ethanol). On the other hand, the ABTS radical scavenging activity assay displayed generally better results than the DPPH assay. It suggested that the antioxidant efficacy of E. globulus leaf extracts was via the PCET scavenging mechanism. Like the DPPH assay, the best antioxidant efficacy was confirmed under 30% and 50% ethanol extraction conditions with SC50 values of 14.2 and 18.0 μg/mL. In the following order, the antioxidant capacities were observed having 23.1, 20.8, and 24.8 μg/mL of SC50 values under 10%, 70%, and 90% ethanol conditions, respectively. The 0% and 100% ethanol extracts were found to be the least active with SC50 values of 171.3 and 34.9 μg/mL, respectively. Their lower potential confirmed the limit of radical scavenging effects under these conditions. Through these results, it was confirmed that E. globulus leaves exhibited more effective antioxidant ability when using a proper combination of water and ethanol than when using only water or ethanol for extraction. The results suggested that a combination of extract solvents was essential to maximize the antioxidant potential relatively.

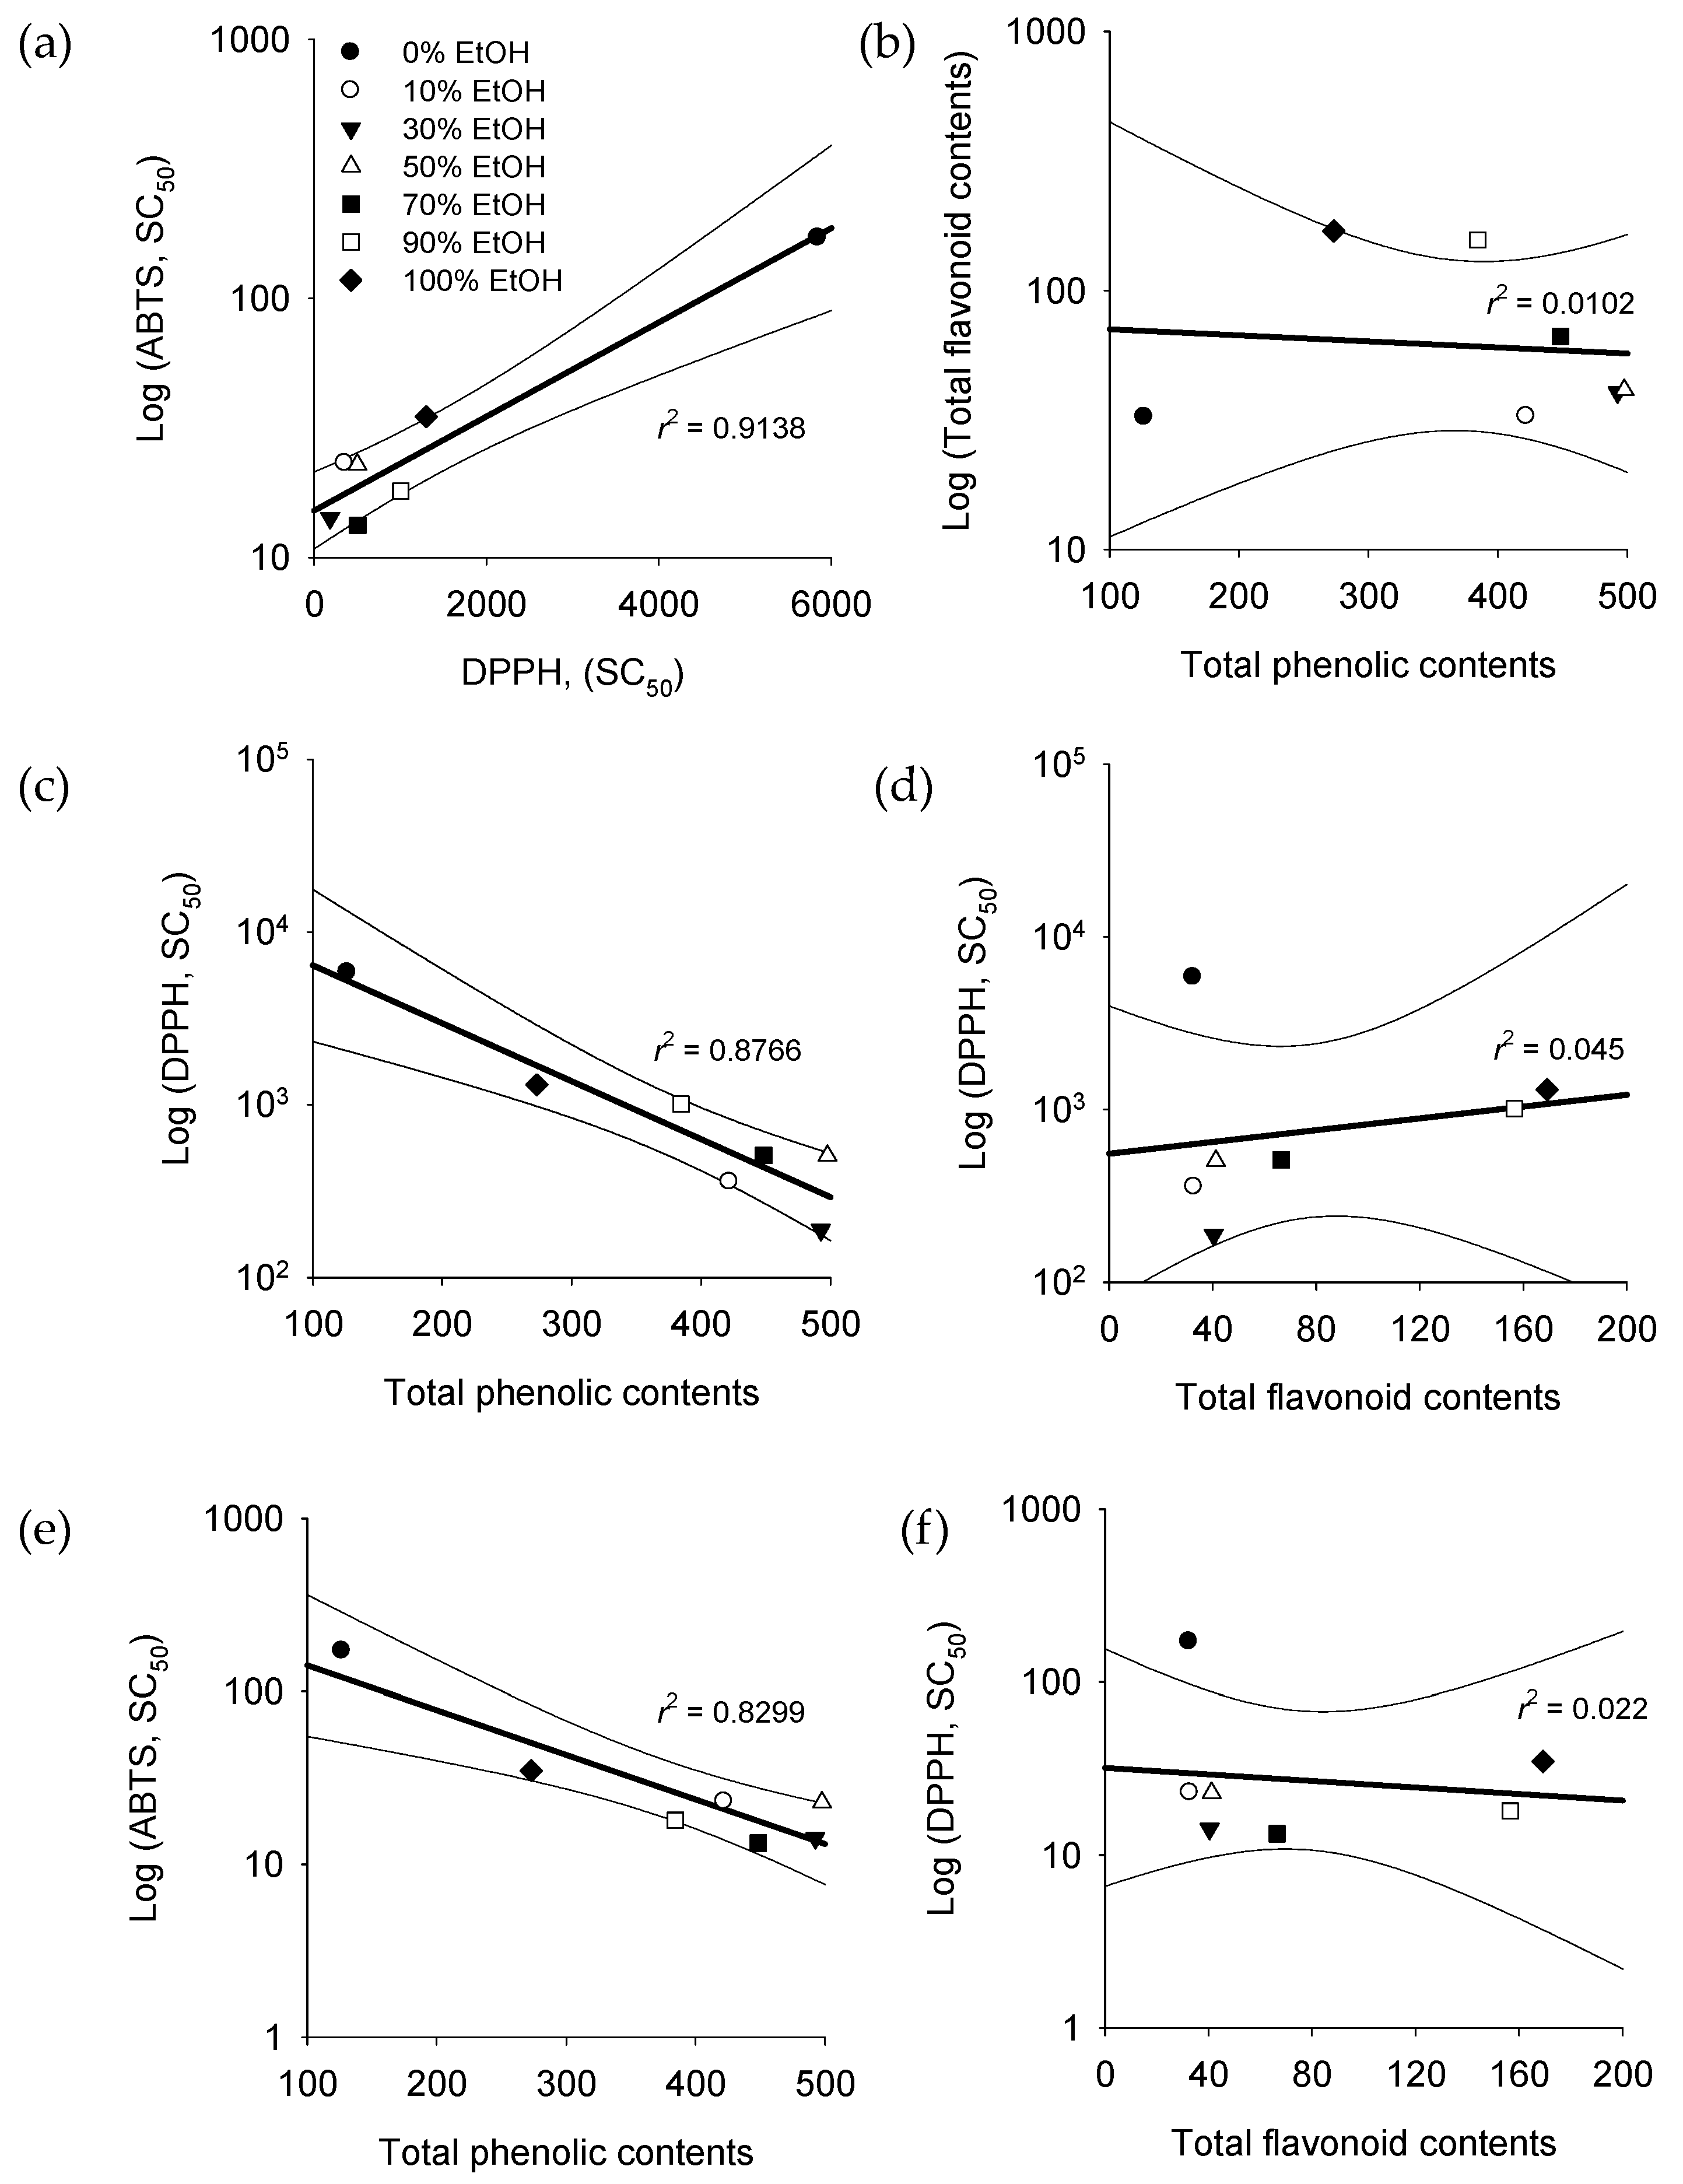
3.3. Correlations between TPC, TFC, DPPH, and ABTS

The correlations between TPC, TFC, DPPH, and ABTS interacted with each other according to the proposed results. As shown in Figure 1, higher correlations are observed with R2 values that are close to 1. According to the extraction conditions, the highest correlation (R2 = 0.9138) was found between the two radical scavenging effects (DPPH and ABTS) (Figure 1a). On the other hand, the correlation (R2 = 0.0102) was difficult to find between the TPC and TFC (Figure 1b). As shown in Figure 1c–f, DPPH and ABTS radical scavenging abilities showed a high correlation, with 0.8766 and 0.8299 R2 values, respectively, whereas there was no correlation with TPC (R2 < 0.05).

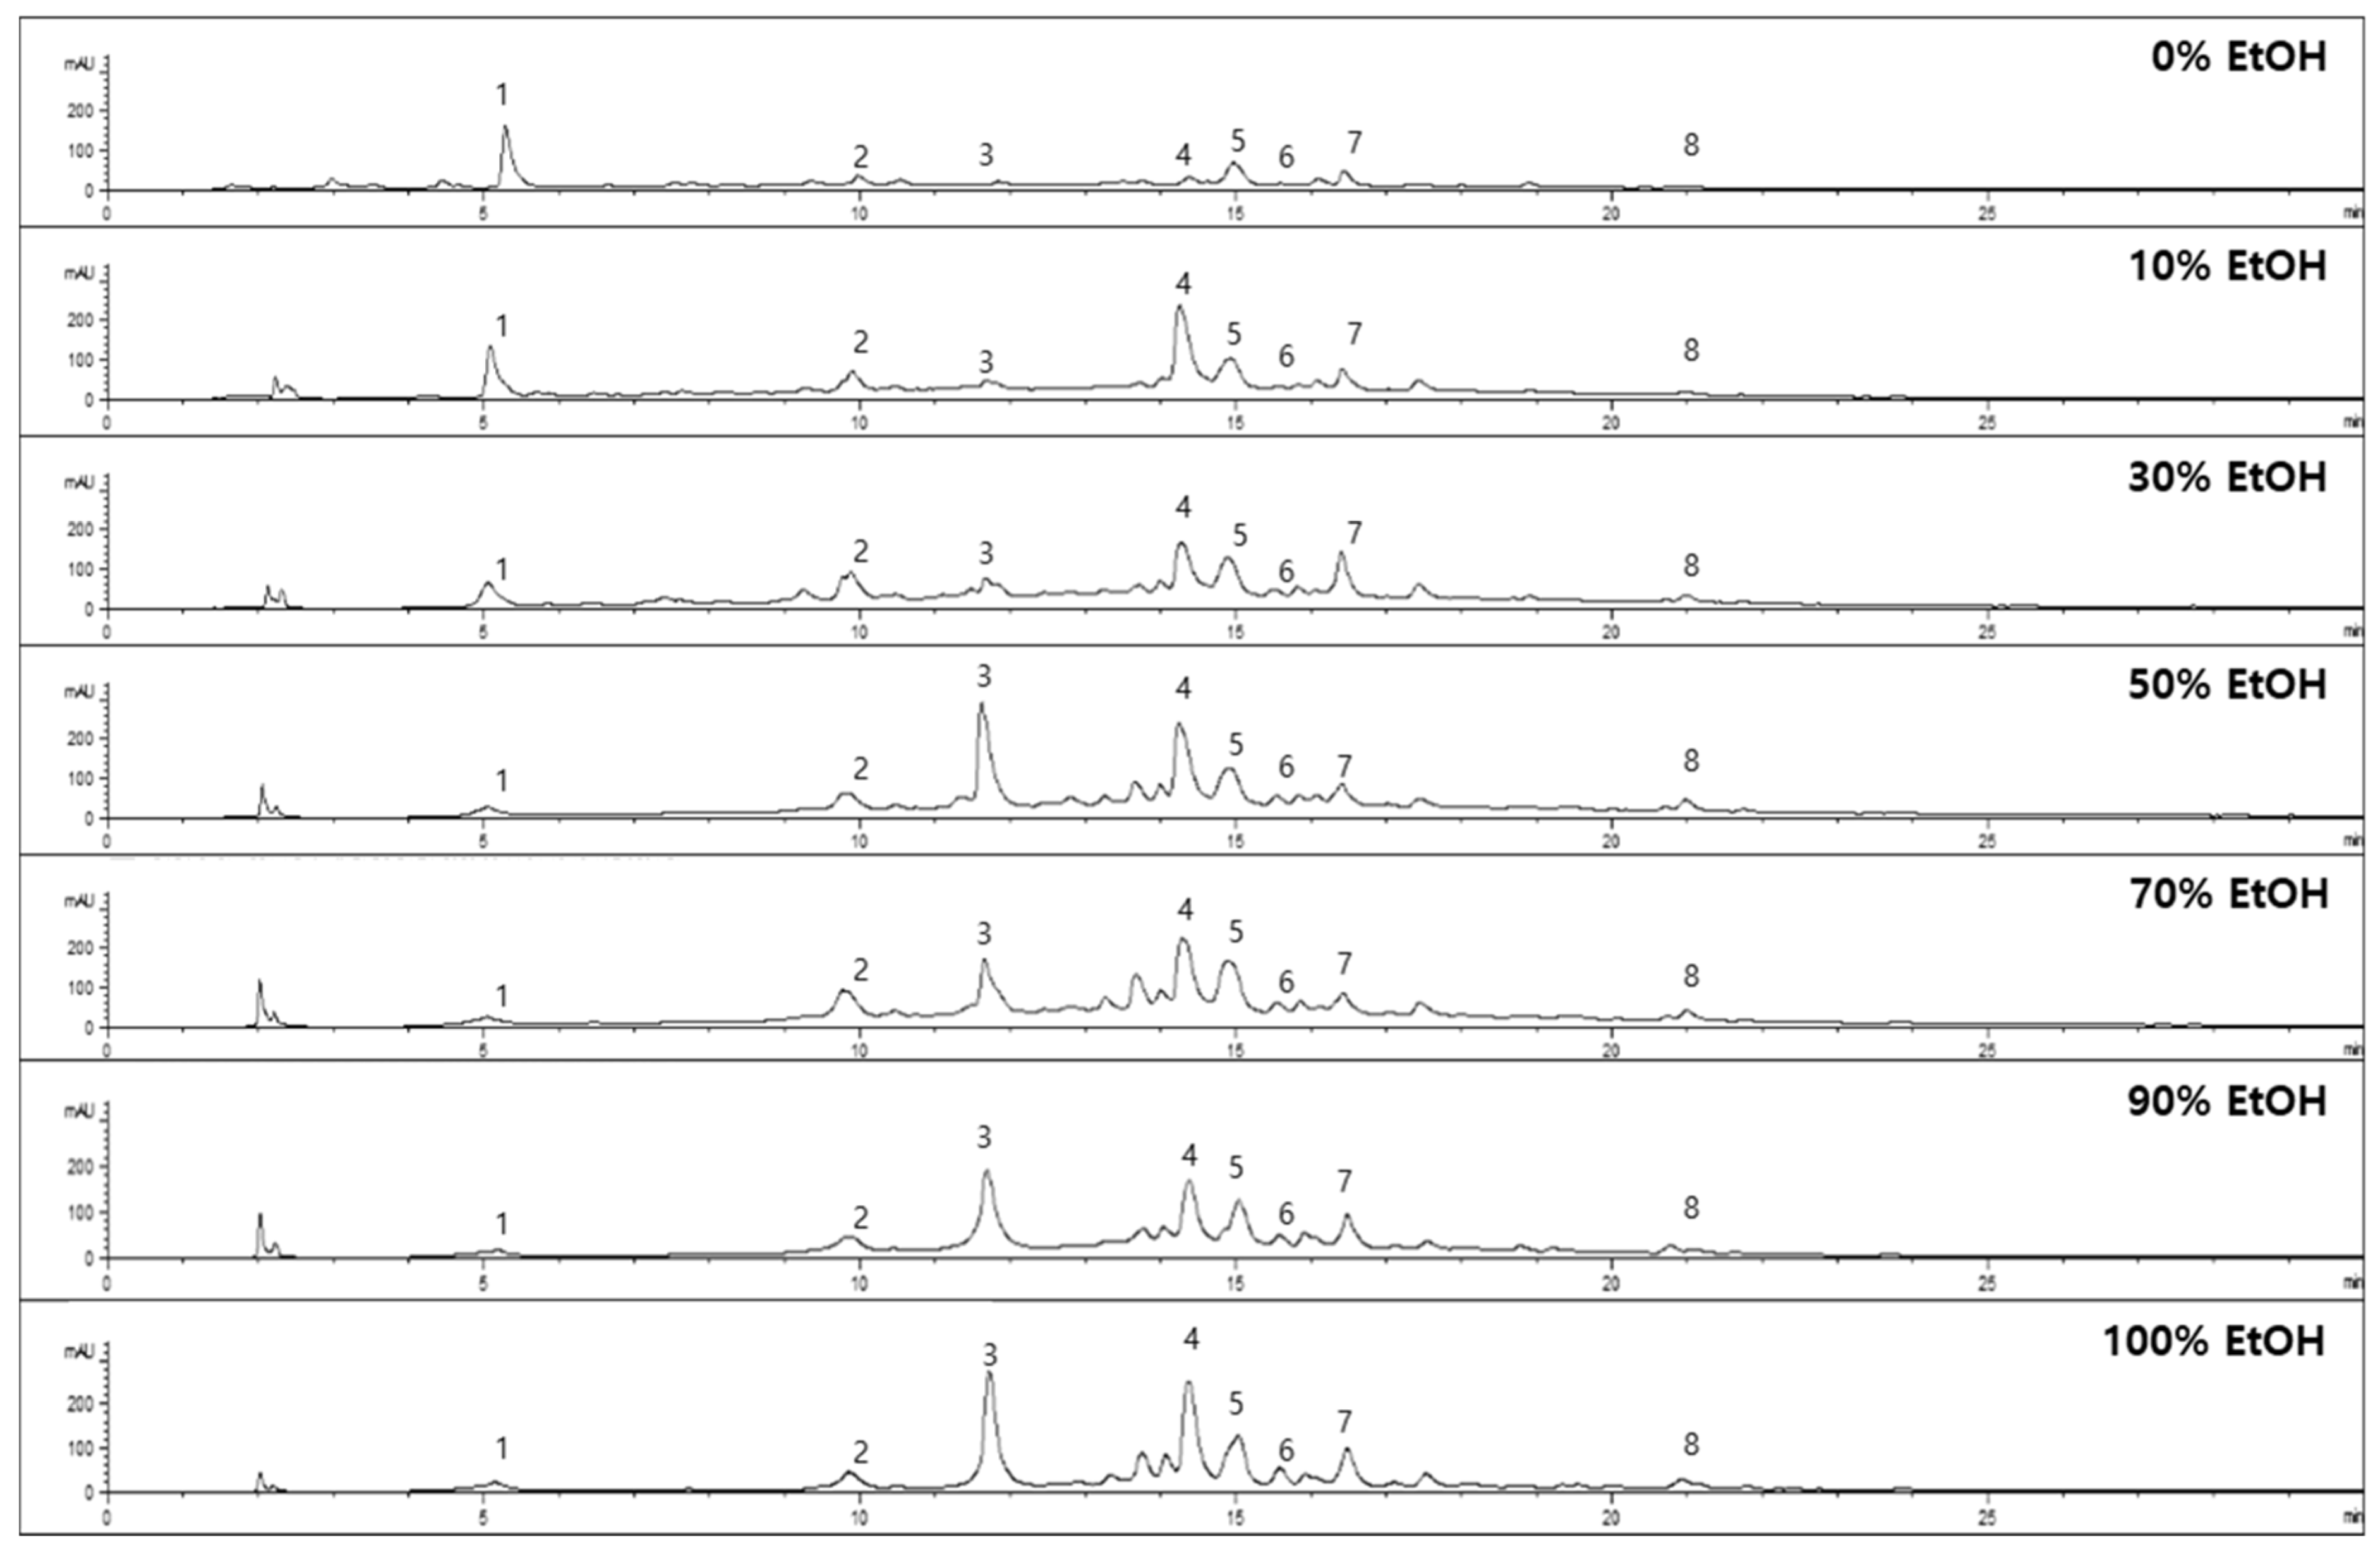
3.4. Characterization of Chemical Composition Using LC-Q-TOF/MS

From the above results, LC-Q-TOF/MS analysis was performed using the representative extraction condition of 30% ethanol. This condition provided the best overall phenolic content and proved to be a reliable measure for antioxidative capacity. A total of eight predominant phytochemicals (18) were confirmed from the base peak chromatogram (BPC) of the E. globulus leaves extracted using 30% ethanol (Figure 2a). As shown in Table 3, the metabolites were identified by comparing the calculated error value between the observed and theoretical mass (m/z) in each mass gram of peaks as follows: salicylic acid β-D-O-glucuronide (1), chlorogenic acid (2), epicatechin (3), 2″-O-galloylhyperin (4), isoquercitrin (5), isorhapontin (6), quercitrin (7), and quercetin-3-O-glucuronide (8).
The abundant metabolites in the E. globulus leaves were classified as phenolic acid, quercetin, stilbene derivatives, and epicatechin. Peak 1 (Figure 2b, tR = 1.7 min) showed a molecular ion peak [M + H]+ detected at m/z 315.0721, which was identified as salicylic acid β-D-O-glucuronide (1) by comparison with the theoretical mass ([M + H]+ = m/z 315.0716). Peak 2 (Figure 2c, tR = 6.7 min) was deduced as chlorogenic acid (2) by confirming its molecular and fragment ion peaks at [M + H]+ = m/z 355.1014 and 163.0385, respectively. The fragment ion at m/z 163.0385 was typically observed as a caffeic acid moiety, which is the result of a cleavage of the chemical bond with a quinic acid on its chemical structure. Peak 3 (Figure 2d, tR = 7.8 min) was confirmed as a signal of epicatechin (3), which possessed a molecular ion peak at [M + H]+ = m/z 291.0057. Additionally, the epicatechin (3) from peak 3 was determined via confirmation of the error value with −4.12 ppm and the retention time of the authentic compound. Peak 4 (Figure 2e, tR = 17.0 min) was verified as 2″-O-gallloylhyperin (4) with a reasonable error value of -2.27 based on the observed ion peak at [M + H]+ = m/z 617.1129 and its theoretical mass of m/z 617.1143. Peak 6 (Figure 2g, tR = 19.3 min) presented a molecular ion [M + H]+ at m/z 421.1502. A fragment ion at m/z 259.0964 was formed by the loss of a glucose moiety from its chemical structure. The remaining peaks 5, 7, and 8 were characterized as quercetin derivatives by having the fragment peak at m/z 303 assigned from quercetin. Specifically, peak 5 (Figure 2f, tR = 17.3 min) showed a major ion peak at [M + H]+ = m/z 465.1021 by relying on the chemical formula of isoquercitrin (5) with C21H20O12. Peak 7 (Figure 2h, tR = 20.2 min) exhibited a molecular ion peak at [M + H]+ = m/z 449.1063. The observed ion peak corresponded to quercitrin (7) as quercetin rhamnoside by verifying the identical value of the exact mass with m/z 449.1084. Peak 8 (Figure 2i, tR = 22.2 min) was identified as quercetin-3-O-glucuronide (8) via the practical comparison between the observed and chemical masses at m/z 479.0796 and 479.0826, respectively. Based on these results, the eight metabolites (18) were tentatively assigned as the abundant metabolites of E. globulus leaves.

3.5. Quantitative Analysis of Identified Metabolites Using HPLC

From the LC-TOF/MS analysis, the identified major metabolites (18) from the extract of E. globulus leaves were quantified to evaluate the optimized extraction ratio. As shown in Figure 3, each peak was verified by retention time using an authentic sample. All samples were evaluated as to LOD, LOQ, and linearity (R2) by each standard curve with appropriate concentrations (0~200 μg/mL) to confirm their contents in the extracts. As shown in Figure 3 and Table 4, the phenolic contents per 1 g of dried E. globulus leaves were assessed using HPLC at 254 nm. Among the eight metabolites, the most polar compound (salicylic acid β-D-O-glucuronide, 1) was distributed with 2.77~9.6 mg/g. Chlorogenic acid (2) was contained in amounts ranging from 2.83 to 5.90 mg/g in most extracts except for the 0% ethanol extract (0.98 mg/g). Compound 3 (epicatechin) showed the most difference in content when extracted using different ethanol ratios. The content of epicatechin ranged from 98.3 to 142.4 mg/g at a high ratio of ethanol (50~100%). Under the 0~30% ethanol conditions, the contents observed were 0.24~14.64 mg/g.
Among the flavonoid contents, 2″-O-galloylhyperin (4) occupied the largest proportion and showed contents of 19.7~22.90 mg/g in the presence of ethanol in the extraction conditions. Isoquercitrin (5) had the highest content in the 70% ethanol condition with 14.8 mg/g, whereas other conditions were detected at similar levels with 5.26~9.90 mg/g. Isorhapontin (6), quercitrin (7), and quercetin 3-O-glucuronide (8) were quantified at relatively minor levels below 2 mg/g under all the extraction conditions. Overall, the representative eight metabolite (18) contents were present at high levels in E. globulus leaf extract when the ethanol conditions were more than 50%. However, the radical scavenging effects mentioned above showed the most activity in the 30% ethanol condition. Therefore, the results suggest that the flavonoids rather than the phenolics influenced the E. globulus leaf extracts.

4. Conclusions

This study investigated the TPC, TFC, radical scavenging effects, and quantitative and qualitative analyses of metabolites to optimize the extraction conditions of E. globulus leaves. The TPC of E. globulus leaf extract was highest in the 10~70% ethanol extracts. The TFC showed a higher aspect as the ratio of relatively non-polar solvent to ethanol increased. The most antioxidative condition against DPPH radicals was the 30% ethanol extract, while the best antioxidant efficacy for ABTS radical scavenging activity was observed under 30% and 50% ethanol extraction conditions. Moreover, LC-Q-TOF/MS analysis of the E. globulus leaves extracted using 30% ethanol identified eight predominant phytochemicals, including salicylic acid β-D-glucuronide (1), chlorogenic acid (2), epicatechin (3), 2″-O-galloylhyperin (4), isoquercitrin (5), isorhapontin (6), quercitrin (7), and quercetin-3-O-glucuronide (8). The most predominant metabolites were epicatechin, a phenolic, and 2″-O-galloylhyperin, a flavonoid, in the 50% ethanol extract. Overall, the results suggest that the extract conditions of E. globulus leaves play a significant role in determining the phytochemical composition as well as the antioxidant potential.

Author Contributions

J.Y.P.: conceptualization, formal analysis, and investigation; J.Y.K. (Ju Yeon Kim) and Y.G.S.: formal analysis; S.D.K.: conceptualization and resources; S.W.L. and K.D.K.: Writing—review and editing; J.Y.K. (Jeong Yoon Kim): supervision and overall research. All authors have read and agreed to the published version of the manuscript.

Funding

This work was supported by the National Research Foundation of Korea (NRF) grant funded by the Korean Government (MSIT) (No. 2021R1A5A8029490 and No. 2022R1F1A1063786).

Institutional Review Board Statement

Not applicable.

Informed Consent Statement

Not applicable.

Data Availability Statement

Not applicable.

Conflicts of Interest

The authors declare no conflict of interest.

References

  1. Hayat, U.; Idrees Jilani, M.; Rehman, R.; Nadeem, F. A Review on Eucalyptus globulus: A New Perspective in Therapeutics. IJCBS 2015, 8, 85–91. [Google Scholar]
  2. Grattapaglia, D.; Vaillancourt, R.E.; Shepherd, M.; Thumma, B.R.; Foley, W.; Külheim, C.; Potts, B.M.; Myburg, A.A.; Grattapaglia, D.; Vaillancourt, R.E.; et al. Progress in Myrtaceae Genetics and Genomics: Eucalyptus as the Pivotal Genus. Tree Genet. Genomes 2012, 8, 463–508. [Google Scholar] [CrossRef]
  3. Ali, B.; Al-Wabel, N.A.; Shams, S.; Ahamad, A.; Khan, S.A.; Anwar, F. Essential Oils Used in Aromatherapy: A Systemic Review. Asian Pac. J. Trop. Biomed. 2015, 5, 601–611. [Google Scholar] [CrossRef]
  4. Bachir, R.G.; Benali, M. Antibacterial Activity of the Essential Oils from the Leaves of Eucalyptus globulus against Escherichia coli and Staphylococcus aureus. Asian Pac. J. Trop. Biomed. 2012, 2, 739. [Google Scholar] [CrossRef]
  5. Dhakad, A.K.; Pandey, V.V.; Beg, S.; Rawat, J.M.; Singh, A. Biological, Medicinal and Toxicological Significance of Eucalyptus Leaf Essential Oil: A Review. J. Sci. Food Agric. 2018, 98, 833–848. [Google Scholar] [CrossRef] [PubMed]
  6. Harkat-Madouri, L.; Asma, B.; Madani, K.; Bey-Ould Si Said, Z.; Rigou, P.; Grenier, D.; Allalou, H.; Remini, H.; Adjaoud, A.; Boulekbache-Makhlouf, L. Chemical Composition, Antibacterial and Antioxidant Activities of Essential Oil of Eucalyptus globulus from Algeria. Ind. Crops Prod. 2015, 78, 148–153. [Google Scholar] [CrossRef]
  7. Hasni, S.; Rigane, G.; Ghazghazi, H.; Riguene, H.; Bouallegue, A.; Khedher, O.; Oueslati, M.A.; Ben Salem, R. Optimum Conditions and LC-ESI-MS Analysis of Phenolic Rich Extract from Eucalyptus marginata L. Under Maceration and Ultrasound-Assisted Extraction Methods Using Response Surface Methodology. J. Food Qual. 2021, 2021, 5591022. [Google Scholar] [CrossRef]
  8. De Elguea-Culebras, G.O.; Bravo, E.M.; Sánchez-Vioque, R. Potential Sources and Methodologies for the Recovery of Phenolic Compounds from Distillation Residues of Mediterranean Aromatic Plants. An Approach to the Valuation of by-Products of the Essential Oil Market—A Review. Ind. Crops Prod. 2022, 175, 114261. [Google Scholar] [CrossRef]
  9. Moreira, P.; Matos, P.; Figueirinha, A.; Salgueiro, L.; Batista, M.T.; Branco, P.C.; Cruz, M.T.; Pereira, C.F. Forest Biomass as a Promising Source of Bioactive Essential Oil and Phenolic Compounds for Alzheimer’s Disease Therapy. Int. J. Mol. Sci. 2022, 23, 8812. [Google Scholar] [CrossRef]
  10. Rashed, A.A.; Rahman, A.Z.A.; Rathi, D.N.G. Essential Oils as a Potential Neuroprotective Remedy for Age-Related Neurodegenerative Diseases: A Review. Molecules 2021, 26, 1107. [Google Scholar] [CrossRef]
  11. Celeiro, M.; Lamas, J.P.; Arcas, R.; Lores, M. Antioxidants Profiling of By-Products from Eucalyptus Greenboards Manufacture. Antioxidants 2019, 8, 263. [Google Scholar] [CrossRef]
  12. Vuong, Q.V.; Hirun, S.; Chuen, T.L.K.; Goldsmith, C.D.; Munro, B.; Bowyer, M.C.; Chalmers, A.C.; Sakoff, J.A.; Phillips, P.A.; Scarlett, C.J. Physicochemical, Antioxidant and Anti-Cancer Activity of a Eucalyptus robusta (Sm.) Leaf Aqueous Extract. Ind. Crops Prod. 2015, 64, 167–174. [Google Scholar] [CrossRef]
  13. Buonocore, G.; Perrone, S.; Tataranno, M.L. Oxygen Toxicity: Chemistry and Biology of Reactive Oxygen Species. Semin. Fetal Neonatal Med. 2010, 15, 186–190. [Google Scholar] [CrossRef]
  14. Juan, C.A.; de la Lastra, J.M.P.; Plou, F.J.; Pérez-Lebeña, E. The Chemistry of Reactive Oxygen Species (ROS) Revisited: Outlining Their Role in Biological Macromolecules (DNA, Lipids and Proteins) and Induced Pathologies. Int. J. Mol. Sci. 2021, 22, 4642. [Google Scholar] [CrossRef]
  15. Ighodaro, O.M.; Akinloye, O.A. First Line Defence Antioxidants-Superoxide Dismutase (SOD), Catalase (CAT) and Glutathione Peroxidase (GPX): Their Fundamental Role in the Entire Antioxidant Defence Grid. Alexandria J. Med. 2018, 54, 287–293. [Google Scholar] [CrossRef]
  16. Bratovcic, A. Antioxidant Enzymes and Their Role in Preventing Cell Damage. Acta Sci. Nutr. Health 2020, 4, 01–07. [Google Scholar] [CrossRef]
  17. Mena, S.; Ortega, A.; Estrela, J.M. Oxidative Stress in Environmental-Induced Carcinogenesis. Mutat. Res. Toxicol. Environ. Mutagen. 2009, 674, 36–44. [Google Scholar] [CrossRef]
  18. Bhatti, J.S.; Sehrawat, A.; Mishra, J.; Sidhu, I.S.; Navik, U.; Khullar, N.; Kumar, S.; Bhatti, G.K.; Reddy, P.H. Oxidative Stress in the Pathophysiology of Type 2 Diabetes and Related Complications: Current Therapeutics Strategies and Future Perspectives. Free Radic. Biol. Med. 2022, 184, 114–134. [Google Scholar] [CrossRef]
  19. Asadi, N.; Bahmani, M.; Kheradmand, A.; Rafieian-Kopaei, M. The Impact of Oxidative Stress on Testicular Function and the Role of Antioxidants in Improving It: A Review. J. Clin. Diagn. Res. 2017, 11, IE01. [Google Scholar] [CrossRef] [PubMed]
  20. Ali, S.S.; Ahsan, H.; Zia, M.K.; Siddiqui, T.; Khan, F.H. Understanding Oxidants and Antioxidants: Classical Team with New Players. J. Food Biochem. 2020, 44, e13145. [Google Scholar] [CrossRef]
  21. Tungmunnithum, D.; Thongboonyou, A.; Pholboon, A.; Yangsabai, A. Flavonoids and Other Phenolic Compounds from Medicinal Plants for Pharmaceutical and Medical Aspects: An Overview. Medicines 2018, 5, 93. [Google Scholar] [CrossRef] [PubMed]
  22. Šamec, D.; Karalija, E.; Šola, I.; Vujčić Bok, V.; Salopek-Sondi, B. The Role of Polyphenols in Abiotic Stress Response: The Influence of Molecular Structure. Plants 2021, 10, 118. [Google Scholar] [CrossRef] [PubMed]
  23. Charlton, N.C.; Mastyugin, M.; Török, B.; Török, M. Structural Features of Small Molecule Antioxidants and Strategic Modifications to Improve Potential Bioactivity. Molecules 2023, 28, 1057. [Google Scholar] [CrossRef] [PubMed]
  24. Hsueh, C.C.; Wu, C.C.; Chen, B.Y. Polyphenolic Compounds as Electron Shuttles for Sustainable Energy Utilization. Biotechnol. Biofuels 2019, 12, 271. [Google Scholar] [CrossRef]
  25. Mathew, S.; Abraham, T.E.; Zakaria, Z.A. Reactivity of Phenolic Compounds towards Free Radicals under in Vitro Conditions. J. Food Sci. Technol. 2015, 52, 5790. [Google Scholar] [CrossRef]
  26. Lama-Muñoz, A.; del Mar Contreras, M. Extraction Systems and Analytical Techniques for Food Phenolic Compounds: A Review. Foods 2022, 11, 3671. [Google Scholar] [CrossRef] [PubMed]
  27. Palos-Hernández, A.; Gutiérrez Fernández, M.Y.; Escuadra Burrieza, J.; Pérez-Iglesias, J.L.; González-Paramás, A.M. Obtaining Green Extracts Rich in Phenolic Compounds from Underexploited Food By-Products Using Natural Deep Eutectic Solvents. Opportunities and Challenges. Sustain. Chem. Pharm. 2022, 29, 100773. [Google Scholar] [CrossRef]
  28. Cai, S.; Wang, O.; Wu, W.; Zhu, S.; Zhou, F.; Ji, B.; Gao, F.; Zhang, D.; Liu, J.; Cheng, Q. Comparative Study of the Effects of Solid-State Fermentation with Three Filamentous Fungi on the Total Phenolics Content (TPC), Flavonoids, and Antioxidant Activities of Subfractions from Oats (Avena sativa L.). J. Agric. Food Chem. 2012, 60, 507–513. [Google Scholar] [CrossRef]
  29. Krishnan, K.R.; Rayaguru, K.; Nayak, P.K. Ultra-Sonicated Vacuum Drying’s Effect on Antioxidant Activity, TPC, TFC and Color of Elephant Apple Slices. Food Biosci. 2020, 36, 100629. [Google Scholar] [CrossRef]
  30. Sharma, O.P.; Bhat, T.K. DPPH Antioxidant Assay Revisited. Food Chem. 2009, 113, 1202–1205. [Google Scholar] [CrossRef]
  31. Dudonné, S.; Vitrac, X.; Coutiére, P.; Woillez, M.; Mérillon, J.M. Comparative Study of Antioxidant Properties and Total Phenolic Content of 30 Plant Extracts of Industrial Interest Using DPPH, ABTS, FRAP, SOD, and ORAC Assays. J. Agric. Food Chem. 2009, 57, 1768–1774. [Google Scholar] [CrossRef] [PubMed]
  32. Fernandez-Panchon, M.S.; Villano, D.; Troncoso, A.M.; Garcia-Parrilla, M.C. Antioxidant Activity of Phenolic Compounds: From In Vitro Results to In Vivo Evidence. Crit. Rev. Food Sci. Nutr. 2008, 48, 649–671. [Google Scholar] [CrossRef]
  33. Martins, N.; Barros, L.; Ferreira, I.C.F.R. In Vivo Antioxidant Activity of Phenolic Compounds: Facts and Gaps. Trends Food Sci. Technol. 2016, 48, 1–12. [Google Scholar] [CrossRef]
  34. Moazzen, A.; Öztinen, N.; Ak-Sakalli, E.; Koşar, M. Structure-Antiradical Activity Relationships of 25 Natural Antioxidant Phenolic Compounds from Different Classes. Heliyon 2022, 8, e10467. [Google Scholar] [CrossRef] [PubMed]
  35. Molole, G.J.; Gure, A.; Abdissa, N. Determination of Total Phenolic Content and Antioxidant Activity of Commiphora mollis (Oliv.) Engl. Resin. BMC Chem. 2022, 16, 48. [Google Scholar] [CrossRef]
  36. Rumpf, J.; Burger, R.; Schulze, M. Statistical Evaluation of DPPH, ABTS, FRAP, and Folin-Ciocalteu Assays to Assess the Antioxidant Capacity of Lignins. Int. J. Biol. Macromol. 2023, 233, 123470. [Google Scholar] [CrossRef] [PubMed]
  37. Apak, R.; Özyürek, M.; Güçlü, K.; Çapanoğlu, E. Antioxidant Activity/Capacity Measurement. 1. Classification, Physicochemical Principles, Mechanisms, and Electron Transfer (ET)-Based Assays. J. Agric. Food Chem. 2016, 64, 997–1027. [Google Scholar] [CrossRef] [PubMed]
Figure 1. Correlations between TPC, TFC, and radical scavenging effects of different conditions of E. globulus leaf extracts. (a) DPPH-ABTS, (b) TPC-TFC, (c) TPC-DPPH, (d) TFC-DPPH, (e) TPC-ABTS, and (f) TFC-ABTS.
Applsci 13 09984 g001
Figure 2. LC-Q-TOF/MS analysis of representative E. globulus leaf extracts. (a) Base peak chromatogram (BPC) of E. globulus leaf extracts using 30% ethanol. (bi) Mass gram of individual peaks 1–8. Peak 1, salicylic acid β-D-O-glucuronide (1); Peak 2, chlorogenic acid (2); Peak 3, epicatechin (3); Peak 4, 2″-O-galloylhyperin (4); Peak 5, isoquercitrin (5); Peak 6, isorhapontin (6); Peak 7, quercitrin (7); Peak 8, quercetin-3-O-glucuronide (8).
Applsci 13 09984 g002
Figure 3. HPLC chromatogram of E. globulus leaves under different extract conditions using 0%, 10%, 30%, 50%, 70%, 90%, and 100% ethanol.
Applsci 13 09984 g003
Table 1. TPC and TFC of different E. globulus leaf extract conditions.
Extract ConditionsTPC
(mg GAE/g Extract)
TFC
(mg QE/g Extract)
0% ethanol126.7 ± 8.5 a32.5 ± 5.1 a
10% ethanol422.0 ± 18.4 b32.7 ± 4.8 a
30% ethanol492.7 ± 13.2 b40.4 ± 6.7 b
50% ethanol497.7 ± 15.5 b41.2 ± 7.5 b
70% ethanol448.5 ± 20.1 b66.5 ± 6.5 bc
90% ethanol384.5 ± 10.4 b156.5 ± 10.4 c
100% ethanol273.2 ± 17.5 ab169.3 ± 12.2 c
The different superscript letters indicate significant differences (p < 0.05).
Table 2. Radical scavenging activity of different E. globulus leaf extract conditions against DPPH and ABTS.
Extract ConditionsRadical Scavenging Activity (SC50, μg/mL)
DPPHABTS
0% ethanol5841.7 ± 238.4 d171.3 ± 10.2 b
10% ethanol357.9 ± 28.0 ab23.1 ± 2.1 a
30% ethanol188.2 ± 24.2 a14.2 ± 0.9 a
50% ethanol505.3 ± 56.2 b18.0 ± 1.5 a
70% ethanol509.3 ± 57.1 b20.8 ± 1.9 a
90% ethanol1008.4 ± 121.2 c24.8 ± 1.4 a
100% ethanol1304.7 ± 156.5 c34.9 ± 5.1 a
The different superscript letters indicate significant differences (p < 0.05).
Table 3. Characterization of major metabolites of E. globulus leaf extract.
NoRT
(min)
Observed Mass (m/z)Theoretical Mass (m/z)Error
(ppm)
FormulaIdentification
11.7315.0721315.0716+1.59C13H14O9Salicylic acid β-D-O-glucuronide
26.7355.1014355.1029+4.22C16H18O9Chlorogenic acid
37.8291.0857291.0869−4.12C15H14O6Epicatechin
417.0617.1129617.1143−2.27C28H24O162″-O-Galloylhyperin
517.3465.1021465.1033−2.58C21H20O12Isoquercitrin
619.3421.1502421.1499+0.71C21H24O9Isorhapontin
720.2449.1063449.1084−4.68C21H20O11Quercitrin
822.2479.0796479.0826−6.26C21H18O13Quercetin-3-O-glucuronide
Table 4. Quantitative analysis of major metabolites from extracts using HPLC.
Compd.Phenolic Contents, (mg/g) a
0% b10%30%50%70%90%100%
19.6 ± 1.48.40 ± 1.26.48 ± 1.44.13 ± 0.93.70 ± 0.53.41 ± 0.92.77 ± 0.6
20.98 ± 0.052.83 ± 0.52.93 ± 0.33.04 ± 0.25.90 ± 0.63.51 ± 0.33.26 ± 0.4
30.24 ± 0.0211.3 ± 1.214.64 ± 2.5142.4 ± 4.498.3 ± 12.1113 ± 16.412.56 ± 1.9
40.19 ± 0.0122.9 ± 2.520.50 ± 0.921.24 ± 3.021.72 ± 3.919.70 ± 1.221.55 ± 2.9
55.26 ± 0.48.28 ± 2.99.64 ± 1.79.90 ± 0.514.87 ± 2.87.21 ± 0.89.72 ± 1.1
60.24 ± 0.030.40 ± 0.041.05 ± 0.21.00 ± 0.071.32 ± 0.51.45 ± 0.050.94 ± 0.06
70.63 ± 0.121.01 ± 0.22.12 ± 0.81.15 ± 0.041.13 ± 0.11.47 ± 0.041.57 ± 0.08
80.11 ± 0.050.20 ± 0.060.32 ± 0.050.53 ± 0.080.52 ± 0.060.29 ± 0.040.41 ± 0.02
All the experiments were triplicates. a The values are expressed as mg of each compound equivalents per g of dry weight as mean (n = 3). b The percentage represents the ethanol ratio of E. globulus leaf extract solvent.
Disclaimer/Publisher’s Note: The statements, opinions and data contained in all publications are solely those of the individual author(s) and contributor(s) and not of MDPI and/or the editor(s). MDPI and/or the editor(s) disclaim responsibility for any injury to people or property resulting from any ideas, methods, instructions or products referred to in the content.

