1. Introduction
The identification of medicinal plants rich in compounds with an antioxidant effect, such as polyphenols that have the greatest capacity to capture free radicals, has been of particular interest for research since ancient times [
1,
2,
3].
Over time, antioxidants extracted from plants marketed in the form of crude extracts or medicines derived from plant products have been used as alternative medications for prophylactic or curative purposes to maintain health [
4,
5]. Natural antioxidants are much more effective and safer for the body than synthetic antioxidants. They can be included in different dermatological cosmetics formulations for antiaging and photoprotective effects, in various dietary supplements, and pharmaceutical formulations [
3,
4,
5,
6]. To date, the
Ruta graveolens L. plant, which has a high content of phenolic compounds, such as flavonoids, and antioxidant effects has been little studied in terms of the use of its hydroalcoholic extracts in pharmaceutical formulations. In this paper, we attempt to produce pharmaceutical particulate systems in the form of microspheres loaded with the hydroalcoholic extract of
Ruta graveolens L. intended for oral administration.
The
Ruta graveolens L. plant is also known as rue or herb-of-grace and is part of the
Rutaceae family,
Rutales order. It is a perennial herbaceous, dicotyledonous, aromatic, and endemic plant in Eastern and South-Eastern Europe, but has gradually spread to Southern Europe, the subtropical area, the African coast of the Mediterranean Sea, and the sub-spontaneous flora of Dobrogea [
7,
8,
9,
10,
11,
12].
Ruta graveolens L. (RG) has been attracting significant attention in the field of drug discovery in recent years due to the presence of various compounds, including flavonoids, in its extract that are known to have curative properties and can be used to treat different diseases, including inflammatory conditions [
13,
14]. Giresha, A.S. et al. demonstrated that the aqueous and ethanolic extracts of RG have inhibitory effects on lipoxygenase enzymes and on human plural fluid phospholipase A2 (HPF-PLA2) [
14]. Mokhtar, M. et al., found that the RG methanolic extract had the ability to inhibit albumin denaturation and membrane stabilization [
15]. Some studies [
15,
16] suggest that its extracts could be useful, including in the treatment of irritable bowel syndrome, as they have antispasmodic and anti-inflammatory properties. The roots and aerial parts of the RG plant contain more than 120 active compounds, including rutin, also known as rutoside. Rutin is considered by some authors to be the main flavonoid compound found in the plant. It has been shown to possess antioxidant and anti-inflammatory properties, and is also the most commonly occurring glycosidic flavone across the plant kingdom [
8,
17,
18,
19]. Research has demonstrated that administering rutin orally can enhance colitis in rats induced by 2,4,6-trinitrobenzene sulfonic acid (TNBS) by inhibiting the activation of nuclear factor kappa B (NFκB) induced by pro-inflammatory cytokines, such as TNF-α [
20].
In this study, the plant extract was encapsulated in microspheres, because microencapsulation is a technique that involves incorporating liquid, solid, and gaseous substances into carriers to protect them from decomposition and improve their stability [
21,
22]. Among the microencapsulation methods that can be used, in this work, complex coacervation was used because is a low-cost, flexible, and rapid method [
23]. Compared with other encapsulation methods, it produces microparticles with higher microencapsulation efficiency by using a high core load and low wall material concentration [
24]. The process is initiated by the electrostatic interaction between two biopolymers with opposite charges [
25] in an aqueous medium, leading to the formation of two or more partially immiscible liquid phases with the aggregation of colloidal particles [
26]. Microparticles can be produced from walls of natural, synthetic, or semi-synthetic polymeric material. Natural polymers, such as proteins and polysaccharides, are often preferred because of their biocompatibility and lack of side effects. Synthetic polymers offer more flexibility, but may not be as biocompatible. The choice of material depends on the desired properties of the microparticles [
27,
28,
29]. In this study, two natural biodegradable polymers, chitosan (Ch) and sodium alginate (Na-Alg), were incorporated into the microparticles as the material wall.
Material walls are a type of coating that surround a small particle or droplet of a material. They are usually composed of a polymeric material and are designed to protect and regulate the release of the core material. The size and composition of the wall can be adjusted to achieve specific properties, such as stability, solubility, and controlled release kinetics. A good encapsulation material wall should enhance the performance and stability of the active pharmaceutical ingredients [
29,
30,
31].
Chitosan was selected as the cationic polymer due to its diverse biological activities, including biocompatibility, biodegradability, nontoxicity, antihypertensive, anti-inflammatory, and antimicrobial properties, as well as its potential in drug delivery applications [
32]. As a result, chitosan has gained attention as a possible natural food preservative and has been approved by the United States Food and Drug Administration (USFDA) as a Generally Recognized as Safe (GRAS) food additive and as an oral delivery system [
33]. The second natural and nontoxic anionic polymer selected was sodium alginate [
34], usually extracted from brown algae or soil bacteria. It has been widely used in the food industry as a thickener, as well as in drug delivery systems and bone tissue engineering, due to its biodegradable and biocompatible properties and low price. Combining Na-Alg with calcium ions and chitosan creates a stable complex with three-dimensional structures that can control the release of encapsulated materials. This combination has been found to be more effective than chitosan or sodium alginate alone, making it useful for successful drug delivery [
35].
Compared with other studies, our work developed a different type of pharmaceutical system, microspheres, using an efficient encapsulation method called complex coacervation to protect the bioactive compounds found in Ruta graveolens extract.
The novelty of our study lies in the way that the extract was encapsulated in microspheres, which ensures that the flavonoid compounds identified in the extract, known for their antioxidant effect, are protected from external degradation (temperature, pH, and oxygen) or that by gastric acid. According to the literature, flavonoid compounds, including those identified in
Ruta graveolens, are sensitive to acidic environments and their bioactivity is compromised after oral administration due to exposure to gastric acid [
36,
37,
38].
Encapsulation technologies have been developed to increase the absorption and solubility and to limit the impact of external/internal degradation on polyphenolic compounds, such as the ionic gelation method used by Mahmoudi, R. et al. to develop chitosan and tripolyphosphate nanoparticles containing alcoholic extract of
Physalis alkekengi L. [
38], or the microcapsules developed by Miere, F. et al. using sodium alginate loaded with
Stellaria media L. aqueous extract [
39]. For the same reason, using the ionic gelation process, Taghiloo, S. et al. developed sodium alginate and chitosan nanoparticles that contained
Echinacea angustifolia extract to increase their stability and prolong their release [
40]. Using the vibration microencapsulation nozzle technique, Villate, A. et al. synthetized chitosan-coated alginate microcapsules, which contained
Cannabis raw extract, to obtain an edible pharmaceutical-grade product [
41]. In contrast, our study used microencapsulation technology to ensure the release of the RG plant extract into the intestine, minimizing the effect of acidic pH on the bioactivity of the compounds. Compared with other studies, we used only natural, biodegradable, and safe compounds for the organism—chitosan obtained from shrimp and sodium alginate extracted from brown algae. Our goal was also to mask the unpleasant taste of the extract by including it in a biodegradable, biocompatible, nontoxic, and safe polymeric matrix and to determine the most efficient encapsulation method in order to maximize the amount of entrapped and released compound in vitro.
Thus, we consider that, by using an adequate amount of polymer and an efficient encapsulation method, increased stability and controlled delivery of active compounds could be ensured, while protecting them from the acidic and proteolytic environment of the gastrointestinal tract. The system obtained by us can be further used to produce new oral pills capable of reaching the small intestine, where the active drug contained can be released.
2. Materials and Methods
2.1. Chemicals and Reagents
Aluminum chloride (AlCl3), rutin standard, sodium nitrite (NaNO2), DPPH (2,2-Diphenyl-1-(2,4,6-trinitrophenyl)hydrazyl), ABTS (diammonium 2,2′-azino-bis(3-ethylbenzothiazoline-6-sulfonate), and potassium persulfate (K2S2O8) were purchased from Sigma Aldrich Chemie (Schnelldorf, Germany); the standards of gallic acid, ferulic acid, and synapic acid were from Roth (Karlsruhe, Germany); the standards of isoquercetin, chlorogenic acid, p-coumaric acid, and quercetin were from Sigma (St. Louis, MO, USA); sodium hydroxide (NaOH), Folin–Ciocalteu reagent, calcium carbonate (CaCO3), ethanol 96%, and methanol were from Merck (Darmstadt, Germany); chitosan and sodium alginate were from Sigma Aldrich Co (Burlington, MA, USA); anhydrous calcium chloride (CaCl2) was from Chempur (Piekary Slaskie, Poland); and glacial acetic acid was from Promochem (Wesel, Germany).
Apparatus: Analytical balance type ABT 220-5DNM from Kern and Sohn GmbH (Balingen, Germany), ultrasonic bath type Elmasonic S 100 H from Elma Schmidbauer GmbH (Singen, Germany), pH meter type pH 7310 from Inolab Xylem Analytics GmbH (Wellheim, Germany), magnetic stirrer from Ecostris Dlab Scientific Co., Ltd. (Beijing, China), universal centrifuge 320 R from Hettich GmbH and Co., KG (Tuttingen, Germany), Pipette Ratiopetta 1000–5000 μL from Ratiolab, GmbH (Dreieich, Germany), and 20 mL syringe with 23 G needle (0.60 mm × 30 mm) from KDM Becton Dickinson Discardit.
2.2. Plant Material
The dried plant product of Ruta graveolens L. (RG) was purchased from Health Embassy (Cheltenham, UK).
2.3. Methods
2.3.1. Extraction Processes
The extraction was performed using the maceration method described in the Romanian Pharmacopoeia. The solvent used was 50% ethanol and the solvent-to-sample ratio was 1:10 (
w/
v). Specifically, 10 g of RG plant material was added to 100 mL of 50% ethanol and left for 10 days at room temperature in an Erlenmeyer flask, with stirring 3–4 times per day. The mixture was then filtered using Whatman No. 1 filter paper and the filtrate obtained was filled with solvent up to 100 mL and stored for further use [
42,
43]. The active compounds from the extract obtained (total flavonoid content and total polyphenol content) were determined.
2.3.2. Determination of Total Flavonoid Content (TFC)
The TFCs of the RG extract were estimated using the aluminum chloride colorimetric method, which was previously described [
44,
45,
46], with a slight modification. Specifically, 1 mL of extractive solution (0.1 g/mL dry plant material), 4 mL of double-distilled water, and 0.3 mL of 5% NaNO
2 solution were added to a 10 mL volumetric flask. The mixture was stirred and left to rest in the dark for 5 min. Then, 0.3 mL of 10% AlCl
3 was added, mixed, and kept in the dark for 6 min. Two more milliliters of 1 M NaOH were added and the mixture was filled up to 10 mL with double-distilled water, stirred, and kept at room temperature for another 30 min. The absorbance was then read at 510 nm using a UV-VIS T70+ spectrophotometer (PG Instruments Ltd., Lutterworth, UK). The flavonoid content of the extract was determined using the calibration curve equation for rutin: y = 0.3305x + 0.079, R
2 = 0.999, where y represents the absorbance of the rutin sample read at 510 nm and x represents the amount of rutin present in the sample, expressed in mg equivalent of rutin (RE)/100 g dry material of
Ruta graveolens L. All determinations were performed in triplicate and the results were expressed as the mean value ± SD (standard deviation).
2.3.3. Determination of Total Polyphenol Content (TPC)
The TPC of the RG extract was estimated using the Folin–Ciocalteu colorimetric method, which was previously described by Vicaş, L. et al. and Marian, E. et al. [
44,
45,
46], with a slight modification. Specifically, 0.1 mL of extractive solution (containing 100 mg/0.1 mL dry plant material) was added to 1.7 mL of double-distilled water and 0.2 mL of Folin–Ciocalteu reagent. The mixture was stirred and left to rest for 5 min. Then, 1 mL of 20% CaCO
3 solution was added and the mixture was kept in the dark for 90 min. The absorbance of the blue solution was measured spectrophotometrically at 765 nm. The TPC was determined using the calibration curve equation for gallic acid (GA): y = 0.0135x + 0.0832, R
2 = 0.9963, where y represents the absorbance of GA solutions with different concentrations read at 765 nm using a UV-VIS spectrophotometer expressed in units of absorbance and x represents the concentration of the GA solutions. Determinations were performed in triplicate and the results were expressed in mg gallic acid equivalents (GAE)/g
Ruta graveolens L. dry material as an average value ± SD.
2.3.4. Determination of Antioxidant Capacity Using DPPH (1,1-Diphenyl-2-picrylhydrazyl) Test
To assess the antioxidant capacity of plant extracts, a colorimetric method was used using a DPPH reagent, with slight modifications to the method previously described by Shuib, N.A. et al. [
45]. Specifically, 0.1 mL of plant extract and 2 mL of double-distilled water were added to 2.9 mL of freshly prepared DPPH solution. The mixture was shaken and kept in the dark for 30 min and the absorbance was read at 517 nm using a UV-VIS spectrophotometer. The control sample was the DPPH solution. The samples were prepared and measured in triplicate and the results were expressed as the mean ± SD. The blank sample contained the same reagents in the same amounts, except for the RG extract. The antioxidant capacity was expressed as the percentage inhibition of the DPPH radical and the results were calculated using Equation (1) [
44].
where
Ablank represents the blank absorbance (DPPH reagent dissolved in ethanol) read at 517 nm (t = 0 min) and
Asample represents the sample absorbance (sample with DPPH) read at 517 nm (t = 15 min).
The concentration of plant extract or control sample that provided 50% inhibition (IC
50) was calculated from a graph plotting the inhibition percentage against the concentration of the plant extract or control sample using RG extract in amounts between 0.005 and 0.2 mg/mL. The equation of the calibration curve showing the dependence on % inhibition as a function of the quantity of RG extract is as follows:
where y represents the percentage inhibition (%) and x represents the amount in mg rutin equivalent (RE)/g dry plant material [
44].
2.3.5. Chromatographic Analysis
The HPLC-MS method was used to analyze and quantify polyphenols, methoxylated flavones, and phytosterols. The HPLC equipment used consisted of an Agilent 1100 HPLC Series system (Agilent, Santa Clara, CA, USA), which included a G1322A degasser, G13311A binary gradient pump, column thermostat, G1313A autosampler, and G1316A UV detector. This system was coupled with an Agilent 1100 mass spectrometer (LC/MSD Ion Trap VL). The data were acquired and processed using the Chem Station and Data Analysis software from Agilent (version 01.11) [
47,
48,
49,
50,
51,
52,
53,
54].
The HPLC-MS analysis of phenols was performed by injecting 5 µL of the RG extracts into a reverse-phase analytical column Zorbax SB-C18 (100 × 3.0 mm i.d., 3.5 µm particles). The separation of compounds was achieved using a mobile phase consisting of a mixture of methanol and 0.1% (
v/
v) acetic acid. All polyphenols were eluted in less than 40 min under the following conditions: flow rate of 1 mL/min and working temperature of 48 °C. The binary gradient used for elution started with 5% methanol in a linear mode and ended with 42% methanol over 35 min. For the last 3 min, an isocratic elution was performed with 42% methanol. Prior to the next injection of the sample, the column was re-equilibrated with 5% methanol for 7 min. The detection of the compounds was performed using UV at different wavelengths, specifically at 330 nm until 17.5 min and at 370 nm until the end of the analysis. The MS system was also used to detect compounds, and it was operated in the negative mode using an electrospray ionization source [
47,
48,
50,
51,
52,
53,
54].
2.3.6. Preparation and Characterization of Chitosan–Sodium Alginate–Ruta graveolens L. Extract Microspheres (CARG-Ms)
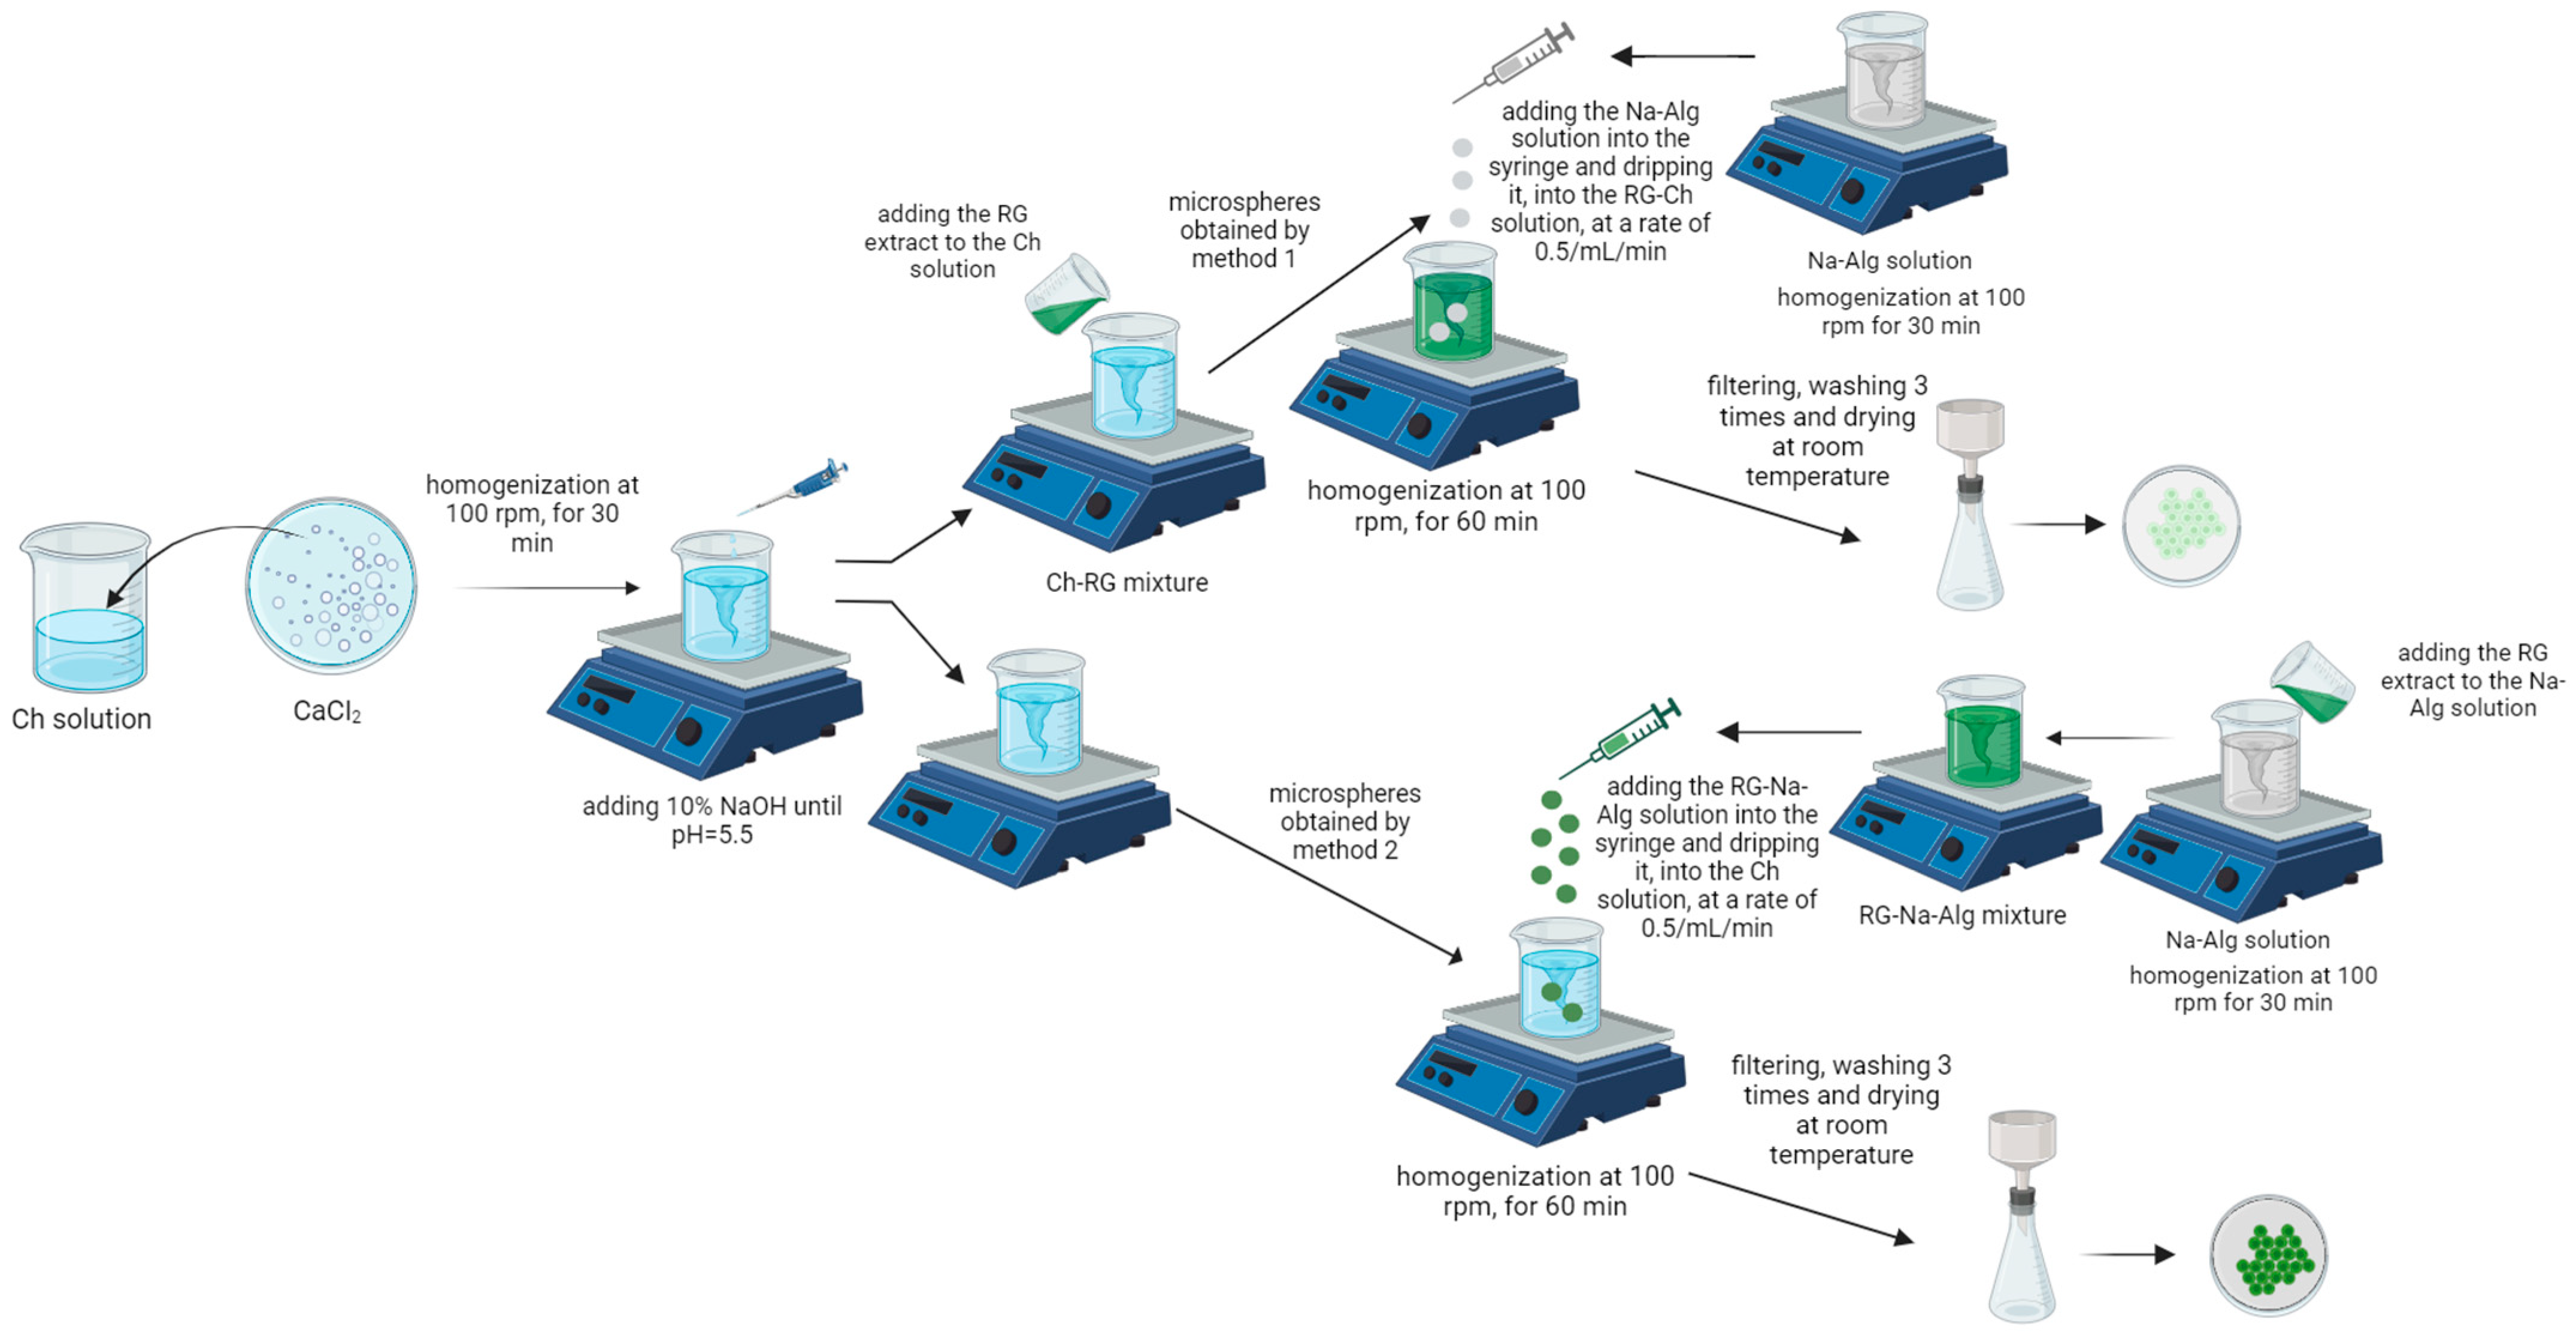
To prepare the microspheres, two colloidal aqueous phases were selected: a chitosan solution of three concentrations (0.1%, 0.2%, and 0.4%) obtained by dispersing it in a 2% acetic acid aqueous solution and a sodium alginate solution with a single concentration (0.75%) obtained by dispersing it in distilled water. The RG extract was encapsulated using two different procedures to determine which method was more effective. A 4% calcium chloride solution was added to the chitosan solutions to prevent the precipitation phenomenon that may occur when working at pH values close to the acidity constants of chitosan and sodium alginate. If the precipitation phenomenon were to occur, the resulting microspheres would be unstable, formed from an irregular matrix that would result in the loss of the trapped substances [
55].
The complex coacervation method involves dropping a solution of sodium alginate into a mixture of chitosan–RG extract (method 1) or a mixture of sodium alginate–RG extract into a solution of chitosan at a rate of 0.5 mL/min and under continuous stirring at 100 rpm for 60 min. The resulting microspheres, which were weakly greenish or deep green in color, were then filtered, washed, and dried in the dark at room temperature until a constant weight was achieved, approximately 24 h, and kept in tightly closed containers until further use [
39,
56]. Schematic representations of the procedures for obtaining the microspheres following the two methods are shown in
Figure 1, and the formulas used to prepare the microspheres are shown in
Table 2.
For comparison with microspheres prepared by the two methods, empty microspheres (E1, E2, and E3) were also prepared that did not contain the RG extract, as shown in
Table 2. These were used in subsequent determinations.
2.3.7. Determination of Entrapping Efficiency (EE%)
The entrapping efficiency of CARG-Ms prepared by methods 1 and 2 was determined using the method described by Frenț, O.D. et al. [
56], with the difference that the obtained samples had their absorbance read at a wavelength of 362 nm. The total flavonoid content (TFC) was used as an indirect computational representation of the active ingredient in the microspheres. By this method, a reference can be made to a known standard; in this case, the rutin. The amount of TFC initially obtained from the extract was compared with the amount of TFC after encapsulation in microspheres. After the disintegration of 250 mg of CARG-Ms in 100 mL of 5% sodium citrate solution, which was then stirred magnetically for 6 h at 500 rpm and subsequently centrifuged at 1500 rpm at 37 °C for 15 min, the percentage of EE of the extract in microspheres was calculated according to Equation (3):
where
is the total content of flavonoids entrapped in microspheres and
is the total flavonoid content of the RG extract used in the process of obtaining microspheres.
2.3.8. Analysis of the Swelling Index (SWL%)
The analysis of the SWL% of the microspheres obtained, loaded, and empty was carried out according to a method described in another study [
42,
56,
57]. Briefly, 5 dry microspheres of known mass were suspended in 3 mL of media with 5 different pH levels and weighed on an analytical balance, ABT 220-5DNM from Kern and Sohn GmbH (Balingen, Germany).
The analysis was performed in triplicate and the results of SWL% were expressed as the average ± SD. The swelling index was calculated using Equation (4):
where
is the mass of swollen microspheres, expressed in grams, and
is the mass of dried microspheres, expressed in grams.
2.3.9. Confocal Laser Scanning Microscopy (CLSM) Analysis
The roughness of the microspheres was determined using a Confocal 3D Laser Scanning Microscope (Lext OLS 4000, Olympus, Tokyo, Japan) with a 405 nm laser light source [
58].
2.3.10. Scanning Electron Microscope (SEM) Analysis
The appearance of each microsphere sample was analyzed using scanning electron microscopy (SEM) on an FEI Quanta FEG 250 microscope (FEI, Hillsboro, OR, USA). To avoid affecting the samples, the images were processed in a low-vacuum system [
29].
2.3.11. Optical Scanning Analysis
The optical scanning process of the microspheres was conducted under reflective light (i.e., the classical method) and under transmittance light (i.e., as for a color-positive photographic film). The scanning resolution was 9600 dpi, which generated a pixel resolution of 0.002645 mm. The optical scanner was from Canon, a Cano Scan 9000 F, which has a 12-line sensor array with FARE technology (dual LED D65 equivalent illumination) and color calibration before each image was scanned. The transmittance scanning illumination source was F11. For the reflective scanning procedure, a black-mate sheet was used to cover the microspheres.
2.3.12. Analysis of the In Vitro Extract Release
The in vitro release test of the RG extract from the obtained microspheres was performed according to a method published in another study [
56] and the method described in the United States Pharmacopoeia (USP 43) [
59] using the dissolution test apparatus equipped with rotating blades, an Electrolab TDT-08L Dissolution Tester, and 8 baskets of 400 mL capacity with a rotation speed of 30 rpm [
60]. The quantity of microspheres with RG used was 0.25 g/sample, and the pH medium used was a phosphate buffer solution with a pH of 7.4, and the temperature was 37 °C. The samples were collected at 0.25, 0.50, 0.75, 1, 2, 3, 4, 5, 6, 8, 12, and 24 h, and the release of the extract was determined spectrophotometrically at a wavelength of 362 nm. The experiment was performed in triplicate, and the results are expressed as the mean value ± SD.
2.3.13. Statistical Analysis
The Design of Experiment (DOE) data were analyzed using univariate and multivariate statistical methods. Bifactorial ANOVA (Analysis of Variance) was used to compare the average values of EE% concerning two statistical factors: Samples and Method. The SWL% averages were compared using tetra factorial ANOVA with four statistical factors: Samples, pH, Time, and Method. The in vitro release capacity of the phytocomplex from microspheres was compared using trifactorial ANOVA on three statistical factors: Samples, Time, and Method. GraphPad Prism 5.3 software (GraphPad Software, 2365 Northside Dr. Suite 560, San Diego, CA, USA) was used for univariate analysis.
Multivariate analysis, consisting of PCA (principal components analysis), multivariate analysis of variance (MANOVA), and HCA (hierarchical cluster analysis), was performed to determine the most efficient selected materials to ensure the highest percentage of in vitro release of the phytocomplex in the polymeric matrix system. All data for the analyzed parameters were collected in triplicate, and the results obtained were presented as the average ± SD. Statistical analysis and graphical representations were performed using standardized statistical methods in MATLAB Software, version R2013a (MatWorks Inc., 1 Apple Hill Drive, Natick, MA, USA).
3. Results and Discussions
3.1. Estimation of Total Flavonoid Content (TFC), Total Polyphenol Content (TPC), and Antioxidant Capacity (DPPH)
The method used to determine the TFC in RG is based on the acid reaction of AlCl
3 with the ketone group at position 4 of the heterocyclic ring C, or the hydroxylic groups at positions C
3 of the heterocyclic ring C or C
5 of the aromatic ring A of the rutin (the rutin structure is rendered in the additional material (
Figure S1)), resulting in colored complexes that can be determined by colorimetry [
61].
The mean TFC value of the RG plant was 22.28 mg RE/100 g DW, which is inconsistent with results obtained by other researchers: 26.87 (mg RE/g DW) for a methanolic extract and 27.72 (mg RE/g DW) for an ethanolic extract of RG, both from crops. Lower values were obtained for methanolic extract (4.18 mg RE/g DW) and ethanolic extract (7.10 mg RE/g DW) of the RG plant [
10]. Similar results were obtained from a methanolic extract of the mixture from the stems, leaves, and fruits of RG (6.66 mg RE/g DW) [
7]. In general, the number of flavonoids present in the plant is influenced by the maturity of the plant at harvest, growing conditions, soil type, and post-harvest treatments.
From the analysis of the data obtained, it can be concluded that the RG extract had an appreciable content of TPC (37.98 mg GAE/g DW). This result is consistent with determinations made by other researchers, who studied the ethanolic extract obtained by RG ultrasonication, and the values found in that study are close to ours (39.90 mg GAE/g DW) [
61]. The differences in the TPC of different types of plant extracts and fractions could be explained by the fact that the presence of polyphenols in RG may be affected by the plant species, its maturity at harvest, growing conditions, soil conditions, and post-harvest treatments [
62].
The flavonoids and polyphenolic compounds present in the RG extract are compounds that, according to studies, have antioxidant capacity and can neutralize free radicals. The evaluation of the antioxidant capacity, in vitro, of the RG extract was carried out using the DPPH method, a spectrophotometric method that is very often used to test the capacity of some existing compounds in plant products to neutralize free radicals by donating protons [
63]. Equation (2) was used to determine the IC
50 inhibition percentage of the extracts in relation to the DPPH reagent. The elimination capacity of 50% of the free radicals by performing the calculations corresponding to Equation (1) was IC
50 = 0.098 mg/mL, the extract concentration was 98.82 mg/mL, and the mean percentage inhibition of DPPH was 54.25%.
The capture capacity of radicals is directly related to the donation capacity of the hydrogen atom of a compound and is not only correlated with the redox potentials [
64]. These results are also due to the presence of a high content of polyphenolic compounds; there is a correlation between antioxidant activity and phenolic content [
65,
66]. The observed antioxidant potential of the extract may be related to the presence of different functional groups, such as hydroxyl and carbonyl groups [
67,
68]. Close results were obtained in other works, with 32.09% for an ethanolic extract obtained by ultrasonication at room temperature, the extract concentration of which was 0.05 mg/mL, and between 57.54% and 72.53% for an extraction performed with choline chloride and citric acid with stirring, at different time intervals and temperatures [
69]. Other results, (73.50% and 72.52%), were obtained for extraction by the ultrasonication method, and the solvent used was acrylonitrile [
70].
3.2. Identification and Quantification of Polyphenolic and Flavonoidic Compounds
The MS traces/spectra of the compounds that were found in the samples were compared with the specific mass spectra of each polyphenol that was recorded in a library. Only compounds identified based on their MS spectra were further quantified using the UV signal. Quantitative analyses were performed using the external standard method with five-point calibration curves ranging from 0.5–50 µg/mL, with good linearity (R
2 > 0.999). The quantification limit of this method was 0.5 µg/mL and the detection limit was 0.1 µg/mL [
47,
48,
50]. Seven polyphenolic compounds were identified in the extract of the RG plant (see
Figure S2) and their concentrations were expressed in μg/mL extract. In RG extract, the rutin compound was present in the highest amount of 745.179 μg/mL and, according to the scientific literature, this compound has antioxidant, anti-inflammatory, anticarcinogenic, antidiabetic, neuroprotective, antiallergic, antihypertensive, and other effects [
3,
71,
72]. Other polyphenolic compounds and flavonoids present in RG extract determined by HPLC-MS analysis included chlorogenic acid, at 1.308 μg/mL, p-coumaric acid, at 4.052 μg/mL, ferulic acid, at 3.692 μg/mL, synapic acid, at 9.338 μg/mL, isoquercetin, at 3.895 μg/mL, and quercetin, at 3.422 μg/mL. In other studies, other active compounds were identified in this species according to
Table 1.
In the following analyses, we will refer to the TFC content of the RG extract.
3.3. Entrapping Efficiency (EE%) Analysis
The results obtained when determining the entrapping efficiency of the CARG-Ms prepared by the first and second methods and after performing the calculations are presented in
Table 2.
Table 2.
Formulation and entrapping efficiency of RG extract in different microspheres.
Table 2.
Formulation and entrapping efficiency of RG extract in different microspheres.
| Samples | Concentration of Natural Polymer (%) | Amount of RG Extract (mL) | EE% |
|---|
| Ch | Na-Alg |
|---|
| m1_Ch01 | 0.1 | 0.75 | 5 | 31.99 ± 0.12 |
| m1_Ch02 | 0.2 | 0.75 | 5 | 33.33 ± 0.56 |
| m1_Ch04 | 0.4 | 0.75 | 5 | 35.68 ± 0.23 |
| m2_Ch01 | 0.1 | 0.75 | 5 | 70.33 ± 0.22 |
| m2_Ch02 | 0.2 | 0.75 | 5 | 72.77 ± 0.75 |
| m2_Ch04 | 0.4 | 0.75 | 5 | 75.31 ± 0.96 |
| E1 | 0.1 | 0.75 | - | - |
| E2 | 0.2 | 0.75 | - | - |
| E3 | 0.4 | 0.75 | - | - |
From the analysis of the data obtained, it can be seen that the highest entrapping efficiency of 75.31% was obtained in the case of the sample m2_Ch04, where the concentration of polymer was the highest (Ch 0.4%). The smallest amount of RG extract, approximately 31.99%, was introduced into sample m1_Ch01, prepared by method 1, which contained a concentration of 0.1% Ch. It can be concluded that, with an increase in the concentration of Ch in microspheres, the entrapping efficiency of the extract in CARG-Ms increased, regardless of the method chosen for their preparation. When comparing the two methods of microencapsulation, after the instillation operation for 1 h, with a constant rate of 0.5 mL/min and shaking at 100 rpm, it was observed that the microspheres prepared by method 1 encapsulated a smaller amount of extract than those prepared by method 2, although the drip rate and shaking time were the same in both methods (
Figure S3). This may be due to the fact that the microspheres formed by method 2 contained the extract inside the microsphere matrix, compared with the microspheres formed by method 1, where the extract was in the chitosan solution and had to pass through the alginate layer to reach the microspheres.
Previous studies have utilized the complex coacervation method to encapsulate rutin in microparticles of casein and pectin, resulting in an entrapment efficiency of 76.9% ± 6.3% [
77]. Similarly, the encapsulation of
Olea europea L. extract in microspheres of gelatin and tragacanth gum, using the same method, resulted in an entrapment efficiency of 60.74% ± 0.88 extract [
78]. On the other hand, the encapsulation of
Acalypha indica L. ethanolic extract into chitosan–casein microparticles resulted in an entrapping efficiency of 85.30 ± 4.10% [
79]. In another study,
Thymus vulgaris essential oil was encapsulated in gelatin B–gum Arabic microcapsules, resulting in an entrapment efficiency of 98.22% ± 0.22 [
80]. Furthermore,
Echinacea angustifolia L. extract was encapsulated in nanoparticles by an ionic gelation process that involved emulsifying chitosan and sodium alginate and then electrostatically gelation. The nanoparticles had an entrapment efficiency of 83.45% extract, and the concentrations of the polymers used were 0.06% Na-Alg and 0.05% Ch [
40].
3.4. Swelling Index (SWL%) Analysis
Microspheres were tested for their swelling index in media with five different pH levels (1.2, 3.0, 5.0, 6.8, and 7.4) for 8 h, according to
Figures S4–S7 and
Table 2 and
Tables S1–S5. According to
Table 3, microspheres prepared by method 2 swelled the least. The largest swelling was observed in the empty samples (E1, E2, and E3) and in the samples prepared by method 1 (m1_Ch01, m1_Ch02, and m1_Ch04). Another observation was that the variation in the chitosan concentration influenced the swelling index values. The samples that included 0.1% chitosan had a swelling index of 42,512.44–147,682.7% and those with 0.4% chitosan had an index of 24,487.56–105,008.6% in a pH medium of 7.4.
Following this study, it was observed that the swelling index decreased with increasing chitosan concentration in the microspheres, regardless of the pH medium applied, also decreasing the solubilization tendency of the microspheres. In acidic media, smaller swelling is observed than that in alkaline media due to ionic repulsion, minimal osmotic pressure, and because the amino groups in the chitosan structure were not protonated. In the
Supplementary Material (Tables S1–S5), the swelling index for all microspheres at different pH values is presented. Due to the fact that the swelling index was highest at pH 7.4 when, after 8 h, the microspheres could no longer be weighed because they began to disintegrate, the in vitro release study was performed at this pH, considering it to be the most appropriate.
Previous research has explored the swelling abilities of microspheres loaded with plant extracts in various pH environments. One study found that
Thymus serpyllum L. aqueous extract microencapsulated in chitosan microspheres using glutaraldehyde as a reticular agent had a higher percentage of swelling in a simulated gastric environment (pH 2.2) compared with a simulated intestinal environment (pH 6.8). However, the intestinal environment had a longer swelling period, and a high polymer concentration slowed the swelling process [
81]. Another study on
Cassia fistula L. ethanolic extract microencapsulated in chitosan microspheres found that they had a higher swelling index in acidic (pH 2.0) versus alkaline (pH 7.4) environments due to chitosan’s solubility in acidic conditions [
82].
3.5. Confocal Laser Scanning Microscopy Analysis
The determination of the roughness of the CARG-Ms was carried out using a 3D laser. The scanned surface showed 2560/2560 μm, the magnification that was used was ×108, and the warm colors represented the maximum areas and the cold colors represented the minimum areas, for example, the rugosity and depressions in the materials.
Several parameters referring to the roughness, texture, and appearance of microspheres could be measured using certain specific formulas [
83], and the values obtained are given in
Table 4 and
Figure S8.
The highest degree of rugosity was exhibited by the empty samples (E1), in which a smaller amount of polymers was used (0.1% Ch), and the lowest degree of rugosity was presented by sample m1_Ch04, in which the highest quantity of polymers was used (0.4% Ch). If a comparison is made between the two methods of preparation, the microspheres prepared by method 2 showed a higher degree of rugosity than those prepared by method 1. Following CLSM analysis, it was observed that the average roughness of microspheres varied between 5.83 and 19.79 μm, so the empty microspheres analyzed (E1, E2, and E3) showed the highest roughness values, followed by the microspheres prepared by method 2 (m2_Ch01, m2_Ch02, and m2_Ch04), and the lowest values were presented by the microspheres prepared by method 1 (m1_Ch01, m1_Ch02, and m1_Ch04). The high roughness value, obtained in the case of the microspheres prepared, could increase the contact surface of these microspheres and, in our opinion, this would accelerate the swelling process and, indirectly, the release of the pharmacological ingredients in vitro.
3.6. Scanning Electron Microscopy (SEM) Analysis
The microspheres were subjected to SEM analysis to find out more about their morphology. The morphology of the microspheres was influenced by the method by which they were prepared (
Figure 2). Thus, the microspheres prepared by method 1 showed a smoother appearance and less rough or creased surface (m1_Ch01, m1_Ch02, and m1_Ch04) compared with the microspheres prepared by method 2, which showed a more wrinkled, creased, and rough appearance (m2_Ch01, m2_Ch02, and m2_Ch04).
In previous research, it was observed that the surface of chitosan microspheres containing
Cassia fistula L. ethanolic extract appeared to be rough, rubbery, fibrous, and folded. This was in contrast to the microspheres without extract [
82]. Additionally, SEM images of certain chitosan and casein microparticles loaded with
Acalypha indica extract, which were produced through complex coacervation, displayed a porous and spherical appearance [
79].
3.7. Optical Scanning Analysis of CARG-Ms
For image processing, a custom application in MATLAB v2022b (CWL from MathWorks, Natick, MA, USA) was used. The results consisted of chromatic parameters: CIE L*a*b and the browning index (
Figure 3,
Figure 4,
Figure 5 and
Figure 6 and
Figures S9–S12, and Table S6). The b* chromatic parameter accommodates colors from blue (negative values) to yellow (positive values). L* is the lightness parameter and accommodates colors with dark (L* = 0) to intense (L = 100) hues.
Figure 3,
Figure 4,
Figure 5 and
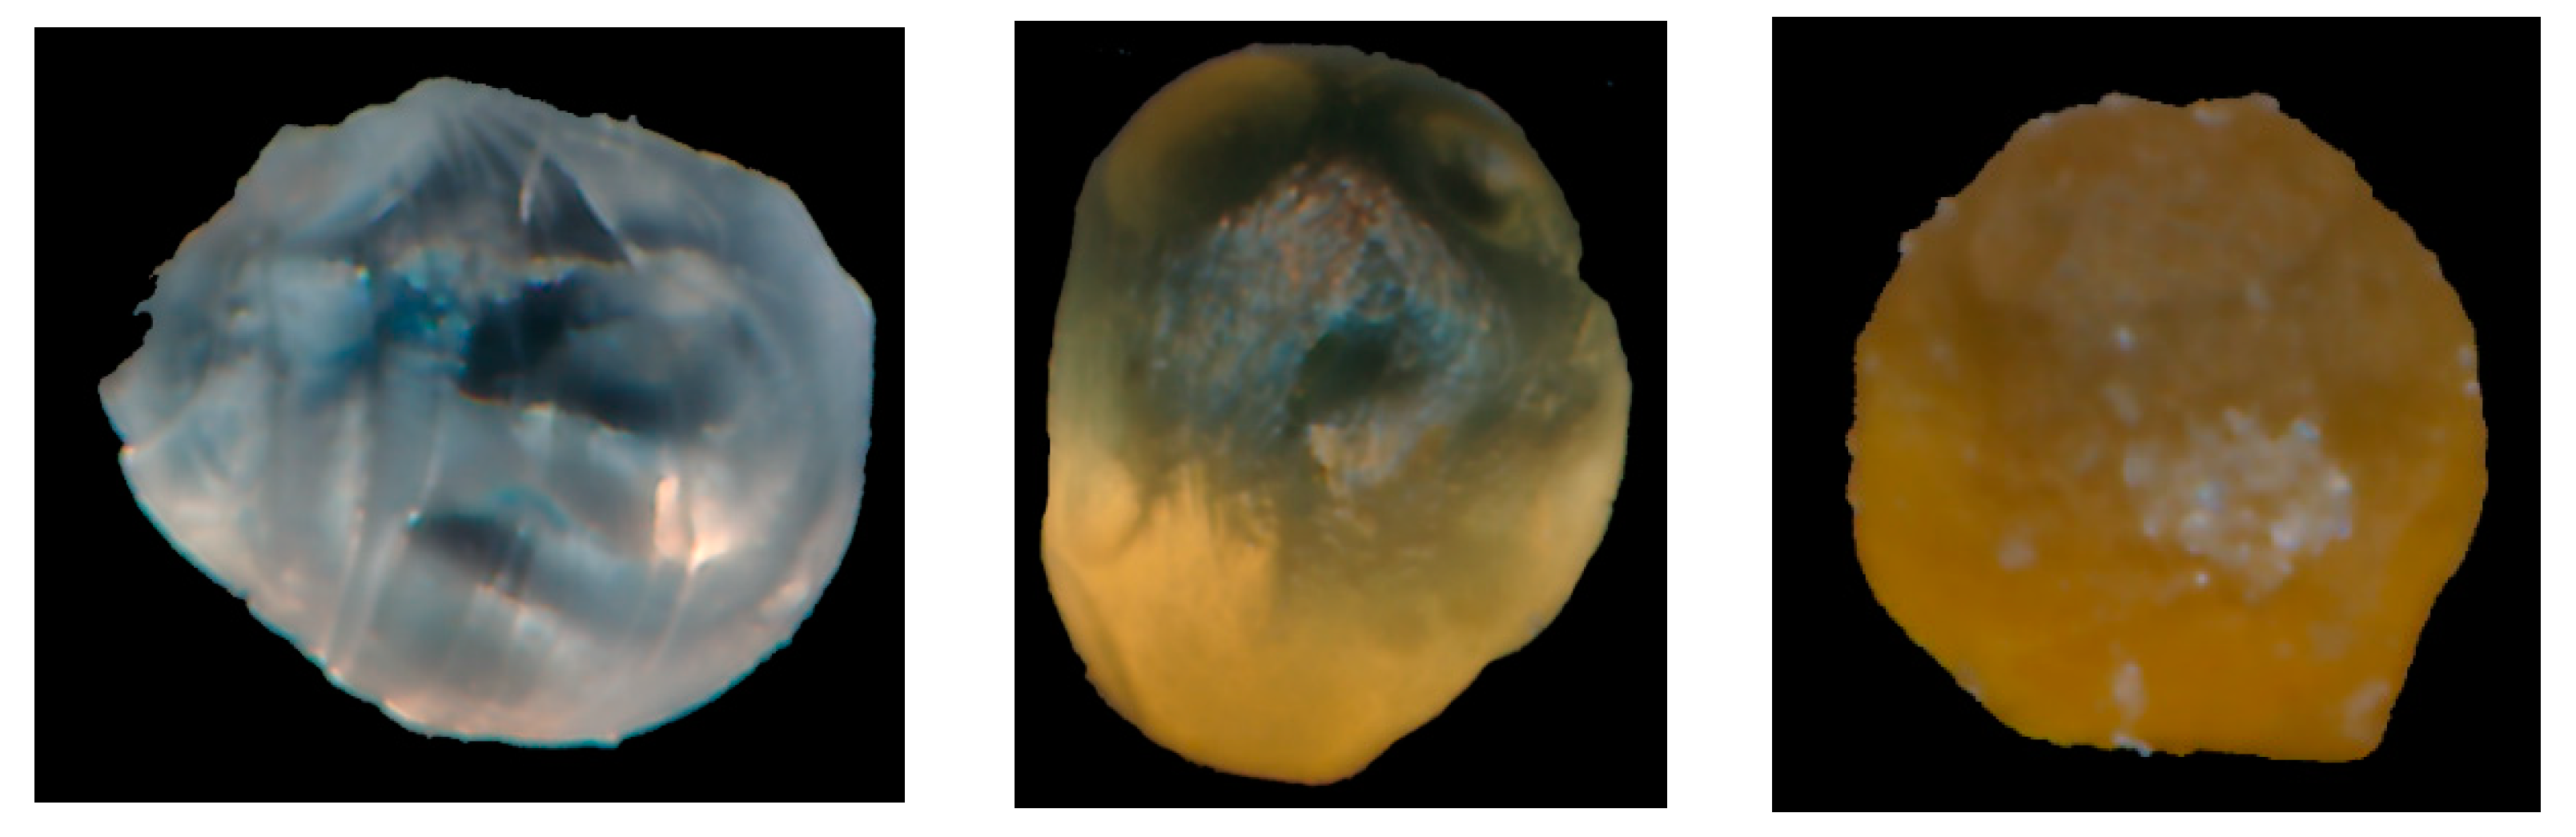
Figure 6 show an image processing example for the transmittance light and reflective light scanning cases. Each input image was composed of empty microspheres, microspheres prepared by method 1, and microspheres prepared by method 2 (images correspond from left to right). Both scan cases show almost the same visual and browning index-coded results (
Table S6).
The empty sample (with the leftmost positioning) is rendered in grey levels and looks to be the most transparent. The browning index for the empty samples tested under reflective light ranged from 1.6 to 5.1, the b* chromatic values ranged from −1.17 to 0.34, and the lightness of L* ranged from 23.8 to 28.2 (
Table S1). In conclusion, these samples exhibited a transparent blue color. In the same way, the empty samples tested under transmittance light were a lighter transparent blue (browning index ranged from 4.9 to 7.9, b* ranged from −0.51 to 0.02, and L* ranged from 28.2 to 38.4) than the empty samples tested under reflective light.
The sample prepared by method 1 (with focused positioning) was rendered in yellow–brown hues and had less transparency than E1. The browning index for the samples prepared by method 1 tested under reflective light ranged from 21.1 to 27.5. The b* chromatic values ranged from 8.4 to 11.7 and the lightness L* ranged from 18.3 to 21.8. In conclusion, the microspheres that were prepared by method 1 and were tested in reflective light presented a matt brown ochre color. In the same way, the samples prepared by method 1 tested under transmittance light presented a yellow ochre color (browning index ranged from 24.8 to 31.6, b* ranged from 5.75 to 6.17, and L* ranged from 30.25 to 34.4). Therefore, it showed a lighter color than the same samples tested under reflective light.
The sample prepared by method 2 (with rightmost positioning) was rendered in brown hues and had no transparency. The browning index for these samples under reflective light ranged from 62.6 to 66.5, the b* chromatic values ranged from 12.53 to 18.2, and the lightness L* ranged from 14.5 to 20.8. In conclusion, these samples presented a matt brown color. In the same way, under transmittance light, the samples presented a lighter brown ochre color (the browning index ranged from 50.4 to 55.6, b* ranged from 12.7 to 17.7, and L* ranged from 23.7 to 31.03) than the same samples tested under reflective light.
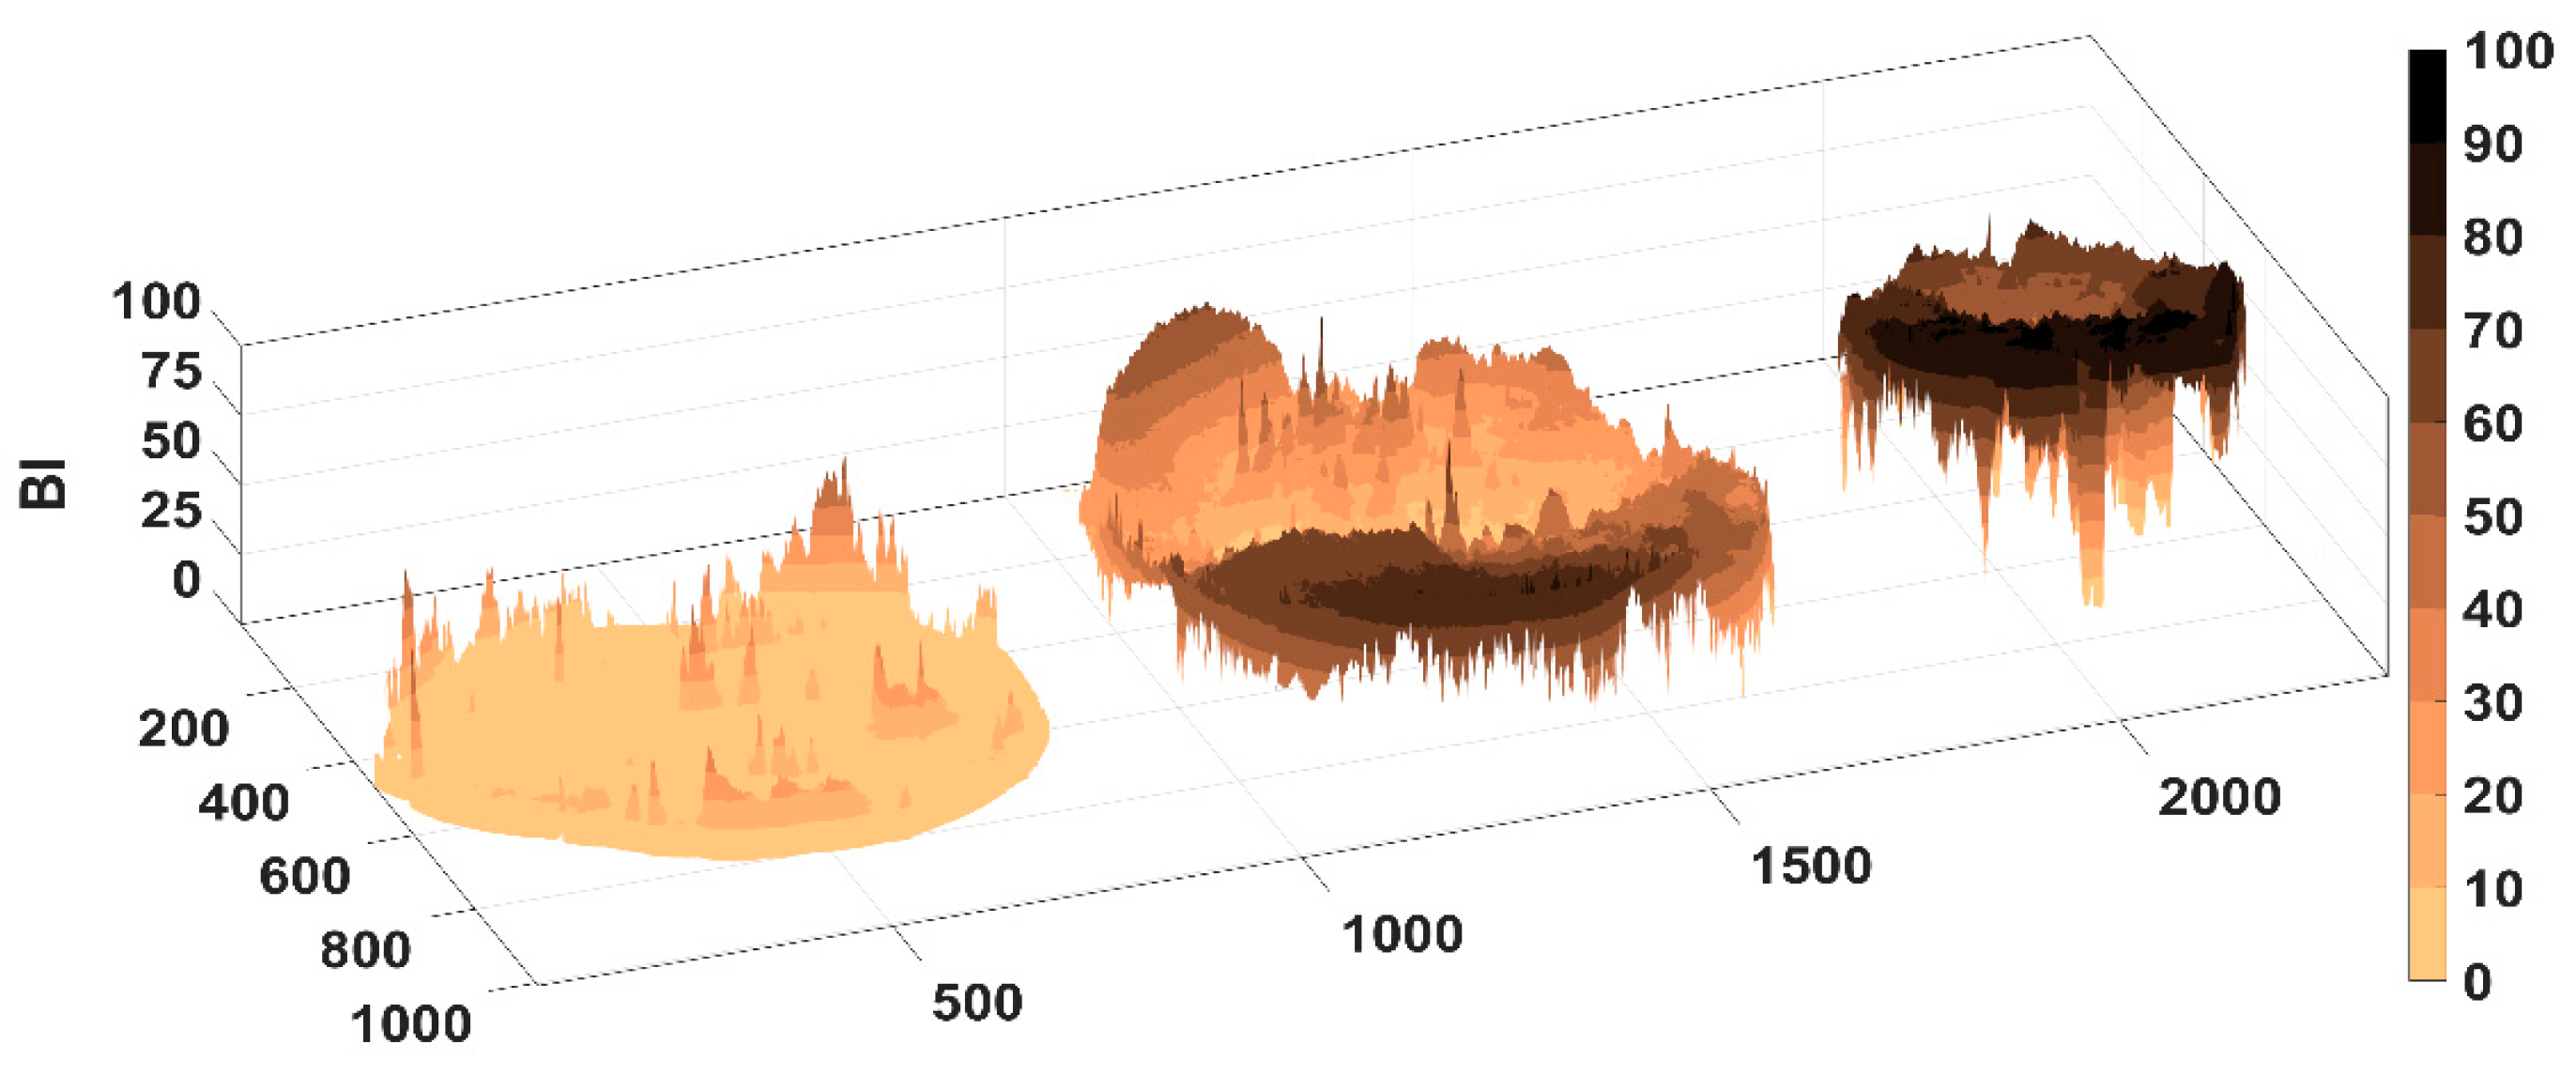
Figure 3 and
Figure 6 visually prove the previous conclusion by coding the browning index values of the analyzed samples. The browning index values increased from those of the empty samples tested under transmittance light and reflective light to those of the samples prepared by method 1 tested in transmittance light and reflective light, and further to those of the samples prepared by method 2 tested under transmittance light and reflective light.
3.8. Analysis of the In Vitro Extract Release
The in vitro release test of the microspheres loaded with RG extract was performed in phosphate buffer solutions with a pH of 7.4. The release capacity of the microspheres synthesized in simulated intestinal juice was determined at a temperature of 37 °C. As can be seen in
Table 5 and
Figure S13, the release of polyphenols from the microspheres was complete after 24 h.
Univariate statistical analysis demonstrated that, after 24 h, microspheres prepared using method 2 released a higher concentration of the entrapped extract (97.94%) compared with those prepared using method 1, which released a smaller concentration of extract (91.7%). Another observation was that microspheres with a higher concentration of chitosan (0.4%) released a smaller concentration of extract (51.19%) compared with those with a lower concentration of chitosan (0.1%), which released 57.55% extract. The rate of release of the extract from microspheres prepared using the two methods is represented in
Figure S14a,b, and, as can be seen, was different and occurred in two stages: the first stage showed a rapid release of the extract from the microspheres, followed by the second stage, where a slow release of the extract occurred by the end of the 24 h.
The dissolution medium used affected both the chitosan and sodium alginate molecules, causing the ionization of the carboxyl groups of sodium alginate. Additionally, the deprotonation of sodium alginate caused the swelling of the complex network of microspheres, leading to the disintegration of microspheres and the complete release of the extract [
84,
85]. Therefore, at pH 7.4, microspheres could swell to their maximum capacity, disintegrate, and release the entire amount of entrapped extract within 24 h. Simultaneously, a uniform and rapid hydration of microspheres occurred, forming a gel barrier in a uniform layer where the diffusion process of the extract took place [
85].
According to previous studies,
Acalypha indica L. extract release from chitosan–casein microparticles was more effective at a pH of 5 compared with those at pH levels of 7 and 10. This is because microparticles have a rigid and hydrophobic core in an alkaline environment [
79]. In another study,
Cassia fistula L. ethanolic extract from chitosan microspheres was tested in media with two different pH levels: acid, at 2.0, and alkaline, at 7.4. The results showed that the release was more efficient at pH 2.0 due to the higher solubilization tendency of Ch in this medium. The release decreased as the concentration of Ch in the matrix increased [
82]. Similarly, rutin was encapsulated in microparticles of casein and pectin by the complex coacervation method, which released 81.82% ± 9.58 of rutin in a simulated intestinal environment, within 10 h [
77]. Microspheres loaded with Ch and Na-Alg, as well as polyphenols extracted from
Camelia sinensis L., underwent an in vitro release test. It was found that, after 6 h of exposure to an alkaline medium (pH 7.4), they released over 90% of the extract, whereas exposure to an acidic medium with pH 1.2 resulted in insignificant release [
86]. In a different study, the release of
Viola odorata L. extract from Ch and Na-Alg microcapsules occurred in two phases in both acidic (pH 1.5) and alkaline (pH 7) environments. Rapid release occurred in the first 40 min, followed by sustained release until the end of the experiment. The microparticles released a higher amount of extract in the pH 7 medium (95.39%) compared with the pH 1.5 medium, where they released 43.21%. In the acidic environment, the carboxyl groups in the Na-Alg structure were transformed into acid due to the acidic pH. This transformation favored the formation of alginic acid that prevented the release of the basic substance from the microcapsule [
87].
Regarding the release capacity of the extract from microspheres, analysis of variance (ANOVA) was used to statistically evaluate the samples in terms of the main effect (
Figure S15), taking into account certain statistical factors, including the preparation method, the concentration of chitosan, the swelling time, and the samples. According to the ANOVA analysis, the dotted red line denotes the mean design of experiments (DOE) for the release parameter. Among the factors analyzed, the time factor generated the highest variance in DOE (method 2), followed by the method factor, and, finally, the Chitosan factor. Another observation was that the microspheres prepared by method 2 presented the best results among all the tests to which they were subjected to and were the most suitable for future in vivo tests.
The results of the non-linear regressions, whose statistical performances were the best, are presented in
Table 6. Among the non-linear regression functions, the one accepted by the statistical comparison procedure was the sigmoidal allosteric one. All samples showed very high values of the coefficient of determination (R
2 > 0.998), denoting the accuracy of the practical execution of the in vitro release experiment.
3.9. Multivariate Statistical Analysis
The stated objective of the multivariate analysis performed was to determine the correct number of clusters and their composition in order to be able to explain the multivariate dynamics of swelling, entrapping, and the in vitro release capacity of the extract from the analyzed microsphere samples.
In the multivariate PCA sequence, only the principal components (PC)—PC1, PC2, and PC3—were taken into account. These components describe more than 85% of the total variance in DOE. The graphics in 2D and 3D were produced from all the main components, PC1–PC17. The objective of this analysis was to compare and delimit the components to determine which presented the best results in terms of entrapping, in vitro release, the swelling index, and roughness. In
Figure S16c, it can be seen that the samples prepared by method 2 showed the highest values in the entrapping efficiency, roughness, and in vitro release tests, and the lowest values in the swelling index. To achieve a clearer separation of the components, the linear discriminant analysis (LDA) test was applied. The coordinates of each variable in the PCA were used as input data for this test. From the graphs obtained (
Figure S17), a clearer spacing of the components was observed, but since this method did not have statistical significance either, it was not possible to correctly generate sample clusters. With this in mind, the MANOVA test with a statistical significance threshold of
p = 0.05 was applied, with the option of generating the multiple-sample comparison. Through the MANOVA analysis of each sample, the correct number and composition of the clusters were generated, and this can be seen in
Table 7 and
Table 8. Finally, obtaining six clusters, the clustering dendrogram is presented in
Figure S18 and the clustering heatmap chart is presented in
Figure S19.
From all the numerical and graphical results of LDA and MANOVA (p = 0.05), it can be seen that all the initial Method * Chitosan samples generated singleton clusters. In this way, everything that was previously stated about the Method * Chitosan samples is now validated with 95% accuracy.
4. Conclusions
After analyzing the studies carried out, it can be observed that there were differences between the CARG-Ms prepared by method 1 and those prepared by method 2. The microspheres prepared by method 2 presented a higher degree of roughness, a higher entrapping efficiency (75%), a wrinkled appearance, better in vitro release capacity, and a lower swelling index. For all of the microspheres prepared, it was observed that the EE% varied directly proportionally to the amount of chitosan used and the swelling index, while the in vitro release varied inversely proportionally to the amount of chitosan used.
In the case of the microspheres prepared by method 2, the erosion and breakage phenomena of the microspheres appeared after 8 h of swelling in the simulated intestinal environment with a pH of 7.4. With an increase in the swelling index value, the rate of in vitro release of the extract also increased due to the hydrophilic nature of the polymeric matrix that had the ability to absorb water with the passage of time, protecting the extract from enzymatic degradation in the gastrointestinal tract. The advantage for the patient is that the extract’s release in a controlled manner from the polymeric matrix ensures more efficient absorption and increased bioavailability of the active substances, which can lead to greater treatment efficacy. Furthermore, protecting the extract from enzymatic degradation in the gastrointestinal tract can be beneficial for maintaining the stability and effectiveness of active substances in the body.
In contrast, the microspheres prepared by method 1 had a faster swelling rate; thus, a faster release of the extract was achieved because the EE% was smaller (35%). Based on the results obtained to determine the swelling index and the in vitro release capacity, the microspheres prepared by method 2 were found to be more effective than those prepared by method 1. This makes them much more suitable for future in vivo studies. Through the complex coacervation method, we managed to protect the Ruta graveolens L. extract from external degradation and internal degradation by the gastrointestinal tract. This system can also be used to produce new oral pills capable of reaching the small intestine, where they can release the encapsulated active compounds.


 ,
, 


