


An Updated Earthquake Catalogue in Crete Derived by the Development of Local 1D Velocity Models and Hypocentre Relocation


Abstract
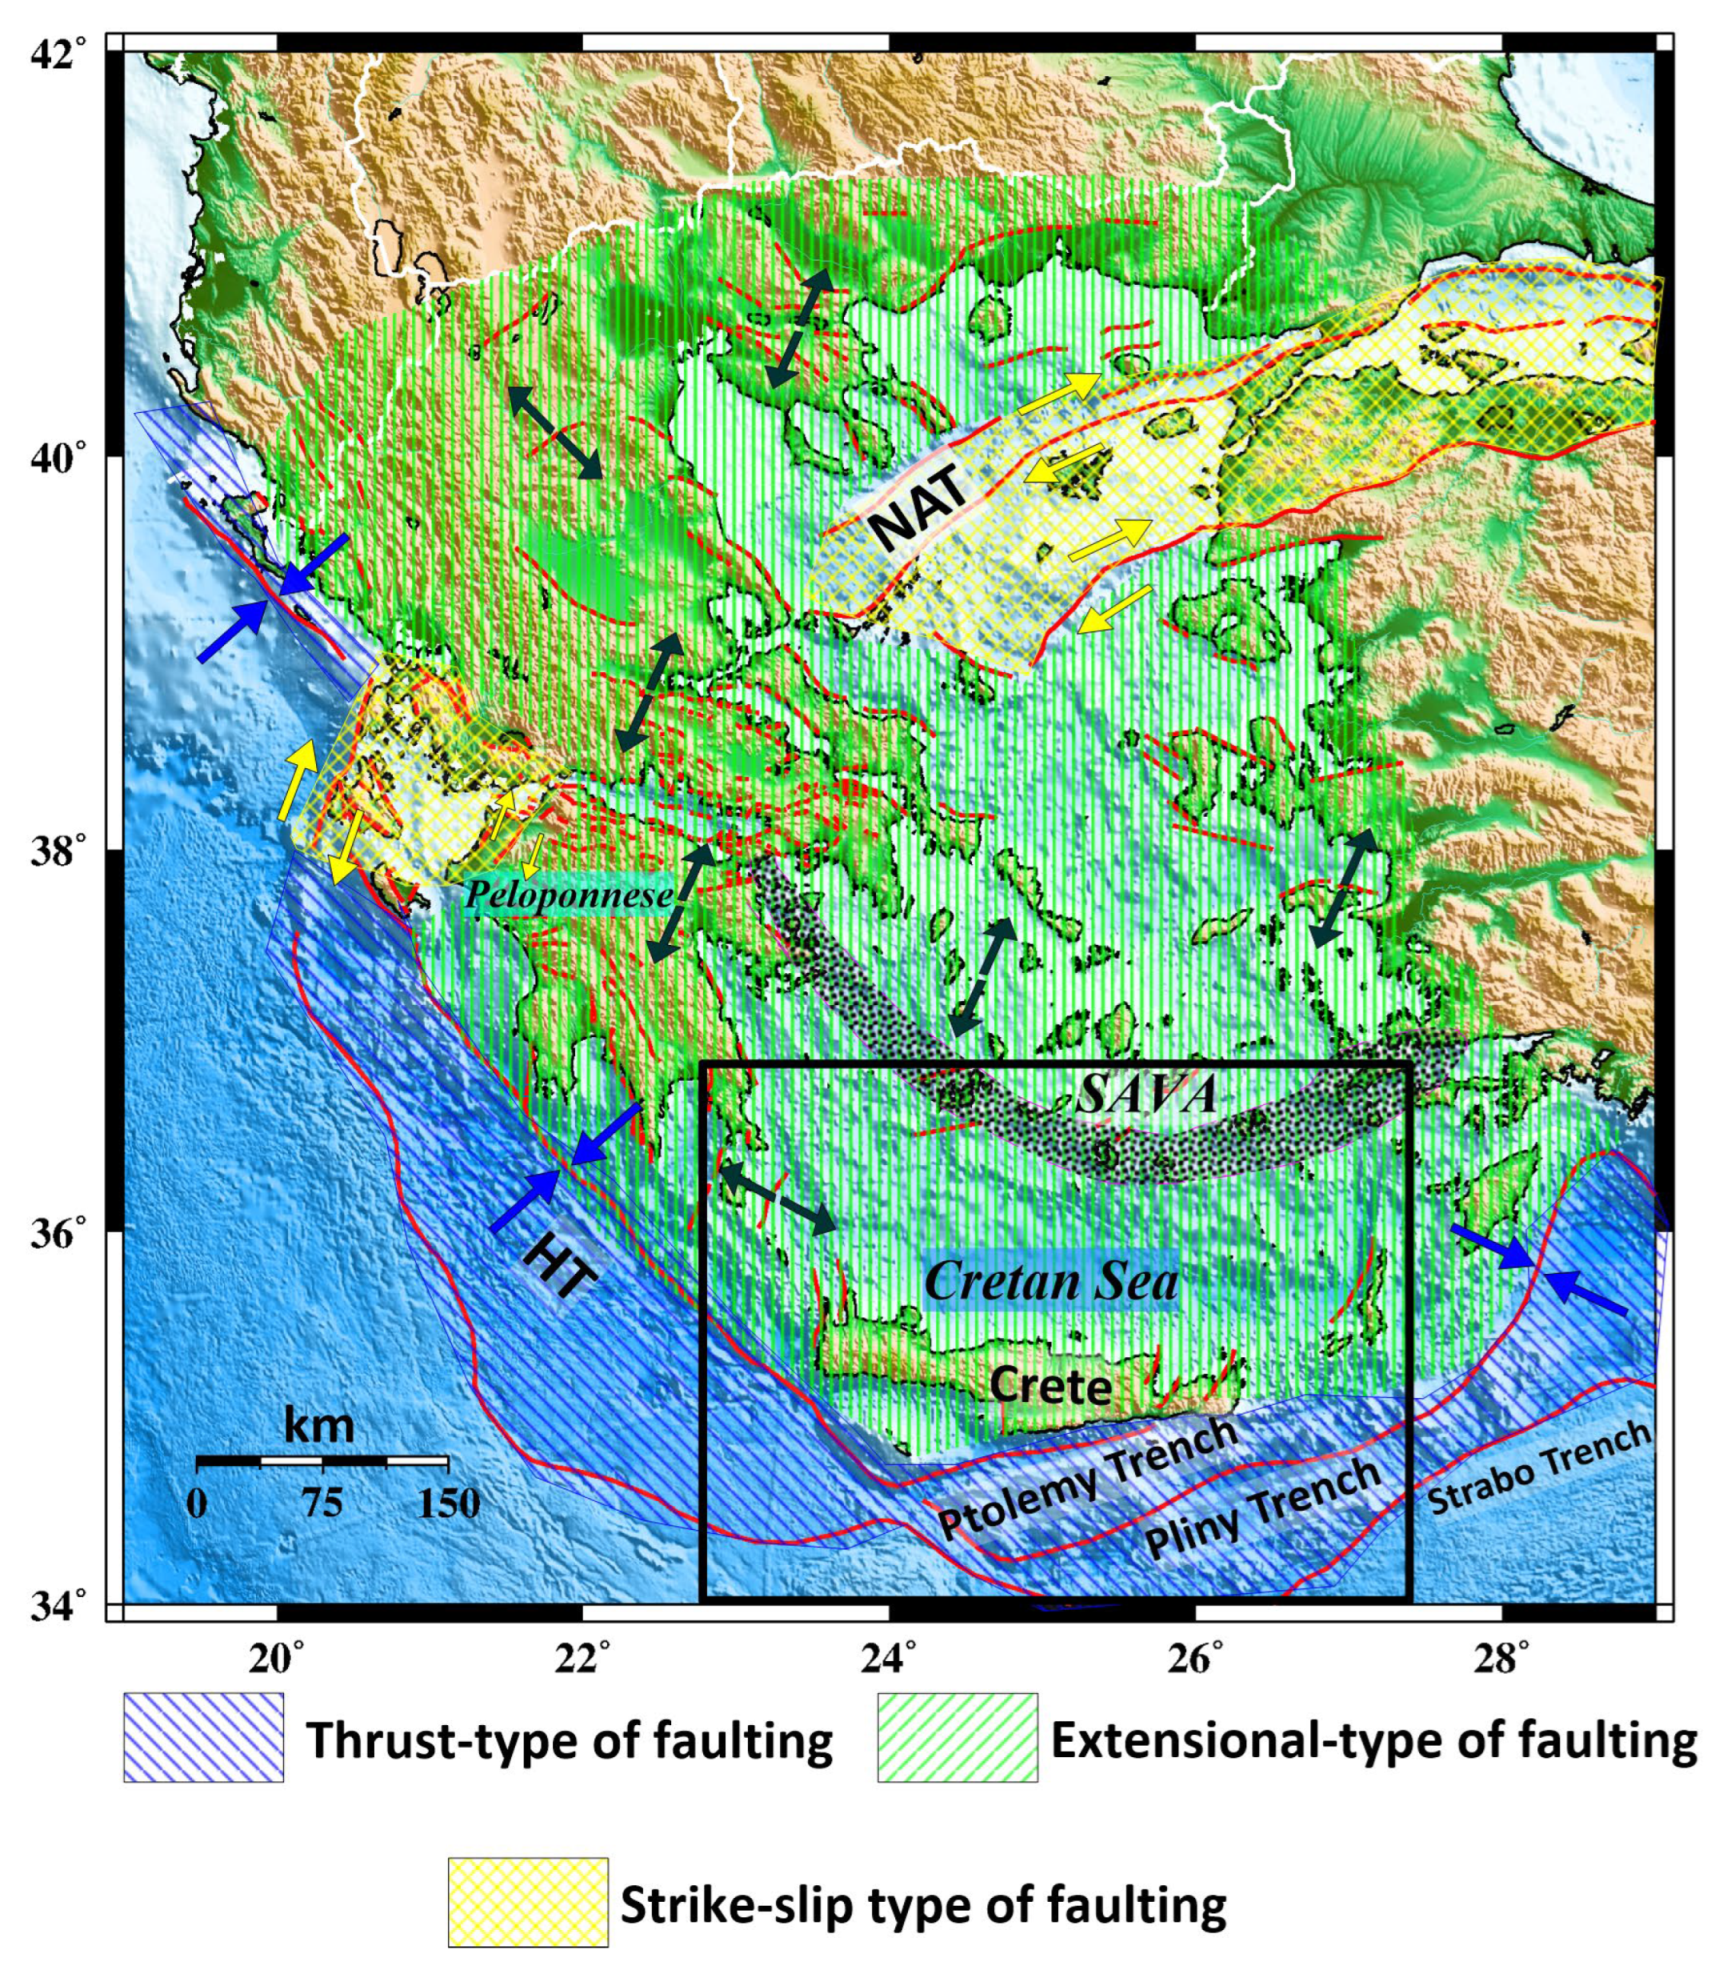
:1. Introduction
2. Materials and Methods
2.1. Seismological Data
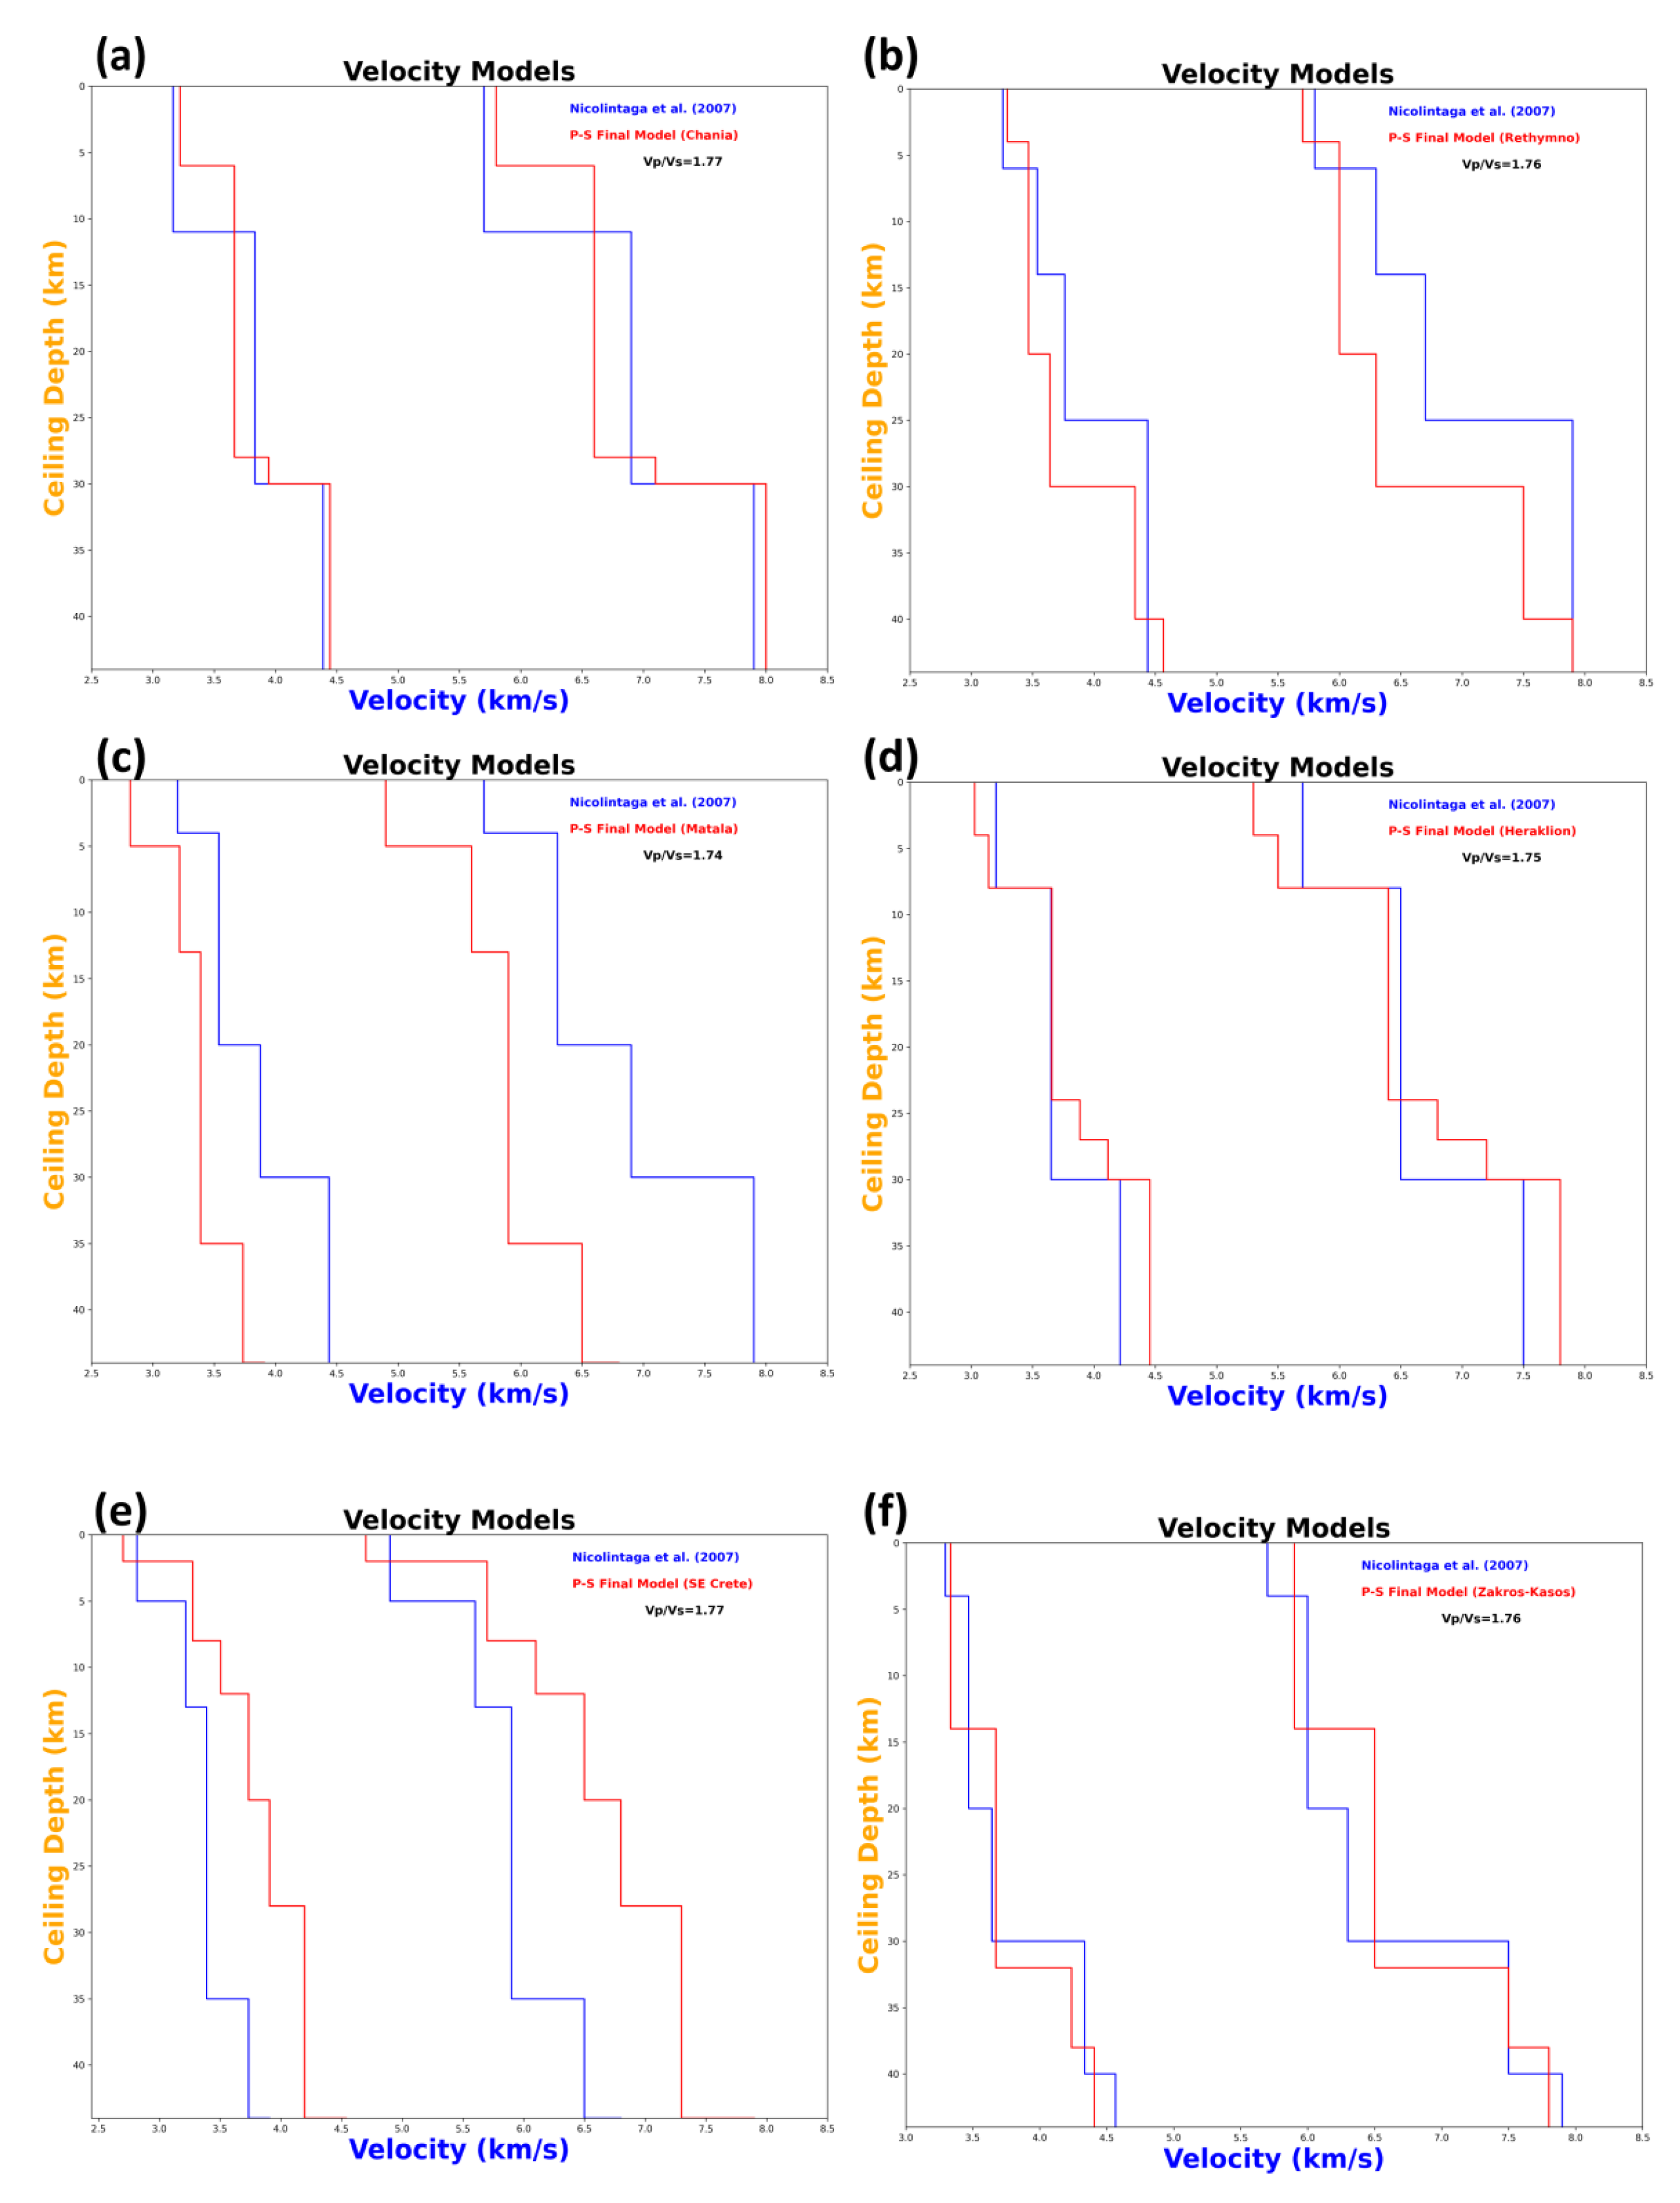
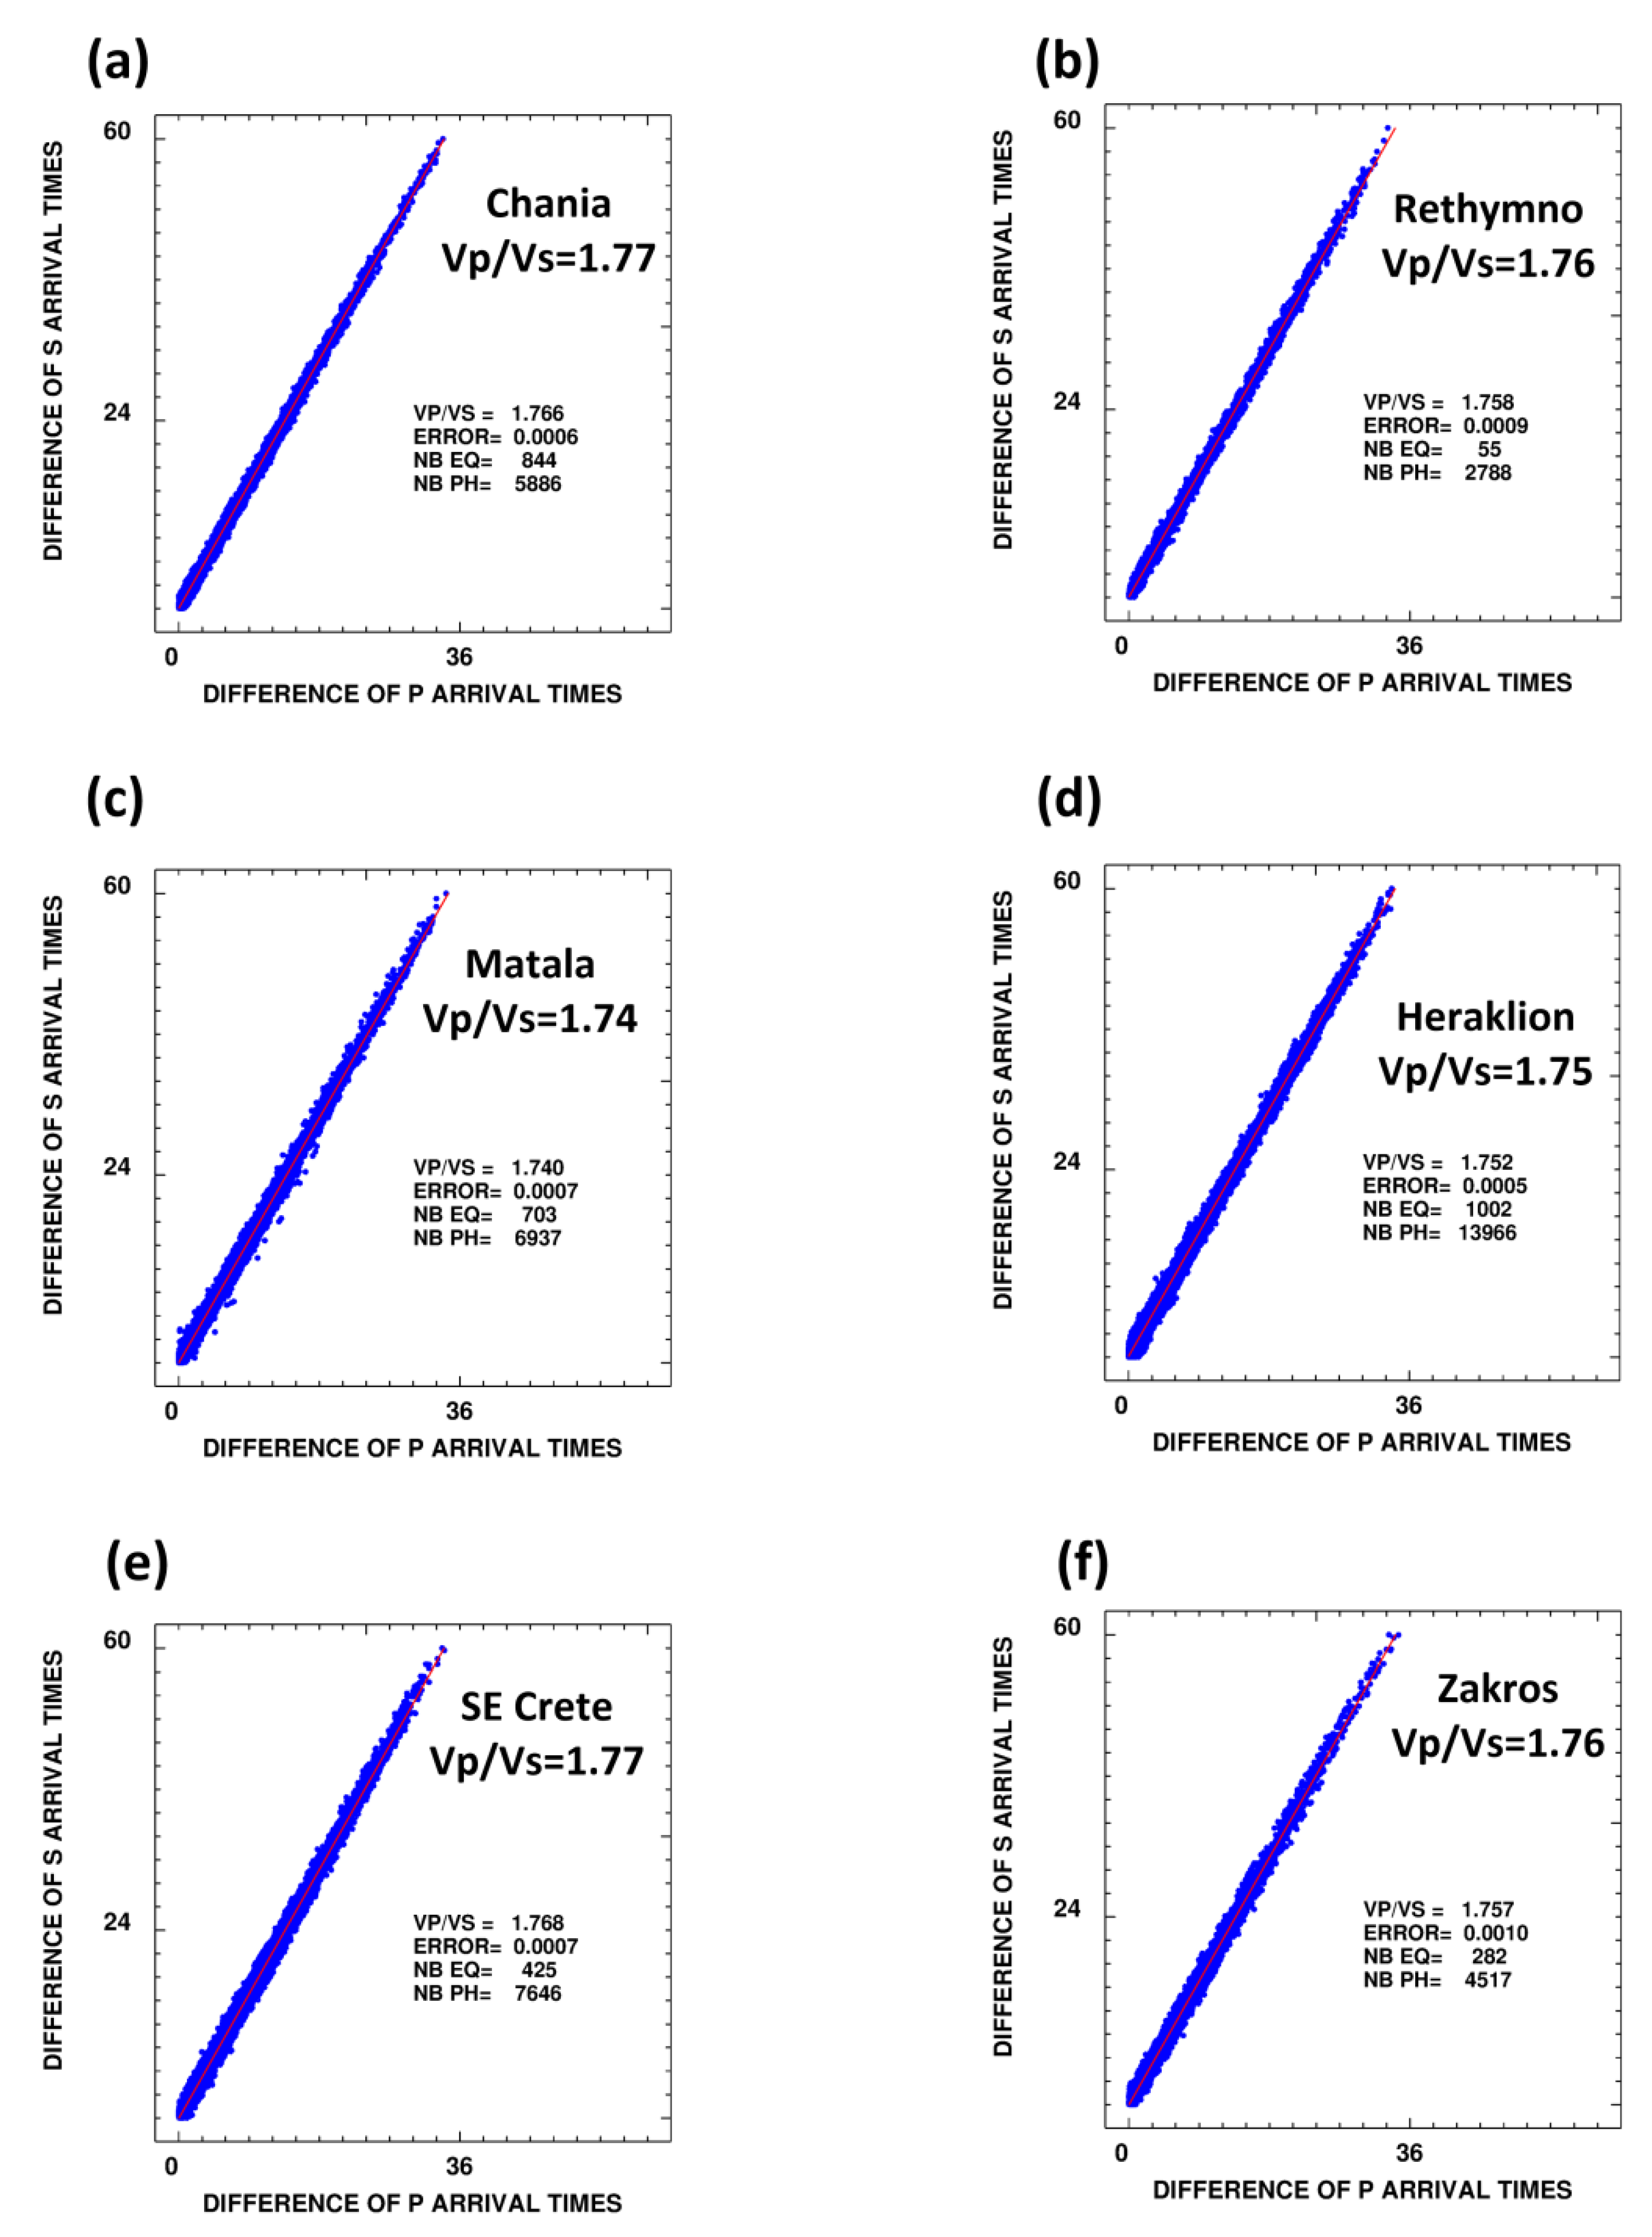
2.2. Estimation of the Local 1D Velocity Models
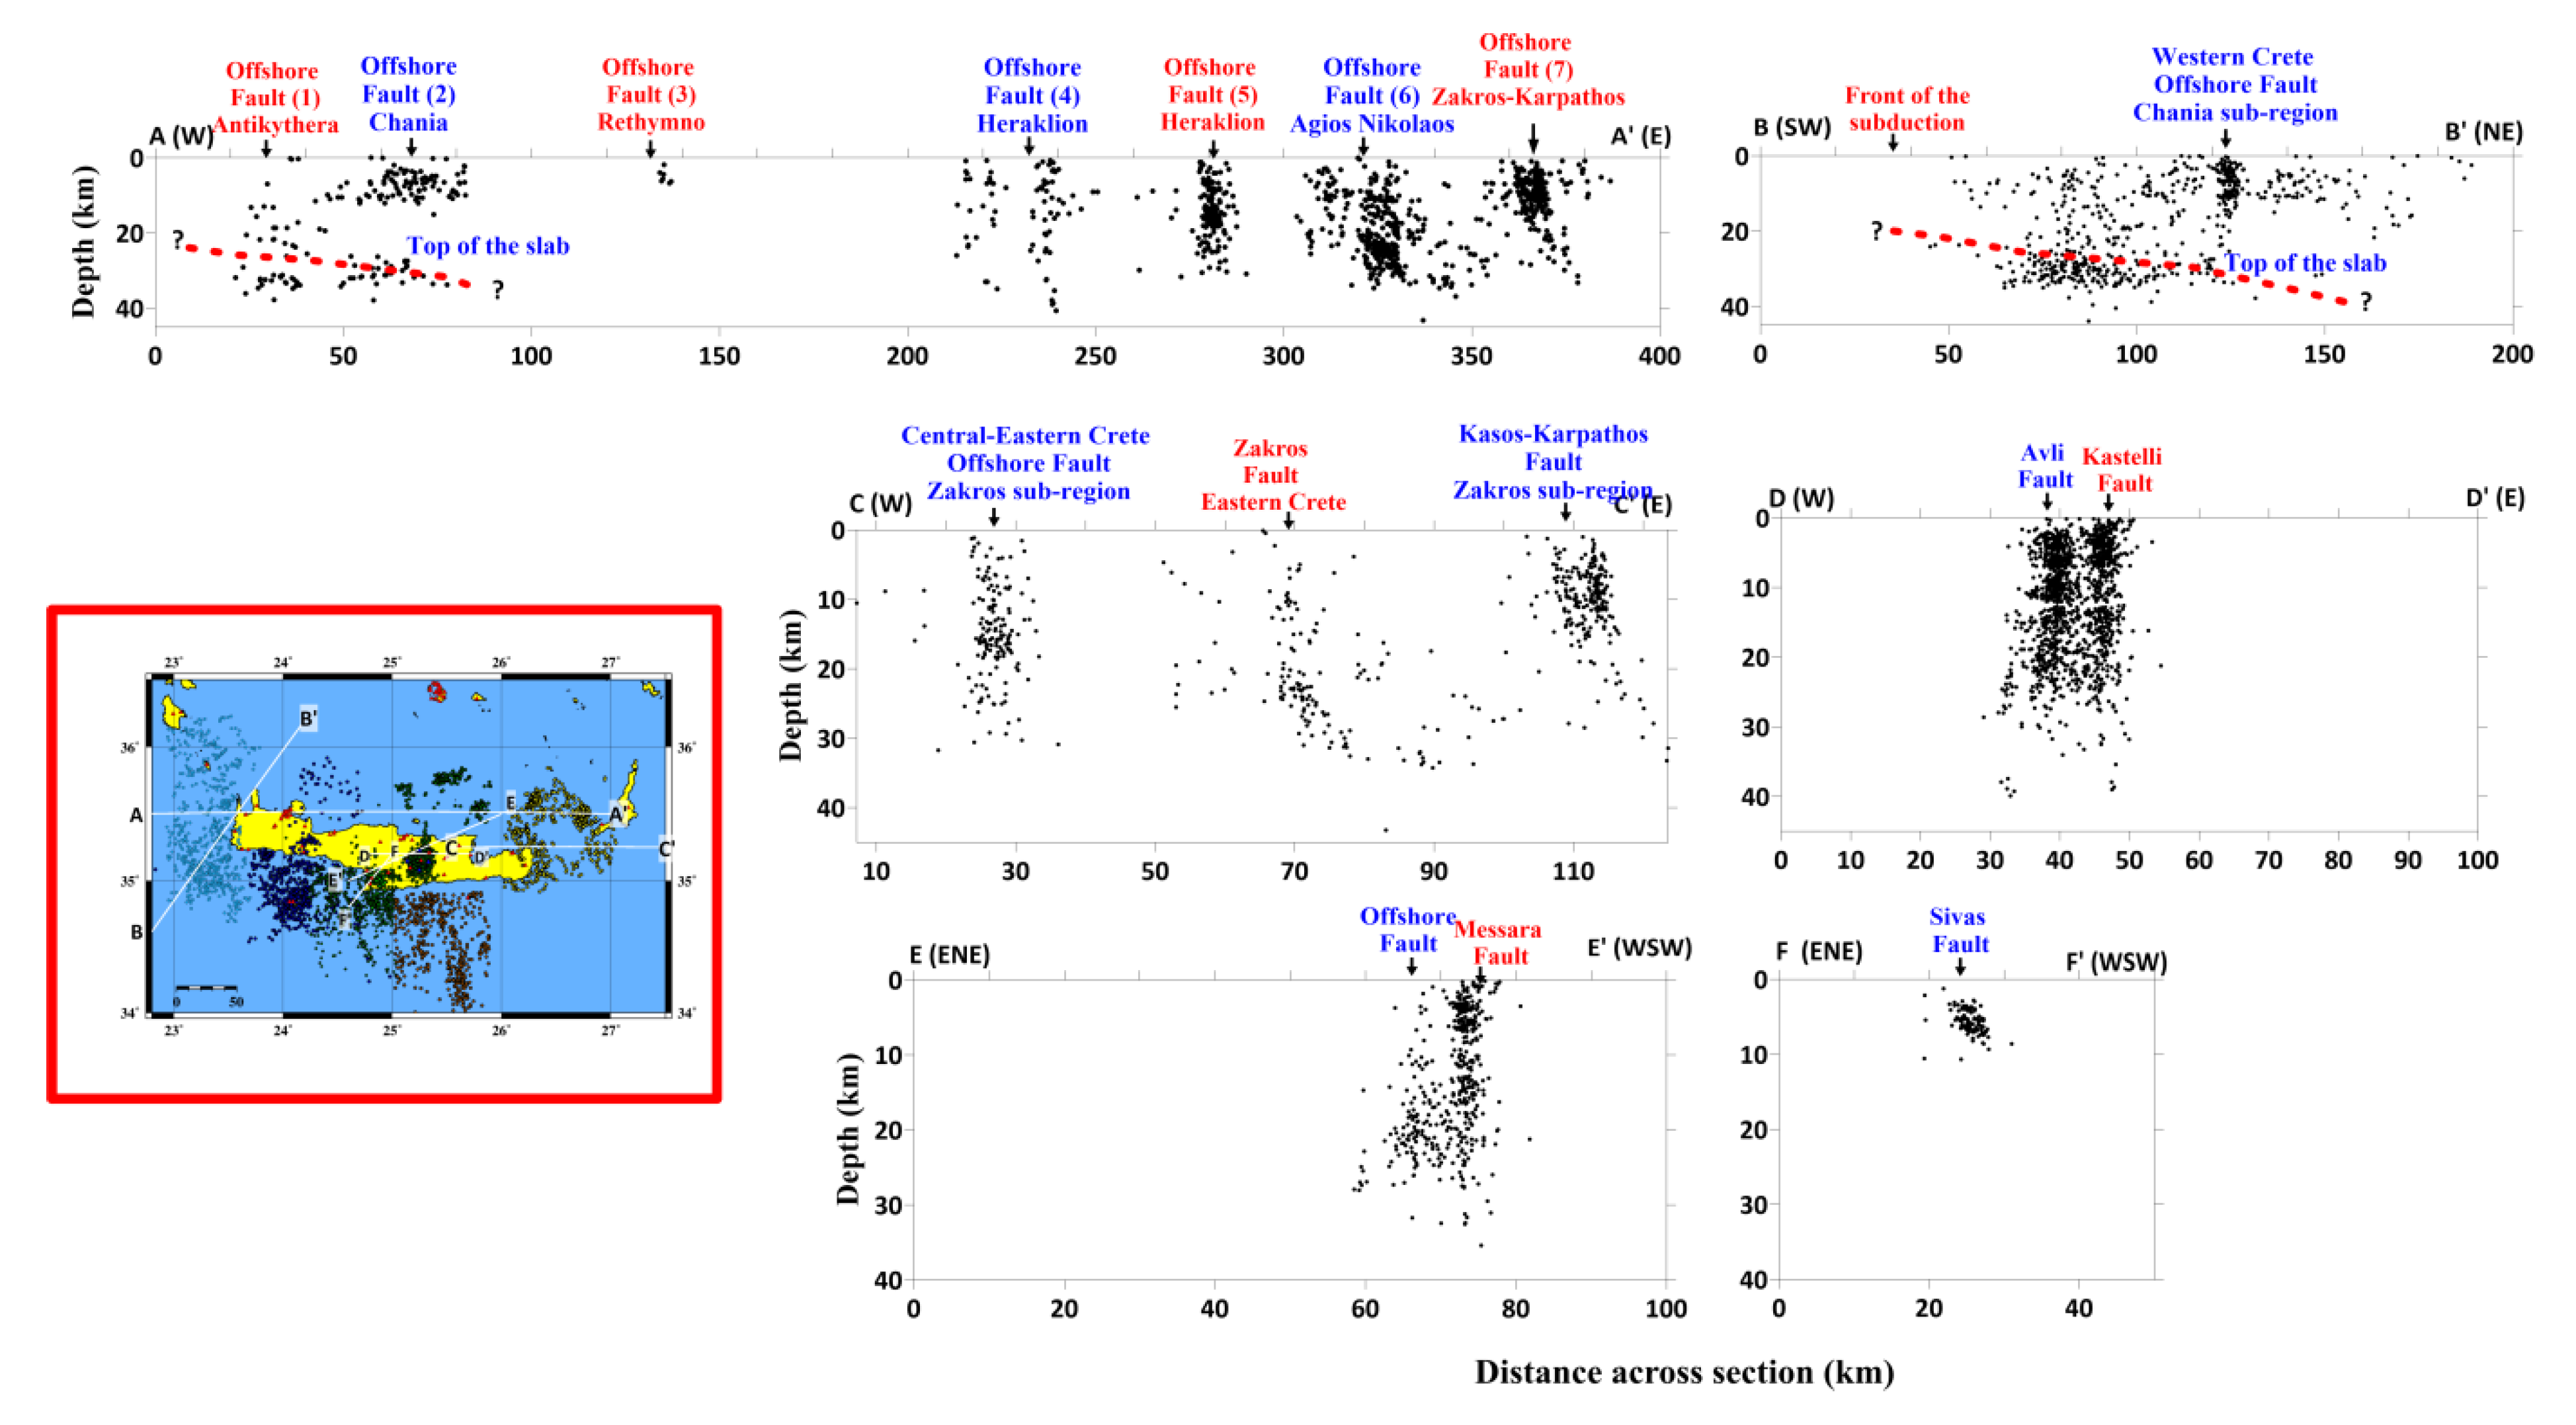
- Chania-Antikythera region (area 1; 1882 events).
- Rethymno area (area 2; 498 events).
- Matala—Ptolemy Trench (area 3; 858 events).
- Central Crete-Heraklion basin (area 4; 2321 events).
- SE Crete—Pliny Trench region (area 5; 1096 events).
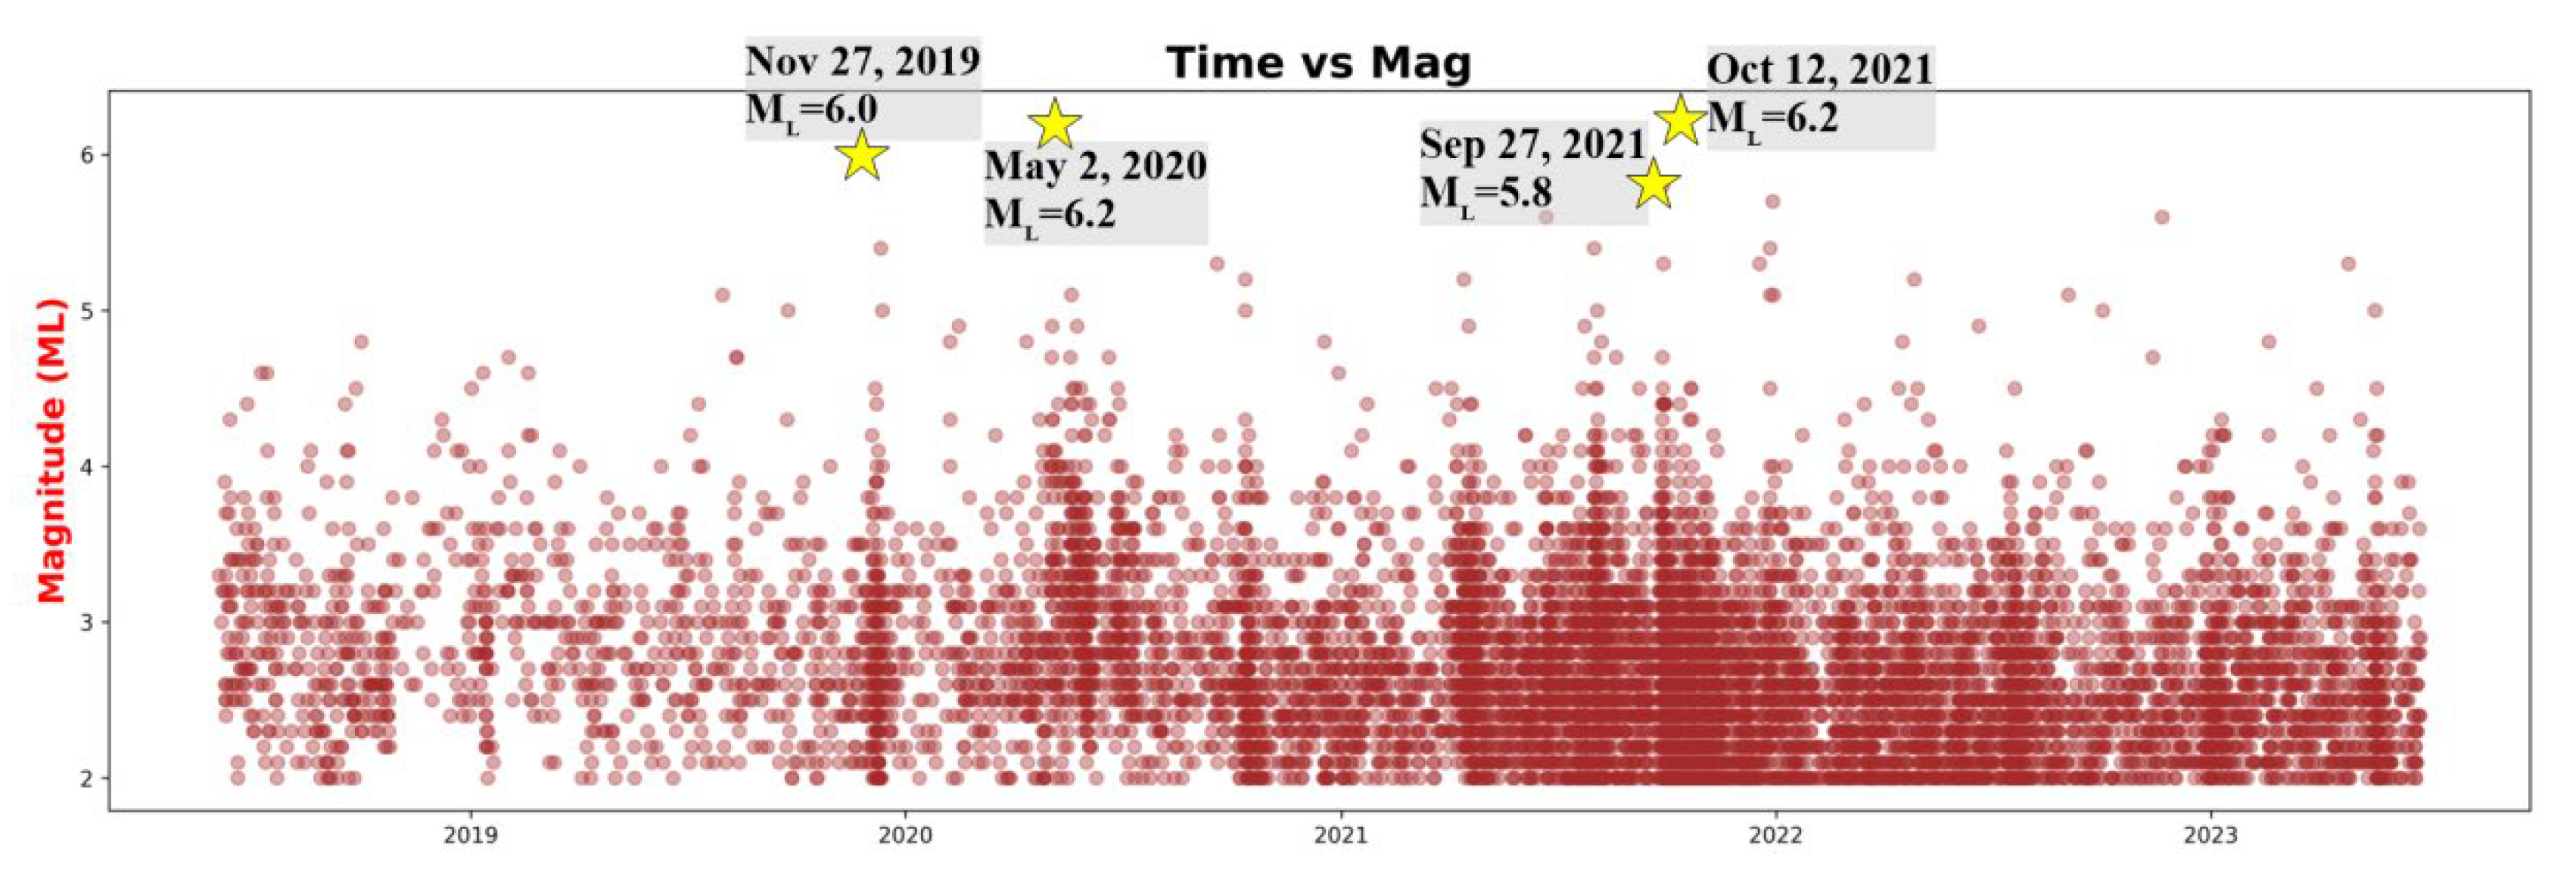
- Zakros—Karpathos region (area 6; 1648 events), where the 12 October 2021, ML = 6.2 event took place.
2.3. Double-Difference Algorithm (HypoDD)
3. Results
3.1. Local 1D Velocity Models and Location of the Seismic Catalogue
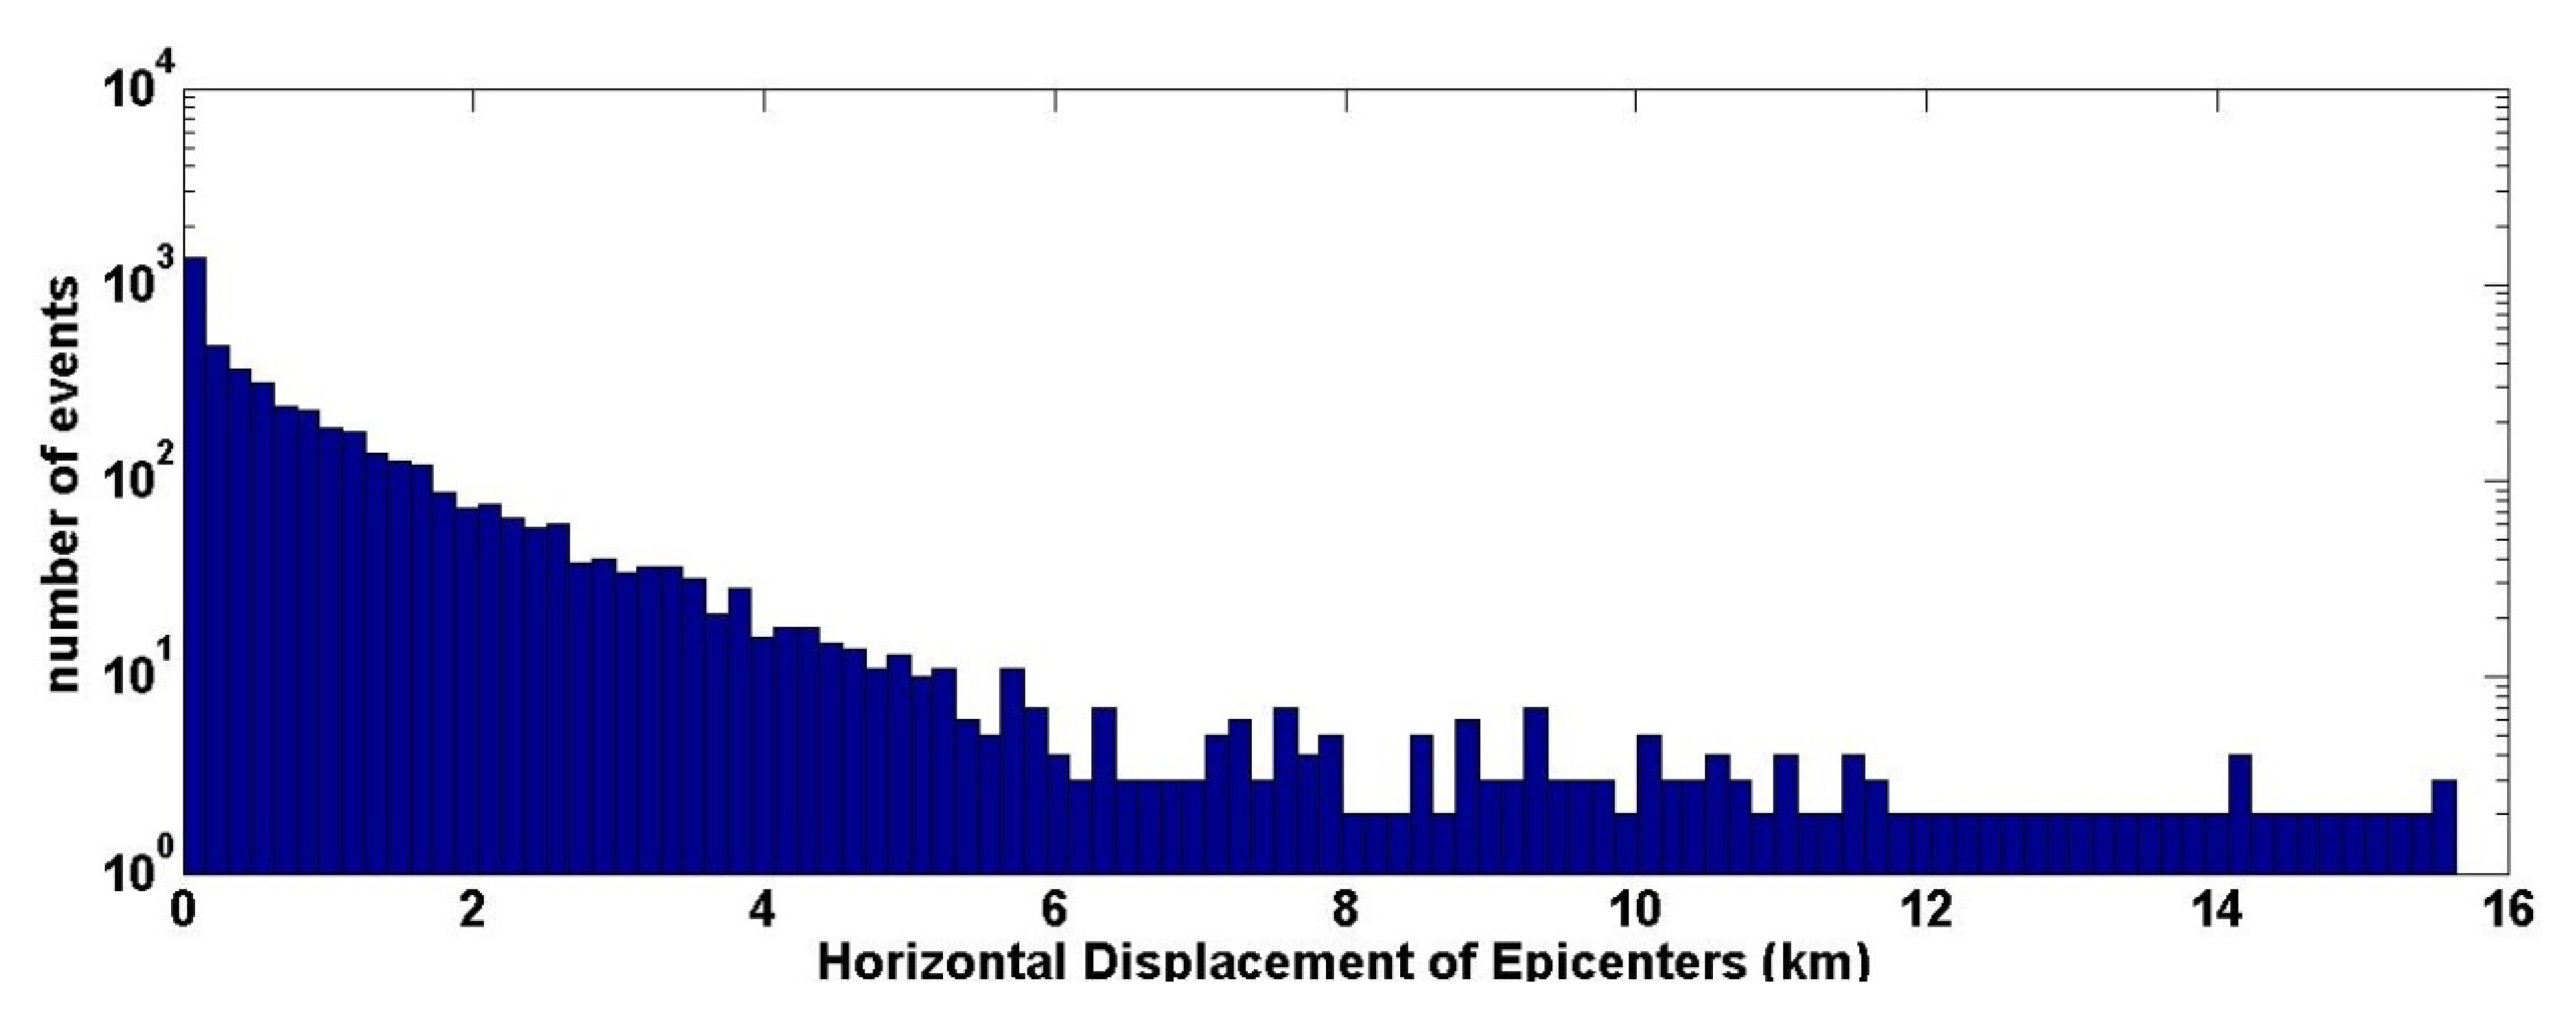
3.2. Relative Locations (hypoDD) of the Seismic Catalogue
4. Summary—Conclusions
- A complex shallow structure in Crete’s central region mainly attributed to the dense pattern of neotectonic faults;
- A smoother and more continuous image in deeper slices (>40 km) where high VP/VS ratio (>1.82) distribution is observed.
Supplementary Materials
Author Contributions
Funding
Institutional Review Board Statement
Informed Consent Statement
Data Availability Statement
Acknowledgments
Conflicts of Interest
References
- Delibasis, N.; Drakopoulos, J.K.; Fytrolakis, N.; Katsikatsos, G.; Makropoulos, K.C.; Zamani, A. Seismotectonic Investigation of the area of Crete Island. In Proceedings of the International Symposium on the Hellenic Arc and Trench (HEAT), Athens, Greece, 8–10 April 1981; Volume 1, pp. 121–138. [Google Scholar]
- Drakopoulos, J.; Delibasis, N. The focal mechanism of earthquakes in the major area of Greece for the period 1947–1981. Seismol. Lab. Univ. Athens Publ. 1982, 2, 1–72. [Google Scholar]
- Ganas, A.; Oikonomou, I.A.; Tsimi, C. NOAfaults: A digital database for active faults in Greece. Bull. Geol. Soc. Greece 2017, 47, 518–530. [Google Scholar] [CrossRef]
- Kiratzi, A.; Benetatos, C.; Vallianatos, F. Seismic deformation derived from moment tensor summation: Application along the Hellenic Trench. In Moment Tensor Solutions; D’Amico, S., Ed.; Springer: Cham, Switzerland, 2018. [Google Scholar] [CrossRef]
- McKenzie, D. Active tectonics of the Alpine-Himalayan belt: The Aegean Sea and surrounding regions. Geophys. J. R. Astr. Soc. 1978, 55, 217–254. [Google Scholar] [CrossRef]
- Le Pichon, X.; Angelier, J. The Hellenic Arc and trench system: A key to the neotectonic evolution of the eastern Mediterranean area, 1979. Tectonophysics 1979, 60, 1–42. [Google Scholar] [CrossRef]
- Papazachos, B.C.; Papazachou, C. The Earthquakes of Greece; Ziti Publishing: Thessaloniki, Greece, 2003; p. 286. (In Greek) [Google Scholar]
- Jackson, J.A.; White, N.J. Normal faulting in the upper continental crust: Observations from regions of active extension. J. Strucr. Geol. 1989, 11, 15–36. [Google Scholar] [CrossRef]
- Le Pichon, X.; Chamot-Rooke, N.; Lallemant, S. Geodetic determination of kinematics of central Greece with respect to Europe: Implications for eastern Mediterranean tectonics. J. Geophys. Res. 1995, 100, 12675–12690. [Google Scholar] [CrossRef]
- McClusky, S.; Balassanian, S.; Barka, A.; Demir, C.; Ergintav, S.; Georgiev, I.; Gurkan, O.; Hamburger, M.; Hurst, K.; Kahle, H.; et al. Global Positioning System constraints on plate kinematics and dynamics in the eastern Mediterranean and Caucasus. J. Geophys. Res. 2000, 105, 5695–5719. [Google Scholar] [CrossRef]
- Briole, P.; Ganas, A.; Elias, P.; Dimitrov, D. The GPS velocity field of the Aegean. New observations, contribution of the earthquakes, crustal blocks model. Geophys. J. Int. 2021, 226, 468–492. [Google Scholar] [CrossRef]
- Reilinger, R.; McClusky, S.; Paradissis, D.; Ergintav, S.; Vernant, P. Geodetic constraints on the tectonic evolution of the Aegean region and strain accumulation along the Hellenic subduction zone. Tectonophysics 2010, 488, 22–30. [Google Scholar] [CrossRef]
- Caputo, R.; Catalano, S.; Monaco, C.; Romagnoli, R.; Tortorici, G.; Tortorici, L. Active faulting on the island of Crete (Greece). Geophys. J. Int. 2010, 183, 111–126. [Google Scholar] [CrossRef]
- Shaw, B.; Jackson, J. Earthquake mechanisms and active tectonics of the Hellenic subduction zone. Geophys. J. Int. 2010, 181, 966–984. [Google Scholar] [CrossRef]
- Werner, V.; Baika, K.; Fischer, P.; Hadler, H.; Obrocki, L.; Willershäuser, T.; Tzigounaki, A.; Tsigkou, A.; Reicherter, K.; Papanikolaou, I.; et al. The sedimentary and geomorphological imprint of the AD 365 tsunami on the coasts of southwestern Crete (Greece)—Examples from Sougia and Palaiochora. Quat. Int. 2018, 473, 66–90. [Google Scholar] [CrossRef]
- Kapetanidis, V.; Kassaras, I. Contemporary crustal stress of the Greek region deduced from earthquake focal mechanisms. J. Geodyn. 2019, 123, 55–82. [Google Scholar] [CrossRef]
- Vassilakis, E.; Alexopoulos, J. Recognition of strike-slip faulting on the supra-detachment basin of Messara (central Crete Island) with remote sensing image interpretation techniques. In Proceedings of the 4th EARSeL Workshop on Remote Sensing and Geology, Mykonos, Greece, 24–25 May 2012; pp. 108–115. [Google Scholar]
- Kokinou, E.; Moisidi, M.; Tsanaki, I.; Tsakalaki, E.; Tsiskaki, E.; Sarris, A.; Vallianatos, F. A seismotectonic study for the Heraklion basin in Crete (Southern Hellenic arc, Greece). Int. J. Geol. 2008, 2, 9–16. [Google Scholar]
- Floyd, M.A.; Billiris, H.; Paradissis, D.; Veis, G.; Avallone, A.; Briole, P.; McClusky, S.; Nocquet, J.M.; Palamartchouk, K.; Parsons, B.; et al. A new velocity field for Greece: Implications for the kinematics and dynamics of the Aegean. J. Geophys. Res. 2010, 115, B10403. [Google Scholar] [CrossRef]
- Kaviris, G.; Papadimitriou, P.; Kravvariti, P.; Kapetanidis, V.; Karakonstantis, A.; Voulgaris, N.; Makropoulos, K. A detailed seismic anisotropy study during the 2011–2012 unrest period in the Santorini Volcanic Complex. Phys. Earth Planet. Inter. 2015, 238, 51–88. [Google Scholar] [CrossRef]
- Papadimitriou, P.; Kapetanidis, V.; Karakonstantis, A.; Kaviris, G.; Voulgaris, N.; Makropoulos, K. The Santorini Volcanic Complex: A detailed multi-parameter seismological approach with emphasis on the 2011–2012 unrest period. J. Geodyn. 2015, 85, 32–57. [Google Scholar] [CrossRef]
- Hatzfeld, D.; Pedotti, G.; Hatzidimitriou, P.; Makropoulos, K. The strain pattern in the western Hellenic arc deduced from a microearthquake survey. Geophys. J. Int. 1990, 101, 181–202. [Google Scholar] [CrossRef]
- Ten Veen, J.H.; Meijer, P.T. Late Miocene to recent tectonic evolution of Crete (Greece): Geological observations and model analysis. Tectonophysics 1998, 298, 191–208. [Google Scholar] [CrossRef]
- Armijo, R.; Lyon-Caen, H.; Papanastassiou, D. East-west extension and Holocene normal-fault scarps in the Hellenic arc. Geology 1992, 20, 491–494. [Google Scholar] [CrossRef]
- Papadopoulos, G.A. Εarthquake sources and seismotectonics in the area of Crete. In Minoan Earthquakes-Breaking the Myth through Interdisciplinarity, 1st ed.; Jusseret, S., Sintubin, M., Eds.; Leuven University Press: Leuven, Belgium, 2017; pp. 165–190. [Google Scholar]
- Papanastassiou, D.; Latoussakis, J.; Stavrakakis, G. A revised catalog of earthquakes in the broader area of Greece for the period 1950-2000 from IG-NOA, 2001. In Proceedings of the 9th Congress of the Geological Society of Greece, Athens, Greece, 24–28 September 2001. [Google Scholar]
- Kiratzi, A.A.; Karakaisis, G.F.; Papadimitriou, E.E.; Papazachos, B.C. Seismic source-parameter relations for earthquakes in Greece. Pure Appl. Geophys. 1985, 123, 27–41. [Google Scholar]
- Meier, T.; Rische, M.; Endrun, B.; Vafidis, A.; Harjes, H.-P. Seismicity of the Hellenic subduction zone in the area of western and central Crete observed by temporary local seismic networks. Tectonophysics 2004, 383, 149–169. [Google Scholar]
- Evangelidis, C.P.; Triantafyllis, N.; Samios, M.; Boukouras, K.; Kontakos, K.; Ktenidou, O.-J.; Fountoulakis, I.; Kalogeras, I.; Melis, N.S.; Galanis, O.; et al. Seismic Waveform Data from Greece and Cyprus: Integration, Archival, and Open Access. Seism. Res. Lett. 2021, 92, 1672–1684. [Google Scholar]
- Vassilakis, E.; Kaviris, G.; Kapetanidis, V.; Papageorgiou, E.; Foumelis, M.; Konsolaki, A.; Petrakis, S.; Evangelidis, C.P.; Alexopoulos, J.; Karastathis, V.; et al. The 27 September 2021 Earthquake in Central Crete (Greece)—Detailed Analysis of the Earthquake Sequence and Indications for Contemporary Arc-Parallel Extension to the Hellenic Arc. Appl. Sci. 2022, 12, 2815. [Google Scholar] [CrossRef]
- Vallianatos, F.; Michas, G.; Hloupis, G.; Chatzopoulos, G. The Evolution of Preseismic Patterns Related to the Central Crete (Mw6.0) Strong Earthquake on 27 September 2021 Revealed by Multiresolution Wavelets and Natural Time Analysis. Geosciences 2022, 12, 33. [Google Scholar] [CrossRef]
- Behr, Y.; Clinton, J.F.; Cauzzi, C.; Hauksson, E.; Jónsdóttir, K.; Marius, C.G.; Pinar, A.; Salichon, J.; Sokos, E. The Virtual Seismologist in SeisComP3: A New Implementation Strategy for Earthquake Early Warning Algorithms Seism. Res. Let. 2016, 87, 363–373. [Google Scholar]
- Becker, D.; Meier, T.; Bohnhoff, M.; Harjes, H.P. Seismicity at the convergent plate boundary offshore Crete, Greece, observed by an amphibian network. J. Seismol. 2010, 14, 369–392. [Google Scholar]
- Lee, W.H.K.; Lahr, J.C. HYP071 (Revised): A Computer Program for Determining Hypocenter, Magnitude, and First Motion Pattern of Local Earthquakes; U.S. Geological Survey Open File Report 75-311; U.S. Geological Survey: Reston, VA, USA, 1975.
- Klein, F.W. User’s Guide to HYPOINVERSE-2000, a Fortran Program to Solve for Earthquake Locations and Magnitudes, 2002–2171; United States Department of The Interior Geological Survey: Menlo Park, CA, USA, 2002; p. 123. [Google Scholar]
- Kissling, E.; Ellsworth, W.L.; Eberhart-Phillips, D.; Kradolfer, U. Initial Reference Models in Local Earthquake Tomography. J. Geophys. Res. 1994, 99, 19635–19646. [Google Scholar]
- Chiarabba, C.; Frepoli, A. Minimum 1D velocity models in Central and Southern Italy: A contribution to better constrain hypocentral determination. Annali di Geofisica 1997, 40, 937–954. [Google Scholar] [CrossRef]
- Mignan, A.; Chouliaras, G. Fifty Years of Seismic Network Performance in Greece (1964–2013): Spatiotemporal Evolution of the Completeness Magnitude. Seismol. Res. Lett. 2014, 85, 657–667. [Google Scholar] [CrossRef]
- Nikolintaga, I.; Karakostas, V.; Papadimitriou, E.; Vallianatos, F. Velocity models inferred from P-waves travel time curves in South Aegean. Bull. Geol. Soc. Greece 2007, 40, 1187–1198. [Google Scholar]
- Triantafyllou, I.; Karavias, A.; Koukouvelas, I.; Papadopoulos, G.A.; Parcharidis, I. The Crete Isl. (Greece) Mw6.0 Earthquake of 27 September 2021: Expecting the Unexpected. GeoHazards 2022, 3, 106–124. [Google Scholar] [CrossRef]
- Ganas, A.; Hamiel, Y.; Serpetsidaki, A.; Briole, P.; Valkaniotis, S.; Fassoulas, C.; Piatibratova, O.; Kranis, H.; Tsironi, V.; Karamitros, I.; et al. The Arkalochori Mw = 5.9 Earthquake of 27 September 2021 Inside the Heraklion Basin: A Shallow, Blind Rupture Event Highlighting the Orthogonal Extension of Central Crete. Geosciences 2022, 12, 220. [Google Scholar] [CrossRef]
- Chatelain, J.L. Etude Fine de la Sismicité en Zone de Collision Continentale au Moyen d’un Réseau de Stations Portables: La Région Hindu-Kush Pamir. Ph.D. Dissertation, Université Scientifique et Médicale de Grenoble, Grenoble, France, 1978. [Google Scholar]
- Waldhauser, F. hypoDD-A Program to Compute Double-Difference Hypocenter Locations, Open-File Report, 01-113; U.S. Geological Survey: Menlo Park, CA, USA, 2001.
- Spakman, W.; Nolet, G. Imaging algorithms, accuracy and resolution in delay time tomography. In Mathematical Geophysics: A Survey of Recent Developments in Seismology and Geodynamics; Vlaar, N.J., Nolet, G., Wortel, M.J.R., Cloetingh, S.A.P., Eds.; Springer: Berlin/Heidelberg, Germany, 1988; pp. 155–187. [Google Scholar]
- Papazachos, B.C.; Nolet, G. P and S deep velocity structure of the Hellenic area obtained by robust non-linear inversion of arrival times. J. Geophys. Res. 1997, 102, 8349–8367. [Google Scholar]
- Li, X.; Bock, G.; Vafidis, A.; Kind, R.; Harjes, H.P.; Hanka, W.; Wylegalla, K.; van der Meijde, M.; Yuan, X. Receiver function study of the Hellenic subduction zone: Imaging crustal thickness variations and the oceanic Moho of the descending African lithosphere. Geophys. J. Int. 2003, 155, 733–748. [Google Scholar]
- Vallianatos, F.; Kokinou, E.; Sammonds, P. Non Extensive statistical physics approach to fault population distribution. A case study from the Southern Hellenic Arc (Central Crete). Acta Geophys. 2011, 59, 770–784. [Google Scholar]
- Makris, J.; Yegorova, T. A 3-D density–velocity model between the Cretan Sea and Libya. Tectonophysics 2006, 417, 3–4, 201. [Google Scholar]
- Kokinou, E.; Vallianatos, F. Seismic velocity Structure and Waveform Modelling in the southern Hellenic Arc (offshore Crete). In Proceedings of the 2nd IASME/WSEAS International Conference on Geology and Seismology (GES’08), Cambridge, UK, 23–25 February 2008. [Google Scholar]
- Sachpazi, M.; Hirn, A.; Clément, C.; Haslinger, F.; Laigle, M.; Kissling, E.; Charvis, P.; Hello, Y.; Lépine, J.-C.; Sapin, M.; et al. Western Hellenic subduction and Cephalonia Transform: Local earthquakes and plate transport and strain. Tectonophysics 2000, 319, 301–319. [Google Scholar]
- Ventouzi, C.; Papazachos, C.; Hatzidimitriou, P.; Papaioannou, C.; EGELADOS Working Group. Anelastic P- and S- upper mantle attenuation tomography of the southern Aegean Sea subduction area (Hellenic Arc) using intermediate-depth earthquake data. Geophys. J. Int. 2018, 215, 635–658. [Google Scholar] [CrossRef]
- Sboras, S.; Pavlides, S.; Kilias, A.; Galanakis, D.; Chatziioannou, A.; Chatzipetros, A. The Geological Structure and Tectonic Complexity of Northern Thessaly That Hosted the March 2021 Seismic Crisis. Geotechnics 2022, 2, 935–960. [Google Scholar] [CrossRef]
- Kokinou, E.; Alves, T.M.; Kamberis, E. Structural decoupling on a convergent forearc setting (Southern Crete, Eastern Mediterranean). Geol. Soc. Am. Bull. 2012, 124, 1352–1364. [Google Scholar]
- Peacock, S.M. Are the lower planes of double seismic zones caused by serpentine dehydration in subducting oceanic mantle? Geology 2001, 29, 299–302. [Google Scholar]
- Hacker, B.R.; Abers, G.A.; Peacock, S.M. Subduction factory 1. Theoretical mineralogy, densities, seismic wave speeds, and H2O contents. J. Geophys. Res. Solid Earth 2003, 108, B1. [Google Scholar]
- Hacker, B.R.; Peacock, S.M.; Abers, G.A.; Holloway, S.D. Subduction factory 2. Are intermediate-depth earthquakes in subducting slabs linked to metamorphic dehydration reactions? J. Geophys. Res. Solid Earth 2003, 108, B1. [Google Scholar]
- Kato, A.; Iidaka, T.; Ikuta, R.; Yoshida, Y.; Katsumata, K.; Iwasaki, T.; Watanabe, T. Variations of fluid pressure within the subducting oceanic crust and slow earthquakes. Geophys. Res. Lett. 2010, 37, 14. [Google Scholar]
- Pasten-Araya, F.; Salazar, P.; Ruiz, S.; Rivera, E.; Potin, B.; Maksymowicz, A.; Torres, E.; Villarroel, J.; Cruz, E.; Valenzuela, J.; et al. Fluids along the plate interface influencing the frictional regime of the Chilean Subduction zone, northern Chile. Geophys. Res. Lett. 2018, 45, 10378–10388. [Google Scholar] [CrossRef]
- Husen, S.; Kissling, E. Postseismic fluid flow after the large subduction earthquake of Antofagasta, Chile. Geology 2001, 29, 847–850. [Google Scholar]
- Barnes, P.M.; Lamarche, G.; Bialas, J.; Henrys, S.; Pecher, I.; Netzeband, G.L.; Crutchley, G. Tectonic and geological framework for gas hydrates and cold seeps on the Hikurangi subduction margin, New Zealand. Mar. Geol. 2010, 272, 26–48. [Google Scholar]
- Collings, R.; Lange, D.; Rietbrock, A.; Tilmann, F.; Natawidjaja, D.; Suwargadi, B.; Saul, J. Structure and seismogenic properties of the Mentawai segment of the Sumatra subduction zone revealed by local earthquake traveltime tomography. J. Geophys. Res. Solid Earth 2012, 117, B1. [Google Scholar]
- Bangs, N.L.; McIntosh, K.D.; Silver, E.A.; Kluesner, J.W.; Ranero, C.R. Fluid accumulation along the Costa Rica subduction thrust and development of the seismogenic zone. J. Geophys. Res. Solid Earth 2015, 120, 67–86. [Google Scholar]
- Vallianatos, F.; Karakonstantis, A.; Michas, G.; Pavlou, K.; Kouli, M.; Sakkas, V. On the Patterns and Scaling Properties of the 2021–2022 Arkalochori Earthquake Sequence (Central Crete, Greece) Based on Seismological, Geophysical and Satellite Observations. Appl. Sci. 2022, 12, 7716. [Google Scholar] [CrossRef]
- Delibasis, N.D.; Ziazia, M.; Voulgaris, N.; Papadopoulos, T.; Stavrakakis, G.N.; Papanastassiou, D.; Drakatos, G. Microseismic activity and seismotectonics of Heraklion Area (central Crete Island, Greece). Tectonophysics 1999, 308, 237–248. [Google Scholar] [CrossRef]
- Famiglietti, N.A.; Golshadi, Z.; Vallianatos, F.; Caputo, R.; Kouli, M.; Sakkas, V.; Atzori, S.; Moschillo, R.; Cecere, G.; D’Ambrosio, C.; et al. The 2021 Greece Central Crete ML 5.8 Earthquake: An Example of Coalescent Fault Segments Reconstructed from InSAR and GNSS Data. Remote Sens. 2022, 14, 5783. [Google Scholar] [CrossRef]
- University of Athens. University of Athens. Hellenic Seismological Network, University of Athens, Seismological Laboratory [Data Set]. International Federation of Digital Seismograph Networks. 2008. Available online: https://www.fdsn.org/networks/detail/HA/ (accessed on 31 May 2023).
- Aristotle University of Thessaloniki. Aristotle University of Thessaloniki Seismological Network [Data Set]. International Federation of Digital Seismograph Networks. 1981. Available online: https://www.fdsn.org/networks/detail/HT/ (accessed on 31 May 2023).
- ITSAK. Arkalochori Earthquakes, Μ 6.0 on 27/09/2021 & Μ 5.3 on 28/09/2021: Preliminary Report—Recordings of the ITSAK Accelerometric Network and Damage on the Natural and Built Environment; ITSAK Research Unit: Thessaloniki, Greece, 2021; p. 44. [Google Scholar]
- Hellenic Mediterranean University Research Center (Former Technological Educational Institute of Crete). Seismological Network of Crete; 10.7914/SN/HC; International Federation of Digital Seismograph Networks: Crete, Greece, 2006. [Google Scholar]


| Model | Regional Model [33] | Area 1 | Area 1 [39] | Area 2 | Area 2 [39] | Area 3 | Area 3 [39] | Area 4 | Area 4 [39] | Area 5 | Area 5 [39] | Area 6 | Area 6 [39] |
|---|---|---|---|---|---|---|---|---|---|---|---|---|---|
| RMS (s) | 0.48 | 0.39 | 0.42 | 0.27 | 0.34 | 0.18 | 0.20 | 0.24 | 0.25 | 0.27 | 0.25 | 0.29 | 0.24 |
| ERH (km) | 1.44 | 1.95 | 2.27 | 1.68 | 2.47 | 1.90 | 2.37 | 1.74 | 2.10 | 1.61 | 2.36 | 1.71 | 2.21 |
| ERZ (km) | 4.74 | 6.90 | 7.25 | 4.58 | 7.25 | 4.99 | 9.08 | 5.62 | 6.36 | 6.59 | 15.08 | 6.02 | 5.45 |
| Mean Depth (km) | 33.70 | 17.22 | 13.69 | 15.82 | 11.88 | 11.34 | 11.01 | 8.07 | 13.69 | 10.70 | 9.12 | 15.69 | 15.49 |
| Area ID | Total Number of Earthquakes (Sum of Smaller Clusters) | Centroid Lat (°N) | Centroid Lon (°E) | Centroid Depth (km) | ErrX (km) | ErrY (km) | ErrZ (km) |
|---|---|---|---|---|---|---|---|
| 1 | 652 | 35.57 | 23.48 | 7.49 | 2.2 | 2.5 | 4.8 |
| 2 | 578 | 34.98 | 24.05 | 11.46 | 0.7 | 0.8 | 0.9 |
| 3 | 110 | 35.02 | 24.83 | 5.53 | 1.8 | 0.6 | 1.2 |
| 4 | 1974 | 35.15 | 25.26 | 10.35 | 0.5 | 0.8 | 1.0 |
| 5 | 615 | 34.71 | 25.36 | 18.02 | 2.2 | 1.0 | 3.6 |
| 6 | 799 | 35.58 | 26.31 | 21.37 | 0.5 | 1.6 | 2.0 |
Disclaimer/Publisher’s Note: The statements, opinions and data contained in all publications are solely those of the individual author(s) and contributor(s) and not of MDPI and/or the editor(s). MDPI and/or the editor(s) disclaim responsibility for any injury to people or property resulting from any ideas, methods, instructions or products referred to in the content. |
© 2023 by the authors. Licensee MDPI, Basel, Switzerland. This article is an open access article distributed under the terms and conditions of the Creative Commons Attribution (CC BY) license (https://creativecommons.org/licenses/by/4.0/).
Share and Cite
Karakonstantis, A.; Vallianatos, F. An Updated Earthquake Catalogue in Crete Derived by the Development of Local 1D Velocity Models and Hypocentre Relocation. Appl. Sci. 2023, 13, 9860. https://doi.org/10.3390/app13179860
Karakonstantis A, Vallianatos F. An Updated Earthquake Catalogue in Crete Derived by the Development of Local 1D Velocity Models and Hypocentre Relocation. Applied Sciences. 2023; 13(17):9860. https://doi.org/10.3390/app13179860
Chicago/Turabian StyleKarakonstantis, Andreas, and Filippos Vallianatos. 2023. "An Updated Earthquake Catalogue in Crete Derived by the Development of Local 1D Velocity Models and Hypocentre Relocation" Applied Sciences 13, no. 17: 9860. https://doi.org/10.3390/app13179860
APA StyleKarakonstantis, A., & Vallianatos, F. (2023). An Updated Earthquake Catalogue in Crete Derived by the Development of Local 1D Velocity Models and Hypocentre Relocation. Applied Sciences, 13(17), 9860. https://doi.org/10.3390/app13179860