Article

Optimization of Car Use Time for Different Maintenance and Repair Scenarios Based on Life Cycle Assessment

by
Krzysztof Danilecki
1,
Piotr Smurawski
2 and
Kamil Urbanowicz
1,*
1
Faculty of Mechanical Engineering and Mechatronics, West Pomeranian University of Technology in Szczecin, 70-310 Szczecin, Poland
2
Bemo Motors, Ustowo 56, 70-001 Szczecin, Poland
*
Author to whom correspondence should be addressed.
Appl. Sci. 2023, 13(17), 9843; https://doi.org/10.3390/app13179843
Submission received: 31 July 2023 / Revised: 24 August 2023 / Accepted: 29 August 2023 / Published: 31 August 2023
(This article belongs to the Section Mechanical Engineering)

Abstract

:
New propulsion technologies and the development of electromobility increase the environmental efficiency of the transport sector. However, the current structure of car fleets with a large number of old cars with worse environmental parameters undermines the benefits of technological progress in the automotive industry. Older cars may require a more extensive service, involving a thorough overhaul, repair or even replacement of many parts. The result of using additional resources is a deterioration of environmental performance. This study considers various maintenance and repair scenarios and focuses on the use phase using the example of the popular Ford Focus passenger car model. The life cycle optimization model was used for environmental assessment, which determines the optimal duration of the car use phase, accounting for detailed service information and the type and environmental efficiency class of the different fuel versions. This model can be an effective tool for car fleet management and car replacement policy. Detailed life cycle inventories of 40 Ford Focus II diesel and petrol cars that represent all maintenance and repairs are the inputs to the life cycle optimization model. The inventory data were provided by the Ford Service Center in Szczecin (Poland), which regularly serviced the cars with a mileage of up to 200,000 km. Inventory at other stages of the cars’ life cycles was modeled using Ecoinvent data. The results show that by considering these vehicle servicing aspects on the basis of more detailed data, impact assessments are better represented compared to other studies. Depending on the replacement policy, the contribution of vehicle maintenance and repair can account for almost half of the cumulative life cycle burdens.

1. Introduction

The COVID-19 pandemic and the war in Ukraine disrupted the global supply chain. The problems with getting raw materials and components resulted in a sudden decrease in the supply of brand-new cars. According to the International Organization of Motor Vehicle Manufacturers (OICA), between 2019 and 2022 car manufacturing dropped by 25% [1]. The average age of a car in the EU increased to 12 years. Less affluent EU countries have the oldest car fleets, with average vehicles being almost 17 years old [2]. Statistics show that even in the richest EU countries, such as Germany, France and Italy, cars older than 10 years constitute half of the fleet. Consequently, many millions of cars will soon be scrapped or will be resold to poorer countries, where they will remain in use. In Poland, the average vehicle age is 14.5, which is higher than the EU average [2]. In 2022 alone, more than 772,000 second-hand cars were imported and brought to Poland. The number of cars older than 10 years has increased by 15% over the last years [3]. The fact that the car fleet is getting older poses a challenge due to the worse fuel efficiency and higher operational costs of using older cars. Decisions to replace the old fleet are usually made based on economic criteria. The ultimate goal is to minimize the total fleet cost in a given planning horizon. This is known as life cycle cost analysis (LCCA). Every owner is interested in choosing such sequences of the best decisions that would guarantee the lowest cumulative cost during vehicle lifetimes.
One of the biggest costs for every vehicle fleet is maintenance [4]. Older cars require more extensive service, which involves the thorough overhaul, repair or even replacement of components that prematurely failed. Vehicles with lower repair costs as they get older keep their value better than other cars. A proper strategy of preventive maintenance plays a pivotal role in attempts to maximize vehicle lifespan. More reliable cars can be used for longer to minimize the total operational costs. However, when one of the main components that was supposed to last the vehicle’s lifetime fails, the repair cost can exceed the value of the car. Savings from amortization over a long car lifetime cannot make up for the high costs of repairs. In these cases, it is better to retire the vehicle and have it scrapped.
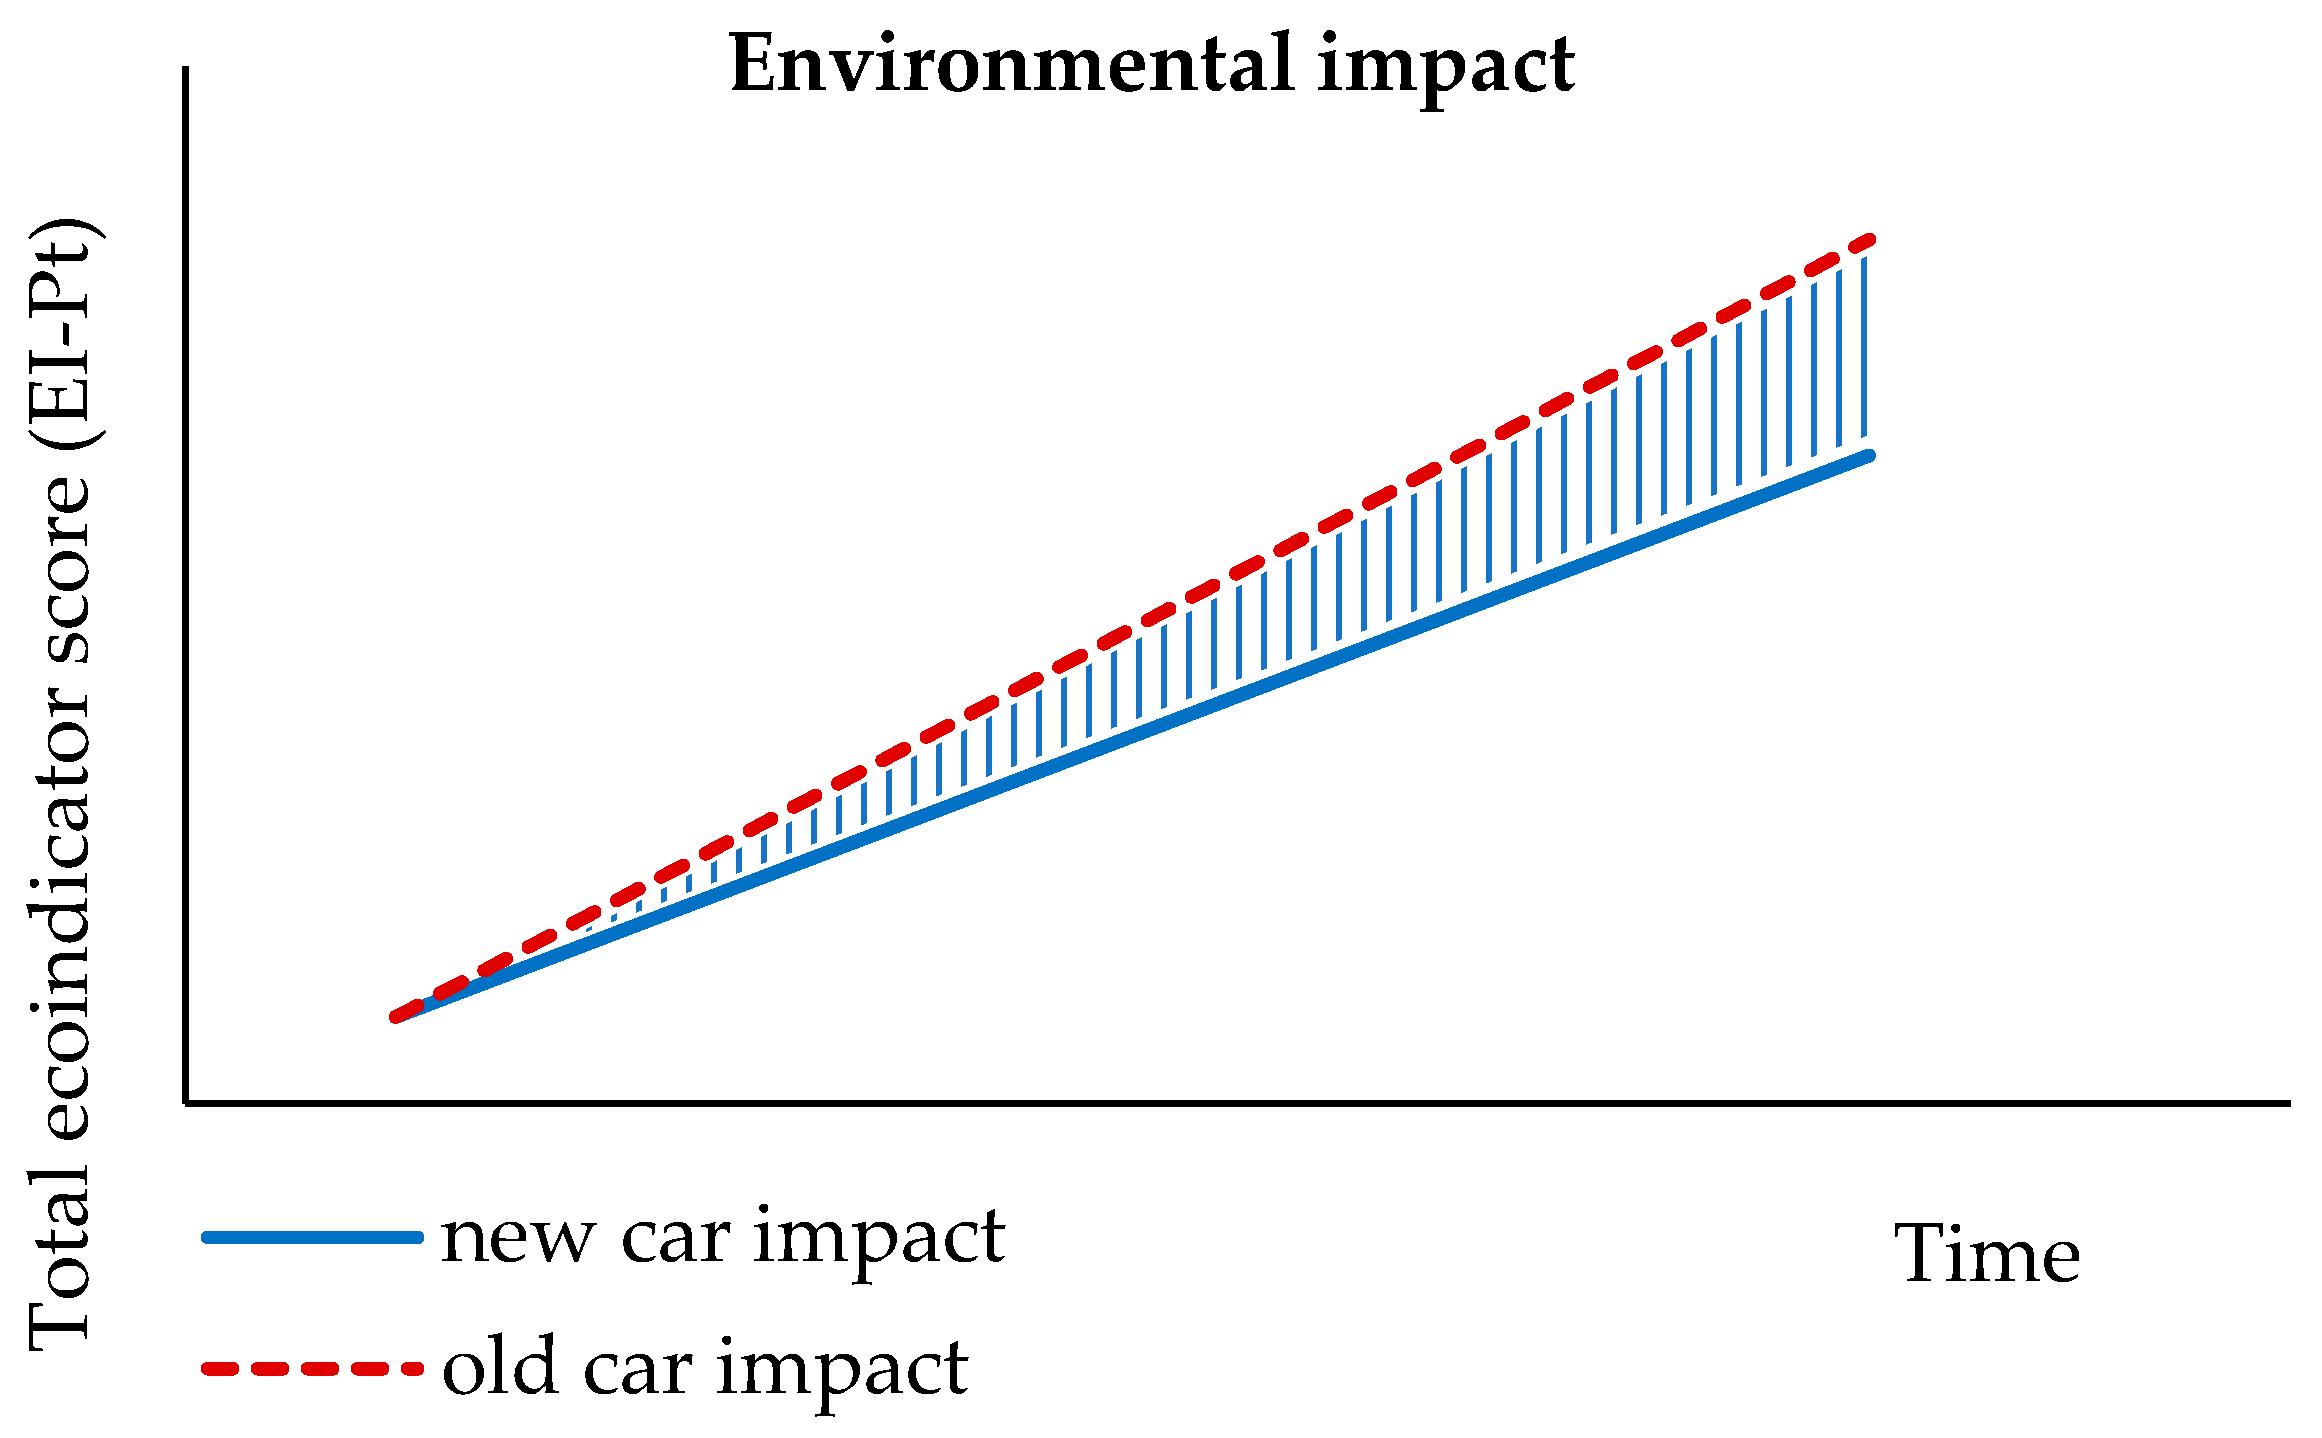
It can be concluded that motor vehicle replacement decisions represent a trade-off between the purchase of a new, more efficient and less polluting motor vehicle versus continuing to use and maintain an inefficient, higher-polluting old car. However, environmental assessments based only on drive efficiency can lead to flawed conclusions and non-optimal results. The environmental efficiency of vehicles largely depends on the vehicle’s technology. A study conducted by Hawkins et al. [5] showed how important it is to take into consideration the impact of vehicle production and utilization, particularly when comparing the different vehicle technologies, in particular electric vehicles (EV) and internal combustion engine vehicles (ICEV). Half of the cumulative impact of an EV is linked to production, while for an ICEV most of the impact is linked to driving.
In comparative assessments of vehicle environmental efficiency, the differences of drive/fuel technologies are best illustrated in an approach based on life cycle assessment. Apart from production, life cycle also covers the consequences of maintenance and component replacement, recovery and utilization of materials in cars that are scrapped. In the model of sustainable management of vehicular fleets, life cycle assessment has serious implications for the optimal policy of using, maintaining and replacing fleets. This study provides a framework for better understanding environmental consequences linked to decisions made about maintenance/repair and vehicle replacement intervals.
The life cycle assessment (LCA) model was the starting point in modeling vehicle replacement. To better understand the influence of maintenance and repair, it was necessary to make a thorough inventory based on documented data, with more detailed information than that which can be found in publicly available business inventories, reports or databases. In this study, the complete and confidential service data of 40 petrol and diesel Ford Focus II cars regularly serviced in an authorized Ford Service Center in Szczecin were used. All events and actions linked to servicing were categorized separately for both fuel versions. They include preventive maintenance according to the producer’s schedule, current maintenance performed following the customer’s notice and the vehicle’s diagnostic system readings, premature failures and repair following road accidents. The inventory data for both fuel versions, which include material and media flow and process data, were used to develop the functions of models. The obtained functions present the cumulative burdens of the maintenance phase expressed as eco-indicator points. The thorough maintenance inventory and the assumptions of the LCA model were presented elsewhere, in the authors’ previous paper (Danilecki et al.) [6]. The estimated impact of some maintenance scenarios turned out to be even twice as big as the influence reported in other studies, mainly due to the effect of customers reporting for maintenance (that effect was previously considered to be negligible).
In this study, the results of previous LCA maintenance were used to develop a vehicle replacement optimization model to minimize the cumulative environmental impact based on the adopted criterion. Simulations were conducted on a set of previously defined environmental profiles for maintenance and unplanned failures and took into consideration technological improvements in drive efficiency in new vehicles. The vehicle replacement optimization problem was solved using a solver that is compatible with a spreadsheet. Owing to the high level of thoroughness and transparency of the inventory, simulation results very well represent the model of replacing an average European car. They can also allow one to assess the unfounded environmental costs linked to non-optimal replacement intervals. The results brought by this study and the implications for vehicle replacement cycle management constitute the added value of this paper.
The text below is divided into five additional sections. Section 2 reviews previous vehicle life cycle studies to extract relevant information, such as critical factors influencing vehicle replacement decisions by individual consumers and business decision-makers, life cycle impact results with a focus on the potential impact of vehicle maintenance, key assumptions for assessing total life cycle costs of vehicle ownership and tools used to optimize operational decisions and replacement intervals. Section 3 formulates the model for the environmental optimization of vehicle runtime, data sources and maintenance scenarios. Section 4 presents and analyzes the results of the simulation and the environmental consequences of replacing an older car with a newer model. Based on the optimization results, Section 5 discusses policies that minimize environmental impact by comparing them to other previous studies’ results. Environmental optimization results were also compared with economically optimal replacement intervals. Also, the results are considered in terms of non-justifiable environmental costs associated with non-optimal replacement intervals. Section 6 summarizes the main findings and provides directions for further research.

2. Literature Review

The optimal lifetime of a car can be dictated by different economic, social and environmental factors, which are the basic criteria for the life cycle sustainability assessment [7,8]. To effectively manage a sustainable life cycle, it is necessary to determine the appropriate time to replace the car based on the most significant impact indicators. For this purpose, based on the opinion of drivers, Vesovic et al. [9] defined indicators such as average vehicle age, brand loyalty, estimated emissions, maintenance cost in relation to operating costs, recycling potential and external costs. Then, they defined the conditions under which the driver makes a decision to replace the vehicle based on these indicators. Among other things, it was found that besides the age and mileage of a car, the greatest impact on retirement is the deterioration of the vehicle, which is linked to an increase in maintenance costs.
The assessment of the economic vehicle’s useful life in a given planning horizon is the most frequently discussed criterion in the literature for optimizing vehicle replacement. The approach to finding the optimal solution for the replacement problem depends on fleet size, vehicle age and diversity. These factors directly influence the number of variables considered during the decision-making process [10].
Spitzlei et al. [11] studied the costs of owning a passenger car, including maintenance, insurance, loan interest and depreciation. They applied their findings to analyze the economic impact of replacing a typical North American sedan under various usage scenarios. They recommend long replacement intervals despite high maintenance costs and high fixed financial costs. In studies of heterogeneous fleets, which contain cars of different ages, types and functions, replacement decisions can be heavily influenced by budget constraints [12,13]. The problem of cost limit is particularly significant in large fleets with high vehicle use. A study performed by Boudart et al. [14] demonstrated that for a limited budget of a large bus fleet, maintenance costs can have a significant influence on the optimal replacement age. Similar conclusions follow from a study performed by Inegbedion and Aghedo [15] on truck fleet operation costs. Overloading significantly accelerates the deterioration of vehicles and significantly increases maintenance and total costs. It also speeds up the decision to replace vehicles. Stasko and Gao [16] introduced a model that supports decisions made about the purchase, resell, repair and modernization of vehicles. It also takes into consideration uncertainty linked to future failures and potential regulatory requirements regarding environmental protection, which may influence the resell value of vehicles.
Bajpai [17] and Vanderseypen [18] studied vehicles’ useful life related to the environment and technology. The results of their research show that motor vehicles in use are being replaced faster with the rise of models using new technologies. Economic break-even thresholds play a key role. Higher initial investment costs and limitations resulting from the specific features of electric vehicles [19] indicate that the competitiveness of EVs can be ensured only in scenarios that rely on high annual use [20] and thanks to government purchase subsidies [21]. Incentives are supposed to provide motivation to buy new and scrap old vehicles. Zaman and Zaccour [22] analyzed the decision patterns of individual consumers and came to the conclusion that the effectiveness of incentives depends on customer readiness to replace their vehicles. Customers with low income and low readiness to replace can be persuaded to speed up their replacement decisions. More affluent consumers may put off their replacement decisions because of economic calculations involving costs and advantages. Tamor and Milačić [23] analyzed car use patterns in typical US households. The purchase of a brand-new EV does not motivate the owner to scrap the old ICEV, which remains an alternative that can be used for longer trips. Bauer [24] analyzed the Norwegian system of incentives and local consumer habits and came to the conclusion that the introduction of EVs increased the number of cars in households and the number of driven kilometers. These findings suggest that the environmental advantages can be smaller than those expected in LCA. A study conducted by Kontou et al. [25] showed that it is not possible to speed up a decision to replace a conventional ICEV when fuel prices increase and the price of electricity and battery packs decrease.
Hofmann et al. [26] study the shift part of the vehicle fleet from fuel to electricity (with electric vehicles) in China, which is the largest global emitter of greenhouse gases (GHG). Karlewski et al. [27] analyze life cycle-oriented social aspects regarding the example of the steel and aluminum components used in a car.
The expected acceleration of transport development, together with its implications for the climate and natural environment, need a wider LCA perspective in the context of fleet replacement. There are many studies that have assessed vehicles from an LCA perspective to improve projects and to minimize environmental impacts [28,29,30]. Petrauskiene et al. [31] combine LCA (life cycle assessment) with LCC (life cycle cost) analysis to compare different propulsion technologies under Lithuanian conditions. Assuming the use of renewable energy sources, diesel vehicles and electric cars are the most effective options. Hawkins et al. [5] presented one of the most transparent LCAs that rated the potential of reducing the environmental impact of an EV compared to a traditional ICEV. Many similar studies focused on the operation phase when they compared different drive options. However, to improve the environmental competitiveness of EVs, one needs to reduce the carbon footprint during vehicle production, improve battery reliability, improve utilization processes and promote clean sources of electricity. Hawkins et al. analyzed the characteristics of both technologies and their potential environmental implications. The team, however, did not give any recommendations and consequences of replacing cars in a given planning horizon.
A limited number of studies have considered the impact of maintenance on vehicle lifespan. Usually, LCA studies compare repair and replacement options for different components [32]. Kim et al. [33,34] presented a pioneering study, based on LCA methodology, about the environmental effects of replacing a vehicle with a more efficient model. The model was used to optimize car replacement time in a given planning horizon. Dynamic software was used to determine the dynamic environmental parameters of operation costs for each year of the given planning period. The authors took into consideration one-year environmental profiles for five phases of the product life cycle: production of materials, manufacturing, use, maintenance and pull-out from operation. While making a decision to replace based on calculated parameters, the authors also took into consideration technical improvements in successive versions of a model, including a share of recycled materials, material consumption, energy consumption, fuel efficiency, emission coefficients and component reliability for a generic 1995 mid-sized car used in the US. The cost of car maintenance represents the reliability of components. The introduced model made it possible to determine optimal replacement schedules on the condition that only one car is always replaced by another one and that the annual mileage is constant. The results of these studies indicate long optimal replacement intervals.
Usón et al. [35] in a study on a sustainable mobility model developed from the LCA perspective discussed the period of energy payback when a car is replaced with a more modern one with better fuel efficiency. The model took into consideration the main phases of life cycle, including energy present in materials and energy consumed in production and recycling. Material and process data were taken from a public database and the car unit was based on Volkswagen A4, whose inventory was a point of reference in many other studies. Energy savings during replacement were assessed based on differences of fuel efficiency between the old and new cars using predicted value decrease for new cars and were modeled with a regression equation. The replacement decision was made by putting together the energy saving regression curve with the energy cost of producing a new car. The assessment results confirm the general trend of extending the optimal use period, which is consistent with other studies. The modeling result does not take into consideration the effect of maintenance and the uncertainty level is linked to a great uncertainty of the fuel consumption reduction prognosis over a long time horizon, which in the study was 20 years.
Detailed research on car fleet replacement dynamics is crucial for implementing climate policy goals in countries with a high influx of used car imports [36]. Barjoveanu et al. [37] used LCA to assess the effect of a growing number of cars in Romania for different scenarios of car use, such driving on the highway and driving in town at peak and off-peak hours. The study was limited to the use phase and was used to update emission data specific to an older passenger car fleet. The assessment results have a general character and can be used as recommendations for fleet management decisions, which can be useful in softening or even reversing the negative effects on the climate and environment. The results demonstrate that the replacement of older cars with new ICEVs is not enough to reduce the negative impact and suggest that older fleets should be replaced by EVs and hybrid vehicles.
Kagawa et al. [38] introduced a model of life cycle optimization and applied it to assess the efficiency of a governmental program of car exchanges to reduce CO2 emissions. The assessment of impact, apart from road emissions, took into consideration the manufacturing of brand-new cars. The results are partially consistent with a study conducted by Barjoveanu et al. [37]. They determine the minimum age of new ICEVs while at the same time pointing out that the potential of CO2 reduction is many-fold higher when older cars are replaced with more efficient hybrid vehicles.
The few studies that, with the support of LCA, analyze the environmental effects of fleet changes and optimize replacement schedules indicate a large diversity of optimal vehicle replacement intervals depending on the analyzed environmental problem. At the same time, they do not explain what factors prevail when making a decision to replace a vehicle, as the cumulative impacts of the entire decision-making process before a vehicle replacing are assessed. In many research studies that use LCA to analyze the environmental impacts of changes happening in vehicle fleets and optimize replacement schedules, the effect of maintenance is often neglected or assessed with unreliable, too-general data which do not reflect the changing technology. This study seems to have filled the gap. It has introduced a new level of data accuracy of a generic ICEV. It also has assessed the consequences of realistic scenarios of repair and maintenance consistent with the requirements of modern technology.

3. Vehicle Replacement Optimization Model

3.1. Assumptions

The study by Vesovic et al. [9] challenges the age of the vehicle as a key factor in the decision on vehicle replacement. On the other hand, some other research indicates the potential environmental advantage of extending vehicle lifespan as a way of saving resources, energy and pollution that would otherwise have to be spent on manufacturing new cars [34,35]. The environmental consequences, including more frequent service and failure, can undermine the advantage of extending the lifespan of older vehicles. A new, more energy efficient and more reliable car can be a better solution. To assess the compromise between extending the car use time and money spent on replacing an old vehicle, it is necessary to have a detailed life cycle inventory (LCI). LCI covers production, use, maintenance and environmental burden linked to vehicle utilization. The negative effect of maintenance is due to emissions, used resources, additional manufacturing processes, distribution of components and service procedures. There are many research studies that provide well-documented life cycle inventories, but they also differ in terms of data details [5]. Schweimer’s and Levin’s [39] inventory of the VW Golf A4 is probably the most fundamental and thorough LCI of a passenger car. The materials covered by the maintenance schedule include engine oil, coolant, brake fluid, window liquid, tires, filters, battery, wiper blades and spark plugs. The service interval was set at each 15,000 km. The inventory also covers 180 car wash stations and the replacement of a bumper. Data based on the Golf A4 LCI reflect the service actions recorded in Ecoinvent [40], which is the basis of many LCA studies. In most research, maintenance accounts for 2–3% of the total life cycle assessment, while in others it is thought to be negligible.
The certified Ford Service Center in Szczecin (Poland) suggests that actually the range of maintenance operations is much wider than in the present public inventories. Realistic maintenance scenarios cover preventive maintenance, planned repairs and difficult-to-predict failures and damage sustained as a result of road accidents. They are also more adjusted to more advanced technology and higher EURO emission standards than those of the Golf A4. All cases of maintenance operations performed on Ford Focus cars (EURO 5) that were regularly serviced in the station were analyzed in terms of technological improvements and environmental efficiency. For example, it was confirmed that diesel cars intensively used in urban environment required oil exchanges every 4–6 thousand kilometers, whereas the producer recommends an interval of 15,000 km. Diesel cars must regularly regenerate diesel particulate filters (DPF) in a special procedure. It requires the driver to maintain an appropriate driving style, best outside the city, preferably on the highway. If the procedure is disrupted in city traffic when cars cover short distances, oil is diluted with the fuel that has not burned. The message telling the driver to change the oil is supposed to protect the engine from failure. It is clear that this kind of real-life scenario multiplies the negative effect of maintenance on the environment. Unplanned repairs and failures had similar adverse effects.
This study used LCA to optimize the life cycle of a vehicle to minimize the effect on the environment. The optimization model the study introduced is a compromise between extending the life of an old car and replacing it with a new, more efficient and more reliable model in a given planning horizon. LCA results of environmental profiles, modes of operation, maintenance and utilization were used as input data. Our model is based on a very thorough service documentation of a large vehicle sample compared to other studies. The impact assessment was performed using the ecoindicator EI 99 characterization method for end-point indicators: human health, ecological quality and resource quality. The values of the end points were weighed, aggregated and calculated as the total ecoindicator score (EI-Pt). The life cycle impact assessment (LCIA) was calculated with Simapro v.9.0 [41]. The life cycle optimization model was applied for the generic Ford Focus passenger cars produced between 2004 and 2011. The optimization of vehicle replacement was conducted to minimize the cumulated LCIA, expressed as the total ecoindicator score (EI-Pt).

3.2. Model Structure

In the optimization model, car replacement decisions are made based on the cumulated life cycle impact. This approach, for example, allows the assessment of the environmental benefit of vehicle technological improvements in a given decision-making horizon. This concept is illustrated in the schematic example shown in Figure 1.
The y-axis presents the cumulated environmental impact, e.g., a total ecoindicator score (EI-Pt). The x-axis represents service lifetime or the vehicle kilometers traveled (vkm).
For example, the better fuel efficiency of a new car gives tangible environmental benefits compared to the base car (dotted line). Benefits for the environment or carbon credits (hatched area) will accumulate over time. This means that the time a vehicle remains in use should be taken into account in the assessment of environmental impact of vehicle technological improvements.
Figure 2 shows a schematic example of the model applied to assessing the benefits of replacing cars. It is assumed that a baseline vehicle is produced and introduced at time t0. The environmental burdens associated with the production of the baseline/old vehicle are represented by the vertical segment of the blue line. The introduction and operation of the vehicle will accumulate environmental impacts (blue line) that will be minimized throughout the time horizon tN. The slope of the line of accumulated burden tends to increase with time as a result of the vehicle deterioration expected for older cars. Based on the older cars’ deterioration data, at the time tA a decision is made to either keep the old car or buy a new one. The vertical segment of the red line at tA represents the environmental burdens associated with the production of the new vehicle. Better performance of a new car (red line) will accumulate environmental benefits or emission credits over time. However, making a decision about replacing it requires determining when to retire the old vehicle and how long a new car should be kept to minimize the environmental impact. At tA, the smaller impact of producing a new car introduces environmental credit (blue arrow with dash line), and the difference in the slope of the cumulative impact of the old and new car accumulates the benefits of using a new car, as explained in Figure 1.
Optimization of car service lifetime which minimizes the environmental impact needs a balance between the benefits of introducing a new car and its production environmental costs. At time tB, the cumulative benefits from using a new car plus the environmental credit at tA balance the burden of the manufacturing of a new car. The optimization to minimize the cumulative environmental impact of both cars requires a longer payback period for the new car. With this hypothetical example shown in Figure 2, the minimum lifetime of a new car is tN–tA.
Figure 3 is a schematic example of the optimization model applied to three exchange policies over the given time horizon tN. At time tA, the environmental credit from the replacement of the vehicle (point A) was marked, which, according to Figure 2, is equal to the difference between the cumulative emissions from using an old car and producing the new car. The higher efficiency of the new car will accumulate environmental benefits over time. This is represented by the blue lines coming out of point A. In the first scenario (constant performance decrease rate over time for a new and an old car), cumulated benefits plus the credit in tA counterbalance production costs (red solid line) over time tB (point B). But in the longer term tN (point N), the proceeds from greater efficiency also pay off the credit (dashed red line) from the introduction of a new car in tA. In this scenario, tN−tA is the minimum vehicle lifetime. Based on their knowledge about vehicle reliability, a decision maker can consider a more realistic scenario in which the performance of older cars decreases more quickly. This scenario increases the benefits a new car and counterbalances its introduction costs over a shorter time (point N1). In the third scenario, probable failures over time tD further increase the benefits of the new car and reduce the minimum lifetime (point N2).
The presented model describes a one-for-one car replacement scenario in which one vehicle is replaced by another vehicle. In this paper, more complicated scenarios, such as replacing one vehicle with multiple vehicles, are not discussed. This model provides an optimal replacement policy in a given time horizon tN−tA for a new vehicle and constant mileage per year, regardless of age.
In the hypothetical example, where a vehicle is replaced over time, the vehicle’s environmental profiles for the optimization model must be a known function of age/mileage. This model structure provides a more efficient algorithm for finding the optimum vehicle replacement policy. Section 3.3 presents environmental profiles obtained with LCA that take into consideration vehicle deterioration with age and stochastic failures modeled in the function of car mileage.

3.3. Environmental Profiles of Life Cycle Phases

LCA aims to assess the environmental burdens of a total life cycle and to determine how they are distributed over successive life cycle stages. The assessment is made based on a thorough inventory of flows important for the environment and all processes at all phases of the life cycle. These flows include used resources, emissions and pollution released to the environment in each elementary process/activity over the whole life cycle. The sizes of such flows are calculated as functional units. In LCA, the functional unit is usually the number of driven kilometers for an average car age and the annual average mileage, data published in public reports [2]. Owing to that, LCA gives a cumulative assessment score in a total given time horizon, which for example can cover the whole phase of car use determined in a study. This result does not give any idea of how burdens are distributed over smaller intervals of life cycles. The application of LCA for environmental optimization replacement models, which provide a long-term prognosis in a long planning horizon given changes of the initial state, requires a different arrangement of life cycle inventory (LCI) that defines production, use, maintenance and disposal. This applies in particular to modifications of car design which affect vehicle environmental performance in terms of material content and wear, energy efficiency and emission class. Reliability and the gradual car condition getting worse over time are important parameters. The effect of the maintenance stage is dependent on the former and the latter.
The above presented description of why oil exchange intervals in diesel cars become shortened by a factor of several times demonstrates that some technical improvements which are supposed to improve exhaust gas emission control may at the same time significantly increase the impact of the maintenance phase. The arrangement of time variable parameters should allow an assessment of impact over small time intervals, with resolution necessary in research and available, for example, for every age or car mileage.
The replacement optimization used LCA data from an earlier project from Danilecki et al. [6]. That paper presents the procedures of data collection and impact assessment at successive stages of the life cycle. A thorough inventory was appended for publication. LCA calculations were made for the Ford Focus passenger car, which is representative of the medium-sized European ICEV. The car was modeled in two fuel versions (petrol and diesel) to be able to assess the environmental performance of different car technologies. The LCA results cover 151,200 km driven in typical European conditions. This is mostly consistent with the average annual mileage and average age of cars in the EU.
This study focuses on the assessment of the impact maintenance has and its consequences for vehicle replacement policy. Therefore, previous study maintenance scenarios, modeled based on confidential data, will be discussed at a higher level of detail. A publicly available inventory from Ecoinvent version v3.5 [40] was used to model the other stages of the life cycle. The main modeling assumptions and results are presented below and discussed.

3.3.1. Production Stage

Ecoinvent data were used to calculate the impact of Ford Focus production. LCI data are based on a detailed materialization of the Golf A4 and are representative of a generic European car. A set of data can be scaled to the mass of other vehicles on the assumption that larger mass means larger impact. Best fit data scaled to Ford Focus mass were selected for each fuel version. Ecoinvent contains data about raw materials, the energy input of the production stage and production infrastructure. It can be used to calculate production cost and the initial scrap fraction from the production process. It covers the disassembly and disposal of a car once it has been pulled out from use (EOL). We modified the original Ecoinvent data set to exclude all the records of car disposal which had been included at the end-of-life stage (EOL). Additionally, Ecoinvent data were validated to make sure Golf A4 materialization is consistent with the analyzed Ford Focus cars. To this end, the study used detailed data of Ford Focus materialization from a previous study on a dismantling facility in Szczecin (Danilecki et al.) [42] and data of cars repaired in the Ford service center in Szczecin.

3.3.2. Vehicle Operation

The operation-related impact was modeled with Ecoinvent data of direct fuel combustion emissions, which are consistent with EURO standards of Ford Focus cars. Additionally, the study took into consideration emissions from tire and brake wear, fuel production, construction, maintenance and utilization of road infrastructure. Since the mass of a passenger car affects its fuel consumption and exhaust gas emissions, the original data set was modified to adjust fuel consumption to the specifications of the analyzed cars. The fuel consumption data for Ford Focus vehicles in the New European Driving Cycle (NEDC) can be found in Table S1 of the Supplementary Materials. Additionally, production and maintenance data were removed from the original sets to avoid double counting.

3.3.3. Maintenance and Repairs

Maintenance and repair LCIA was calculated based on detailed service documentation of 40 Ford Focus II cars, including 20 petrol and 20 diesel vehicles. All cars were heavy duty fleet vehicles, with annual mileages over 30,000 km. The cars were regularly serviced as part of a business contract in the licensed Ford service center in Szczecin (Poland).
LCI data included:
  • Preventive maintenance;
  • Irregular maintenance;
  • Preventive maintenance with a shorter engine oil exchange interval;
  • Repair following failure;
  • Accident repair.
Preventive maintenance covers regular procedures according to the producer’s service schedule, including exchange of liquids, filters, belts, etc. The range of service operations was the same for both fuel versions and was conducted at equal intervals, each 15,000 km. The content of parts replaced in each interval equals the average result of all cars.
Irregular maintenance includes those exchange operations that are due to normal wear and tear of components, including parts that do not last the lifespan of a vehicle, such as brakes, clutch, shock absorbers, suspension, etc. However, in this option such components are replaced only when they are in limit wear condition. Because the lifespan of these components depends on the driver’s behavior and road conditions (season, city, highway), the range of exchanged parts is different in different cars. Exchange intervals are also different. Data about material content during each exchange and about exchange intervals were collected for each individual car.
The shorter engine oil exchange interval model is specific for diesel cars with DPF. It covers a problem discussed in Section 3.1. In this maintenance model, oil was exchanged according to indications every 4000 km. It increased the number of exchanges from 10 to approximately 37 for the car lifespan defined in the study. The model used data about the number and frequency of oil exchanges that were accompanied by the replacement of a filter, an oil screw and a carter joint.
Failure repair covered those components which failed prematurely, such as alternators, turbochargers, engines, gear boxes, computer control systems, steering wheels, etc., which were expected to last the whole car use period. Breakdown notifications were analyzed separately for each fuel version. Most cases were about failure of suspension, steering and brake systems. Failure cases linked to engine, electrical and electronic systems were on the same level. Breakdown cases of the drive system were the least frequent. Material data gathered on an irregular maintenance basis were collected for each notification.
This study did not cover accident repair cases. The consequences of road accidents are difficult to estimate. The environmental impact of accident repairs can only be approximated with acceptable probability based on statistical analysis of a large sample of cars. Since this kind of data is not available, the assessment of accident repair impact was conducted for three real-life scenarios differing in range and complexity. The list of replaced elements is presented in Table S2 of the Supplementary Materials. The material content of exchanged parts was determined for each scenario. LCI includes processing data of spare part production. Production requirements for each component were determined based on expert knowledge. Data of waste produced, energy and heat consumption were collected for each operation of component replacement. The average energy consumption of each operation was estimated based on monthly energy consumption in the service center, the number of man-hours at each work station and time standards for exchange procedures defined by the manufacturer. Additionally, the transport of spare parts and waste removal were also taken into account. Ultimately, all processes (component transformation, transport and energy sources) were represented by best fit data from Ecoinvent.
LCIA calculations based on inventory results provided environmental profiles for different scenarios of maintenance and repair. Environmental profiles are presented as a function of vehicle kilometers (vkm). The Supplementary Materials present the cumulative environmental impact of irregular maintenance on petrol and diesel cars in Figures S1 and S2, respectively. The scores for the impact assessment were calculated using ecoindicator points. Individual points in the figures represent the cumulative score of the impact assessment (EI-Pt) for each car in any mileage interval up to 200,000 km. The spread of points is caused by the differences of part replacement cases in each car and secondly by replacement irregularity, as exchanges were performed when necessary, taking into consideration the real worsening condition of the inspected components. The point distribution in Figures S1 and S2 was modeled with second order multiple regression.
The regression model for the petrol Ford Focus was obtained [6]:
B P m = 0.885 + 0.372 V K T + 0.0051 V K T 2
In the case of the diesel Ford Focus, the regression model is [6]:
B D m = 4.237 + 0.3991 V K T + 0.0059 V K T 2
where:
BPm, BDm—total ecoindicator score results (EI-Pt) of Ford Focus petrol and diesel irregular maintenance, respectively.
VKT—vehicle kilometers traveled (thousand vkm).
The resulting model describes the changes of the cumulative impact of maintenance in the function of mileage. It is easy to correlate mileage with the age of a vehicle. This form of the model provides maintenance environmental profiles for any mileage/age. Therefore, the model is easy to use for the optimization of life cycles.
Figures S3 and S4 in the Supplementary Materials display the cumulative impact assessment (EI-Pt) for petrol and diesel cars, respectively. One can find a relatively small number of failures and a wide spread of assessment scores. Given this distribution, it is impossible to model with second grade polynomial regression. That is why first grade regression was used to model failure. The conditional average was calculated for three mileage intervals. Interval boundaries were selected to ensure the most balanced distribution of the event sample (Table S3 in the Supplementary Materials). Conditional average results of impact assessments for each interval were plotted on the graphs.
The score results of impact assessments for accident repair scenarios are shown in Figure S5 of the Supplementary Materials. It was assumed that accident repair can happen at any time during the car use stage. These assessment results were accounted for in the optimization scenario of a car lifetime.

3.3.4. End of Life

The end of a vehicle life (EOL) was modeled by extending the boundaries of the vehicle system to take into account recycling and waste removal. The EOL model assumes that owing to recycling, one avoids producing new materials. Therefore, the calculated recycling result that represents useful materials is subtracted from the impact of virgin material. Recycling and waste disposal were modeled with the best fitting sets of data from Ecoinvent.

3.3.5. LCIA Results

The results of the life cycle impact assessment based on LCI data for different scenarios of maintenance and repair for two fuel versions of Ford Focus are compared in Figure S6 of the Supplementary Materials. The compared scenarios of different requirements of component replacement (regular maintenance, regular maintenance with additional oil exchange, irregular maintenance, repair following failure, accident repair) are explained in Table S4 of the Supplementary Materials. Additionally, the comparison includes a reference scenario based on Ecoinvent LCI data.
The life cycle impact was compared with the calculated impact of maintenance and repair scenarios of Ford Focus cars with reference Ecoinvent scenarios. It shows that in the worst scenario of Diesel Extended 2 Ford Focus, which takes into consideration regular maintenance with additional oil exchange, irregular maintenance, failure and accident repair, the assessment score increased by 6%. A larger impact of the scenarios discussed in this study modifies the share of each life cycle stage in the total assessment of the life cycle. The total assessment of the life cycle for Diesel Extended 2 is almost 8% of the total score compared to 3% of the baseline diesel Ecoinvent scenario. The larger share of calculated scenarios is the main motivation for starting research on the effect of realistic scenarios of maintenance and stochastic repair on vehicle replacement optimization. To date, the effect has not been well documented. The results of this analysis are presented in Section 4.

4. Model Application

4.1. Inputs of the Optimization Model

The LCA results provided environmental profiles of vehicles from different model years across life cycle stages. Environmental profiles were modeled to the actual data from the average Ford Focus passenger vehicle. The data concerned two Ford Focus models with EURO 3 and EURO 5 standards in two fuel versions: diesel and petrol. Vehicle production was modeled using the Ecoinvent dataset. Ecoinvent datasets parametrize the impact of car production in correlation with vehicle mass. The production impact can therefore be scaled directly to the vehicle weight inserted by the Ecoinvent user.
Driving on European roads was also modeled using Ecoinvent data. In this study, based on optimization assumptions, fuel consumption (FC) and driving emissions were scaled to the mass of Ford Focus cars and EURO standards based on FC and emission factors determined for a reference 1600 kg medium car. In the Ecoinvent data sets, the scaling factor determining the increase in fuel consumption of an “average” car weighing 1600 kg per kg of weight increase and per 1 km is estimated at 2.93 × 10⁻⁵ (kg/(kg × km)) [40]. The scaling factor of a “medium” passenger car with a mass of 1600 kg is calculated as: ((Ford Focus weight − 1600) × 2.93 × 10−5 + average FC of reference vehicle). The FC of petrol vehicles in the “medium” category with a mass of 1600 kg in a EURO 3 class is 0.0695 (kg/km) and in a EURO 5–0.0621 (kg/km). FC for diesel vehicles is estimated to be 0.0607 (kg/km) and 0.0546 (kg/km), respectively.
The resulting fuel consumption values in kg/1 km or l/100 km and emission factors in EI-Pt, scaled to Ford Focus vehicles’ weight, are given in Table S5 of the Supplementary Materials.
Maintenance and repair were modeled using the environmental profiles discussed in Section 3.3.3. A set of maintenance and repair scenarios for the life cycle optimization model are given in Table S6 of the Supplementary Materials.

4.2. Model Optimization

As part of the demonstration, a life cycle optimization model was used to study the vehicle replacement cycle to find the pattern that minimizes environmental impact for the short and long-run replacement policies. One of the more important objectives was to investigate how the optimal replacement pattern would be affected by the differences in maintenance and repair environmental profiles and adjust the replacement policies accordingly. The short and long-run replacement policies may represent a different approach to the problem of vehicle replacement by two different groups of individual consumers that use different replacement cycles. A large group of individual vehicle owners uses long replacement cycles, which is consistent with the economically ideal replacement policy for a vehicle. However, a portion of vehicle owners are willing to pay a substantial premium to own a new vehicle. The average age of passenger cars in Luxembourg is 6.7 years, while, for example, in Poland it is 14.5 years. To what extent do the different vehicle replacement cycles meet the Sustainable Development Goals?
In this study, the potential environmental effects of replacing a EURO 3 class Ford Focus car with a newer model in a EURO 5 standard are studied. According to the assumptions of the model, retiring the vehicle and introducing the new vehicle occur simultaneously. The vehicle ownership limit is equal to the average lifetime of a car in the EU, which is currently 11.5 years. Optimization to minimize the cumulative value of the ecoindicator (EI-Pt) is considered in the give time horizon. Assuming that the average annual transport distance of passenger vehicles in the EU is 14,000 vkm, the results can easily be scaled to the mileage of the car. The impacts of replacing two fuel versions of vehicles are assessed: diesel and petrol. The study takes into account the higher fuel efficiency and lower emission factors of the new car and the service scenarios presented in Table S6 of the Supplementary Materials.

4.3. Results

4.3.1. Higher Fuel Efficiency Scenario

In this scenario, the impact of higher fuel efficiency of the new vehicle is assessed, which, in conjunction with the EURO emission standard, is the basis for assessing the driving burdens. The impact of driving expressed in ecoindicator (EI-Pt) values per 1 km of distance traveled (Table S5 in the Supplementary Materials) is the basis for assessing the benefits of higher fuel and environmental efficiency of a new EURO 5 vehicle that replaces an old EURO 3-compliant vehicle.
In Figure 4, the solid line shows the cumulative benefits of the increased efficiency of a new vehicle as a function of the number of kilometers driven. According to the optimization scheme (Figure 3), the introduction of a new vehicle with a mileage of 0 km gives an environmental advantage compared to the old car in use. The accumulation of benefits over a period not longer than the car usage limit should balance outlays on the production of a new car, which is represented by the horizontal dashed line.
In the considered diesel Ford Focus replacement scenario, at the time of the replacement decision the use of the old car must not be less than 57,650 vkm, which corresponds to 4.1 years of operation. The burdens from the old car accumulated in this period, minus the expenditure on the production of a new model, determine the amount of the environmental credit for a new car at point 0 vkm. In comparison, the minimum use of an old petrol vehicle is longer at 4.5 years (62,800 vkm).
However, due to the marginal difference in fuel efficiency of the replaced cars, the given car use limit of 11.5 years (161,000 vkm) is too short for the benefits of driving a new car to pay off the environmental credit from its introduction at 0 vkm.

4.3.2. Impact of Maintenance Scenario

Figure 5 and Figure 6 show optimization models where the impact of drive performance is extended to include maintenance environmental profiles (Figures S1 and S2 in the Supplementary Materials). Changes in the environmental maintenance profile over time increase the benefits of a new car that does not require such extensive servicing combined with the replacement of many parts. The environmental benefits increasing over time changes the periods of use of the replaced cars (solid blue line) compared to the fuel efficiency scenario (solid red line). In the Ford Focus diesel scenario, the useful life of the old car is reduced to 52,100 vkm, which corresponds to 3.7 years. For the petrol Ford Focus, it is reduced up to 53,600 vkm and 3.8 years, respectively. However, the analyzed scenario does not balance the cumulative impact of both cars and does not meet the Sustainable Development Goals.

4.3.3. Impact of Maintenance and Repair Scenario

Compared to the scenario discussed in Section 4.3.2, the assessment of the effects of failure and post-collision repair has been added to the replacement optimization model presented in Figure 7 and Figure 8. The environmental profile of failure repairs is shown in Figures S3 and S4 of the Supplementary Materials, and various scenarios of post-collision repair are in Figure S5 (Supplementary Materials). The post-collision repair profile with the greatest environmental impact was used for the assessment. It was assumed that the post-collision repair forecast applies to an old car and one event. Optimization results of such a model indicate an acceleration of the decision to replace the car. The use of an old Ford Focus with a diesel engine should not be less than 47,500 vkm or 3.4 years and a petrol model should not be less than 48,900 vkm or 3.5 years.
The results of the comparison show that in the short period of use, maintenance and repairs have little effect on changing the car replacement cycle.

4.3.4. Optimization for Long-Term Dependencies

Figure 9 and Figure 10 show examples of a replacement policy that balances the cumulative impact of both cars over the long term, including the production of an old car.
The environmental benefits of a new vehicle use/mileage fully offset the production burden of the new car and repay the credit from its introduction at 0 vkm. This necessitates a significant extension of the useful life of the new car over the set limit of 11.5 years (161,000 vkm). For the diesel Ford Focus, it will be 338,000 vkm, and the old vehicle is retired at 180,000 vkm. In comparison, for the same decision to retire an old car, the minimum use of the petrol Ford Focus is 376,000 vkm and is due to poorer environmental performance. Noteworthy is the large contribution of maintenance and repair to the overall environmental benefits score at the balance points. However, due to the limitations of the data used in the models, estimates of the environmental profiles of maintenance and repair at equilibrium points can be highly uncertain. However, they indicate an increasing contribution of maintenance and repairs along with the use/mileage of the vehicle.
The performed simulations show that the time of making the decision to exchange affects the location of the balance point. The impact of retiring the old vehicle over time on the optimal use of the new Ford Focus diesel vehicle is shown in Figure 11. The results of the estimation are compared with the reference replacement time of 3.4 years (47,500 vkm) calculated for the policy shown in Figure 7. For this replacement time, the optimal use of a new vehicle would be 432 vkm, which is equivalent to 38.9 years. The reference times for replacement and the optimal use lifetime of the new vehicle are set to 100% and replacement cycles for four other policies are calculated as a percentage of the reference scenario results. In addition, Figure 10 shows the estimated contribution of maintenance and repair to the results of life cycle optimization. When comparing the replacement policies to a reference policy, it was found that using an old car for five times longer results in a one-third shorter optimal use time for a new vehicle. Additionally, maintenance and repairs contribute twice as much to the benefits of introducing a new car.

5. Discussion

The presented car replacement optimization model is based on reliable maintenance and repair environmental profiles calculated from very detailed LCI data. Environmental profile models modeled as a function of mileage are easily correlated with the age of the vehicle and are easy to use for life cycle optimization. The impact of maintenance and repair varies greatly depending on the replacement policy being used. This paper presents the results of a comparative study to assess the impact of different maintenance and repair scenarios on the results of life cycle optimization. The results of this research are summarized in Table 1. The data contained in the table show the optimal sets of periods of use of replaced cars with different environmental performances in different replacement scenarios.
Based on the data collected in Table 1, one can determine when to withdraw the old vehicle (columns 1 and 3) and how long to keep the new vehicle (columns 2 and 4). The result of the assessment is influenced by the available information/forecasts regarding the emission factors of the replaced vehicles and the distribution of the cumulative environmental burdens in a given planning horizon.
The main limitation of these studies is the uncertainty of the results of optimizing long-term replacement policies due to the limitations of the data used in models of environmental maintenance and repair profiles. Uncertainties related to the results also result from the difficult-to-estimate forecasts of vehicle failure rates and the effects of post-collision repairs. An additional limitation is the applicability of models of environmental maintenance and repair profiles, which are representative of medium-sized passenger cars representing a certain level of technological improvement of the drive system and exhaust gas regulation to the EURO 6 standard.
Based on the optimization results, it has been determined that the environmental effects of maintenance and repair are influenced by two attributes: the retirement time of the previous vehicle and the lifespan of the new vehicle. This has major implications for car replacement policies.
In policies with short replacement cycles and a fixed average car use limit, the higher environmental performance of a new car that does not require extensive maintenance can speed up the decision to retire the old car. However, the average lifetime of a new car in the EU is too short to strike a balance of benefits and production burdens that need to be optimized in the much longer term. Therefore, short replacement cycles would require a significant increase in the environmental performance of new cars. And as the impact of maintenance, which is a function of car mileage, is reduced, the focus should be on improving the environmental performance of new car propulsion, where much greater benefits can be achieved. This is now the main driving force behind the government’s old ICEV scrapping schemes, which are replacing more efficient EVs. However, research by Kagawa et al. [43] shows that incentives to shorten the life cycle of cars may undermine the goals of sustainable development due to the increase in the number of new cars and the increase in emissions related to their production.
The results of optimizing the long-term replacement policy show that extending the life of the new car shortens the use of the old car and results in lower cumulative fees for the replacement of both cars. According to the data in Table 1, such optimization minimizing the environmental impact can result in extending the life of a new car by up to 30 years. A car’s 30-year useful life is not acceptable, and the potential environmental benefits are uncertain and related to projections of future car technology improvements. In the real world, very strong regulations and technological developments can result in shorter optimal lifetimes, which may result in a lower cumulative impact score. Despite the uncertainties, the optimal use periods set are significantly longer than the average car use limit in the EU. These results are consistent with previous findings by other authors. The research of Uson et al. [35] shows that the replacement of a vehicle is in no way justified by energy and environmental considerations before the age of 20. Similarly, Kim et al. [33], due to energy and CO2, set the optimum replacement period at 18 years.
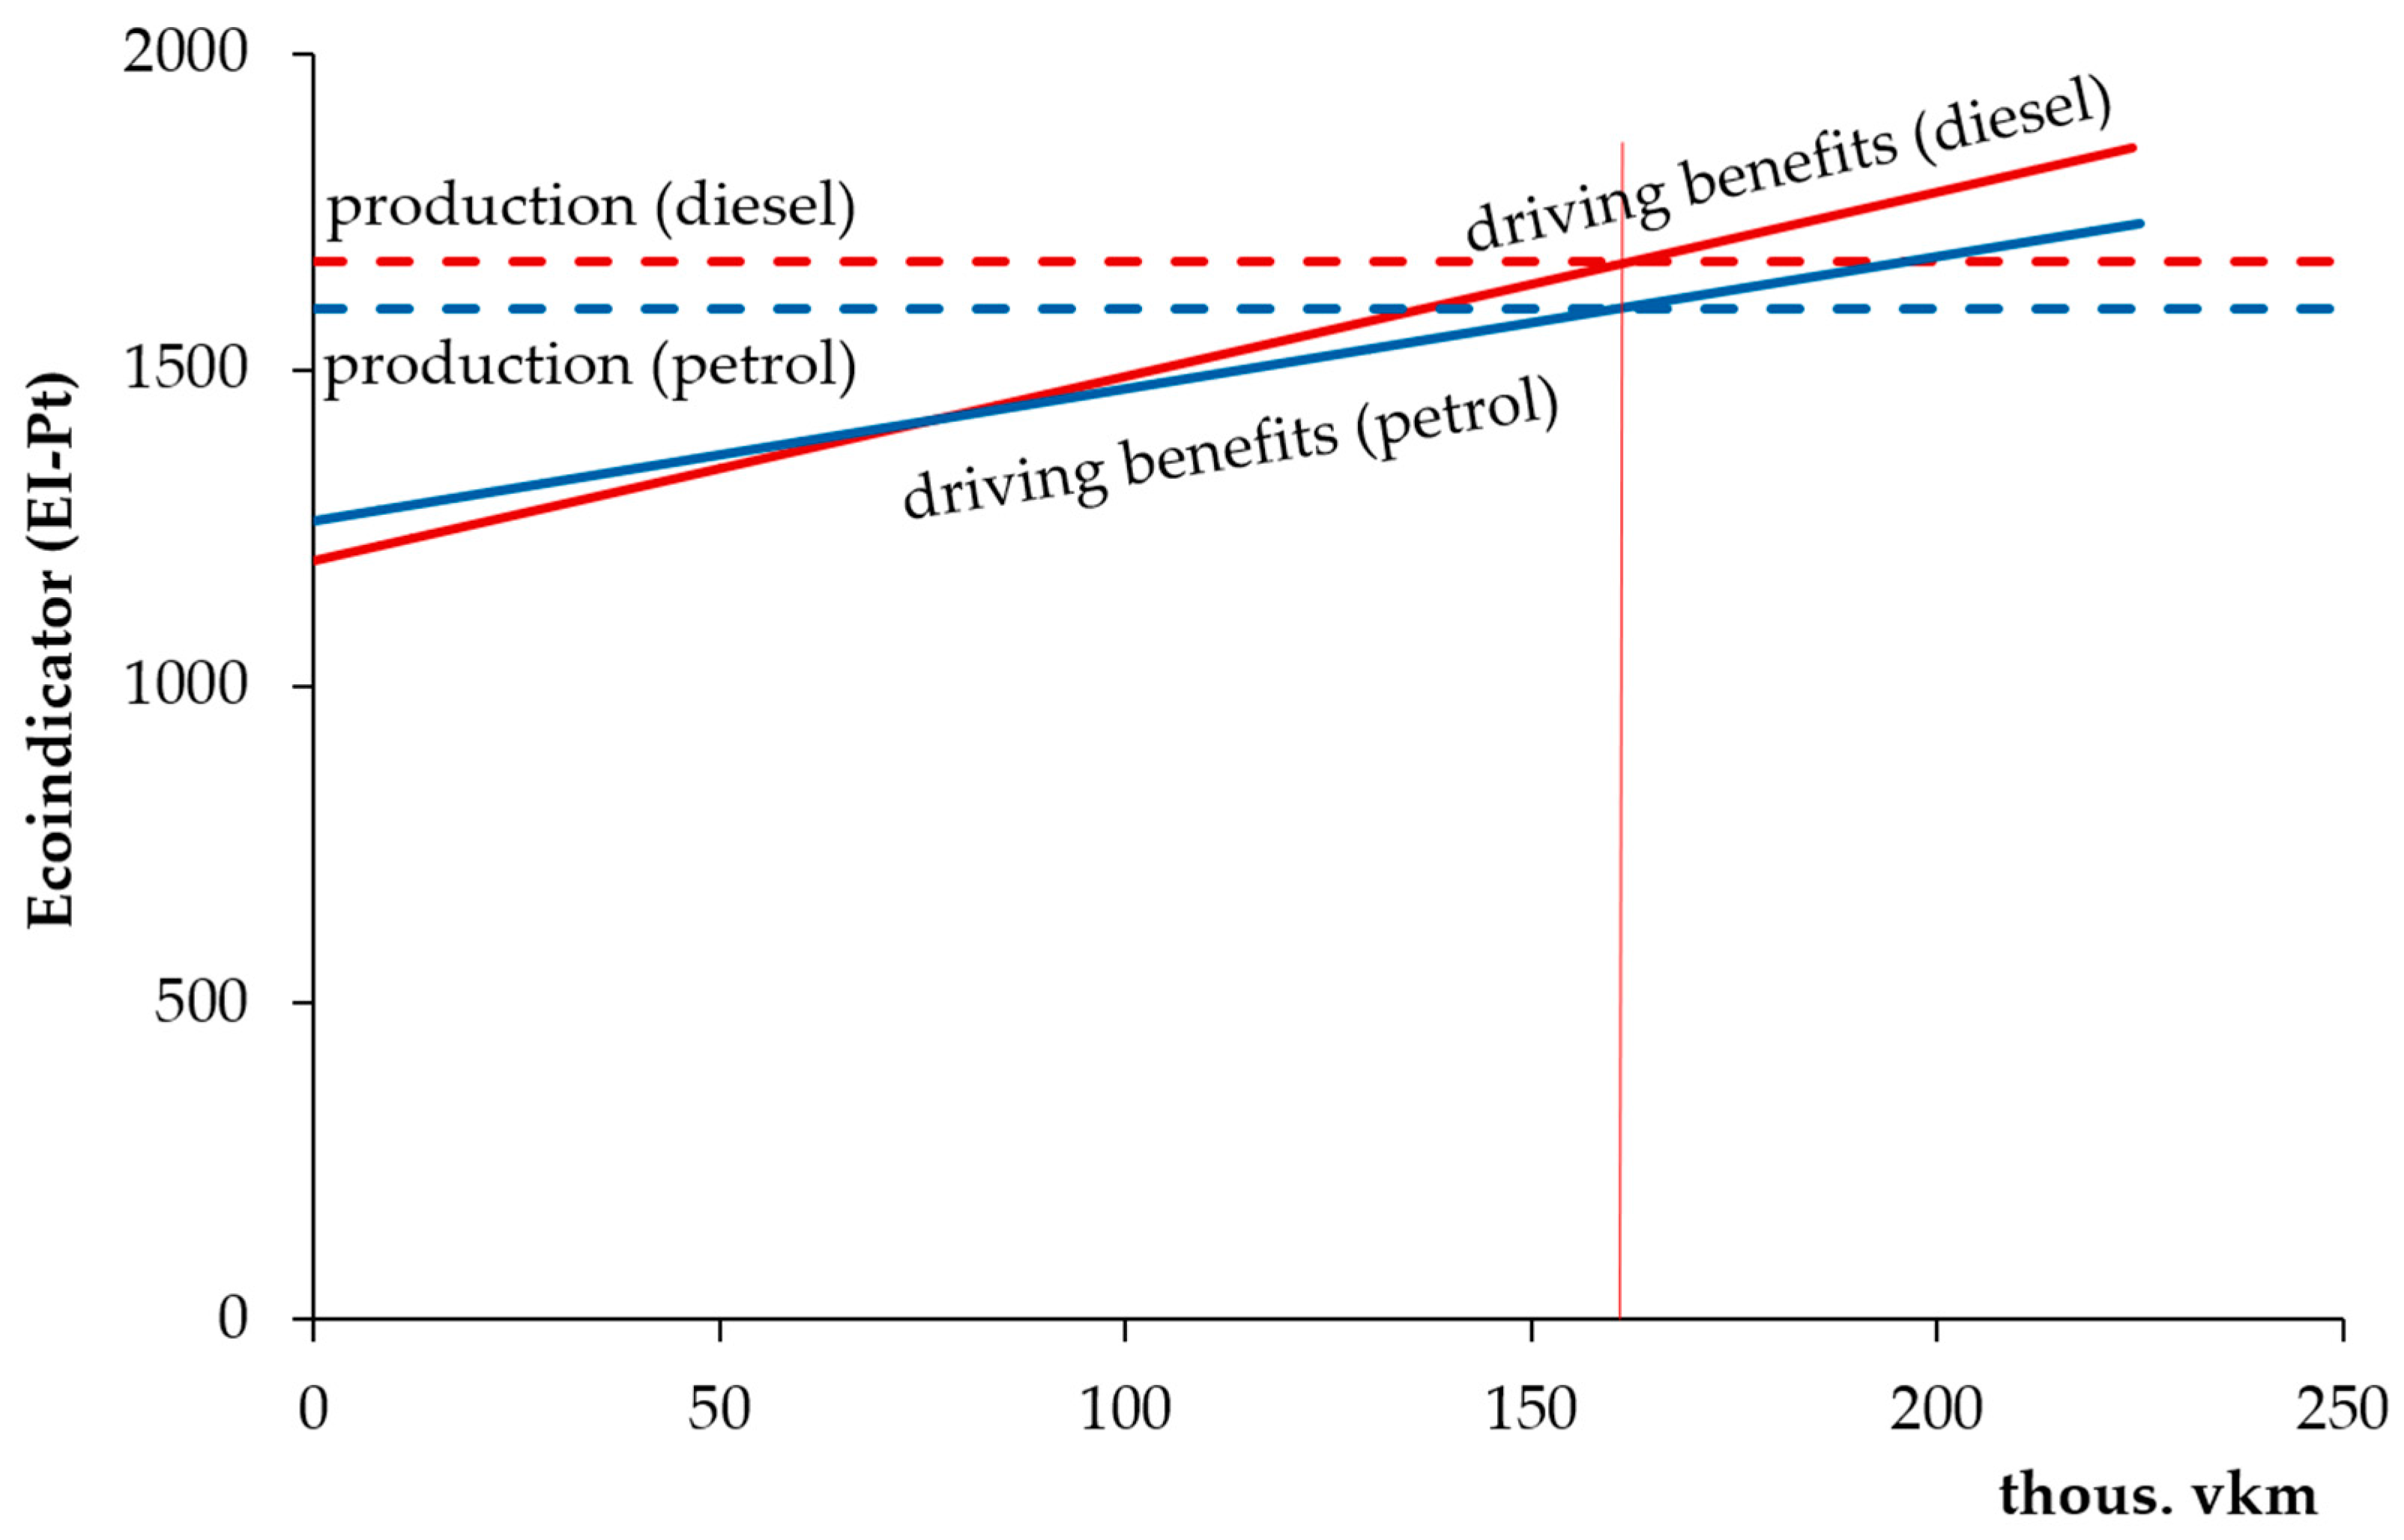
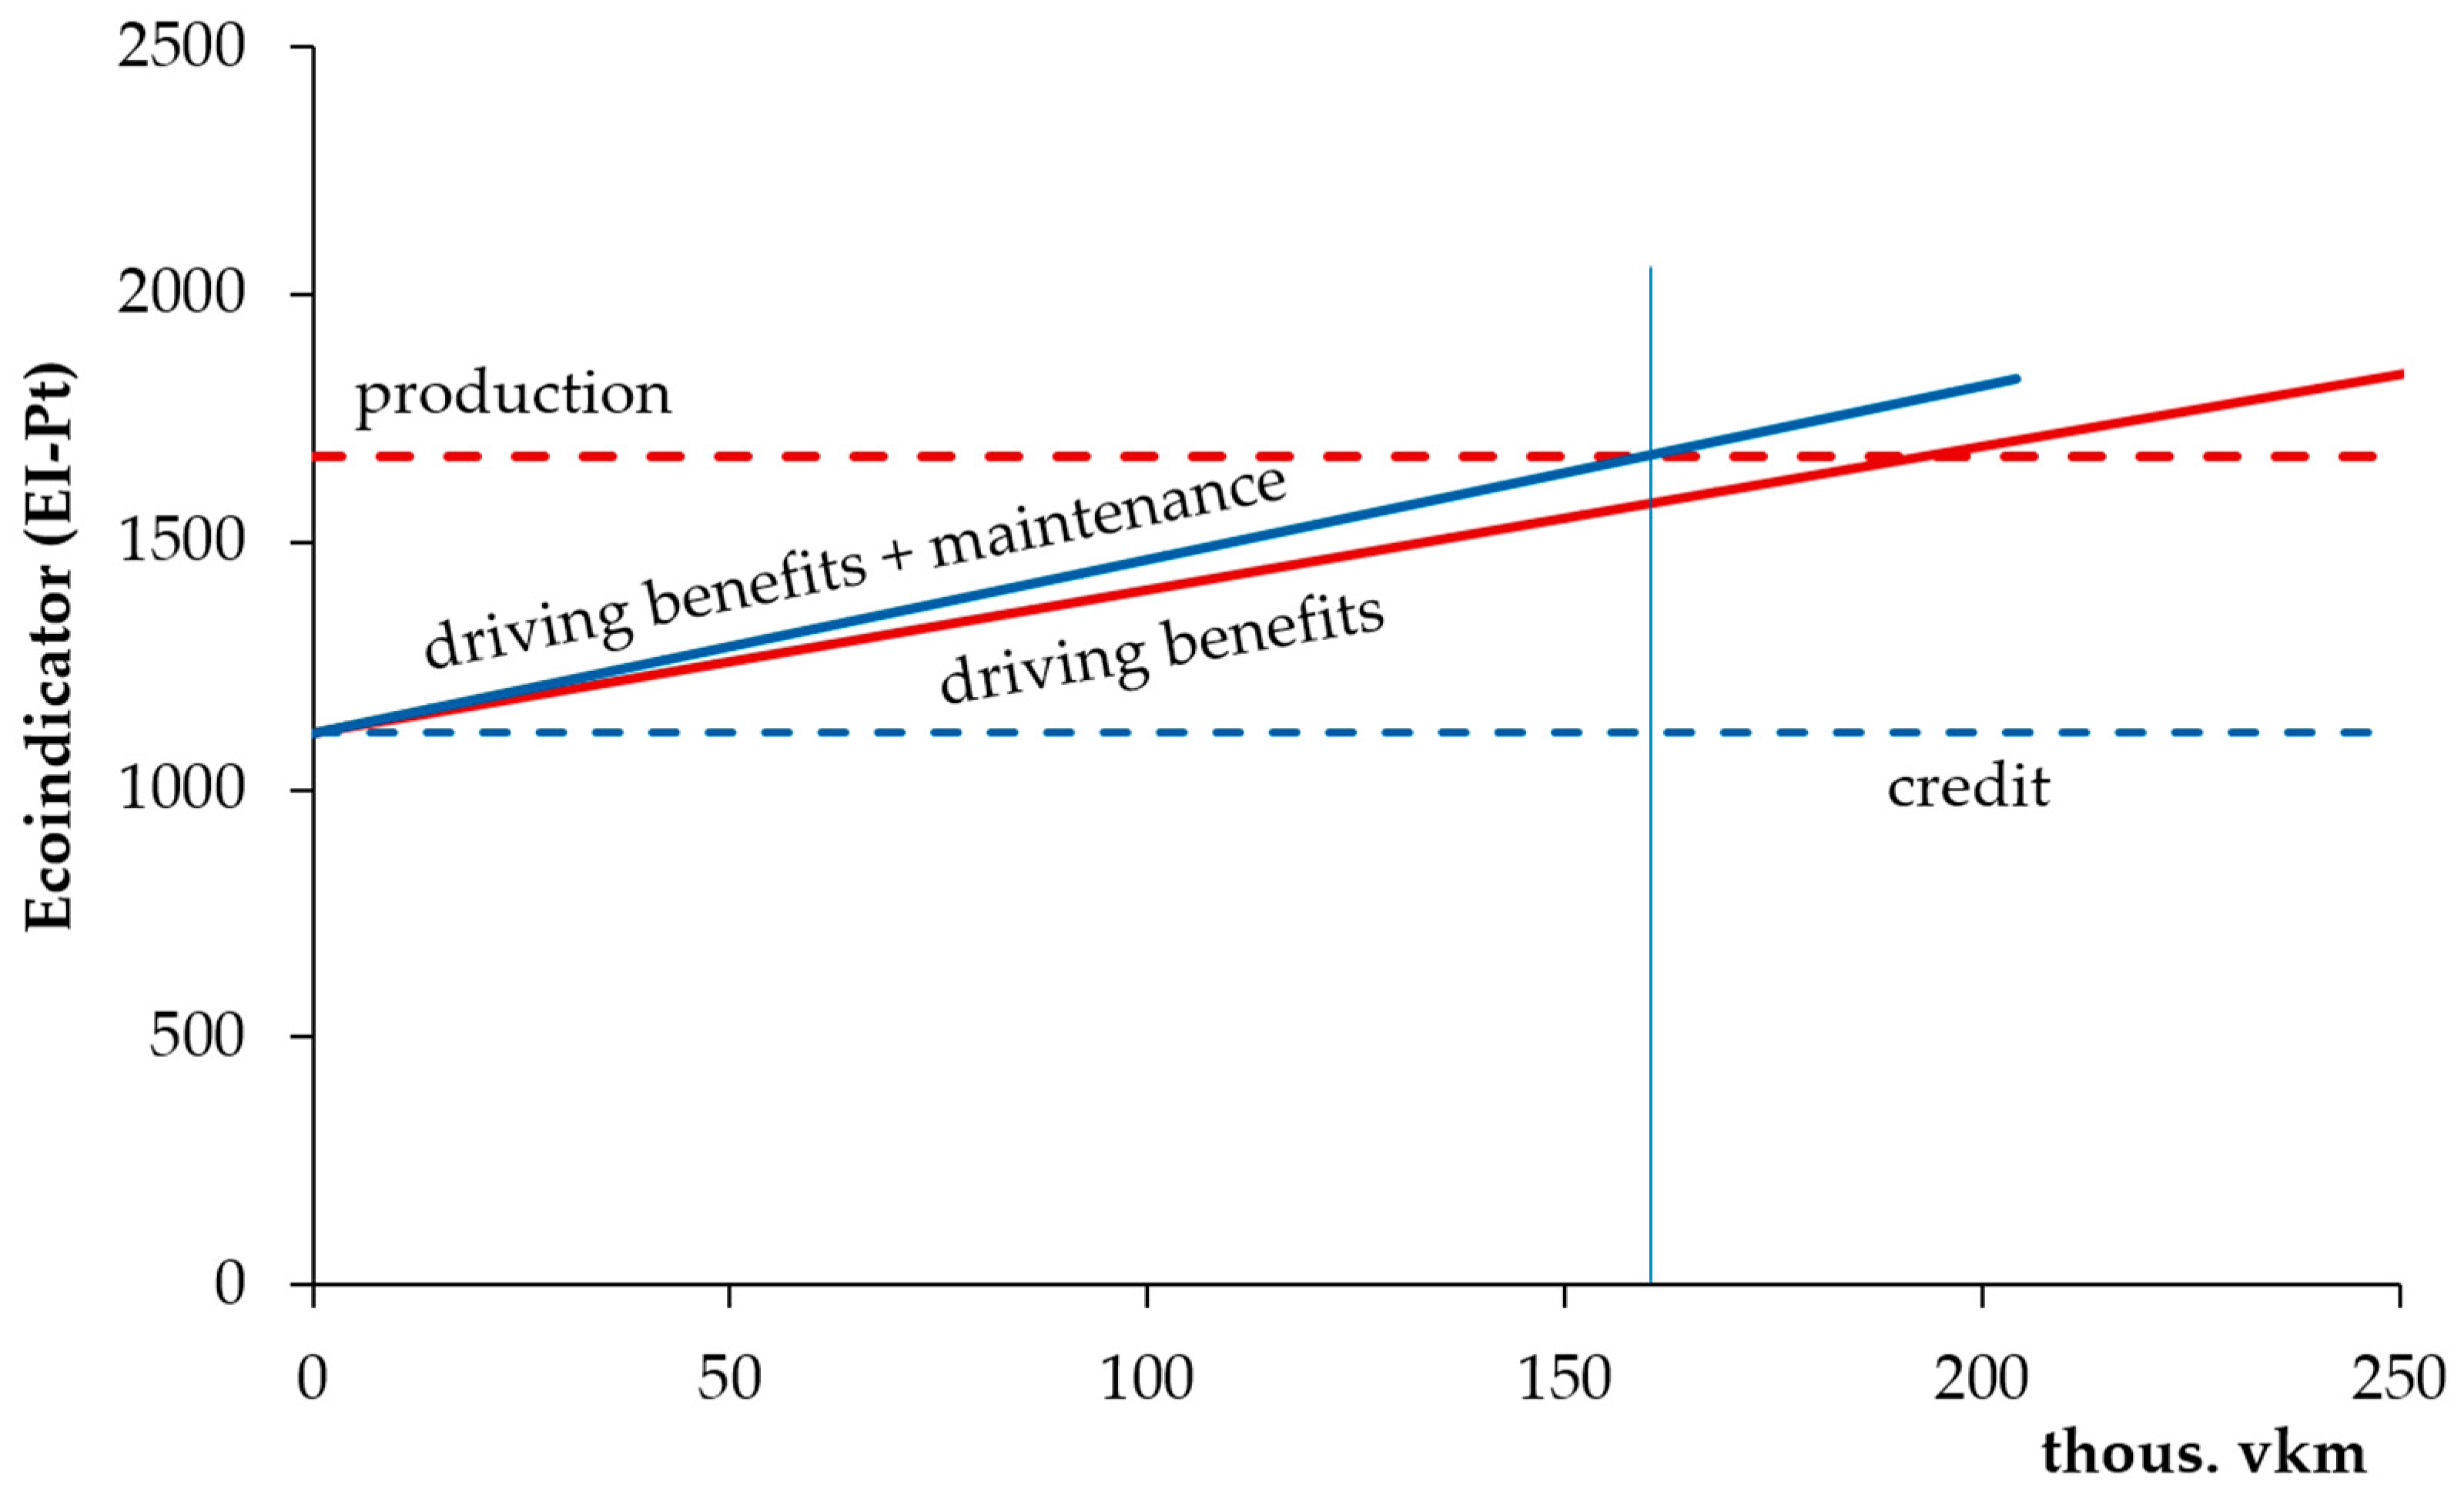
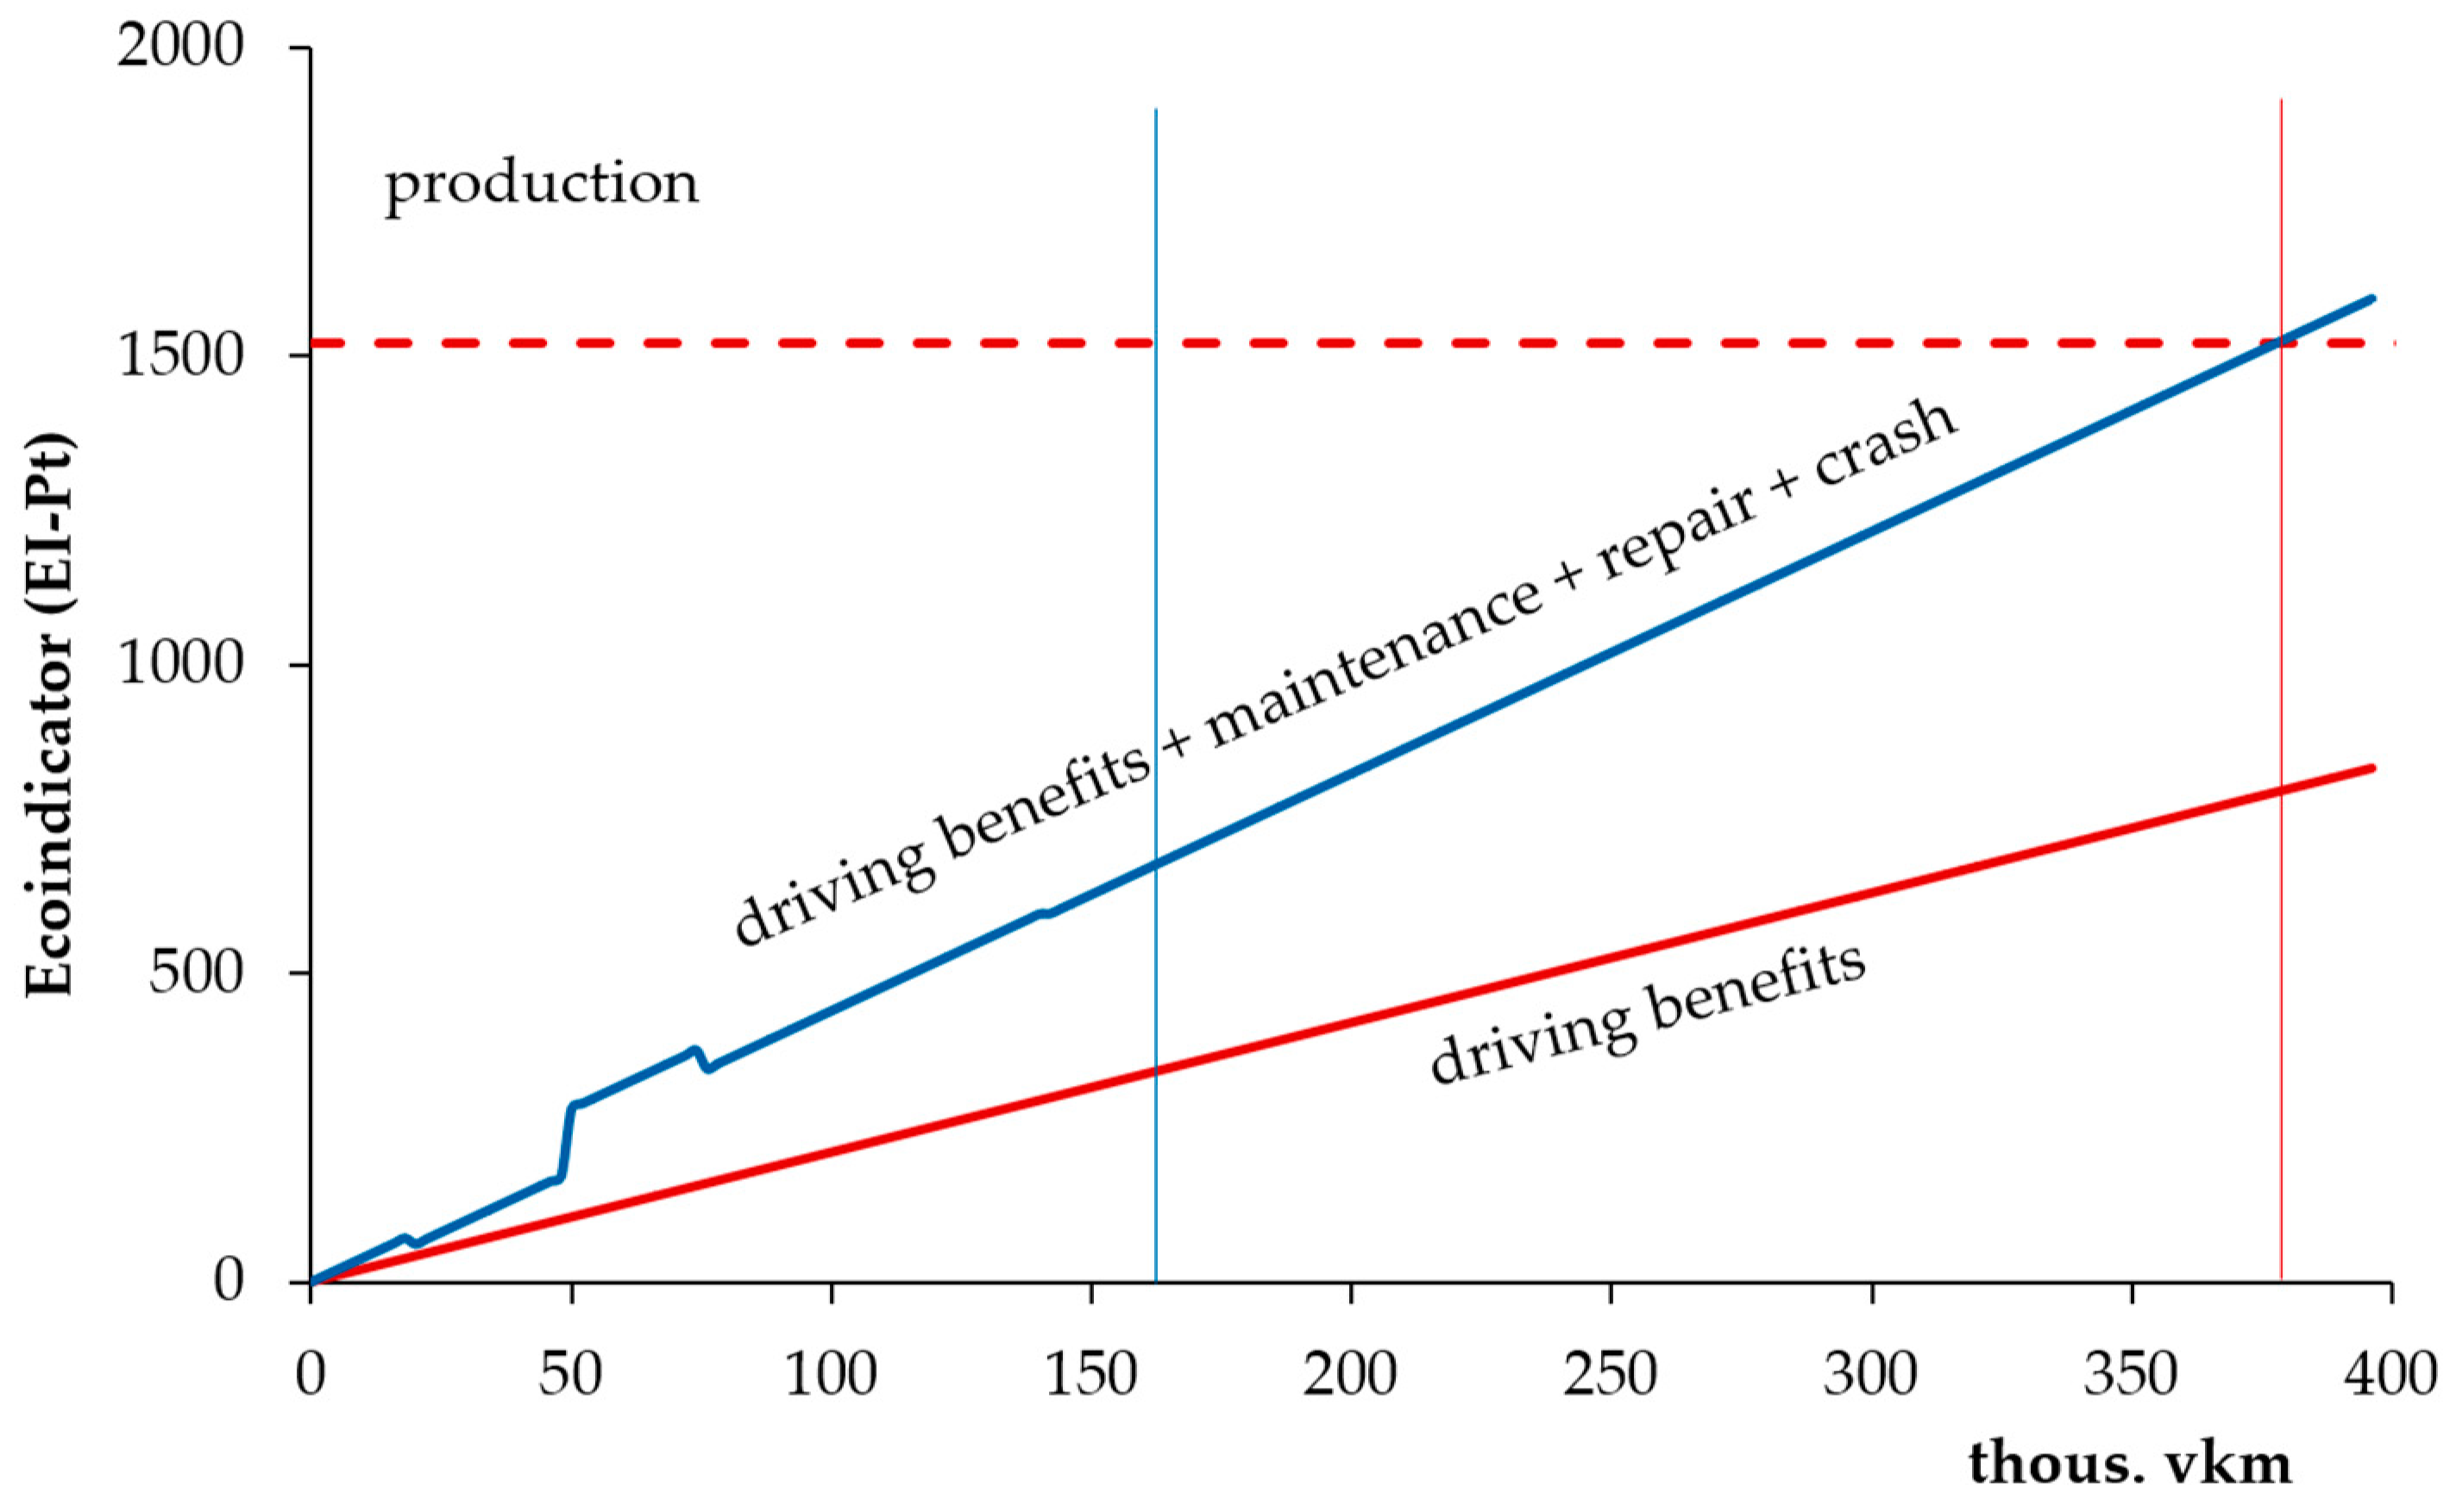
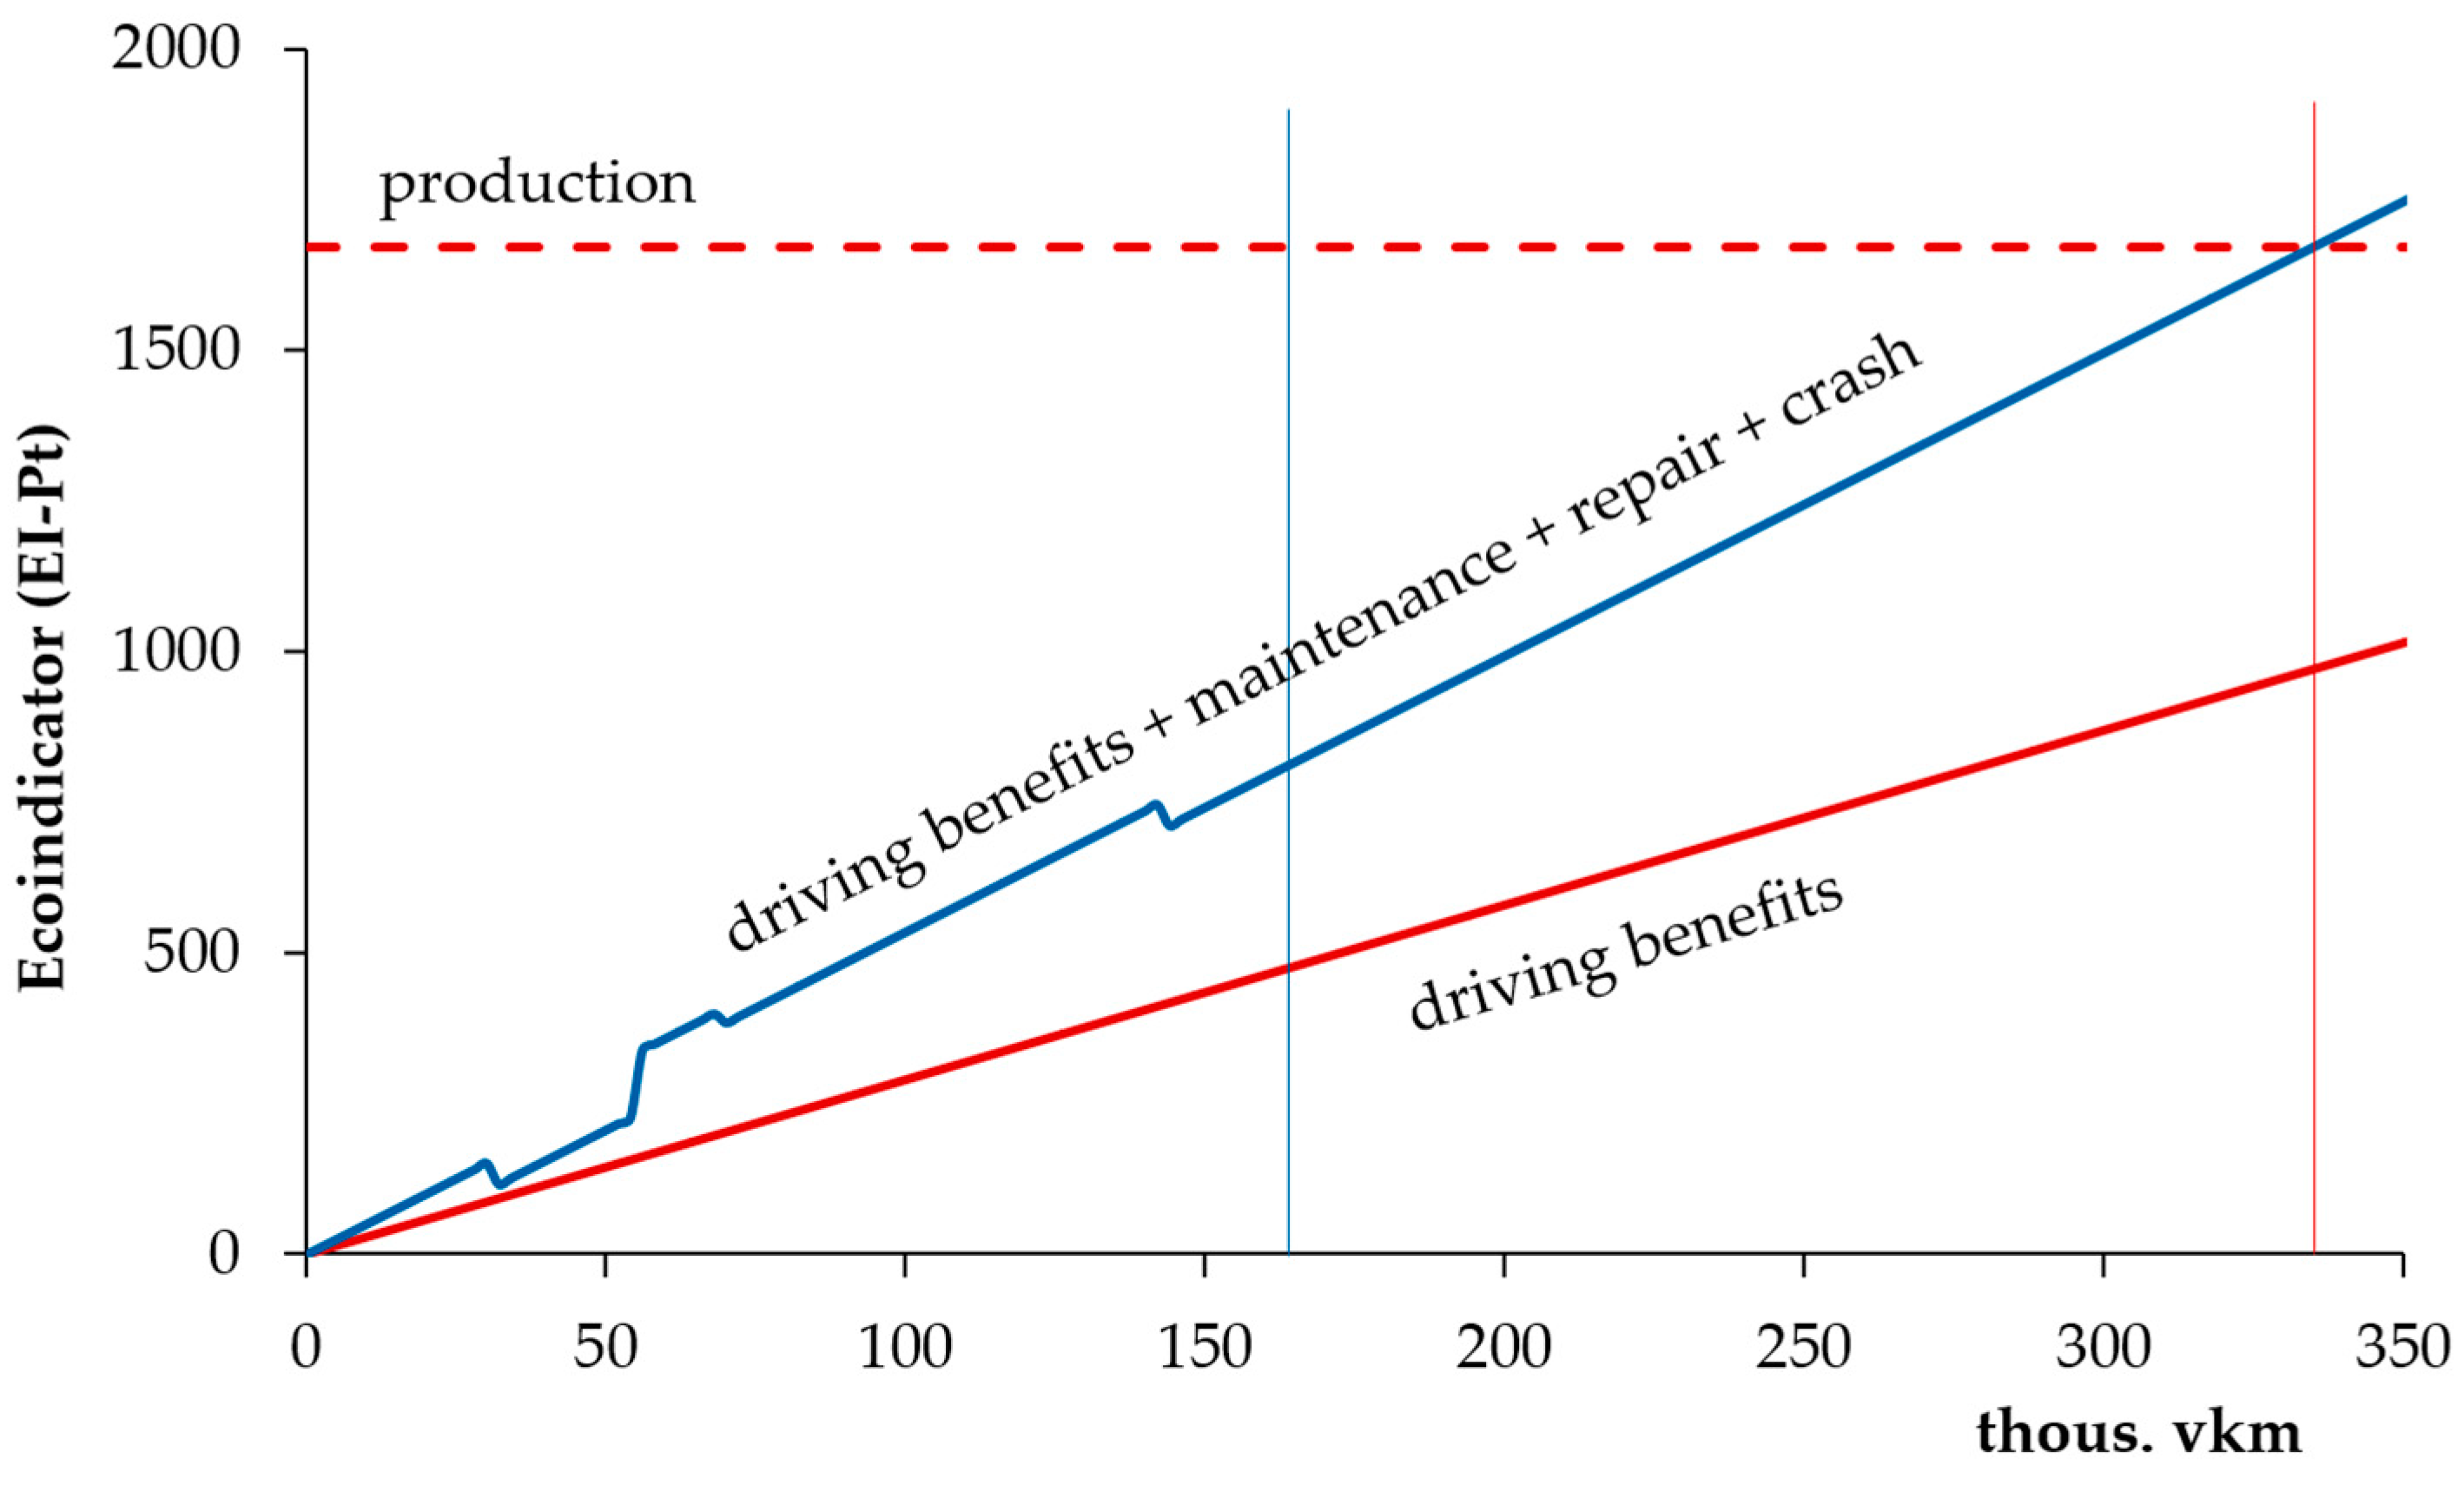
For long-term replacement policies, a relationship was determined to optimize the use of the old and new car. This relationship shows that by keeping the old diesel car five times longer from 47,500 to 250,000 vkm, the period of use of the new car can be shortened by approx. one-third, from 432,000 to 284,000 vkm. Such a policy increases the benefits of maintaining a new car. Here, the maintenance contribution accounts for about 50% of the total environmental performance of a new car. In the forecast, as the old car’s performance deteriorates more rapidly over time and the new car’s performance improves due to technology improvements, the optimal lifespan of the replacement cars would be even shorter.
The environmental optimization results presented also show compliance with economically ideal replacement intervals. Spitzley et al. [11], studying life cycle costs, found that in American conditions, the ideal replacement intervals are 17–19 years, despite differences in repair costs, purchase price and vehicle class. Further research is needed from an environmental and economic perspective to better understand all the benefits that improvements in vehicle technology can bring and to carry out a life cycle assessment analysis.

6. Conclusions

In this study, a life cycle optimization model was used to solve the problem of replacing an old car, taking into account maintenance environmental profiles developed on the basis of detailed inventory data from a Ford service center in Poland. While decisions to retire a vehicle are most often driven by economic considerations, optimal vehicle life is also a complex resource and environmental management issue. In both decision-making situations, there is always a trade-off between the costs and benefits of investing in a new, more efficient, reliable and less polluting car, and continuing to use the old car, which is less efficient, more polluting and requires more maintenance and repair. Life cycle assessment (LCA) offers a comprehensive method of assessing the effects of car replacement in order to minimize the environmental impact over a fixed planning horizon.
The study analyzed two vehicle replacement policies: short-term and long-term, which represent different approaches to the problem of replacement by two different groups of individual consumers. The study was conducted using the example of replacing an average car with a newer model that differs in fuel efficiency, emission factors and the distribution of loads and impacts of maintenance and repairs.
Model studies have shown a significant impact of maintenance on optimal periods of replacement. In particular, it was found that short replacement cycles over a period no longer than the average EU car use limit do not provide a balance of benefits and production burdens that need to be optimized over a much longer period of use. In a long-term replacement policy that minimizes the environmental impact of replacement, the optimal lifespan of a new car may be 20–30 years and depends on the lifetime of the old car and the environmental performance of the new car.
The results of such an assessment indicate the need for the continuous improvement of inventory data to keep up with changes in vehicle technology. This is of particular importance for optimizing ICEV replacement policies with EVs that are more efficient but require more resources to produce. Also, the use of EVs raises concerns about the life of batteries and other components with a critical environmental impact. Therefore, the collection of comprehensive LCI data and the assessment of the maintenance and end-of-life effects of the listed EV components will be another challenge for further research.

Supplementary Materials

The following supporting information can be downloaded at: https://www.mdpi.com/article/10.3390/app13179843/s1, Figure S1: Total ecoindicator score results (EI-Pt) of petrol Ford Focus irregular maintenance [6]; Figure S2: Total ecoindicator score results (EI-Pt) of Ford Focus diesel irregular maintenance [6]; Figure S3: Total ecoindicator score results (EI-Pt) of petrol Ford Focus repair [6]; Figure S4: Total ecoindicator score results (EI-Pt) of Ford Focus diesel repair [6]; Figure S5: Total ecoindicator score results (EI-Pt) of Ford Focus crash repair; Figure S6: Impacts of different vehicle scenarios [6]; Table S1: Ford Focus fuel consumption for the operation phase; Table S2: Components replaced for different repair scenarios; Table S3: Ford Focus fuel consumption for the operation phase [6]; Table S4: Overview of Ford Focus vehicle scenarios; Table S5: Fuel consumption and emission factors of Ford Focus cars as inputs to the life cycle optimization model; Table S6: Overview of Ford Focus scenarios as inputs to the life cycle optimization model.

Author Contributions

Conceptualization, K.D. and P.S.; methodology, K.D.; software, K.U. and P.S.; validation, K.D., P.S. and K.U.; formal analysis, K.D.; investigation, K.D.; resources, P.S.; data curation, K.D.; writing—original draft preparation, K.D., P.S. and K.U.; writing—review and editing, K.D. and K.U.; visualization, K.D.; supervision, K.D.; project administration, K.D.; funding acquisition, K.U. All authors have read and agreed to the published version of the manuscript.

Funding

This research received no external funding.

Institutional Review Board Statement

Not applicable.

Informed Consent Statement

Not applicable.

Data Availability Statement

No new data were created.

Conflicts of Interest

The authors declare no conflict of interest.

References

  1. OICA. International Organization of Motor Vehicle Manufacturers, World Motor Vehicle Production by Country/Region and Type. Available online: https://www.oica.net/wp-content/uploads/By-country-region-2022.pdf (accessed on 4 July 2023).
  2. ACEA. Vehicles in Use Europe 2023. Available online: https://www.acea.auto/files/ACEA-report-vehicles-in-use-europe-2023.pdf (accessed on 10 July 2023).
  3. SAMAR. Instytut Badań Rynku Motoryzacyjnego, Rynek Samochodów Używanych—Samochody Osobowe Po Raz Pierwszy Rejestrowane i Przerejestrowywane w Kraju. Available online: https://www.samar.pl/__/1001/1001.rep/20/10--Rynek-samochod%C3%B3w-u%C5%BCywanych---Samochody-osobowe-po-raz-pierwszy-rejestrowane-i-przerejestrowywane-w-kraju.html?locale=pl_PL (accessed on 11 July 2023).
  4. Burnham, A.; Gohlke, D.; Rush, L.; Stephens, T.; Zhou, Y.; Delucchi, M.A.; Birky, A.; Hunter, C.; Lin, Z.; Ou, S.; et al. Comprehensive Total Cost of Ownership Quantification for Vehicles with Different Size Classes and Powertrains; Argonne National Laboratory Study: Chicago, IL, USA, 2021. Available online: https://publications.anl.gov/anlpubs/2021/05/167399.pdf (accessed on 17 August 2023).
  5. Hawkins, T.R.; Singh, B.; Majeau-Bettez, G.; Strømman, A.H. Comparative environmental life cycle assessment of conventional and electric vehicles. J. Ind. Ecol. 2012, 17, 53–64. [Google Scholar] [CrossRef]
  6. Danilecki, K.; Eliasz, J.; Smurawski, P.; Stanek, W.; Szlęk, A. Modeling inventory and environmental impacts of car maintenance and repair: A case study of Ford Focus passenger car. J. Clean. Prod. 2021, 315, 128085. [Google Scholar] [CrossRef]
  7. Visentin, C.; Trentin, A.W.; Braun, A.B.; Thomé, A. Life cycle sustainability assessment: A systematic literature review through the application perspective, indicators, and methodologies. J. Clean. Prod. 2020, 270, 122509. [Google Scholar] [CrossRef]
  8. Costa, D.; Quinteiro, P.; Dias, A.C. A systematic review of life cycle sustainability assessment: Current state, methodological challenges, and implementation issues. Sci. Total Environ. 2019, 686, 774–787. [Google Scholar] [CrossRef] [PubMed]
  9. Vesovic, V.; Jovanovic, D.; Arsic, M.; Avramovic, Z.; Sofijanic, S.; Djorovic, B.; Gospic, N.; Tomovic, N.; Miloszević, D.; Dobric, M.; et al. Identification of the Right Moment for Motor Vehicle Replacement—Life-Cycle Analysis in Serbia and Montenegro. Sustainability 2022, 14, 2744. [Google Scholar] [CrossRef]
  10. Kim, D.S.; Porter, D.J.; Kriett, P.; Mbugua, W.; Wagner, T. Fleet Replacement Modeling. Oregon State University, FHWA-OR-RD-10-01, 2009. Available online: https://www.oregon.gov/odot/Programs/ResearchDocuments/Fleet_Model.pdf (accessed on 15 July 2023).
  11. Spitzley, D.V.; Grande, D.E.; Gruhl, T.; Keoleian, G.A.; Bean, J.C. Automotive Life Cycle Economics and Replacement Intervals; University of Michigan: Ann Arbor, MI, USA, 2004; pp. 1–46. [Google Scholar]
  12. Redmer, A. Strategic vehicle fleet management–a joint solution of make-or-buy, composition and replacement problems. J. Qual. Maint. Eng. 2022, 28, 327–349. [Google Scholar] [CrossRef]
  13. Redmer, A. Strategic vehicle fleet management—The replacement problem. Logforum 2016, 12, 17–24. [Google Scholar] [CrossRef]
  14. Boudart, J.; Figliozzi, M. Key Variables Affecting Decisions of Bus Replacement Age and Total Costs. Transp. Res. Rec. J. Transp. Res. Board 2012, 2274, 109–113. [Google Scholar] [CrossRef]
  15. Inegbedion, H.; Aghedo, M. A model of vehicle replacement time with overloading cost constraint. J. Manag. Anal. 2018, 5, 350–370. [Google Scholar] [CrossRef]
  16. Stasko, T.H.; Gao, H.O. Developing green fleet management strategies: Repair/retrofit/replacement decisions under environmental regulation. Transp. Res. Part A Policy Pract. 2012, 46, 1216–1226. [Google Scholar] [CrossRef]
  17. Bajpai, J.N. Emerging vehicle technologies and the search for urban mobility solutions. Urban Plan. Transp. Res. 2016, 4, 83–100. [Google Scholar] [CrossRef]
  18. Vanderseypen, E. Current and Future Situation of Obsolescence in the Automotive Industry. Master’s Thesis, University de Louvain, Bruxelles, Belgium, 2018. Available online: https://dial.uclouvain.be/memoire/ucl/fr/object/thesis%3A14403/datastream/PDF_01/view (accessed on 20 August 2023).
  19. He, H.; Fan, J.; Li, Y.; Li, J. When to switch to a hybrid electric vehicle: A replacement optimisation decision. J. Clean. Prod. 2017, 148, 295–303. [Google Scholar] [CrossRef]
  20. Feng, W.; Figliozzi, M. An economic and technological analysis of the key factors affecting the competitiveness of electric commercial vehicles: A case study from the USA market. Transp. Res. Part C Emerg. Technol. 2013, 26, 135–145. [Google Scholar] [CrossRef]
  21. Feng, W.; Figliozzi, M. Vehicle technologies and bus fleet replacement optimization: Problem properties and sensitivity analysis utilizing real-world data. Public Transp. 2014, 6, 137–157. [Google Scholar] [CrossRef]
  22. Zaman, H.; Zaccour, G. Vehicle scrappage incentives to accelerate the replacement decision of heterogeneous consumers. Omega 2020, 91, 102016. [Google Scholar] [CrossRef]
  23. Tamor, M.A.; Milačić, M. Electric vehicles in multi-vehicle households. Transp. Res. Part C Emerg. Technol. 2015, 56, 52–60. [Google Scholar] [CrossRef]
  24. Bauer, G. The impact of battery electric vehicles on vehicle purchase and driving behavior in Norway. Transp. Res. Part D Transp. Environ. 2018, 58, 239–258. [Google Scholar] [CrossRef]
  25. Kontou, E.; Yin, Y.; Lin, Z.; He, F. Socially optimal replacement of conventional with electric vehicles for the US household fleet. Int. J. Sustain. Transp. 2017, 11, 749–763. [Google Scholar] [CrossRef]
  26. Hofmann, J.; Guan, D.; Chalvatzis, K.; Huo, H. Assessment of electrical vehicles as a successful driver for reducing CO2 emissions in China. Appl. Energy 2016, 184, 995–1003. [Google Scholar] [CrossRef]
  27. Karlewski, H.; Lehmann, A.; Ruhland, K.; Finkbeiner, M. A Practical Approach for Social Life Cycle Assessment in the Automotive Industry. Resources 2019, 8, 146. [Google Scholar] [CrossRef]
  28. Buberger, J.; Kersten, A.; Kuder, M.; Eckerle, R.; Weyh, T.; Thiringer, T. Total CO2-Equivalent Life-Cycle Emissions from Commercially Available Passenger Cars. Renew. Sustain. Energy Rev. 2022, 159, 112158. [Google Scholar] [CrossRef]
  29. Xiong, S.; Ji, J.; Ma, X. Comparative Life Cycle Energy and GHG Emission Analysis for BEVs and PhEVs: A Case Study in China. Energies 2019, 12, 834. [Google Scholar] [CrossRef]
  30. Leduc, G.; Mongelli, I.; Uihlein, A.; Nemry, F. How can our cars become lesspolluting? An assessment of the environmental improvement potential of cars. Transp. Policy 2010, 17, 409–419. [Google Scholar] [CrossRef]
  31. Petrauskienė, K.; Galinis, A.; Kliaugaitė, D.; Dvarionienė, J. Comparative Environmental Life Cycle and Cost Assessment of Electric, Hybrid, and Conventional Vehicles in Lithuania. Sustainability 2021, 13, 957. [Google Scholar] [CrossRef]
  32. Wursthorn, S.; Feifel, S.; Walk, W.; Patyk, A. An environmental comparison of repair versus replacement in vehicle maintenance. Transportation Research Part D Transport and Environment. 2010, 15, 356–361. [Google Scholar] [CrossRef]
  33. Kim, H.C.; Hyung, C.; Keoleian, G.A.; Grande, D.E.; Bean, J.C. Life Cycle Optimization of Automobile Replacement: Model and Application. Environ. Sci. Technol. 2003, 37, 5407–5413. [Google Scholar] [CrossRef]
  34. Kim, H.; Keoleian, G.; Spatari, S.; Bulkley, J. Optimizing Vehicle Life Using Life Cycle Energy Analysis and Dynamic Replacement Modeling. Presented at SAE Total Life-Cycle Conference, Detroit, MI, USA, 26–28 April 2000. SAE Technical Paper 2000-01-1499. [Google Scholar] [CrossRef]
  35. Usón, A.A.; Capilla, A.; Bribián, I.; Scarpellini, S.; Sastresa, E.L. Energy efficiency in transport and mobility from an eco-efficiency viewpoint. Energy 2011, 36, 1916–1923. [Google Scholar] [CrossRef]
  36. Held, M.; Rosat, N.; Georges, G.; Pengg, H.; Boulouchos, K. Lifespans of passenger cars in Europe: Empirical modelling of fleet turnover dynamics. Eur. Transp. Res. Rev. 2021, 13, 9. [Google Scholar] [CrossRef]
  37. Barjoveanu, G.; Dinita, F.; Teodosiu, C. Aging Passenger Car Fleet Structure, Dynamics, and Environmental Performance Evaluation at the Regional Level by Life Cycle Assessment. Sustainability 2022, 14, 8443. [Google Scholar] [CrossRef]
  38. Kagawa, S.; Hubacek, K.; Nansai, K.; Kataoka, M.; Managi, S.; Suh, S.; Kudoh, Y. Better cars or older cars?: Assessing CO2 emission reduction potential of passenger vehicle replacement programs. Glob. Environ. Change 2013, 23, 1807–1818. [Google Scholar] [CrossRef]
  39. Schweimer, G.W.; Levin, M. Life Cycle Inventory of the Golf A4. In Research Environment and Transport; Volkswagen AG: Berlin, Germany; Wolfsburg and Center of Environmental System Research, University of Kassel: Kassel, Germany, 2000. [Google Scholar]
  40. Ecoinvent, 2023. The Ecoinvent Database. Available online: https://ecoinvent.org/the-ecoinvent-database/ (accessed on 14 July 2023).
  41. Database & Support Team at PRé Sustainability. SimaPro Database Manual, Methods Library, 2022. Available online: https://simapro.com/wp-content/uploads/2022/07/DatabaseManualMethods.pdf (accessed on 13 July 2023).
  42. Danilecki, K.; Mrozik, M.; Smurawski, P. Changes in the environmental profile of a popular passenger car over the last 30 years —Results of a simplified LCA study. J. Clean. Prod. 2017, 141, 208–218. [Google Scholar] [CrossRef]
  43. Kagawa, S.; Nansai, K.; Kondo, Y.; Hubacek, K.; Suh, S.; Minx, J.; Kudoh, Y.; Tasaki, T.; Nakamura, S. Role of Motor Vehicle Lifetime Extension in Climate Change Policy. Environ. Sci. Technol. 2011, 45, 1184–1191. [Google Scholar] [CrossRef] [PubMed]
Figure 1. A schematic example of how environmental impact changes when vehicle fuel efficiency increases.
Applsci 13 09843 g001
Figure 2. Schematic example of the model applied to assessing the benefits of replacing cars.
Applsci 13 09843 g002
Figure 3. Schematic example of the optimization model for three car replacement policies.
Applsci 13 09843 g003
Figure 4. Replacement optimization model based on drive efficiency.
Applsci 13 09843 g004
Figure 5. Replacement optimization model based on drive efficiency and maintenance of diesel Ford Focus vehicle.
Applsci 13 09843 g005
Figure 6. Replacement optimization model based on drive efficiency and maintenance of petrol Ford Focus vehicle.
Applsci 13 09843 g006
Figure 7. Replacement optimization model based on drive efficiency and Ford Focus diesel vehicle maintenance and repair.
Applsci 13 09843 g007
Figure 8. Replacement optimization model based on drive efficiency and Ford Focus petrol vehicle maintenance and repair.
Applsci 13 09843 g008
Figure 9. Optimal replacement with minimizing the cumulative impact based on driving efficiency and Ford Focus diesel car maintenance and repair.
Applsci 13 09843 g009
Figure 10. Optimal replacement with minimizing the cumulative impact based on driving efficiency and Ford Focus petrol car maintenance and repair.
Applsci 13 09843 g010
Figure 11. Optimization of the diesel Ford Focus life cycle for various replacement policies in the long term.
Applsci 13 09843 g011
Table 1. Results of optimizing the use time of Ford Focus cars for different replacement scenarios.
Ford Focus EURO 3 (Petrol)Ford Focus EURO 5 (Petrol)Ford Focus EURO 3 (Diesel)Ford Focus EURO 5 (Diesel)
ScenarioService life minimizing environmental impact in short vehicle replacement cycles (vkm)
Fuel efficiency62,800161,00057,650161,000
Maintenance53,600161,00052,100161,000
Maintenance + failures + crash48,900161,00047,500161,000
Optimal use minimizing cumulative impact (vkm) (1)
Maintenance + failures + crash180,000376,00047,500432,000
180,000338,000
200,000322,000
230,000300,000
250,000284,000
(1) The optimal vehicle use lifetime depends on the time horizon of the planning.
Disclaimer/Publisher’s Note: The statements, opinions and data contained in all publications are solely those of the individual author(s) and contributor(s) and not of MDPI and/or the editor(s). MDPI and/or the editor(s) disclaim responsibility for any injury to people or property resulting from any ideas, methods, instructions or products referred to in the content.

