Abstract
A linear system identification technique has been widely used to track neural entrainment in response to continuous speech stimuli. Although the approach of the standard regularization method using ridge regression provides a straightforward solution to estimate and interpret neural responses to continuous speech stimuli, inconsistent results and costly computational processes can arise due to the need for parameter tuning. We developed a novel approach to the system identification method called the detrended cross-correlation function, which aims to map stimulus features to neural responses using the reverse correlation and derivative of convolution. This non-parametric (i.e., no need for parametric tuning) approach can maintain consistent results. Moreover, it provides a computationally efficient training process compared to the conventional method of ridge regression. The detrended cross-correlation function correctly captures the temporal response function to speech envelope and the spectral–temporal receptive field to speech spectrogram in univariate and multivariate forward models, respectively. The suggested model also provides more efficient computation compared to the ridge regression to process electroencephalography (EEG) signals. In conclusion, we suggest that the detrended cross-correlation function can be comparably used to investigate continuous speech- (or sound-) evoked EEG signals.
1. Introduction
Brain processes in response to continuous speech have been investigated through the acquisition of brain electrical activity. Electroencephalography (EEG) has facilitated the understanding of underlying brain activity with high temporal resolution [1,2,3]. Event-related potential (ERP), which is generally computed by averaging EEG signals over trials, has been widely used to extract time-locked neural activities evoked by short-duration speech tokens (e.g., words, syllables, and phonemes) [4,5]. However, using short tokens as stimuli limits our understanding of how the brain processes continuous speech [6].
System identification (SI) is a more direct method to investigate neural entrainment to continuous stimuli by modeling how stimulus features are mapped to neural responses [7]. The SI model, which considers the human brain a linear time-invariant (LTI) system, has been used to understand brain functions in response to specific visual and auditory stimuli [8,9,10,11]. In these studies, reverse correlation was commonly used to characterize the temporal response function (TRF) in an LTI system [12]. This approach, which implements reverse correlation by computing the cross-correlation between the input and output of the system, has been employed to investigate neural entrainment to continuous speech stimuli [13,14,15] as well as to continuous visual stimuli [16,17]. Although this approach has proven able to investigate neural encoding in response to continuous stimuli, it is more appropriate for stochastic process stimuli (e.g., Gaussian white noise) than for slow-modulating and non-stationary stimuli, such as continuous speech [18].
However, natural stimuli for humans rarely exhibit the characteristics of stochastic processes. To address cases involving modeling of the TRF to slow-modulating and non-stationary stimuli, normalized reverse correlation has been considered, which effectively estimates the spectral–temporal receptive field (STRF) of brain neurons for more complex stimuli [19]. Although this normalized reverse correlation can map slow-modulating and non-stationary stimuli to neural responses, problems of matrix inversion and overfitting due to noise along the low-variance dimensions of datasets remain [20]. Regularized linear regression (i.e., ridge regression), developed initially to investigate neural responses to pure-tone stimuli in the primary auditory cortex, has been employed to address these problems [21]. However, incorrect selection of the regularization parameter of ridge regression can result in an inaccurate model [22]. Thus, the intensive optimization of the regularization parameter should be performed with ridge regression. To overcome this inefficiency, in this study, we proposed a non-parametric and computationally efficient approach to model linearization between stimuli and neural responses. The estimated model was developed using a detrended cross-correlation function. The computational efficiency while analyzing EEG data in response to continuous speech stimuli was compared between our approach and the ridge regression method.
2. Materials and Methods
2.1. Experiments
Twenty Korean native speakers (mean age 23.4 ± 3.0 years; 11 males and 9 females) with normal hearing participated in this study. Ten continuous Korean sentences from the Korean Standard Sentence List [23] were used as speech stimuli; the mean sentence duration was 1.9 s, with a standard deviation of 0.2. Each sentence was randomly presented 100 times via a loudspeaker placed 1 m away from the participant at a level of 65 dB SPL. Participants gave written consent before the experiment. All the experimental procedures were approved by the Institutional Review Board of the University of Ulsan.
2.2. EEG Acquisition and Preprocessing
Brain activity in response to continuous speech sentences was recorded using a 64-channel EEG system at a sampling rate of 2048 Hz (Biosemi Co., Amsterdam, The Netherlands). The EEG data were preprocessed using average-referencing and 1–57 Hz band-pass filtering and then resampled at a rate of 256 Hz. Each epoch had a −0.5 to 2.5 s interval relative to the onset of the spoken sentence. Epochs and channels with large-scale artifacts were rejected, and specific channel data were spherically interpolated using nearby channels. Independent component analysis was performed to remove eye blink-related artifacts using EEGLAB [24]. Finally, the data were filtered using a zero-phase anti-aliasing 10-Hz low-pass filter after baseline correction.
2.3. Speech Feature Extraction
The broadband speech envelope and speech spectrogram were used as stimulus features to compute their correlation with the EEG data. The speech envelope extracted using the Hilbert transform was downsampled at a sampling rate of EEG data, at 256 Hz. The spectrogram was computed using a filter bank with a series of 64 band-pass filters with logarithmically spaced bandwidths between 250 and 8000 Hz [25].
2.4. Detrended Cross-Correlation and EEG Analysis
2.4.1. Detrended Cross-Correlation Computation
The detrended cross-correlation approach was originally developed based on the reverse correlation technique and the convolution of the derivatives [12]. The derivative is most commonly used as a pre-whitening method to reduce the effect of spurious correlation caused by trends and internal oscillations in time-series inputs [26,27,28]. Detrended cross-correlation analysis was used to estimate the impulse response function of the LTI system. Here, it assumes that a brain can be modeled as an LTI system, which is characterized by the impulse response of . Then, the output of EEG signals in response to speech envelope can be described as follows:
where is the system input, and is the impulse response function. Equation (1) yields the derivative of the convolution as
where , (Appendix A). From Equation (1), if the input is the white noise, the impulse response function can be measured by cross-correlating the output with the input [12]. The impulse response function can be estimated using the detrended signals of and , i.e., and , respectively, according to Equation (2). The detrended cross-correlation function, , between and is obtained as
We examined the autocorrelation of the original and differentiated speech envelopes to assess the similarity between the autocorrelation and impulse functions. When the autocorrelation of the differentiated input signal converges on the impulse function, the detrended cross-correlation function can be computed as
where represents the power spectral density, which is computed by dividing the root mean square of the input by the spectral bandwidth [29]. Although the derivation action can generally cause noise in the signals, the cross-correlation between the input and output derivatives effectively mitigate noise in the signals. Figure 1 shows examples of speech envelopes of sentence stimuli, the autocorrelation of speech envelopes, and the autocorrelation of the corresponding differentiated speech envelopes. The shape of the autocorrelation of the differentiated speech envelope more closely resembles an impulse function than that of the original speech envelope, indicating that the differentiated speech envelope is more suitable for identifying the brain system.
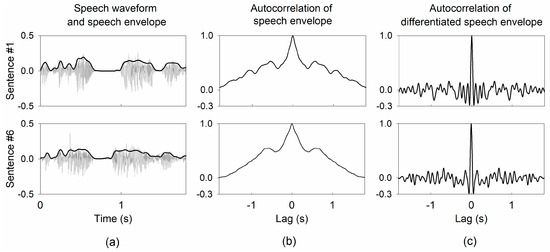
Figure 1.
Examples of autocorrelation of speech envelopes from two sentences in input stimuli. (a) speech waveform and speech envelope for sentences #1 and #6, (b) the autocorrelation of the speech envelopes, and (c) the autocorrelation of the differentiated speech envelopes.
2.4.2. Forward Model Computation
The detrended cross-correlation function was computed between the brain response and the differentiated speech envelope to predict the brain response and investigate brain mechanisms under speech stimuli processing. This study used a detrended cross-correlation function to predict EEG signals in response to sentence speech stimuli. The measured EEG data, denoted as , were acquired at a specific channel in response to continuous speech represented by . Similar to Equation (1), the measured EEG data can be modeled as follows:
where represents the TRF of the brain, is the noise process, and corresponds to the lag between the stimulation and neural response. The TRF of the brain was estimated using the following formula:
In this study, the trained TRF was computed over a lag range of −100 ms to 500 ms, which is relevant to the stimulus onset. The forward model (i.e., the encoding model) was obtained through ridge regression using the mTRF toolbox implemented in MATLAB as the reference model [18]. The optimal alpha value for ridge regression was selected within the range of 10−6 to 106. The baseline-normalized TRF was computed as follows:
where and represent the mean and standard deviation of TRF during the baseline period of −250 to 0 ms before stimulus onset.
The univariate model uses a speech envelope as the system input to estimate the TRF of the brain in response to speech stimuli. The multivariate model was computed using the TRFs of 64 frequency bands to approximate the STRF of the brain-to-speech stimuli. The multivariate forward model aims to determine the STRFs for a speech spectrogram ranging from 250 to 6000 Hz.
2.4.3. Model Training and Performance Evaluation
An individual model was constructed by averaging across sweeps for each subject, in which subsets were used for training. The remaining subset, independent of the training set, was used to test the trained model. The model was validated using a leave-one-out cross-validation approach [30]. The Pearson correlation between the measured EEG data and the predicted EEG data over 64 channels was used to evaluate the model performance. Subsequently, the grand-averaged model was computed by averaging the models’ weights for all 20 subjects.
2.4.4. Model Significance Evaluation
The models were computed using lag intervals of −100 to 500 ms and −250 to 0 ms, relevant to speech onset, as the trained and baseline models, respectively. A one-tailed paired -test was used to evaluate the statistical significance of the trained models of the detrended cross-correlation function and ridge regression against the baseline models.
2.4.5. Comparisons of Computational Efficiency and Cross-Validation Performance
In addition to comparing the model performance of the two methods, we also compared the two methods for computational efficiency. The model performance was evaluated using the Pearson correlation coefficient between the predicted EEG and the original EEG signals. The computational efficiency was measured as the elapsed time required to train each model. A two-tailed paired -test was used to evaluate the differences between the detrended cross-correlation function and ridge regression in terms of computational efficiency and model performance.
3. Results
3.1. Performance of the Univariate Forward Model
Figure 2A illustrates the TRFs estimated using the detrended cross-correlation function (left panel) and ridge regression (right panel) for a typical Cz channel. The P1-N1-P2 peaks in the TRFs were observed at 75, 120, and 210 ms, respectively. The Pearson correlation coefficient between the TRFs of the two methods is 0.941, indicating a high level of similarity between the results obtained from the detrended cross-correlation function and ridge regression. Figure 2B shows an example of EEG prediction at Cz and the prediction accuracy of the 64 channels in the topology format for both approaches. Both the detrended cross-correlation model and the ridge regression model performed well in the central and temporal areas, with Pearson’s r values of 0.308 and 0.300, respectively, for the Cz channel (Figure 2C).
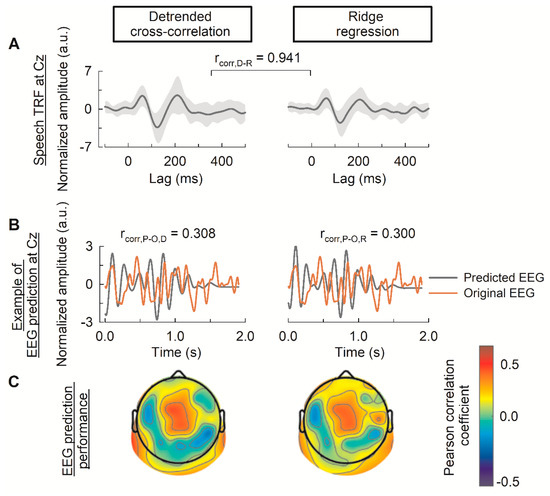
Figure 2.
Performance of the univariate model computed using the detrended cross-correlation function and ridge regression. (A) The temporal response function (TRF) estimated using the detrended cross-correlation and ridge regression at the Cz channel. The solid line represents the grand-averaged TRF across subjects (n = 20). The shaded area represents the confidence band (95%) computed by the standard deviation of 20 subject models’ weights. Pearson correlation between the TRF of the detrended cross-correlation and ridge regression is denoted in the middle. (B) The example of predicted EEG at the Cz channel. The Pearson correlation between the model’s prediction and EEG signal is denoted at the top of each figure. (C) The EEG prediction performance on a test set across the 64 channels. a.u. denotes amplitude unit. D, R, P, and O in the subscript denote detrended cross-correlation function, ridge regression, predicted EEG, and original EEG, respectively.
3.2. Performance of the Multivariate Forward Model
The top portion of Figure 3A depicts the speech STRF for channel Cz, calculated using detrended cross-correlation and ridge regression. These two methods produced highly correlated STRFs in the lower frequency range (up to approximately 3300 Hz) with a mean ± standard deviation Pearson correlation coefficient of 0.723 ± 0.109. The correlation decreased in the higher frequency range, with a Pearson correlation coefficient of 0.564 ± 0.116 (Figure 3A, far-right panel).
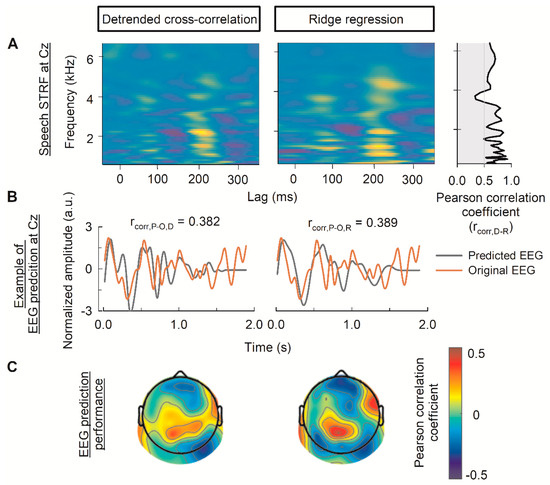
Figure 3.
Performance of the multivariate model computed using the detrended cross-correlation function and ridge regression. (A) The grand-averaged spectral–temporal receptive field (STRF) estimated using the detrended cross-correlation and ridge regression at the Cz channel. On the far right of the panel, the Pearson correlation between the temporal response function (TRF) of the detrended cross-correlation and ridge regression at each frequency band is indicated. (B) The example of original and predicted EEG at the Cz channel. The Pearson correlation between the model’s prediction and original EEG signal is denoted at the top of each figure. (C) The EEG prediction performance on a test set across the 64 channels. a.u. denotes amplitude unit. D, R, P, and O denote detrended cross-correlation function, ridge regression, predicted EEG, and original EEG, respectively.
Figure 3B shows the plots of predicted EEG and original EEG with their similarity measurement in terms of the Pearson correlation coefficient at Cz. The EEG prediction accuracies at Cz were comparable between the detrended cross-correlation function (0.382) and ridge regression (0.389). The topographical distribution of the Pearson correlation coefficients indicated high performance in the central, right frontal, and left temporal lobes for both the detrended cross-correlation function and ridge regression (Figure 3C). However, the topography of the ridge regression revealed more detailed information regarding the performance of individual channels than the detrended cross-correlation function.
3.3. Significance of the Detrended Cross-Correlation
Figure 4 depicts the computational time and model performance regarding the cross-validation Pearson correlation of the 20 individual models, computed over the lag range of −250 ms to 0 ms (baseline model) and −100 ms to 500 ms (trained model), for the detrended cross-correlation and ridge regression.
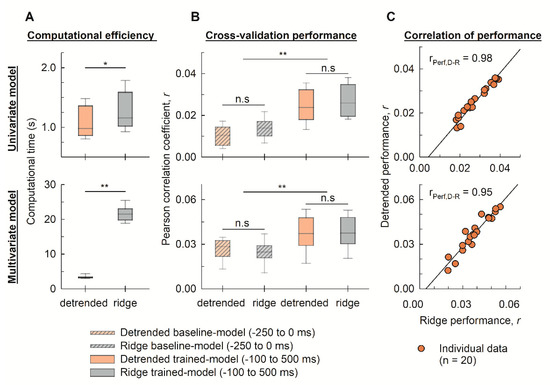
Figure 4.
Comparison of the computational efficiency and EEG decoding performance between the detrended cross-correlation and ridge regression functions. (A) The distribution (n = 20) of the computational time for training the univariate and multivariate models using the detrended cross-correlation and ridge regression. (B) The Pearson correlation coefficient in validating performance of EEG prediction was compared for the univariate and multivariate models (n = 20). The notations of **, *, and n.s (not significant) denote p < 0.01, p < 0.05, and p > 0.05, respectively. (C) The relationship between performance of individual models (n = 20) calculated by the detrended cross-correlation and ridge regression functions. The Pearson correlation coefficient between model performance computed by the two methods was rPerf,D-R. Abbreviation: ‘detrended’ and ‘ridge’ in an abscissa label denote detrended cross-correlation and ridge regression, respectively.
In comparison with ridge regression, the detrended cross-correlation function required significantly less computational time to train both the univariate (p < 0.05) and multivariate (p < 0.01) forward models (Figure 4A). In terms of cross-validation performance, the trained models of both the detrended cross-correlation and ridge regression significantly outperformed the corresponding baseline models (p < 0.01; Figure 4B). No significant difference was observed in the cross-validation Pearson correlation between the two models.
Figure 4A shows that the detrended cross-correlation outperformed ridge regression as the complexity increased. Table 1 summarizes the mean and standard deviation of the computational time (s) and validation of the Pearson’s correlation coefficients for the trained models of the detrended cross-correlation function and ridge regression, as seen in Figure 4B. In the univariate forward model, the computational time for ridge regression was 1.18 times that required for detrended cross-correlation, while that number increased to 5.82 times in the case of the multivariate forward model. Regarding prediction accuracy, Figure 4 and Table 1 show that both approaches converged to a similar performance in EEG prediction for both the univariate and multivariate models (p > 0.05). Figure 4C illustrates the correlation (using the Pearson correlation coefficient) between performance of individual models (n = 20) computed by the detrended cross-correlation (ordinate) and ridge regression (abscissa) functions. The Pearson correlation coefficients denoted as 0.98 and 0.95 are correlations between model performance computed by the detrended cross-correlation and ridge regression for the univariate and multivariate model, respectively.

Table 1.
Summary of computational time for training each model and Pearson correlation coefficient for validating EEG prediction using the detrended cross-correlation function and ridge regression. The notations of **, *, and n.s (not significant) denote p < 0.01, p < 0.05, and p > 0.05, respectively.
4. Discussion
In this study, we aimed to demonstrate the potential of the detrended cross-correlation function for capturing neural entrainment in continuous speech. The EEG signals were predicted from the speech envelope (univariate forward model) and speech spectrogram (multivariate forward model). The detrended cross-correlation function performed significantly better within a meaningful lag range than the baseline model computed from the baseline period. Furthermore, the proposed model has computational advantages while achieving the same level of prediction performance as the widely used ridge regression model.
Ridge regression implemented in the mTRF toolbox [18] served as a reference for our study. It is widely applied in sensory neuroscience to model brain responses to continuous stimuli [31,32]. Our results showed that the detrended cross-correlation function resulted in TRFs or speech STRFs comparable to those of ridge regression. It also exhibited a similar performance to individual models in terms of the Pearson correlation coefficient between the predicted EEG and original EEG. Moreover, the detrended cross-correlation function can more efficiently interpret neurophysiological data. The detrended cross-correlation function has a significant advantage in terms of computational time for both the univariate and multivariate forward models (Figure 4A). Moreover, ridge regression requires cross-validation to determine the optimal value of the regularization parameter, which can be computationally expensive if a wide range of parameter values are considered. Specifically, the TRFs estimated by ridge regression are sensitive to the regularization parameter, which can lead to unstable results, depending on the range of values chosen for regularization. In contrast, the detrended cross-correlation function is a parameter-free model that does not require a parameter optimization procedure.
Previous studies applied cross-correlation analysis to investigate how the brain perceives attended and unattended speech [33,34]. Although cross-correlation analysis is more straightforward than the ridge regression method, it is better suited for inputs modulated by a stochastic process. Because of this limitation, ridge regression has been widely applied in sensory neuroscience for continuous stimuli [31,33,35,36]. In this study, we proposed a detrended cross-correlation function to investigate neural entrainment to speech envelopes. This method overcomes the limitations of conventional cross-correlation analysis in analyzing nonstationary or slow-modulating signals while maintaining its straightforwardness. Additionally, the estimations obtained from the detrended cross-correlation function were comparable to those of ridge regression, demonstrating the utility of the detrended cross-correlation function in auditory scene analysis research.
The short trial duration may lead to overfitting, particularly in the large response to speech onset. Thus, even though the results of this study revealed a significant degree of similarity in the TRFs generated by the detrended cross-correlation function and ridge regression, the influence of trial duration should also be considered. Therefore, this study was extended to analyze a publicly available dataset featuring longer EEG trials in response to natural narrative speech in this section [37]. The open dataset is briefly summarized as follows. The 128-channel EEG data in response to narrative speech were recorded from 17 subjects, and the EEG data were segmented to have a duration of 10 and 60 s. The performance of the detrended cross-correlation function to generate long-speech TRFs was evaluated. The detrended cross-correlation function generated TRFs comparable to those generated by ridge regression, with an averaged correlation coefficient across 128 channels of 0.91 as seen in Figure 5. Moreover, although there was no difference in reconstructing EEG data, the computation of the detrended cross-correlation function was more efficient. These results indicated that the detrended cross-correlation can also effectively and comparably capture neural responses to long continuous speech.
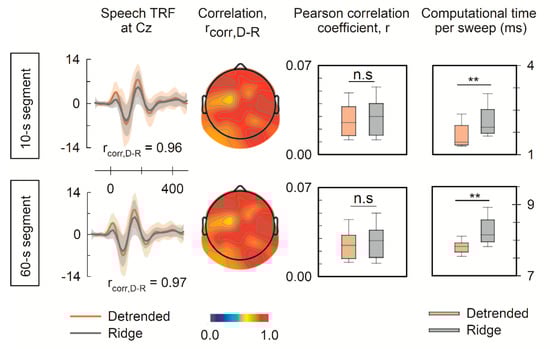
Figure 5.
Feasibility of TRF generation from neural signals in response to long-duration speech. EEG data were segmented to 10 s and 60 s to test the feasibility of the detrended cross-correlation function to generate the speech TRF. The upper and lower panels show the speech TRF at the typical channel of Cz, the correlation coefficient between the TRFs by the detrended cross-correlation and ridge regression, Pearson correlation coefficients for validating EEG prediction using the detrended cross-correlation function and ridge regression, and computational time per each sweep. The notations of ** and n.s denote p < 0.01 and not significant, respectively.
Recently, SI methods have been applied to investigate the neural source dynamics in response to continuous stimuli [38,39] and the neural response to the temporal fine structure of continuous stimuli [40]. However, the computational demands of these methods increase due to the significant large quantity of cortices at the source level or the necessity of a high sampling rate for temporal fine structure analysis. Thus, the detrended cross-correlation function, which inherently provides better computational efficiency, may be properly employed. The validation of source level analysis and temporal fine structure will be performed in the near future.
Although the detrended cross-correlation function exhibited performance comparable to ridge regression in exploring neural responses to continuous features (such as speech envelope and speech spectrogram), further investigation to examine neural responses to discrete features such as phonemic onset and semantic dissimilarity should be considered [31,37]. As the detrended cross-correlation function may generate a more zero-centered TRF (i.e., dampening trends) compared to those generated by the ridge regression function, careful consideration is needed to employ the discrete features. This will be systematically investigated in future studies.
5. Conclusions
The detrended cross-correlation function offers advantages in terms of straightforwardness and computational simplicity. By leveraging these advantages, applying the detrended cross-correlation function to SI methods could potentially provide a more efficient and computationally feasible approach for investigating neural responses to continuous stimuli at the source level or analyzing the temporal fine structure of stimuli. This research direction could offer insights into the neural mechanisms underlying the processing of continuous stimuli while addressing the computational challenges associated with existing SI methods.
Author Contributions
Conceptualization, L.D.A.Q. and J.W.; methodology, L.D.A.Q.; software, L.D.A.Q. and L.T.T.; validation, L.D.A.Q., L.T.T., H.J., D.K. and J.W.; formal analysis, L.D.A.Q.; investigation, L.D.A.Q.; resources, J.W.; data curation, L.D.A.Q. and L.T.T.; writing—original draft preparation, L.D.A.Q.; writing—review and editing, L.D.A.Q., L.T.T., H.J., D.K. and J.W.; visualization, L.D.A.Q. and J.W.; supervision, J.W.; project administration, D.K. and J.W.; funding acquisition, J.W. All authors have read and agreed to the published version of the manuscript.
Funding
This research was funded by the National Research Foundation of Korea, grant number NRF-2020R1A2C2003319.
Institutional Review Board Statement
The study was conducted according to the guidelines of the Declaration of Helsinki and approved by the Institutional Review Board of the University of Ulsan (protocol code 1040968-A-2020-015, approved on 27 August 2020).
Informed Consent Statement
Informed consent was obtained from all subjects involved in the study.
Data Availability Statement
The data presented in this study are available on request from the corresponding author.
Acknowledgments
The authors express thanks to the subjects who participated in this study and also acknowledge the work of the anonymous reviewers.
Conflicts of Interest
The authors declare no conflict of interest.
Appendix A
With and as integrable functions and , based on the theorem of Fourier Transform of the Derivative [41], we have
and
From (A1) and (A2), we can conclude that
References
- Gaudet, I.; Hüsser, A.; Vannasing, P.; Gallagher, A. Functional brain connectivity of language functions in children revealed by EEG and MEG: A systematic review. Front. Hum. Neurosci. 2020, 14, 62. [Google Scholar] [CrossRef] [PubMed]
- Gui, P.; Jiang, Y.; Zang, D.; Qi, Z.; Tan, J.; Tanigawa, H.; Jiang, J.; Wen, Y.; Xu, L.; Zhao, J.; et al. Assessing the depth of language processing in patients with disorders of consciousness. Nat. Neurosci. 2020, 23, 761–770. [Google Scholar] [CrossRef] [PubMed]
- Shain, C.; Blank, I.A.; van Schijndel, M.; Schuler, W.; Fedorenko, E. fMRI reveals language-specific predictive coding during naturalistic sentence comprehension. Neuropsychologia 2020, 138, 107307. [Google Scholar] [CrossRef]
- Loiselle, D.L. Event-related potentials: A methods handbook. Neurology 2006, 67, 1729. [Google Scholar] [CrossRef]
- Martin, B.A.; Tremblay, K.L.; Korczak, P. Speech evoked potentials: From the laboratory to the clinic. Ear Hear. 2008, 29, 285–313. [Google Scholar] [CrossRef] [PubMed]
- Maddox, R.K.; Lee, A.K.C. Auditory brainstem responses to continuous natural speech in human listeners. eNeuro 2018, 5. [Google Scholar] [CrossRef] [PubMed]
- Marmarelis, V.Z. Nonlinear Dynamic Modeling of Physiological Systems; Wiley: Hoboken, NJ, USA, 2004; pp. 1–541. [Google Scholar]
- Boer, E.D.; Kuyper, P. Triggered correlation. IEEE Trans. Biomed. Eng. 1968, BME-15, 169–179. [Google Scholar] [CrossRef] [PubMed]
- Boynton, G.M.; Engel, S.A.; Glover, G.H.; Heeger, D.J. Linear systems analysis of functional magnetic resonance imaging in human V1. J. Neurosci. 1996, 16, 4207–4221. [Google Scholar] [CrossRef] [PubMed]
- Coppola, R. A system transfer function for visual evoked potentials. In Human Evoked Potentials: Applications and Problems; Lehmann, D., Callaway, E., Eds.; Springer: Boston, MA, USA, 1979; pp. 69–82. [Google Scholar]
- Marmarelis, P.Z.; Marmarelis, V.Z. Analysis of Physiological Systems: The White-Noise Approach; Plenum Press: New York, NY, USA, 1978. [Google Scholar]
- Ringach, D.; Shapley, R. Reverse correlation in neurophysiology. Cogn. Sci. 2004, 28, 147–166. [Google Scholar] [CrossRef]
- Abrams, D.A.; Nicol, T.; Zecker, S.; Kraus, N. Right-hemisphere auditory cortex is dominant for coding syllable patterns in speech. J. Neurosci. 2008, 28, 3958–3965. [Google Scholar] [CrossRef]
- Ahissar, E.; Nagarajan, S.; Ahissar, M.; Protopapas, A.; Mahncke, H.; Merzenich, M.M. Speech comprehension is correlated with temporal response patterns recorded from auditory cortex. Proc. Natl. Acad. Sci. USA 2001, 98, 13367–13372. [Google Scholar] [CrossRef] [PubMed]
- Aiken, S.J.; Picton, T.W. Human cortical responses to the speech envelope. Ear Hear. 2008, 29, 139–157. [Google Scholar] [CrossRef] [PubMed]
- Lalor, E.C.; Pearlmutter, B.A.; Reilly, R.B.; McDarby, G.; Foxe, J.J. The VESPA: A method for the rapid estimation of a visual evoked potential. NeuroImage 2006, 32, 1549–1561. [Google Scholar] [CrossRef] [PubMed]
- Lalor, E.C.; Power, A.J.; Reilly, R.B.; Foxe, J.J. Resolving precise temporal processing properties of the auditory system using continuous stimuli. J. Neurophysiol. 2009, 102, 349–359. [Google Scholar] [CrossRef]
- Crosse, M.J.; Di Liberto, G.M.; Bednar, A.; Lalor, E.C. The multivariate temporal response function (mTRF) toolbox: A MATLAB toolbox for relating neural signals to continuous stimuli. Front. Hum. Neurosci. 2016, 10, 604. [Google Scholar] [CrossRef] [PubMed]
- Theunissen, F.E.; Sen, K.; Doupe, A.J. Spectral-temporal receptive fields of nonlinear auditory neurons obtained using natural sounds. J. Neurosci. 2000, 20, 2315–2331. [Google Scholar] [CrossRef] [PubMed]
- Theunissen, F.E.; David, S.V.; Singh, N.C.; Hsu, A.; Vinje, W.E.; Gallant, J.L. Estimating spatio-temporal receptive fields of auditory and visual neurons from their responses to natural stimuli. Network 2001, 12, 289–316. [Google Scholar] [CrossRef] [PubMed]
- Machens, C.K.; Wehr, M.S.; Zador, A.M. Linearity of cortical receptive fields measured with natural sounds. J. Neurosci. 2004, 24, 1089–1100. [Google Scholar] [CrossRef]
- Crosse, M.J.; Zuk, N.J.; Di Liberto, G.M.; Nidiffer, A.R.; Molholm, S.; Lalor, E.C. Linear modeling of neurophysiological responses to speech and other continuous stimuli: Methodological considerations for applied research. Front. Neurosci. 2021, 15, 705621. [Google Scholar] [CrossRef]
- Jang, H.; Lee, J.; Lim, D.; Lee, K.; Jeon, A.; Jung, E. Development of Korean standard sentence lists for sentence recognition tests. Audiol. Speech Res. 2008, 4, 161–177. [Google Scholar] [CrossRef]
- Delorme, A.; Makeig, S. EEGLAB: An open source toolbox for analysis of single-trial EEG dynamics including independent component analysis. J. Neurosci. Methods 2004, 134, 9–21. [Google Scholar] [CrossRef] [PubMed]
- Greenwood, D.D. A cochlear frequency-position function for several species—29 years later. J. Acoust. Soc. Am. 1990, 87, 2592–2605. [Google Scholar] [CrossRef] [PubMed]
- Gröger, J.P.; Fogarty, M.J. Broad-scale climate influences on cod (Gadus morhua) recruitment on Georges Bank. ICES J. Mar. Sci. 2011, 68, 592–602. [Google Scholar] [CrossRef][Green Version]
- Roehri, N.; Lina, J.M.; Mosher, J.C.; Bartolomei, F.; Benar, C.G. Time-frequency strategies for increasing high-frequency oscillation detectability in intracerebral EEG. IEEE Trans. Biomed. Eng. 2016, 63, 2595–2606. [Google Scholar] [CrossRef] [PubMed]
- Shumway, R.H.; Stoffer, D.S. Time Series Analysis and Its Applications (Springer Texts in Statistics); Springer: Berlin/Heidelberg, Germany, 2005. [Google Scholar]
- Polge, R.J.; Mitchell, E.M. Impulse response determination by cross correlation. IEEE Trans. Aerosp. Electron. Syst. 1970, AES–6, 91–97. [Google Scholar] [CrossRef]
- Browne, M.W. Cross-validation methods. J. Math. Psychol. 2000, 44, 108–132. [Google Scholar] [CrossRef] [PubMed]
- Di Liberto, G.M.; O’Sullivan, J.A.; Lalor, E.C. Low-frequency cortical entrainment to speech reflects phoneme-level processing. Curr. Biol. 2015, 25, 2457–2465. [Google Scholar] [CrossRef] [PubMed]
- Power, A.J.; Foxe, J.J.; Forde, E.J.; Reilly, R.B.; Lalor, E.C. At what time is the cocktail party? A late locus of selective attention to natural speech. Eur. J. Neurosci. 2012, 35, 1497–1503. [Google Scholar] [CrossRef]
- Kong, Y.Y.; Mullangi, A.; Ding, N. Differential modulation of auditory responses to attended and unattended speech in different listening conditions. Hear. Res. 2014, 316, 73–81. [Google Scholar] [CrossRef]
- Olguin, A.; Cekic, M.; Bekinschtein, T.A.; Katsos, N.; Bozic, M. Bilingualism and language similarity modify the neural mechanisms of selective attention. Sci. Rep. 2019, 9, 8204. [Google Scholar] [CrossRef] [PubMed]
- Ding, N.; Chatterjee, M.; Simon, J.Z. Robust cortical entrainment to the speech envelope relies on the Spectro-temporal fine structure. NeuroImage 2014, 88, 41–46. [Google Scholar] [CrossRef] [PubMed]
- Martin, S.; Brunner, P.; Holdgraf, C.; Heinze, H.J.; Crone, N.E.; Rieger, J.; Schalk, G.; Knight, R.T.; Pasley, B.N. Decoding spectrotemporal features of overt and covert speech from the human cortex. Front. Neuroeng. 2014, 7, 14. [Google Scholar] [CrossRef] [PubMed]
- Broderick, M.P.; Anderson, A.J.; Di Liberto, G.M.; Crosse, M.J.; Lalor, E.C. Electrophysiological correlates of semantic dissimilarity reflect the comprehension of natural, narrative speech. Curr. Biol. 2018, 28, 803–809.e3. [Google Scholar] [CrossRef] [PubMed]
- Brodbeck, C.; Presacco, A.; Simon, J.Z. Neural source dynamics of brain responses to continuous stimuli: Speech processing from acoustics to comprehension. Neuroimage 2018, 172, 162–174. [Google Scholar] [CrossRef] [PubMed]
- Kulasingham, J.P.; Brodbeck, C.; Presacco, A.; Kuchinsky, S.E.; Anderson, S.; Simon, J.Z. High gamma cortical processing of continuous speech in younger and older listeners. NeuroImage 2020, 222, 117291. [Google Scholar] [CrossRef] [PubMed]
- Etard, O.; Messaoud, R.B.; Gaugain, G.; Reichenbach, T. The neural response to the temporal fine structure of continuous musical pieces is not affected by selective attention. bioRxiv 2021. [Google Scholar] [CrossRef]
- Kreyszig, E. Advanced Engineering Mathematics, 5th ed.; Wiley: New York, NY, USA, 1983. [Google Scholar]
Disclaimer/Publisher’s Note: The statements, opinions and data contained in all publications are solely those of the individual author(s) and contributor(s) and not of MDPI and/or the editor(s). MDPI and/or the editor(s) disclaim responsibility for any injury to people or property resulting from any ideas, methods, instructions or products referred to in the content. |
© 2023 by the authors. Licensee MDPI, Basel, Switzerland. This article is an open access article distributed under the terms and conditions of the Creative Commons Attribution (CC BY) license (https://creativecommons.org/licenses/by/4.0/).