Article

Viability of ABO Blood Typing with ATR-FTIR Spectroscopy

by
Alfonso Fernández-González
1,
Álvaro J. Obaya
2,
Christian Chimeno-Trinchet
1,
Tania Fontanil
3 and
Rosana Badía-Laíño
1,*
1
Department of Physical and Analytical Chemistry, University of Oviedo, 33006 Oviedo, Spain
2
Department of Functional Biology, University of Oviedo, 33006 Oviedo, Spain
3
Unidad de Terapias Avanzadas, Instituto Ordoñez, 33012 Oviedo, Spain
*
Author to whom correspondence should be addressed.
Appl. Sci. 2023, 13(17), 9650; https://doi.org/10.3390/app13179650
Submission received: 27 July 2023 / Revised: 17 August 2023 / Accepted: 21 August 2023 / Published: 25 August 2023

Abstract

:

Featured Application

Fast ABO blood typing using Attenuated Total Reflectance—Fourier Transform Infrared Spectroscopy and artificial intelligence tools.

Abstract

Fourier Transform Infrared Spectroscopy (FTIR) provides valuable biochemical information for biomedical analysis. It aids in identifying cancerous tissues, diagnosing diseases like acute pancreatitis or Alzheimer’s, and has applications in genomics, proteomics, and metabolomics. A combination of FTIR and chemometrics constitute an approach that shows promise in fields like biology, forensics, food quality control, and plant variety identification. This study aims to explore the feasibility of ATR-FTIR spectroscopy for identifying ABO-blood types using spectroscopic tools. We employ various classifying algorithms, including Linear Discriminant Analysis (LDA), Naïve Bayes Classifier (NBC), Principal Component Analysis (PCA), and combinations of these methods, to detect A and B antigens and determine the ABO blood type. The results show that these algorithms predict the blood type to a greater extent than random selection, although they do not match the precision of biochemical blood typing tools. Additionally, our findings suggest the higher sensitivity of the methodology in identifying B antigens compared to A antigens.

1. Introduction

Infrared spectroscopy has emerged as a powerful tool in biomedical analysis due to its ability to provide comprehensive biochemical information about cells, tissues, or biological samples. This holistic data, obtained from Fourier Transform Infrared Spectroscopy (FTIR), allows for the identification of cancerous tissues [1] or aids in the diagnosis of diseases such as acute pancreatitis or Alzheimer’s [2,3]. Moreover, vibrational spectroscopy, which encompasses both Raman and infrared spectroscopy, has proven to be highly valuable in genomics [4], proteomics, [5] and metabolomics [6]. The latter is particularly interesting, as the combination of metabolomics information provided by FTIR and chemometric tools allows for the investigation of the viability and sexing of cattle embryos [7,8]. This FTIR–chemometrics coupling has also been fruitfully exploited in different fields like forensics, food quality control, or plant variety identification [9,10,11], and seems to be a promising starting point to face a rapid spectroscopic approach to blood typing following the ABO system.
Blood typing of the ABO system has been routinely used since its description in the early 1900s. It is considered the most important among the known 29 blood group systems [12]. ABO typing is based on the existence of three different alleles whose expression results in the modifications of polysaccharide structures on the red blood cells’ surface [13]. The combination of these alleles on the human genome gives as a result the four known blood types extensively used in blood transfusion for medical applications. The ABO blood group is thus determined by the presence of A and B antigens (or none) on erythrocytes (and other cells) and the presence of anti-A and anti-B antibodies in serum. Due to the presence of these antibodies, red cell agglutination happens when mixed with plasma from a different blood type [14]. The ABO system depends on the expression of glycosiltransferases for specific sugar moieties, α 1, 3-N-acetylgalactosaminyltransferase for the A antigen and α 1, 3-galactosyltransferase for the B antigen. The expression of both transferases (one allele each) results in the presence of both antigens in red cells’ surface (AB type). The presence of the H allele in both copies of the genome results in the absence of any glycosyltransferase activity and, consequently, antigens A or B are not present (O type) [13].
Then, this enzymatic activity translates into the presence of different oligosaccharides in the membrane, whose biochemical difference lies in the nature of the most external monosaccharide. There is a basic sequence of glucose, galactose, N-acetylglucosamine, and galactose joined in 1–3 positions, with a fucose in position 2 of the last galactose. This sequence is common for A, B, and O antigens; however, A and B show an additional saccharide: A-type has an N-acetylgalactosamine in position 3 of the galactose, while B-type shows a second galactose in that position.
In this work, we intend to explore the viability of ATR-FTIR spectroscopy to detect the biochemical differences among different blood types, which would eventually allow for the identification of blood type using only spectroscopic tools.

2. Materials and Methods

Human blood samples were kindly provided by the Centro Comunitario de Sangre y Tejidos de Asturias from blood samples from anonymous donors. All samples were ABO-typed following the manufacturer instructions of an immune-based assay of blood typing from IBDCiencia (Ref.: ME91253).
FTIR spectra were taken using a Varian 670-IR spectrometer equipped with a Golden Gate ATR device. Spectra were averaged from 16 scans and recorded from 600 cm−1 to 4000 cm−1 with a resolution of 4 cm−1. Measurements were carried out by putting a droplet of blood onto the diamond crystal of ATR and evaporating it under a constant air current.
Principal Component Analysis (PCA) was performed using MatLab scripts developed by the authors. Naïve Bayesian Classifier (NBC) and Linear Discriminant Analysis (LDA) calculations were performed using MatLab functions.

3. Results and Discussion

The actual blood distribution of the Spanish population, according to Red Cross data [15], shows a very low presence of certain types (Table 1). Thus, keeping this proportion in the training and test datasets could lead to poor results because of the low amounts. Therefore, blood samples were selected in order to have a proper amount of each type, regardless of a possible overrepresentation compared to the natural distribution (Table 1).
The spectroscopic study was carried out using two different approaches, a first considering both ABO blood type and Rh factor and a second taking into account only ABO blood type. The average spectra for every class are depicted in Figure 1, showing no evident differences with the ABO type or the Rh factor. Thus, the ABO typing was evaluated from a mathematical approach using IA tools. For this, the area under the most relevant peaks, a total of 18, were selected as input variables in the different algorithms (Table 2).
These peaks are mainly related to the amide I (1639 cm−1), amide II (1537 cm−1), and amide III (1300 cm−1) bands characteristic of proteins and also of carbohydrates, with strong very wide bands between 3520 cm−1 and 3100 cm−1 [16].

3.1. Probabilities of Random Classification

In order to check whether the success rate of the proposed classification tools is better than a mere random classification, it is important to compare the true positive (T+), true negative (T-), false positive (F+), and false negative (F-) ratios of the proposed methodology with those obtained in a random classification. In principle, a random classification would assign a random class to a sample, following the frequency distribution of the whole population. That is, the probability of assigning the class i to a sample (p(i)) is the same as the frequency of class i in the population (f(i)). In such a case where p(i) = f(i), it is clear that the T+ ratio is i p ( i ) 2 N where p(i) is the probability of assigning i class to a sample and N is the total number of classes. Similarly, the rate of false positives and false negatives is identical and equal to i , j p i · p ( j ) i j N . These formulae can be extended for those cases where p(i) ≠ f(i), for example, if assignation into classes is performed equiprobably. Table 3 shows the T+, F+, T-, and F-ratios expected for a random classification using the probabilities shown in Table 1 (p(A) = 0.23, p(B) = 0.39, p(AB) = 0.09, p(O) = 0.29).
It is obvious, then, that keeping the assignation probabilities as the true distribution frequencies provides the best T+ and T- ratios. All the classification algorithms will be checked against this random distribution.

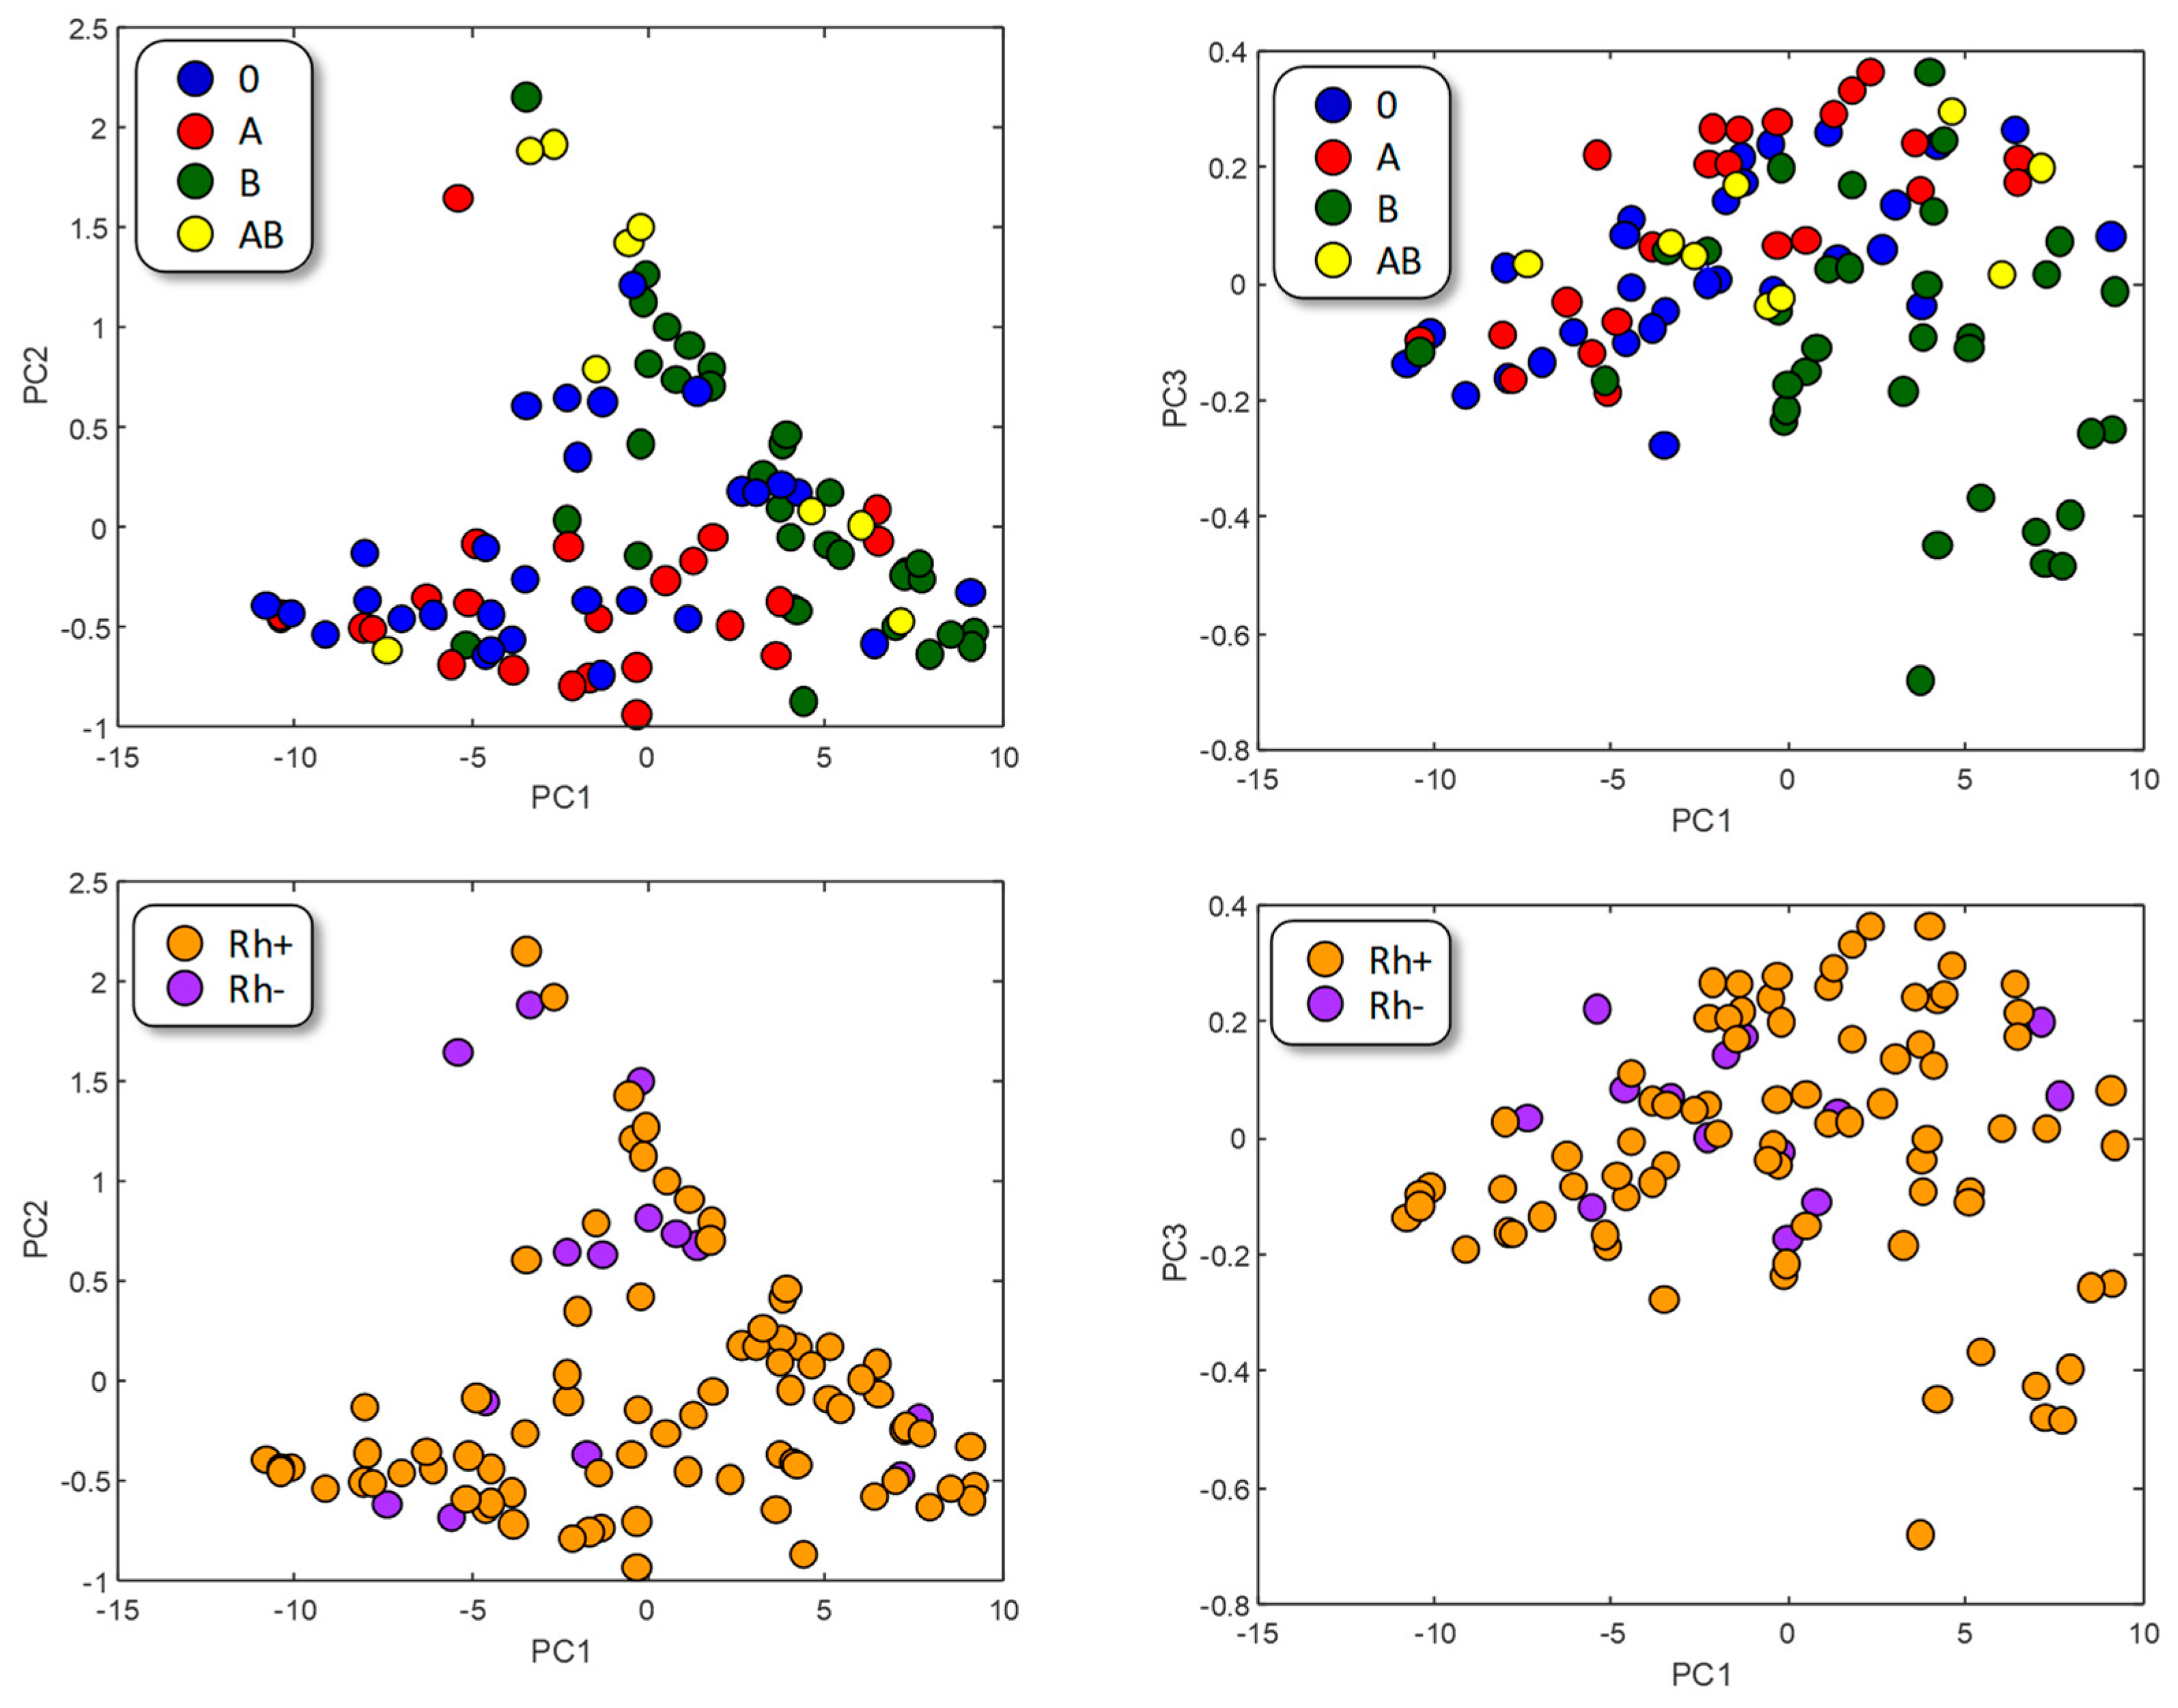
3.2. Principal Component Analysis (PCA)

The graphical representation of the samples in the Principal Component (PC) space (Figure 2) does not seem to reveal a clear aggregation, neither with respect to the ABO-type nor to the Rhesus factor. Nonetheless, A-type (red) and B-type (green) tend to segregate, which can be explained by taking into account the different chemical natures of their respective antigens. AB-type appears mixed since it shares both antigens, and O samples, which do not present a specific antigen, seem to be randomly distributed.
These results suggest that minimizing the intra-class variance while maximizing the inter-class variance could improve the classification success rate. This kind of classification is obtained when performing Linear Discriminant Analysis studies.

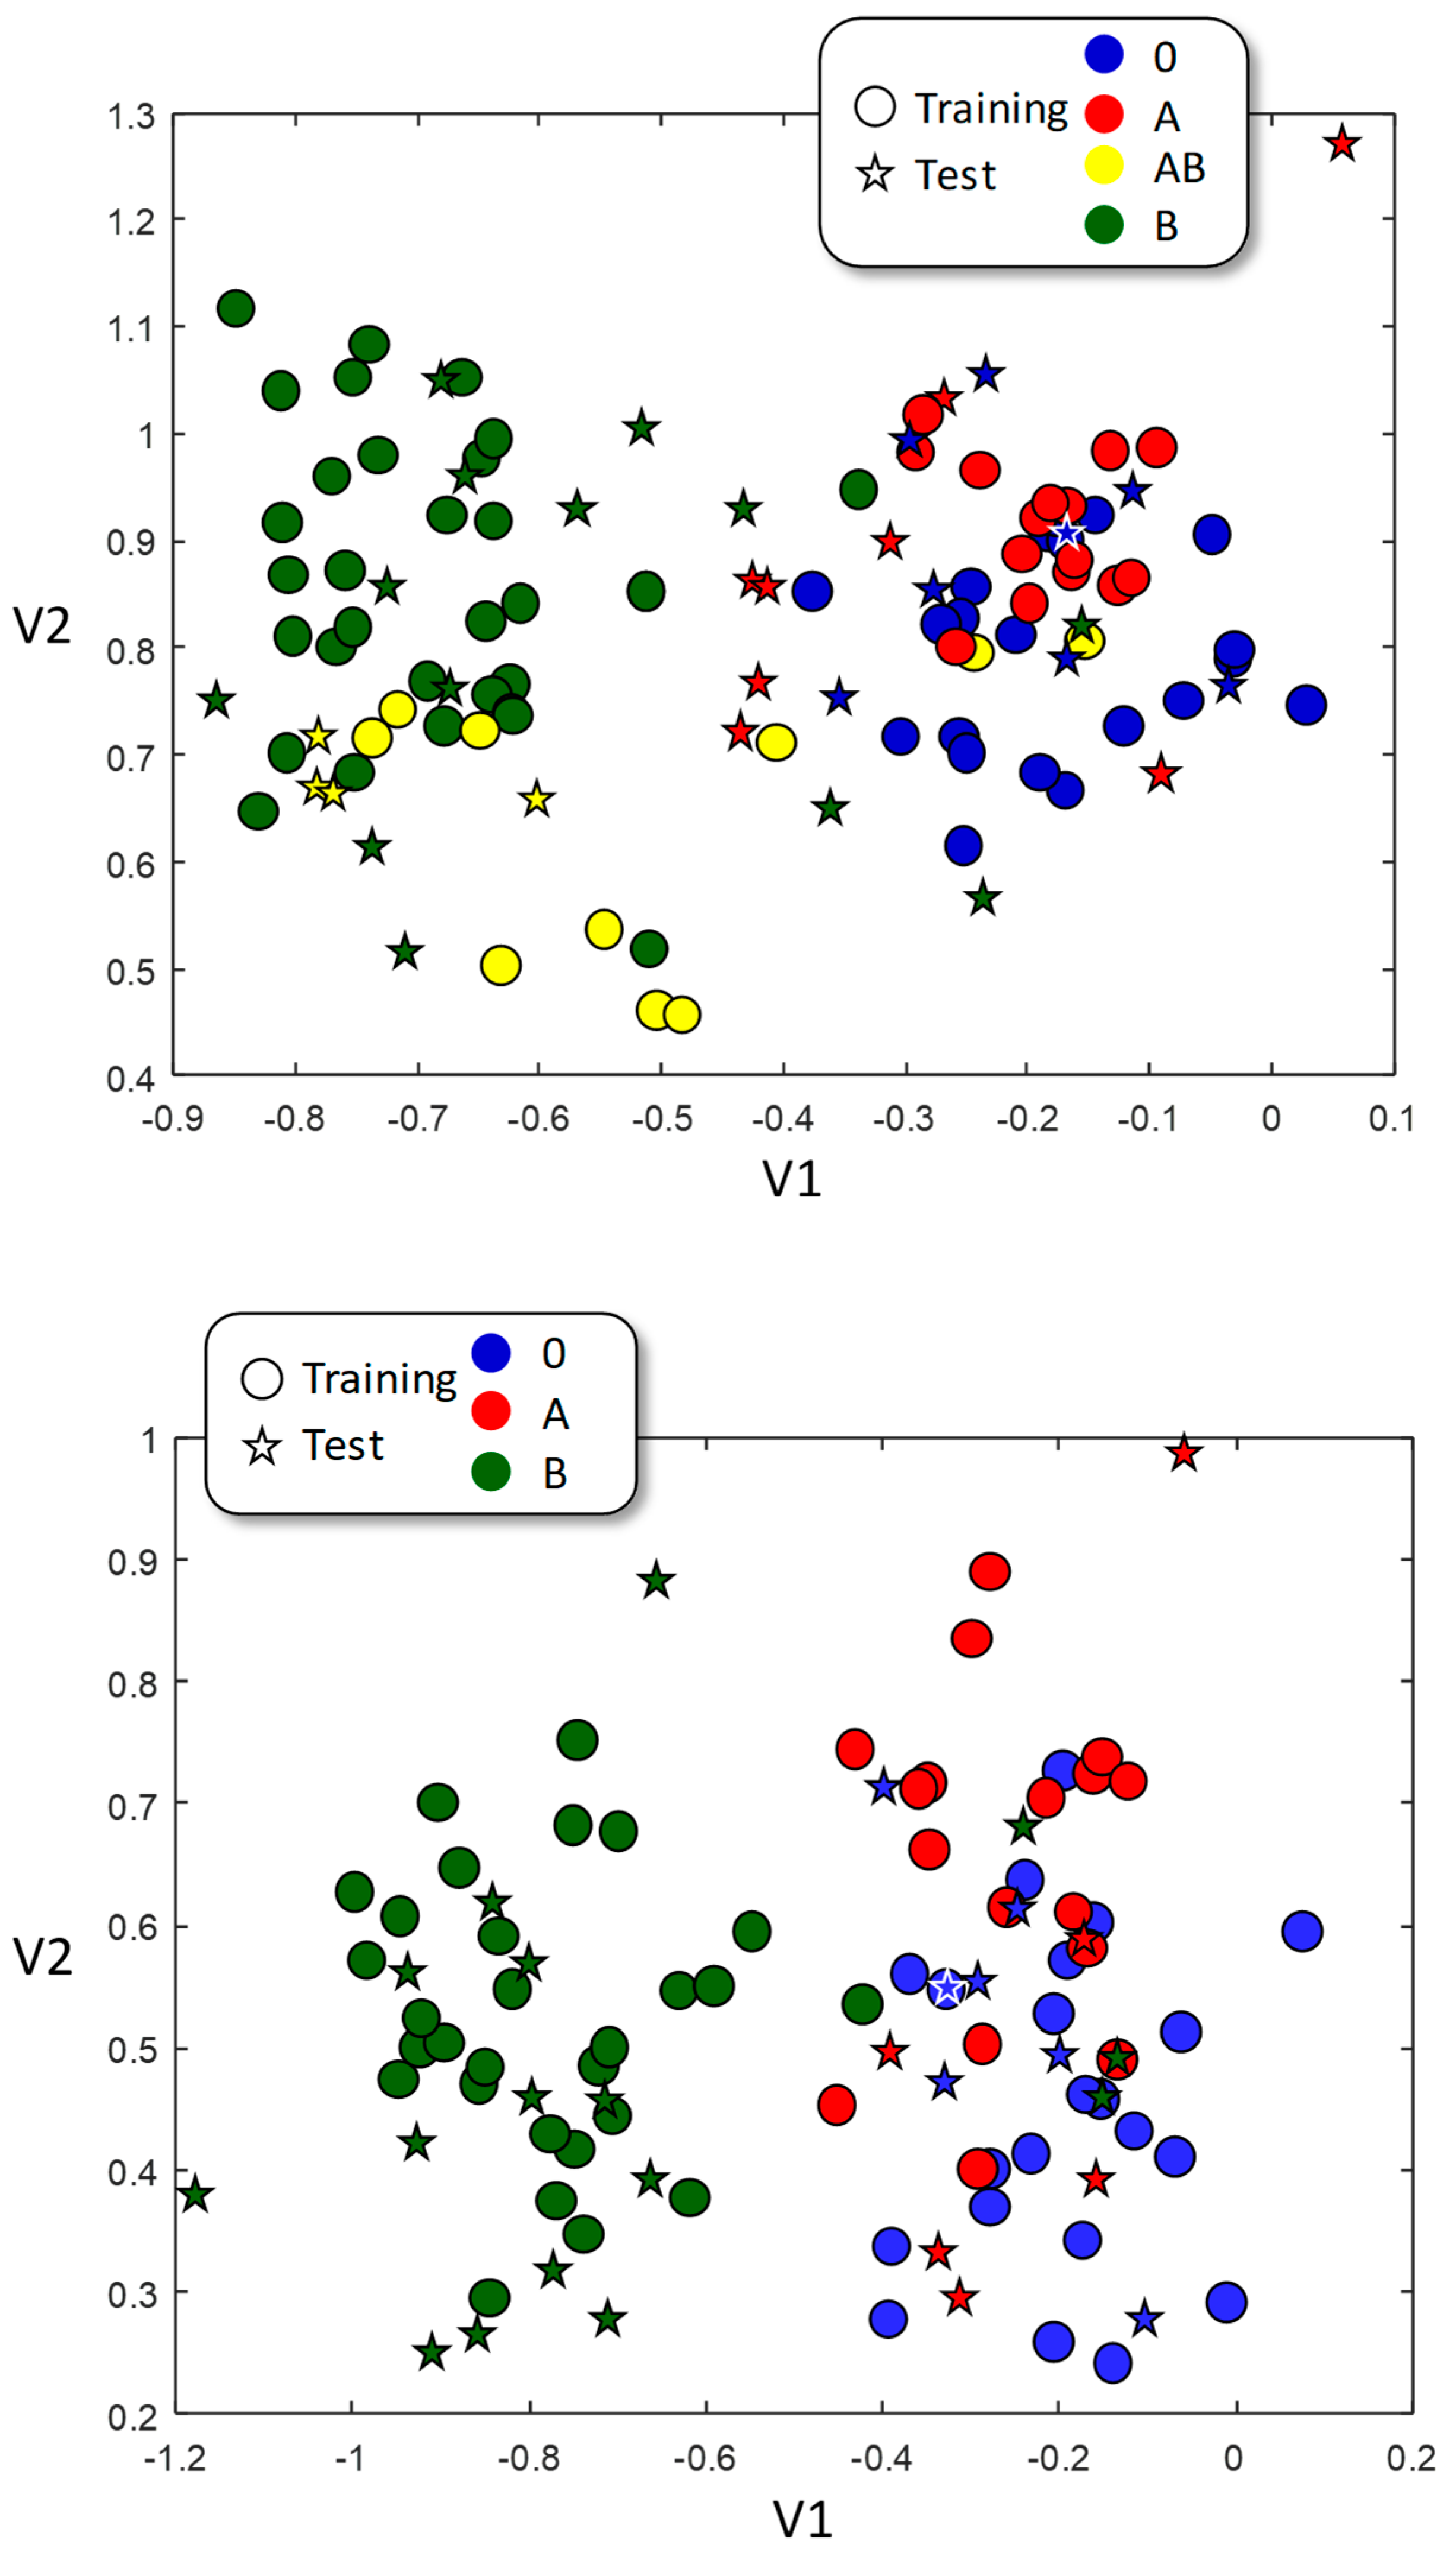
3.3. Linear Discriminant Analysis (LDA)

The whole pool of 111 samples was randomly divided into a training dataset (78 samples) and a test dataset (33 samples) and then the LDA training was performed. This procedure was repeated six times, each of them with different training and test datasets. Figure 3 (up) shows the visual representation of the LDA algorithm. It is obvious that the B-type samples are differently grouped than the A-type samples. However, the AB and O samples, although more or less self-grouped, overlap with either B (in the case of AB) or A (in the case of O). These results suggest that infrared is more sensitive to the B antigen, as the B-antigen-containing samples (B and AB) appear grouped and segregated from the samples not containing the B-antigen (A and O). The obtained results were significantly better than a pure random classification (p < 0.02, Table 4 up), obtaining 48% of correctly classified samples versus 29% of expected success in a mere random classification. Most difficulties are found in the O samples classified as A (15%) and A classes classified as O (7%), which is in clear agreement with the visual representation of Figure 3.
Since the AB samples contain both A and B antigens and, therefore, spectroscopic characteristics common to both A and B types, the inclusion of the AB samples in the training dataset could probably lead to difficulties in the classification. Therefore, we trained a second model including A, B, and 0 samples only. The samples were randomly split into training and test datasets, and the procedure was repeated six times. The graphical representation of this LDA classification is shown in Figure 3. The training samples from A and B sets clearly segregate, establishing two well-differentiated areas; training samples of O type, however, overlap with those of A type, but not with those of B type. Only the B-type samples achieve an improvement in all categories, with an increment in the rates of true positives and negatives, and a drastic reduction in the percentage of false positives and negatives. However, and despite the improvement in the ratio of true positives of both A and O samples, the ratio of false positives (for O type) and of false negatives (for A type) also increases. In this case, 63% of the samples are correctly classified with, again, a high wrong classification in the O samples taken as A and the A samples taken as O. This situation is not likely to be related to the chemical difference on the antigens, since there is a complex interrelationship between blood type and blood chemistry, which can participate in the ABO-type identification without being antigens themselves.

3.4. Naïve Bayesian Classifier

Naïve Bayesian Classifier (NBC) assigns a class to an unknown object based on the Bayes’ Probability Theorem. It is, therefore, necessary to know the probability of every variable (vi), taking a certain value when the sample belongs to a class Cj (that is P(vi/Cj)), and the probability of belonging to that class as well (pCj). P(vi/Cj) is estimated from a training dataset randomly selected among the whole dataset. The probability of every class was obtained from the number of samples of every class in the training dataset, using as variables the peak area described in Table 2.
An NBC model was tested using six different randomly selected training and test datasets in the same proportion as in the LDA case. As can be seen in Table 5, the model has a higher success ratio than the random classification (p < 0.01), and provides a better true positive ratio than LDA for the A, B, and AB samples, but not for O.
As in the case of LDA, the presence of both A and B antigens in the AB type may cause difficulties in the classification. Thus, initially, we performed the classification without the AB type samples, again using six different training and test datasets. Table 5 shows the classification results both for NBC and a random classification, which are significantly different in every case with p < 0.002 according to a Student’s t-test. The A and B samples have a higher success rate with NBC classification than with a random one, although O shows slightly worse results. This may be because the lack of antigens in the surface reduces the spectroscopic characteristics, enabling the differentiation. Furthermore, LDA classification with only three classes provides a better true positive ratio for every class.
It is interesting to note that, both with LDA and NBC, the incorporation of the AB samples reduces the true positive ratio of the model.

3.5. Principal Components Cobined with Naïve Bayesian Classifier

Taking into account the PCA and LDA results, it is very likely that the relationship of FTIR spectra with the ABO-type exists with a linear combination of several peak areas rather than the independent areas. For this reason, we tried a second NBC algorithm using as variables just the two first principal components. The whole dataset reduces its dimensionality from the original (18 × 95) (peaks × samples) to a (2 × 95) (PCs × samples). The differences between the PC-NBC algorithm and the random classification is statistically significant with p < 0.01 in every case but the misclassification of 0 samples as B (italics in the table). However, as shown in Table 6, the improvement is negligible, with a scarce enhancement in B and 0 correct type identification and a slight reduction in the false identification of A and 0 samples as B. This phenomenon aligns with the notion that the spectroscopic identification of the B antigen is easier than the identification of the A or of a lack of them.

3.6. Single-Antigen Identification

Based on the results presented earlier, it becomes apparent that the algorithms exhibit a superior ability to differentiate samples containing the B antigen from the rest. Consequently, we proceeded to employ the aforementioned algorithms to ascertain whether they yield improved outcomes in identifying each antigen individually. Conversely, it was crucial to assess the feasibility of employing a distinct chemometric approach for the identification of each antigen. Hence, we conducted tests utilizing LDA and NBC to discern between samples classified as A and Non-A, as well as B and non-B, the results of which are recorded in Table 7.
All the results presented in Table 7 exhibit statistically significant differences compared to the outcomes derived from random classification, with a p-value of less than 0.01. However, it is crucial to note that the classification of A demonstrates less desirable scenarios; the ratios of true positive (T+) and true negative (T-) using LDA, as well as T- using NBC, indicate lower success rates than those achieved randomly. Similarly, the false positive ratio (F+) using NBC surpasses the random counterpart. This further substantiates our previous thesis that the B antigen is more effectively detected by FTIR than its A counterpart.
Bearing these results in mind, we decided to evaluate whether the independent single identification of A and B antigens would lead to an improvement in the classification rate. Therefore, we used an independent multiple antigen classification (IMAC), consisting of independently training four algorithms (linear discriminant analysis for A (LDA-A) and for B (LDA-B) antigens; Naïve Bayesian Classifier for A (NBC-A) and B (NBC-B) antigens). Every tested sample was assigned an IMAC number based on which of the four algorithms was + or—(Table 8), and the class was decided according to this number. The correspondence IMAC number—blood type was decided by studying the histogram of samples vs. IMAC number for every blood type.
IMAC numbers 4, 8, and 12 did not appear in any of the tested training datasets. In fact, only number 4 appears only once in the assayed test datasets. Therefore, the blood type for these numbers was determined based on a probability study. This was particularly challenging in the case of IMAC 8, as the probability of being A or O was very similar and there were neither experimental nor probabilistic reasons to prefer one over the other.
The results presented in Table 9 clearly indicate that IMAC yields superior outcomes when compared to random classification for each class, achieving similar results to those obtained by the previous algorithms. Regarding the confusion matrix, it is interesting to note that the A samples are mistaken for O (and vice versa) to a greater extent than a mere random classification. A similar situation occurs with B and AB samples (and vice versa). Once again, it becomes apparent that the presence of the B antigen is particularly influential in the classification.

4. Conclusions

Incorporating infrared spectrometry and chemometrics for ABO blood typing yields improved results compared to random classification, although it still falls short of competing with traditional immunological methods. The presence of the antigen ‘B’ appears to impart discernible characteristics to the blood sample, which can be easily detected with FTIR. In contrast, the antigen ‘A’ remains largely elusive using this technique, posing challenges in its identification. It is possible that the difficulty in identifying blood type A may be attributed to the existence of subgroups, mainly A1 and A2, within this serological type. While there are also subgroups for blood type B, the difference between them is less pronounced. This fact appears to support the findings obtained in this study [13]. Although the success rate is worse than in classic biochemical blood typing methods, this methodology emerges as a promising alternative.

Author Contributions

Conceptualization, A.F.-G. and R.B.-L.; methodology, A.F.-G.; software, A.F.-G.; formal analysis, T.F., A.F.-G. and C.C.-T.; investigation, R.B.-L.; resources, Á.J.O. and T.F.; data curation, A.F.-G.; writing—original draft preparation, A.F.-G., Á.J.O. and C.C.-T.; project administration, R.B.-L.; funding acquisition, R.B.-L.; informed consent and ethical aspects: Á.J.O. All authors have read and agreed to the published version of the manuscript.

Funding

The authors gratefully acknowledge the financial support from the Ministerio de Ciencia, Innovación y Universidades (MCIU), the Agencia Estatal de Investigación (AEI), and the European Regional Development Fund (FEDER), project # RTI2018-099756-B-I00 (MCIU/AEI/FEDER, UE).

Institutional Review Board Statement

Ethical review and approval were waived for this study due to the utilization of leftover samples from analytical procedures prior to their use in blood donation.

Informed Consent Statement

Patient consent was waived due to the utilization of aliquots taken from analytical samples obtained from anonymous blood donors.

Data Availability Statement

Data are available upon request to the authors.

Acknowledgments

We would like to thank the Centro Comunitario de Sangre y Tejidos de Asturias who kindly provided us with blood samples from anonymous donors. We would also like to acknowledge the vibrational and electronic spectroscopy unit from the Scientific-Technical Services of the University of Oviedo.

Conflicts of Interest

The authors declare no conflict of interest. The funders had no role in the design of the study; in the collection, analyses, or interpretation of data; in the writing of the manuscript; or in the decision to publish the results.

References

  1. Kumar, S.; Srinivasan, A.; Nikolajeff, F. Role of Infrared Spectroscopy and Imaging in Cancer Diagnosis. Curr. Med. Chem. 2018, 25, 1055–1072. [Google Scholar] [CrossRef] [PubMed]
  2. Petrov, M.S.; Gordetzov, A.S.; Amelyanov, N.V. Usefulness of infrared spectroscopy in diagnosis of acute pancreatitis. ANZ J. Surg. 2007, 77, 347–351. [Google Scholar] [CrossRef] [PubMed]
  3. Yang, C.M.; Guang, P.W.; Li, L.; Song, H.; Huang, F.R.; Li, Y.P.; Wang, L.H.; Hu, J.H. Early rapid diagnostis of Alzheimer’s disease based on fusion of near- and mid-infrared spectral features combined with PLS-DA. Optik 2021, 241, 166485. [Google Scholar] [CrossRef]
  4. Dogan, A.; Lasch, P.; Neuschl, C.; Millrose, M.K.; Alberts, R.; Schughart, K.; Naumann, D.; Brockmann, G.A. ATR-FTIR spectroscopy reveals genomic loci regulating the tissue response in high fat diet fed BXD recombinant inbred mouse strains. BMC Genomics 2013, 14, 386. [Google Scholar] [CrossRef] [PubMed]
  5. Glassford, S.E.; Byrne, B.; Kazarian, S.G. Recent applications of ATR FTIR spectroscopy and imaging to proteins. Biochim. Biophys. Acta Proteins Proteom. 2013, 1834, 2849–2858. [Google Scholar] [CrossRef] [PubMed]
  6. Graca, A.; Magalhaes, S.; Nunes, A. Biological predictors of aging and potential of FTIR to study age-related diseases and aging metabolomics fingerprint. Curr. Metabolomics 2017, 5, 119–137. [Google Scholar] [CrossRef]
  7. Muñoz, M.; Uyar, A.; Correia, E.; Díez, C.; Fernández-González, A.; Caamaño, J.N.; Trigal, B.; Carrocera, S.; Seli, E.; Gómez, E. Non-invasive assesment of embrionic sex in cattle by metabolomic fingerprint of in vitro culture medium. Metabolomics 2014, 10, 443–451. [Google Scholar] [CrossRef]
  8. Muñoz, M.; Uyar, A.; Correia, E.; Díez, C.; Fernández-González, A.; Caamaño, J.N.; Martínez-Bello, D.; Trigal, B.; Humblot, P.; Ponsart, C.; et al. Prediction of pregnancy viability in bovine in vitro-produced embryos and recipient plasma with Fourier Transform infrared spectroscopy. J. Dairy Sci. 2014, 97, 5497–5507. [Google Scholar] [CrossRef] [PubMed]
  9. Weber, A.; Hoplight, B.; Ogilvie, R.; Muro, C.; Khandasammy, S.R.; Pérez-Almodóvar, L.; Sears, S.; Lednev, I.K. Innovative vibrational spectroscopy research for forensic application. Anal. Chem. 2023, 95, 167–205. [Google Scholar] [CrossRef] [PubMed]
  10. Cebi, N.; Bekiroglu, H.; Erarslan, A.; Rodríguez-Saona, L. Rapid Sensing: Hand-Held and Portable FTIR Applications for On-Site Food Quality Control from Farm to Fork. Molecules 2023, 28, 3727. [Google Scholar] [CrossRef] [PubMed]
  11. Murru, C.; Chimeno-Trinchet, C.; Díaz-García, M.E.; Badía-Laíño, R.; Fernández-González, A. Artificial Neural Network and Attenuated Total Reflectance-Fourier Transform Infrared Spectroscopy to identify the chemical variables related to ripeness and variety classification of grapes for protected designation of origin wine production. Comput. Electron. Agric. 2019, 164, 104922. [Google Scholar] [CrossRef]
  12. Daniels, G.L.; Fletcher, A.; Garratty, G.; Henry, S.; Jørgensen, J.; Judd, W.J.; Levene, C.; Lomas-Francis, C.; Moulds, J.J.; Moulds, J.M.; et al. International Society of Blood Transfusion. Vox Sang. 2004, 87, 304–316. [Google Scholar] [CrossRef] [PubMed]
  13. Hosoi, E. Biological and clinical aspects of ABO blood group system. J. Med. Investig. 2008, 55, 174–182. [Google Scholar] [CrossRef] [PubMed]
  14. Daniels, G.; Reid, M.E. Blood groups: The past 50 years. Transfusion 2010, 50, 281–289. [Google Scholar] [CrossRef] [PubMed]
  15. Tipos de Sangre|Todo Sobre la Donación de Sangre|Cruz Roja—Donación de Sangre. Available online: https//www.donarsangre.org/todo-sobre-la-sangre/tipos-de-sangre/ (accessed on 27 September 2022).
  16. Socrates, G. Biological Molecules—Macromolecules. In Infrared and Raman Characteristic Group Frequencies, Tables and Charts, 3rd ed.; John Wiley and Sons Inc.: Chichester, UK, 2001; pp. 328–340. [Google Scholar]
Figure 1. FTIR spectra of averaged ABO type samples (left) and Rh samples (right).
Applsci 13 09650 g001
Figure 2. PC representation of samples. Color represents ABO type (up) or Rh factor (down).
Applsci 13 09650 g002
Figure 3. LDA representation for training (circles) and test (stars) datasets. Color of test dataset belongs to their real class, and not to the assigned one. (Up): A, B, AB, and O blood types used; (down): A, B, and O only.
Applsci 13 09650 g003
Table 1. ABO Blood-type distribution and number of samples.
0+A+B+AB+0-A-B-AB-
Spanish
population
35%36%8%2.5%9%7%2%0.5%
Number of samples24 (24%)21 (21%)36 (36%)5 (5%)5 (5%)2 (2%)3 (3%)4 (4%)
Table 2. FTIR selected peaks.
Region/cm−1Region/cm−1Region/cm−1
910–9451213–12572829–2887
980–9991257–13482887–2941
1059–10921348–14252941–2995
1092–11131425–14772995–3107
1113–11401477–15833107–3224
1140–11861583–17163224–3383
Table 3. T+, T-, F+, and F- expected distribution in a random classification with frequency distribution f and probability of assignation p.
Ratio ofT+T-F+F-
Mathematical expression i p i · f ( i ) N 1-T+-F+-F- i , j p i · p ( j ) i j N i , j p i · p ( j ) i j N
Considering four classes: A, B, AB, and 0
With p(i) = f(i) = Table 1
Natural frequencies
9.7%59.7%15.3%15.3%
With p(i) = f(i) = Table 1
Sampling frequencies
7.4%57.4%17.6%17.6%
Considering three classes: A, B, and 0
With p(i) = f(i) = Table 1
Natural frequencies
13.8%47.0%19.6%19.6%
With p(i) = f(i) = Table 1
Sampling frequencies
11.7%44.9%21.7%21.7%
Table 4. Training and test dataset confusion matrixes for LDA and success rates.
LDA ClassificationRandom Classification
Assigned Class Assigned Class
Real class ABAB0Real class ABAB0
A6%<1%2%7%A5%9%3%6%
B6%26%9%4%B9%15%5%10%
AB2%6%6%0%AB3%5%2%3%
015%0%3%10%06%10%3%7%
T+T-F+F-
A-type success rate 6.1% 62.1% 22.2% 9.6%
B-type success rate 25.8% 50.0% 6.1% 18.2%
AB-type success rate 6.1% 73.2% 13.6% 7.1%
0-type success rate 9.6% 62.1% 10.6% 17.7%
Average success rate 11.9% 61.9% 13.1% 13.1%
LDA classificationRandom classification
Assigned class Assigned class
Real class AB0Real class AB0
A10%2%13%A6%11%7%
B3%37%4%B11%23%14%
015%1%16%07%14%9%
T+T-F+F-
A-type success rate 9.8% 58.0% 17.8% 14.4%
B-type success rate 36.8% 53.4% 2.9% 6.9%
0-type success rate 16.1% 51.1% 16.7% 16.1%
Average success rate 20.9% 54.2% 12.5% 12.5%
Table 5. NBC results for A, B, AB, and 0 (up) and A, B, and 0 (down).
NBC ClassificationRandom Classification
Assigned Class Assigned Class
Real class ABAB0Real class ABAB0
A9%5%1%2%A5%8%3%6%
B8%29%4%1%B8%15%5%10%
AB4%8%6%2%AB3%5%2%3%
011%8%3%3%06%10%3%7%
T+T-F+F-
A-type success rate 8.6% 62.1% 22.2% 7.1%
B-type success rate 29.3% 38.4% 19.7% 12.6%
AB-type success rate 6.1% 73.7% 7.6% 12.6%
0-type success rate 2.5% 72.2% 4.0% 21.2%
NBC Success rate 11.6% 61.6% 13.4% 13.4%
NBC classificationRandom classification
Assigned class Assigned class
Real class AB0Real class AB0
A10%7%6%A6%11%7%
B10%30%3%B11%23%13%
016%11%7%07%13%8%
T+T-F+F-
A-type success rate 9.8% 50.6% 25.9% 13.8%
B-type success rate 29.9% 39.1% 18.4% 12.6%
0-type success rate 6.9% 56.9% 9.2% 27.0%
Average Success rate 15.5% 48.9% 17.8% 17.8%
Table 6. PC-NBC results for A, B, AB, and 0.
NBC ClassificationRandom Classification
Assigned Class Assigned Class
Real class ABAB0Real class ABAB0
A4%7%1%9%A5%8%3%6%
B5%32%4%5%B8%15%5%10%
AB0%7%6%0%AB3%5%2%3%
011%8%0%5%06%10%3%7%
T+T-F+F-
A-type success rate 3.5% 67.7% 13.1% 15.7%
B-type success rate 31.8% 31.3% 23.7% 13.1%
AB-type success rate 5.6% 83.8% 4.0% 6.6%
0-type success rate 5.1% 63.1% 13.1% 18.7%
NBC Success rate 11.5% 61.5% 13.5% 13.5%
Table 7. Classification as A and B independently with LDA or NBC. * marks worse results than the random classification.
T+T-F+F-
Identifying A with LDA 9.6% * 50.0% * 19.2% 21.2%
Identifying B with LDA 46.5% 42.4% 35.4% 7.6%
Identifying A with NBC 21.2% 35.3% * 31.3% * 12.1%
Identifying B with NBC 44.4% 26.8% 16.2% 12.6%
Table 8. IMAC classification table.
IMAC NumberLDA—ALDA—BNBC—ANBC—BBlood Type
0----O
1---+O
2--+-O
3--++A
4-+--B
5-+-+B
6-++-B
7-+++B
8+---O/A
9+--+A
10+-+-A
11+-++A
12++--B
13++-+AB
14+++-AB
15++++AB
Table 9. IMAC blood typing confusion matrix.
NBC ClassificationRandom Classification
Assigned Class Assigned Class
Real class ABAB0Real class ABAB0
A7%3%0%10%A5%8%2%4%
B3%31%7%4%B8%21%5%10%
AB1%8%4%1%AB2%5%2%3%
012%2%0%10%04%10%3%6%
T+T-F+F-
A-type success rate 7.1% 66.2% 14.7% 12.1%
B-type success rate 31.3% 42.9% 12.1% 13.6%
AB-type success rate 3.5% 80.8% 7.1% 8.6%
0-type success rate 10.1% 62.1% 14.1% 13.6%
IMAC Success rate 13.0% 63.0% 12.0% 12.0%
Disclaimer/Publisher’s Note: The statements, opinions and data contained in all publications are solely those of the individual author(s) and contributor(s) and not of MDPI and/or the editor(s). MDPI and/or the editor(s) disclaim responsibility for any injury to people or property resulting from any ideas, methods, instructions or products referred to in the content.

