Article

An Objective Evaluation Method for Driver/Passenger Acceptance of an Autonomous Driving System for Lane Changes

Platform Safety Technology R&D Department, Korea Automotive Technology Institute, Choenan 31214, Republic of Korea
Appl. Sci. 2023, 13(17), 9601; https://doi.org/10.3390/app13179601
Submission received: 13 May 2023 / Revised: 20 July 2023 / Accepted: 23 August 2023 / Published: 24 August 2023
(This article belongs to the Section Transportation and Future Mobility)

Abstract

:
Reliable assessment methods of driver acceptance are needed due to increased interest in high levels of autonomous driving systems. Subjective evaluation methods have mostly been utilized to assess the acceptance of newly developed advanced driver assistance systems because acceptance varies depending on the individual. In this paper, an objective evaluation methodology of driver acceptance for an autonomous driving system was proposed based on objective measurable parameters in the case of automatic lane change situations. To this end, a massive driver–vehicle interaction database was utilized, constructed by a specially designed experimental program. The experiment was carried out with 19 selected drivers (9 experts and 10 novices), supposed as an autonomous driving system. The database consisted of not only various measurable parameters on control commands, vehicle behaviors, and relations with other vehicles but also subjective acceptances. To interpret the driver acceptance, objective parameter sets were derived by two different methods: a statistical significance test and an acceptance sensitivity analysis. Then, a modeling method based on stochastic estimation to evaluate driver acceptance was suggested as an objective evaluation method for the driver acceptance of an automatic lane change system. The data set of the expert drivers was only used for the acceptance evaluation modeling; the other data sets of the novice drivers were used for verifications for the suggested model. The estimation accuracies of the two different models using a significance test and sensitivity analysis were 90.2% and 99.5%, respectively. This objective method for acceptance evaluation can not only be expanded to other functions of an autonomous driving system but also to an entirely autonomous driving vehicle.

1. Introduction

In the last few decades, with increased interest in the technologies of autonomous vehicles, substantial efforts have been made in the research and development of various driver assistance systems as part of autonomous driving technologies, and such systems are now being introduced at a faster rate. Advanced Driver Assistance Systems (ADASs) such as Adaptive Cruise Control (ACC), Lane Keeping Aid (LKA), and Automatic Emergency Brake (AEB) have a positive impact on traffic safety [1]. It is expected that further development of Advanced Driver Assistance Systems, and eventually highly automated driving, will continue to increase traffic safety by reducing the impact of human error [2].
To advance the commercialization of fully autonomous vehicles, considerable efforts have been invested in the research of semi-automated driving systems such as an automatic lane change system. However, important issues remain including safety, reliability, passengers’ acceptance, etc. In particular, acceptance assessment is recognized as one of the most important issues [3,4]. Because customers decide to use or not use a system, most advanced technologies, such as an autonomous vehicle, will have no value if customers do not use a proposed system even when the system satisfies all requirements of safety and reliability.
In accordance with the increased interest in higher levels of automated driving technologies, a reliable assessment tool for driver acceptance is needed for their development and deployment which estimates and secures driver acceptance in a broad manner. Because acceptance is on an individual level, it can only be based on an individual’s personal attitudes, expectations, experiences, and subjective evaluation of a system and the effects of using it [3,5].
A number of studies on user acceptance have been conducted over the past decades. A standardized checklist was proposed for the assessment of the level of acceptance of a new vehicle technology [6]. The idea of technology acceptance was also defined in terms of usefulness, ease of use, effectiveness, affordability, and social acceptance [4]. Technology adaptation characteristics were studied based on gender differences [7]. A technology acceptance model was suggested based on subjective rating scales [8]. The aforementioned technologies are being developed not only for safety but also for convenience. Accordingly, drivers’ experience and acceptance of an Intelligent Speed Adaptation system were investigated [9]. Various studies on lane change assistance have been carried out to satisfy drivers’ acceptance [10,11,12,13,14].
In a literature review, referring to [3,4,5,6,7,8,9,10,11,12,13,14], almost all of the research was conducted based on subjective methods: questionnaire development, questions and/or rating scales, etc. Even though research results concerning acceptance have been presented, how it has been assessed and how the results have been obtained are not described in most studies. Previous studies mostly focused on measuring acceptance as various types of participants’ opinions on the target systems. These studies have suggested various types of methods to validate that their results are objectively reliable.
As seen in the literature review, acceptance has been considered with individuals’ subjective evaluation. Consequently, most studies have used moderate questions/or phrases to obtain individuals’ subjective opinions in accordance with a specific structure for the acceptance analysis, and the results were presented with statistics. Therefore, there are a few significant problems as follows. Acceptance is generally assessed after the target systems are realized at certain levels, for example, by performing a jury test with a prototype of the system. Target values or ranges for the evaluation are different in each case. Responses and evaluation results of participants may be dependent on the questionnaires used. The subjective assessment process is expensive and takes much time because the reliability of the evaluation results is also dependent on the number of participants. According to [4], there is also no consistency across studies as to what acceptance is and how to measure it.
Therefore, it is hard to assess the acceptance of systems in the design phase although everyone knows that it is desirable. If the acceptance can be accurately predicted as early as possible in the design process, different alternatives are not only able to be evaluated but also some obstacles may be identified and overcome.
To secure acceptance in the design phase, an objective evaluation method or index is needed. In general, an objective evaluation method has a significant advantage in quantifying some values to be assessed. The effects of the objective evaluation method can be increased for cases where assessment results are conventionally performed by some subjective methods such as the driver acceptance of an advanced driver assistance system. If acceptance is objectively evaluated in design phases, developers may have several advantages. For example, the design targets of a developing system can be clearly defined as driver acceptance based on objective and observable values, and the development period and cost can be substantially reduced.
Hence, in this study, the primary objective was the study of an objective evaluation methodology of passenger acceptance for autonomous driving systems with a representative autonomous driving system with an automatic lane change system, which is regarded presently as close to commercialization. The specific research objectives were to determine how objective parameters for describing driver acceptance can be derived and how driver acceptance can be evaluated with the derived objective parameters. It is assumed that the objective parameters must be simply measurable. The suggested objective evaluation method can be used for assessing driver/passenger acceptance of an automatic lane change system.
To study the objective acceptance evaluation method, a special database constructed in a previous study was used [15]. In Section 2, driver/passenger acceptance is defined and measurement strategy is discussed. Section 3 describes part of the special passenger-vehicle interaction database used throughout this study. Section 4 presents a novel objective evaluation methodology for passenger acceptance. Section 5 presents the objective parameters and objective evaluation models derived based on the suggested methods. Then, the verification results are presented.

2. Driver/Passenger Acceptance

2.1. Definition of Driver/Passenger Acceptance

Since acceptance is primarily influenced by individuals’ emotional factors, it is crucial to discuss and define what acceptance means in this study. In a previous study, a statement on the purpose of investigating the acceptance is shown: ‘Driver acceptance is the precondition that will permit new automotive technologies to achieve their forecasted benefit levels’; another statement addressing the need to determine whether drivers will accept and use the new technologies as intended is as follows: ‘Driver acceptance measurement also provides a means to estimate drivers’ interest in purchasing and using new technologies as a basis for estimating the safety benefit associated with its use [16]. Acceptance is seen as the link to usage in [6], and acceptance is explained as a predictor of the willingness to buy a system [17]. While many studies claim the importance of acceptance and assessing the acceptance of new technologies, there are many different ways of viewing acceptance. A statement on a problematic issue of the definition of acceptance is as follows: ‘While everyone seems to know what acceptability is, and all agree that acceptability is important, there is no consistency across studies as to what acceptability is and how to measure it’ [4].
The definition of acceptance identified in the literature was classified into five categories in a recent literature review [3]. The word “accept” is simply used for the first category: for example, ‘acceptance is the degree to which a law, measure or device is accepted’ [18]. The second category is defined concerning the satisfaction of the needs and requirements of users. For example, ‘basically the question of whether the system is good enough to satisfy all the needs and requirements of the users and other potential stake holders’ [19]. The third category is described as “the sum of all attitudes”. For example, ‘Acceptance refers to what the objects or contents for which acceptance is measured are associated to; what do those objects or contents imply for the asked person’ [8]. The fourth category is explained by “the will to use the system”. For example, ‘acceptance is the intention to adopt an application’ [20]. The fifth category focuses on “the actual use of the system”. For example, ‘the demonstrable willingness within a user group to employ information technology for the task it is designed to support’ [21].
In this study, if acceptance is not defined well, it is not only possible to assess acceptance, but also to build an assessment tool for an automatic lane change system. In order to achieve a study on an objective method of the acceptance for an automatic lane change system, acceptance is defined and suggested considering the target system as follows in the following statement.
“Acceptance is the classification to which an individual intends to use the system in his/her driving if the system is incorporated.”
This suggested definition of acceptance has the advantage of focusing on the individual perspective, both regarding the subjective evaluation of the system and the advantages of using the system. This provides the potential to realize the expected effects of the system. This definition also provides an opening for assessing a system in development by addressing the intention to use the system if the system was available as potential acceptance.

2.2. Measurement of Driver/Passenger Acceptance

Measurement of driver/passenger acceptance must be such an uncertain work because it is based on individuals’ emotional factors. However, measurement of those uncertain human factors has been researched in the fields of drivers’ mental workload. Thus, as well known, the solutions to measure drivers’ mental workload are classified into three categories: subjective measures, performance measures, and physiological measures [22].
One of the representative methodologies of subjective measures is a self-reporting method. Self-reporting methods have always been very attractive to many researchers. No one can provide a more accurate judgment concerning a mental load than the person experiencing it [23]. The self-reporting method is considered one of the best methods since this type of research comes closest to tapping into the essence of mental workload [24].
Performance measures are classified into three categories: primary-task performance measures, secondary-task performance measures, and reference tasks [23]. Primary task performance is a measure of the overall effectiveness of man–machine interactions [22]. For vehicle driving experiments, the number of errors made in tracking performance, speed of performance, or reaction time measures are frequently used as primary task performance measures. Secondary task measures can be taken when another task is added to the primary task. Reference tasks are standardized tasks that are performed ‘before’ and ‘after’ the task under evaluation, and they mainly serve as a validation instrument for trend effects.
The last type of measures represents those derived from the operator’s physiology. The advantage of physiological responses is that they do not require an overt response by the operator, and most cognitive tasks do not require overt behavior. Several disadvantages of physiological measures are mentioned in [25], i.e., the required specialized equipment and technical expertise and the critical signal-to-noise ratios. It is also stated that the operator’s physiology, a reflection of bodily functions, is further removed from operator–system performances than primary task performance.
Considering the measurement of driver acceptance concerning the above-described methodologies, in this study, two methods were employed to measure and investigate driver/passenger acceptance: the subjective measure and the performance measure. Thus, the vehicle experiment program was designed concerning those methods as follows. As mentioned above, the subjective assessment, self-reporting on acceptance, is supposed to be immediately coded between ‘Accept’ and ‘Reject’ considering the reliability of true values. Additionally, with respect to the performance measures, dozens of measurable objective parameters were continuously collected for the vehicle experiments. By investigating the relationships between the subjective assessment results and the measured objective parameters, objective methodologies for the evaluation of driver acceptance were herein studied.

3. Driver/Passenger–Vehicle Interaction Database

For this study, a special database was needed that included control command, vehicle behaviors, relations between vehicles, subjective assessment data of the driving performance, etc. To derive the objective evaluation method, a driver–vehicle interaction database constructed in a previous study was used. The database provides specific experiment results of passenger–vehicle interaction data conducted with 19 selected drivers, and it contains various types of measurable parameters and subjectively assessed acceptance values. For this study, the drivers served as control system for the automatic lane change system and were classified into two groups, i.e., expert and novice. The selection and classification conditions were as follows: more than three years of work experience as a regular chauffeur for the experts, and less than one month of driving experience with their vehicles for the novices. The expert group was expected to show stable and safe driving results with a comparably higher acceptance rate from passengers. The other group of novice drivers was expected to show unstable and dangerous driving results with comparably lower acceptance rates from passengers. For the classification of these two groups, it was mainly assumed that the driving characteristics of the expert drivers would be more desirable concerning driver/passenger acceptance.
In the experimental program, only the lane change situation was considered and drivers served as a control system of autonomous driving systems, particularly an automatic lane change system. Two passengers were designated to observe and evaluate lane change performance considering both vehicle behaviors and traffic relations. Throughout the experiment, the drivers drove and conducted lane changes not only autonomously but also as commanded. The database contains a massive amount of information on the results of subjective assessment and various objective data for lane change situations on an expressway, with vehicle speeds from 80 kph to 90 kph on average. As shown in Figure 1a, 19 drivers participated in this test: 10 of them were considered expert drivers; the other 9 drivers were considered novice drivers. Thus, 1823 events were collected through this test; 45% of those events were directed by the experimenter; the other cases were the results of the drivers’ own decisions. Figure 1b shows the ratios of lane change situations classified by certain conditions between the expert and novice drivers. Figure 1c shows the ratios between accepted and rejected lane change cases. It is seen that accepted cases were two times greater in occurrence than the rejected cases.

4. Objective Evaluation Methodology for Passenger Acceptance

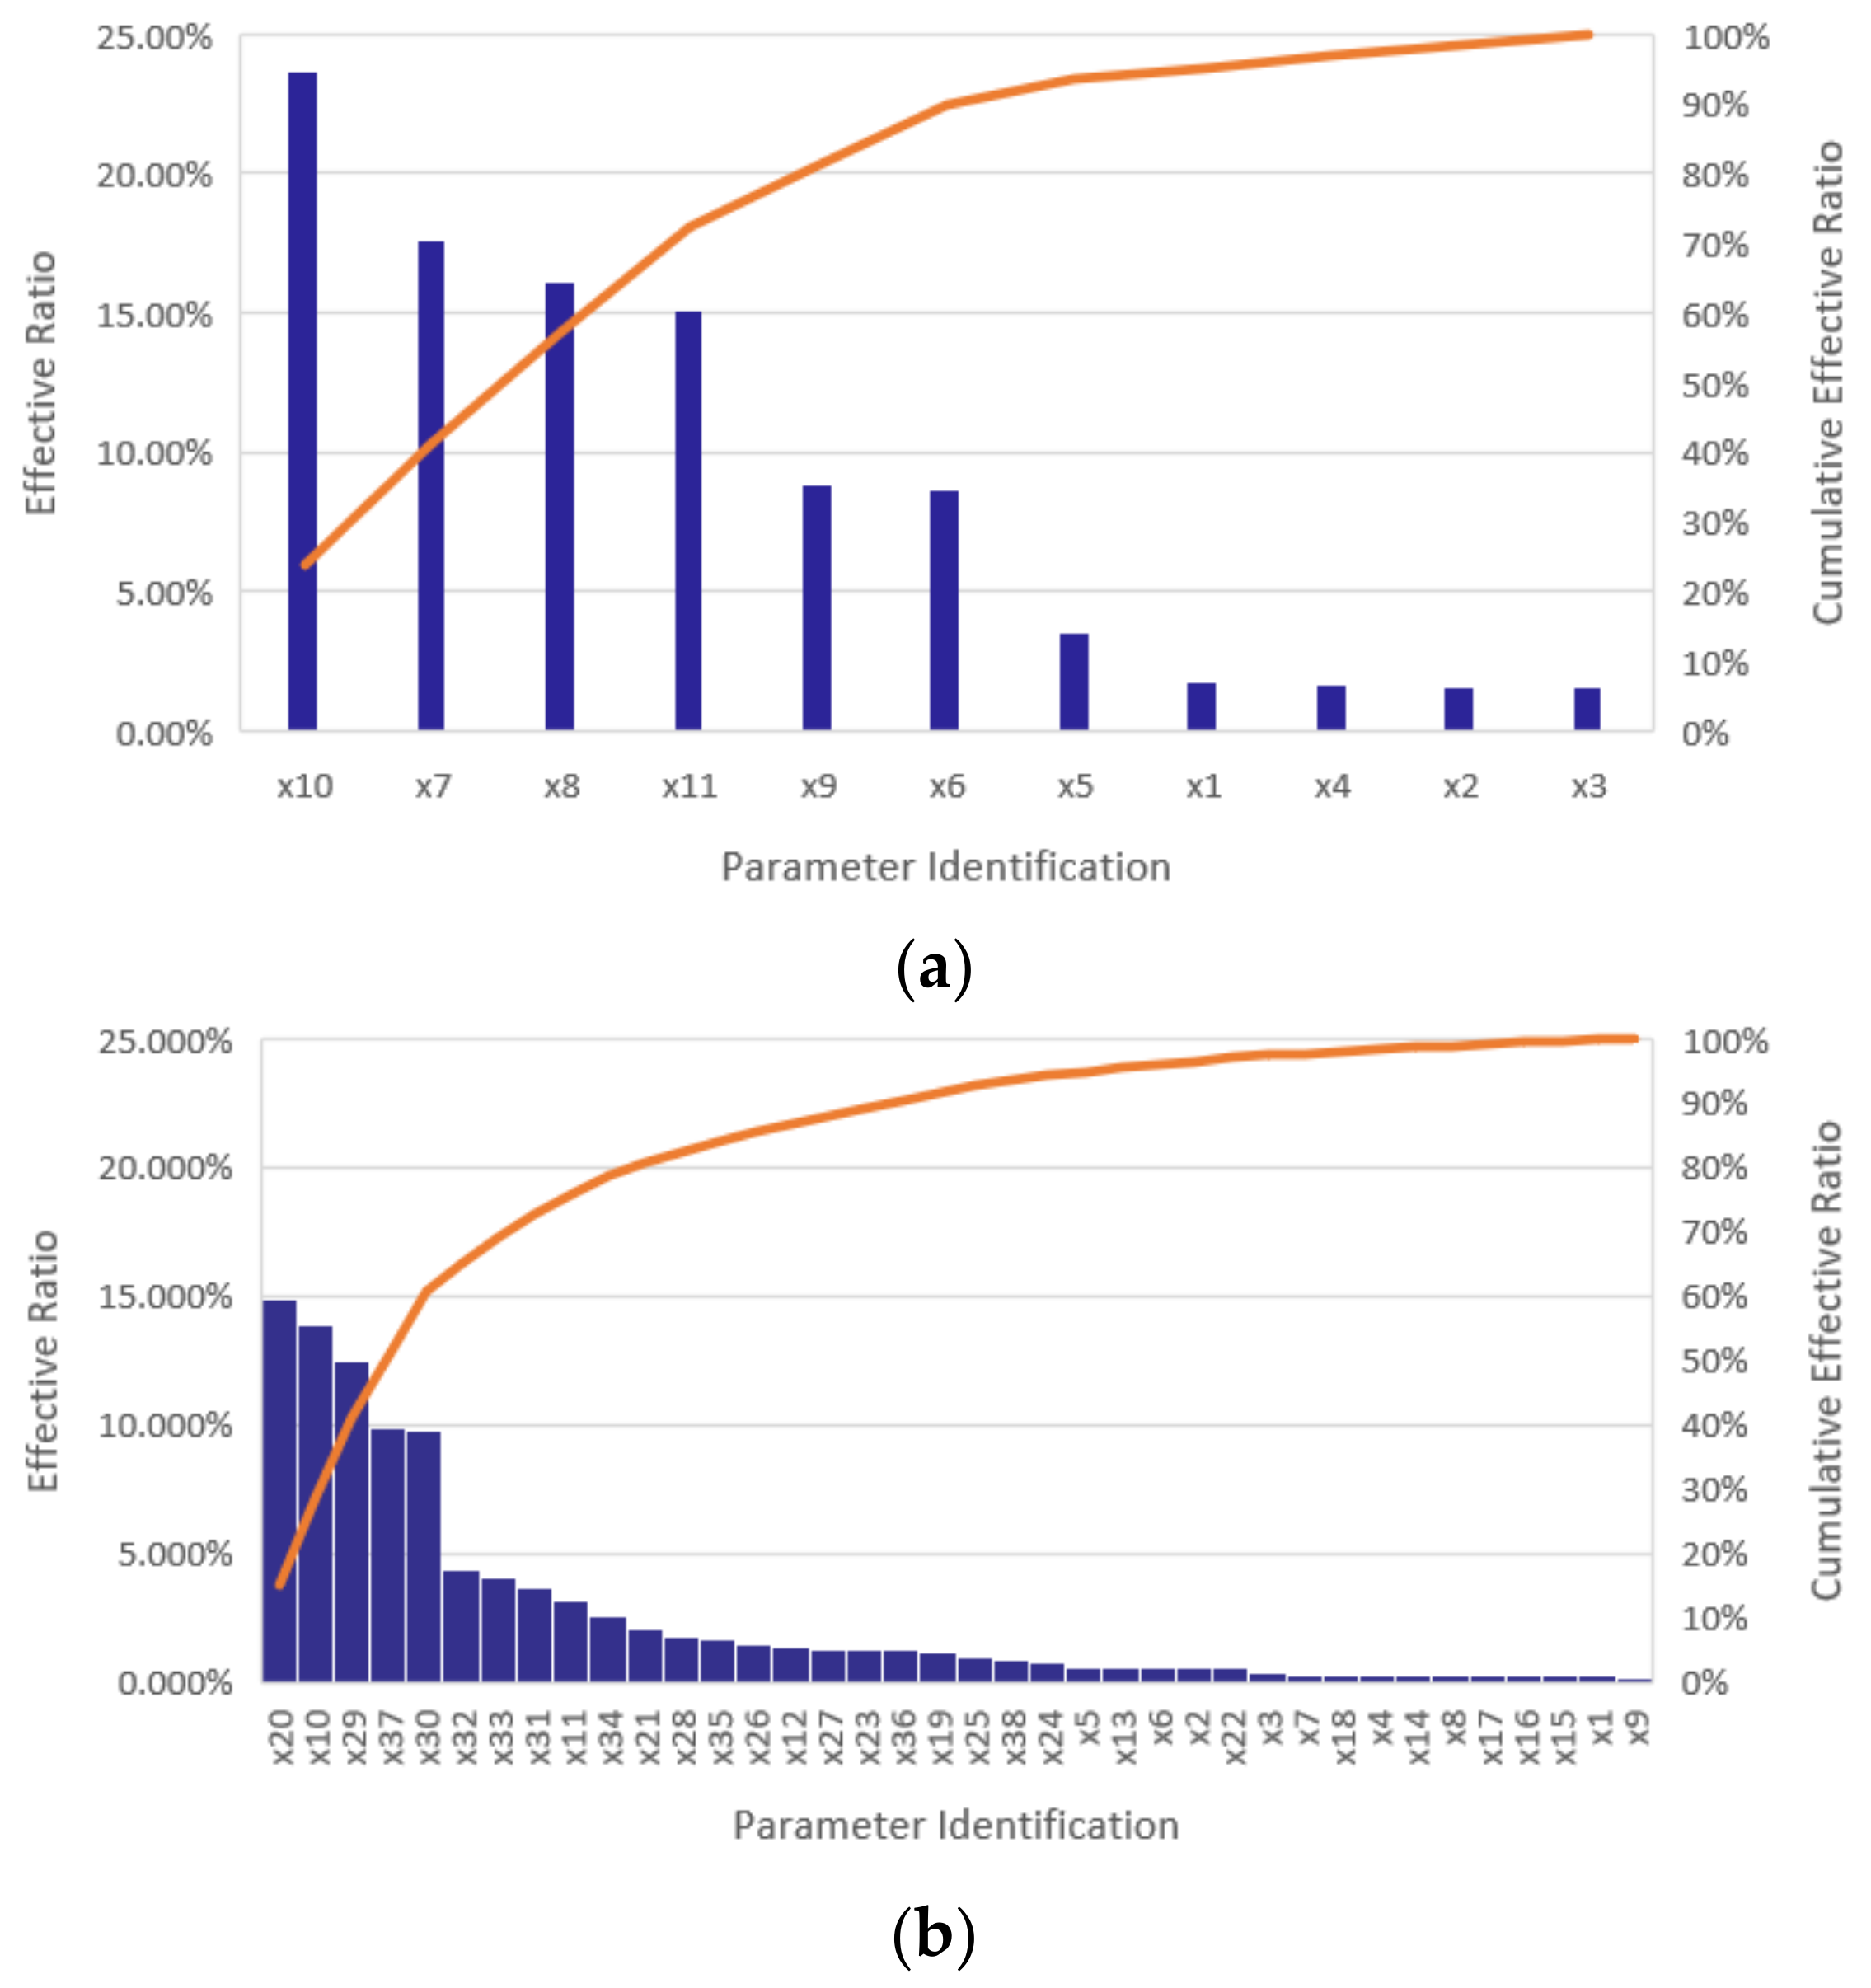
4.1. Methodology of Objective Parameter Analysis and Selection

To study the objective parameters related to the subjective assessment results, a significance test and sensitivity values were used [15]. First, a significance test was performed on the parameters measured in relation to passengers’ acceptance during lane changes. A null hypothesis and alternative hypothesis are shown in Equation (1) and were tested. X and Y represent the sets of all parameters observed for accepted and rejected cases during lane changes, and E[X] and E[Y] are the statistically expected values of each set.
Hypothesis   H 0 ( n u l l ) : E [ X ] = E [ Y ] H 1 ( a l t e r n a t i v e ) : E [ X ] E [ Y ]
The t-ratio for the significance test of each parameter in relation to lane change acceptance was calculated as shown in Equation (2):
t = X ¯ Y ¯ ( n X 1 ) S X 2 + ( n Y 1 ) S Y 2 ( n X 1 ) ( n Y 1 ) 1 n X + 1 n Y
where nX and nY are the size of the samples, X ¯ ,   Y ¯   are the sample means, and S X 2 ,   S Y 2 are the variances of X and Y. Through this statistically significant test, in general, significant parameters in relation to subjective acceptance were drawn at a significance level below 5% (p-value < 0.05) as the objective parameters in order to represent driver acceptance.
The acceptance sensitivity, i.e., the sensitivity of parameters between the accepted cases and rejected cases, is defined in Equation (3).
S Acceptance = abs E [ Y ] E [ X ] E [ X ] × 100 ( % )
Only sensitive parameters showing an acceptance sensitivity greater than certain sensitivity levels were selected for the objective evaluation of acceptance. In this study, the cut-off sensitivity levels were designated at 30% and were designed by comparing the estimation results of the driver acceptance models by varying the acceptance sensitivity levels.

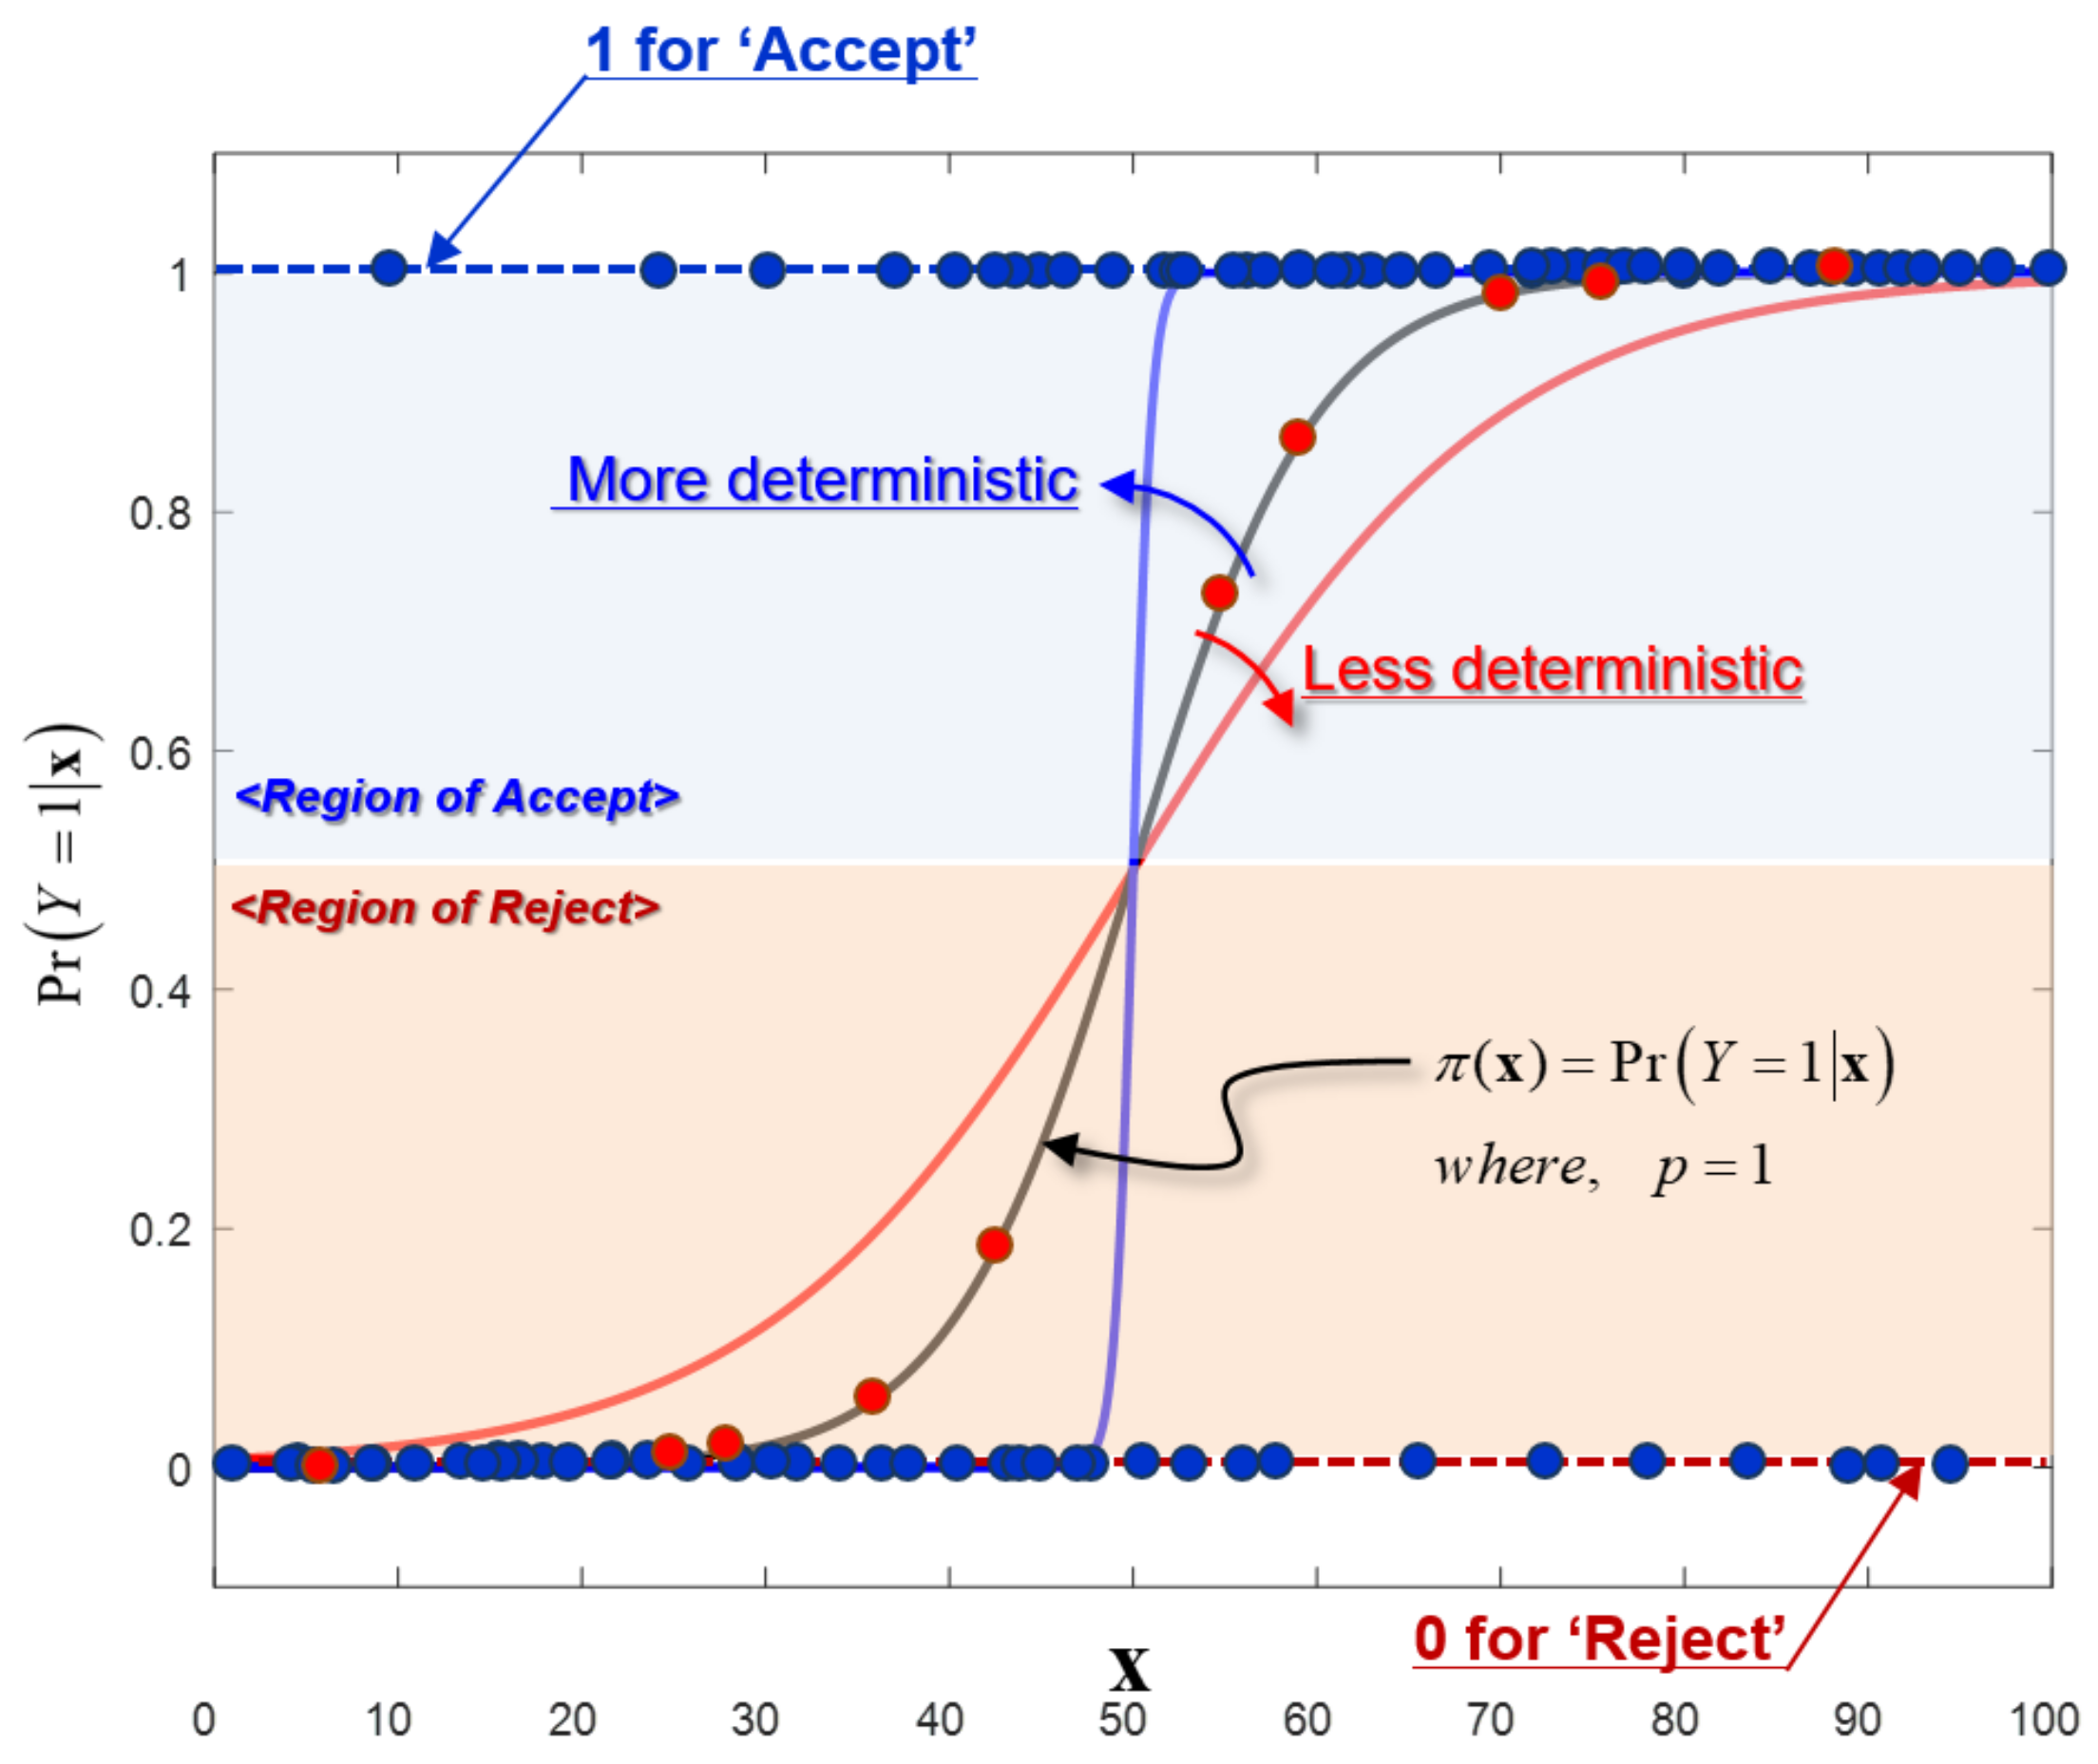
4.2. Stochastic Estimation and Evaluation of the Acceptance

A modeling method of the driver acceptance evaluation model based on a stochastic estimation is proposed to estimate and evaluate passenger acceptance with the suggested parameter sets; this modeling method fundamentally follows the well-known theory of binary logistic regression. By comparing the acceptance models developed based on the different objective parameter sets, the interpretation performances of each parameter set can be validated.
As stated in reference [26], regression methods have become an integral component of any data analysis concerned with describing the relationship between a response variable and one or more explanatory variables. In Figure 2, an example of stochastic estimations with a single variable is shown to show the suggested schematic methodology of the acceptance estimation for the objective evaluation. For this single-variable estimation model, it can be stated that the model is more deterministic when the absolute values of the constant ( β 0 ) and coefficient ( β 1 ) are higher. In this study, the subjective assessment results, the outcome variables, were recorded in binary with various continuous variables, which were the measured parameters on the vehicle behaviors and relationships. Additionally, specific parameter sets were derived for driver acceptance. Thus, the acceptance model was presented based on multi-variables. Therefore, acceptance can be objectively evaluated by the developed acceptance evaluation model with the measured values for the given parameter sets. Logistic regression models are the most frequently used models for analyses of this kind of binary data, and the experimentally interpretable model to describe the relationship between an outcome variable and a set of explanatory variables can be derived as follows.
In this study, dozens of explanatory parameters were used to describe emotional acceptance. To derive a multi-variable logistic regression model, a collection of p variables denoted by the vector x T was considered and in Equation (4):
x T = x 1 , x 2 , , x p
where it is assumed that each of the variables in the vector XT are interval-scaled.
By defining the conditional probability, the outcome denoted by Pr Y = 1 x = π ( x ) , the logit of the multiple logistic regression model is given by Equation (5).
g ( x ) = ln π ( x ) 1 π ( x ) = β 0 + β 1 x 1 + β 2 x 2 + + β p x p
Then, the logistic regression model based on conditional probability π ( x ) is formulated by Equation (6).
π ( x ) = Pr Y = 1 x = e β 0 + β 1 x 1 + β 2 x 2 + + β p x p 1 + e β 0 + β 1 x 1 + β 2 x 2 + + β p x p = e g ( x ) 1 + e g ( x )
Here, it is assumed that there was a sample of n observations of the pairs x i , y i , where i = 1, 2, ⋯, n. To fit the model in (6), the unknown parameter set of vector β T and the p + 1 coefficients of each defined explanatory variable in Equation (7) were obtained.
β T = β 0 , β 1 , , β p
Then, for the objective evaluation, the acceptance was discerned via outcome value of the model in (6) with respect to a critical value, 0.5, as shown in Equation (8).
Decision   criteria   Accept :   π ( x ) 0.5   Reject :   π ( x ) < 0.5
Finally, the values of β T were derived by using the maximum likelihood method [27,28]. A receiver operating characteristics (ROC) curve was also utilized for visualizing, organizing, and selecting classifiers based on their performances [29]. The ROC curve is an effective method for describing the performances of a stochastic classifier by varying the threshold value for the decision. The performances are presented with a true positive rate and false positive rate considering the predicted true values, which are defined in Equations (9) and (10) as follows.
True   Positive   Rate = T r u e   P o s i t i v e T r u e   P o s i t i v e + F a l s e   N e g a t i v e
False   Positive   Rate = F a s l e   P o s i t i v e F a l s e   P o s i t i v e + T r u e   N e g a t i v e
Here, the true positive rate means that the rate of the estimated values is correct in 1 for the true values coded as 1, and the false positive rate means that the estimated values are wrong in 1 for the true values coded as 0, respectively. A representative performance index of the ROC curve for a stochastic classifier is the area under the curve (AUC). When considering the ROC space, the performance of the classifier was worse when the AUC was closer to 0.5 and better when it approached 1.0.

5. Driver Acceptance Evaluation Model

5.1. Parameter Selection

This section is organized as follows. The objective parameters for this research are described and defined in Section 5.1.1. In Section 5.1.2, Section 5.1.3 and Section 5.1.4, the objective parameters for the modeling of the acceptance evaluation are presented based on the methodology described in Section 4.1. The specific data group among the entire database is subjective and was classified according to expert drivers performing lane changes only as commanded and lane changes in traffic. The criteria for the choice of the data set were as follows: ‘expert drivers’ for fine driving performance, ‘as commanded’ for the automatic lane change system considered in this study, and ‘with traffic’ for a more challenging condition.

5.1.1. Objective Parameters

In the interaction database, each lane change case is described with various measurable, objective parameters. Table 1 shows the parameters selected for this study, including several representative parameters related to the control command, vehicle dynamic behavior, and relative relations with surrounding vehicles with their descriptive statistical values.
To analyze the statistical significance and the acceptance sensitivity of the parameters associated with the spatial relationships between vehicles in terms of driver acceptance, the relative positions regarding three target vehicles are defined in Figure 3. Each surrounding vehicle was defined as follows: Target A represents the leading vehicle in the active lane, Target B represents the leading vehicle in the target lane, and Target C represents the following vehicle in the target lane.
Table 1. Parameters selected for the study, including several parameters related to the control command, vehicle dynamic behavior, and relative relations with surrounding vehicles.
Objective FactorsDescription
First Level2nd Level3rd Level
Control CommandTPSMinimumThrottle position sensor
Maximum
Median
Mean
Standard Deviation
δ Steering wheel angle
δ ˙ Steering wheel angular velocity
Vehicle behavior V x MinimumLongitudinal velocity
Maximum
Median
Mean
Standard Deviation
V y Lateral velocity
V ˙ x Longitudinal acceleration
V ˙ y Lateral acceleration
V ¨ x Longitudinal jerk
V ¨ y Lateral jerk
ψ Yaw angle
ψ ˙ Yaw angular velocity
ψ ¨ Yaw angular acceleration
ϕ Roll angle
ϕ ˙ Roll angular velocity
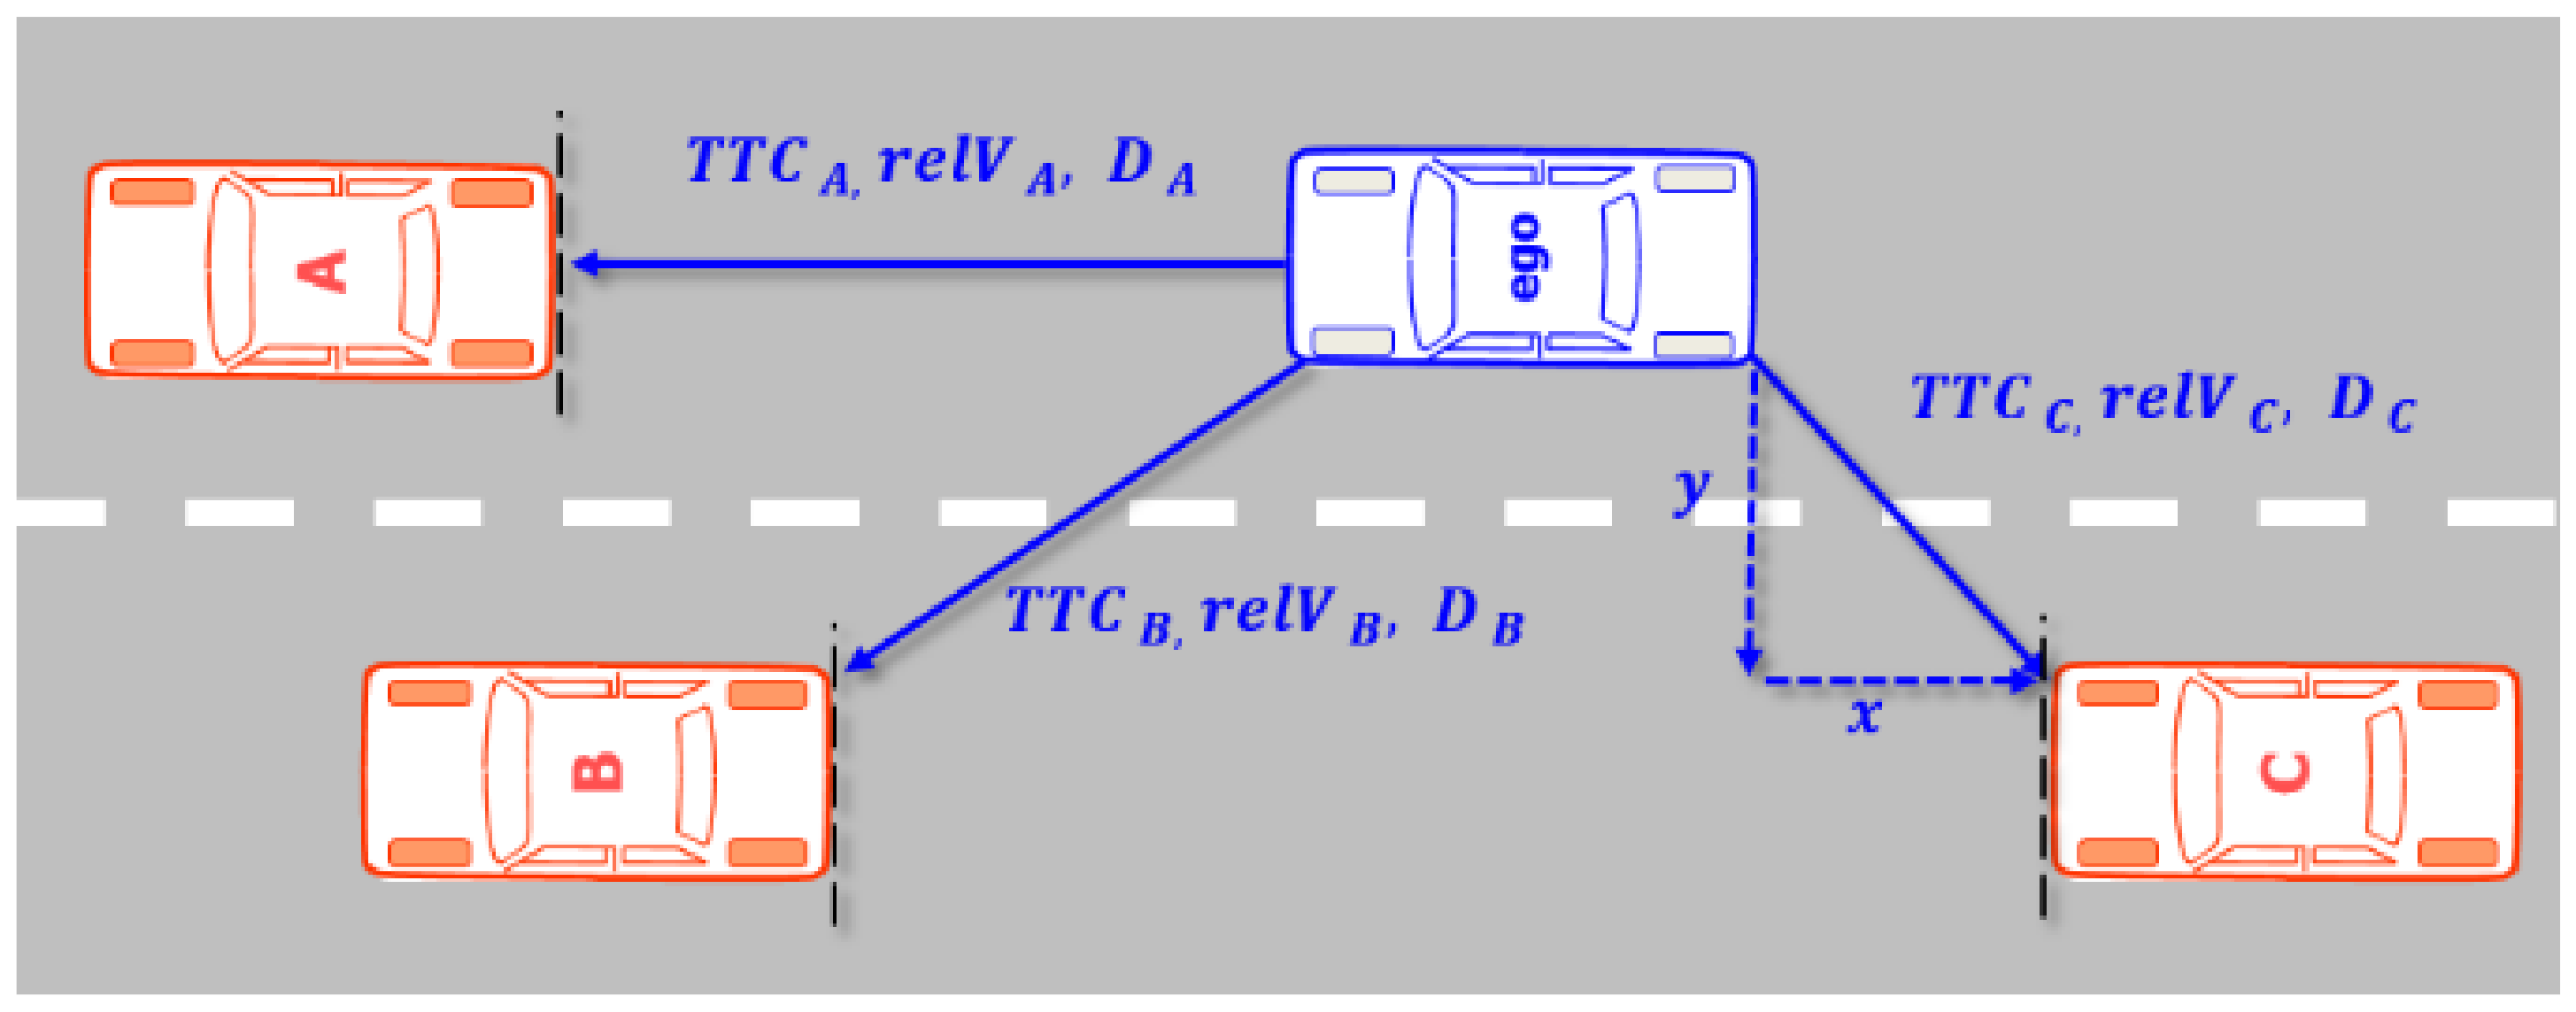
Vehicle Relationships
(Targets A, B, C)
TTCMinimumTime to collision
Maximum
Median
Mean
Standard Deviation
TTCxLongitudinal time to collision
TTCyLateral time to collision
relVRelative velocity
relVxLongitudinal relative velocity
relVyLateral relative velocity
DDistance
DxLongitudinal distance
DyLateral distance
↑ means “same as above”.
The primary parameters are the time to collision (TTC), relative velocity (relV), and distance between vehicles (D); the definitions are given by Equations (11), (12) and (13), respectively.
T T C i = abs [ P e g o P Target ] V e g o
where TTCi is the time to collision at the ith step; Pego and PTarget A,B,C are the positions of the ego-vehicle and each target vehicle; and Vego is the velocity of the driving vehicle.
r e l V i = V e g o V T a r g e t A , B , C
where relVi is the relative velocity between the driving vehicle and the target vehicles at the ith step and VTarget A,B,C is the velocity of each target vehicle.
D i = abs [ P e g o P T a r g e t A , B , C ]
where Di is the absolute distance between the ego-vehicle and the target vehicles at the ith step.

5.1.2. Acceptance in Relation to the Control Commands

The representative parameters of the control commands in relation to subjective acceptance were analyzed by their statistical significances and acceptance sensitivities. The parameter sets of the control commands are defined by Equations (14) and (15): X for the accepted cases and Y for the rejected cases.
X C o n t r o l = T P S A c c e p t e d S W A A c c e p t e d S W V A c c e p t e d = min T P S A c c e p t e d       ~ n ( μ min T P S A c c e p t e d , σ min T P S A c c e p t e d 2 ) SD T P S A c c e p t e d       ~ n ( μ SD T P S A c c e p t e d , σ SD T P S A c c e p t e d 2 ) min S W V A c c e p t e d       ~ n ( μ min S W V A c c e p t e d , σ min S W V A c c e p t e d 2 ) SD S W V A c c e p t e d       ~ n ( μ SD S W V A c c e p t e d , σ SD S W V A c c e p t e d 2 )
Y C o n t r o l = T P S Rejected S W A Rejected S W V Rejected = min T P S Rejected       ~ n ( μ min T P S Rejected , σ min T P S Rejected 2 ) SD T P S Rejected       ~ n ( μ SD T P S Rejected , σ SD T P S Rejected 2 ) min S W V A c c e p t e d       ~ n ( μ min S W V A c c e p t e d , σ min S W V A c c e p t e d 2 ) SD S W V Rejected       ~ n ( μ SD S W V Rejected , σ SD S W V Rejected 2 )
Each set of parameters comprises the following descriptive statistical values: the minimum value, maximum value, median value, mean value, and standard deviation. A significance test and acceptance sensitivity analysis were performed for each parameter. Parameters for which the significance level was below 5% (p-value < 0.05) or the acceptance sensitivity was over 30% are presented in Table 2. As seen in the results, three parameters met the acceptance acceptance sensitivity criterion while no parameters met the statistical significance criterion. Additionally, Table 2 shows that no parameters were selected according to the historical effects on the acceptance in both the statistical significance test and the acceptance sensitivity analysis. Hence, the three parameters for the control commands selected from the acceptance sensitivity analysis are throttle open (TPS), steering wheel angle δ , and steering wheel angular velocity δ ˙ .

5.1.3. Acceptance in Relation to Vehicle Behaviors

The representative parameters of the vehicle dynamic behaviors in relation to the subjective acceptance were also analyzed for statistical significance and acceptance sensitivity. The sets of parameters for vehicle dynamic behaviors are the same as those defined in Equations (16) and (17).
X V e h i c l e = V x A c c e p t e d A x A c c e p t e d J x A c c e p t e d V y A c c e p t e d A y A c c e p t e d                                                                                         J y A c c e p t e d ψ ˙ A c c e p t e d ψ ¨ A c c e p t e d ϕ A c c e p t e d ϕ ˙ A c c e p t e d T                         = min V x A c c e p t e d       ~ n ( μ min V x A c c e p t e d , σ min V x A c c e p t e d 2 ) SD V x A c c e p t e d       ~ n ( μ SD V x A c c e p t e d , σ SD V x A c c e p t e d 2 ) min ϕ ˙ A c c e p t e d       ~ n ( μ min ϕ ˙ A c c e p t e d , σ min ϕ ˙ A c c e p t e d 2 ) SD ϕ ˙ A c c e p t e d       ~ n ( μ SD ϕ ˙ A c c e p t e d , σ SD ϕ ˙ A c c e p t e d 2 )
Y V e h i c l e = V x Rejected A x Rejected J x Rejected V y Rejected A y Rejected                                                                                         J y Rejected ψ · Rejected ψ ¨ Rejected ϕ Rejected ϕ · Rejected T                         = min V x Rejected       ~ n ( μ min V x Rejected , σ min V x Rejected 2 ) SD V x Rejected       ~ n ( μ SD V x Rejected , σ SD V x Rejected 2 ) min ϕ · Rejected       ~ n ( μ min ϕ · Rejected , σ min ϕ · Rejected 2 ) SD ϕ · Rejected       ~ n ( μ SD ϕ · Rejected , σ SD ϕ · Rejected 2 )
Similar to those for the control commands, the parameter results for the vehicle behaviors are presented in Table 3. As seen in the results, only five parameters of longitudinal velocity ( V x ) and longitudinal accelerations ( V · x ) met the significance test criterion. On the other hand, 16 parameters, associated with longitudinal acceleration ( V · x ), longitudinal jerk ( V ¨ x ), yaw angular velocity ( ψ · ), roll angular motion ( ϕ ), and roll angular velocity ( ϕ · ), met the acceptance sensitivity criterion. Longitudinal acceleration parameters ( V · x ) met the criteria for both the significance test and sensitivity analysis. It is inferred that the parameters for longitudinal acceleration are important parameters for the evaluation of acceptance. Moreover, no parameters related to lateral motion, i.e., lateral velocity, lateral acceleration, and lateral jerk, met the criteria of the significance test and sensitivity analysis. Therefore, it can be stated that longitudinal behaviors are more sensitive to lane change events than lateral dynamic behaviors, although it is generally believed that lateral dynamic behaviors are dominant in a driver’s acceptance of lane change situations.

5.1.4. Acceptance in Relation to Traffic

According to the surrounding vehicles defined in Section 5.1.1, the parameters concerning acceptance were analyzed for their statistical significances and acceptance sensitivities with respect to subjective acceptance. The subjected parameter sets are defined by Equations (18) and (19) for each target vehicle.
X Target   A , B , C = T T C A , B , C A c c e p t e d T T C x A , B , C A c c e p t e d T T C y A , B , C A c c e p t e d r e l V A , B , C A c c e p t e d r e l V x A , B , C A c c e p t e d                                                                                                                                   r e l V y A , B , C A c c e p t e d D A , B , C A c c e p t e d D x A , B , C A c c e p t e d D y A , B , C A c c e p t e d T                                 = min T T C A , B , C A c c e p t e d       ~ n ( μ min T T C A , B , C A c c e p t e d , σ min T T C A , B , C A c c e p t e d 2 ) SD T T C A , B , C A c c e p t e d       ~ n ( μ SD T T C A , B , C A c c e p t e d , σ SD T T C A , B , C A c c e p t e d 2 ) min D y A , B , C A c c e p t e d       ~ n ( μ min D y A , B , C A c c e p t e d , σ min D y A , B , C A c c e p t e d 2 ) SD D y A , B , C A c c e p t e d       ~ n ( μ SD D y A , B , C A c c e p t e d , σ SD D y A , B , C A c c e p t e d 2 )
Y Target   A , B , C = T T C A , B , C Rejected T T C x A , B , C Rejected T T C y A , B , C Rejected r e l V A , B , C Rejected r e l V x A , B , C Rejected                                                                                                                                   r e l V y A , B , C Rejected D A , B , C Rejected D x A , B , C Rejected D y A , B , C Rejected T                                 = min T T C A , B , C Rejected       ~ n ( μ min T T C A , B , C Rejected , σ min T T C A , B , C Rejected 2 ) SD T T C A , B , C Rejected       ~ n ( μ SD T T C A , B , C Rejected , σ SD T T C A , B , C Rejected 2 ) min D y A , B , C Rejected       ~ n ( μ min D y A , B , C Rejected , σ min D y A , B , C Rejected 2 ) SD D y A , B , C Rejected       ~ n ( μ SD D y A , B , C Rejected , σ S D D y A , B , C Rejected 2 )
Table 4 presents the selected parameters and their significance levels and sensitivities. As seen in the results, only two parameters met the statistical significance test criterion for the leading vehicle in the active lane, Target A. On the other hand, 19 parameters for all the surrounding vehicles met the acceptance sensitivity criterion.
In the results of the surrounding vehicles for the lane change parameter, statistical significance was observed only for the leading vehicle in the active lane (Target A), while all of the surrounding vehicles (Target A, Target B, and Target C) were similarly sensitive to driver acceptance based on the acceptance sensitivity analysis. For all the surrounding vehicles, both time to collision (TTC) and the relative velocity (relV) were meaningful factors considering driver acceptance. On the other hand, no significant and sensitive parameters were found as related to the distance of the surrounding vehicles. It can be concluded that the role of parameters related to distances is already included in the time to collision (TTC). Additionally, few historical values were observed in either analysis, including the lateral time to collision (TTCy) for Target A in the significant test, the longitudinal time to collision (TTCx) for Target B, and the lateral time to collision (TTCy) for Target C in the sensitivity analysis.
Table 4. Comparison of the parameter selection results between the significance test and acceptance sensitivity analysis regarding vehicle relationships.
ParameterUnitDescriptive StatisticsSignificance Test (1)Acceptance Sensitivity
(%)
AcceptedRejected
E[X]Var[X]E[Y]Var[Y]tp-Value
A T T C x maximums0.269172.5980.752943.8300.0680.946179.044
T T C y minimums−0.01110.888−1.2452.103−1.1550.25611,743.861
standard deviations0.1781.0080.7430.7112.383 *0.023317.775
r e l V x meanm/s−3.27136.8880.6196.7322.026 *0.04881.076
r e l V y maximumm/s0.1410.7170.4253.9780.8500.399201.364
meanm/s−0.0290.9250.0662.5910.3350.739126.919
B T T C maximums9.012524.50921.989523.1511.5180.135143.988
standard deviations1.29228.7894.22926.0361.5620.125227.424
T T C x minimums−1.27091.6033.86940.2501.4120.164204.690
maximums2.820309.38910.483167.2181.2270.226271.747
medians0.07593.0494.96453.7691.3360.1886535.908
means0.174105.8595.52264.7511.3960.1693069.538
r e l V x maximumm/s−0.2445.8611.63318.2801.4580.151570.526
r e l V y maximumm/s0.01537.588−0.2250.933−0.4170.6791362.499
C T T C x minimums−0.367196.754−5.0561369.453−0.4100.6841279.101
medians4.123153.34420.9821271.4831.4410.156408.877
T T C y minimums−2.70123.580−9.611127.935−1.4220.164255.864
medians−1.88121.257−5.473110.934−0.8650.392190.902
means−0.09712.920−3.11860.352−0.7940.4323119.044
standard deviations1.8673.1874.41920.2751.2770.210136.632
(1) Level of significance: p < 0.05 *, light grey is for those selected by one method, dark grey is for those selected by two methods.

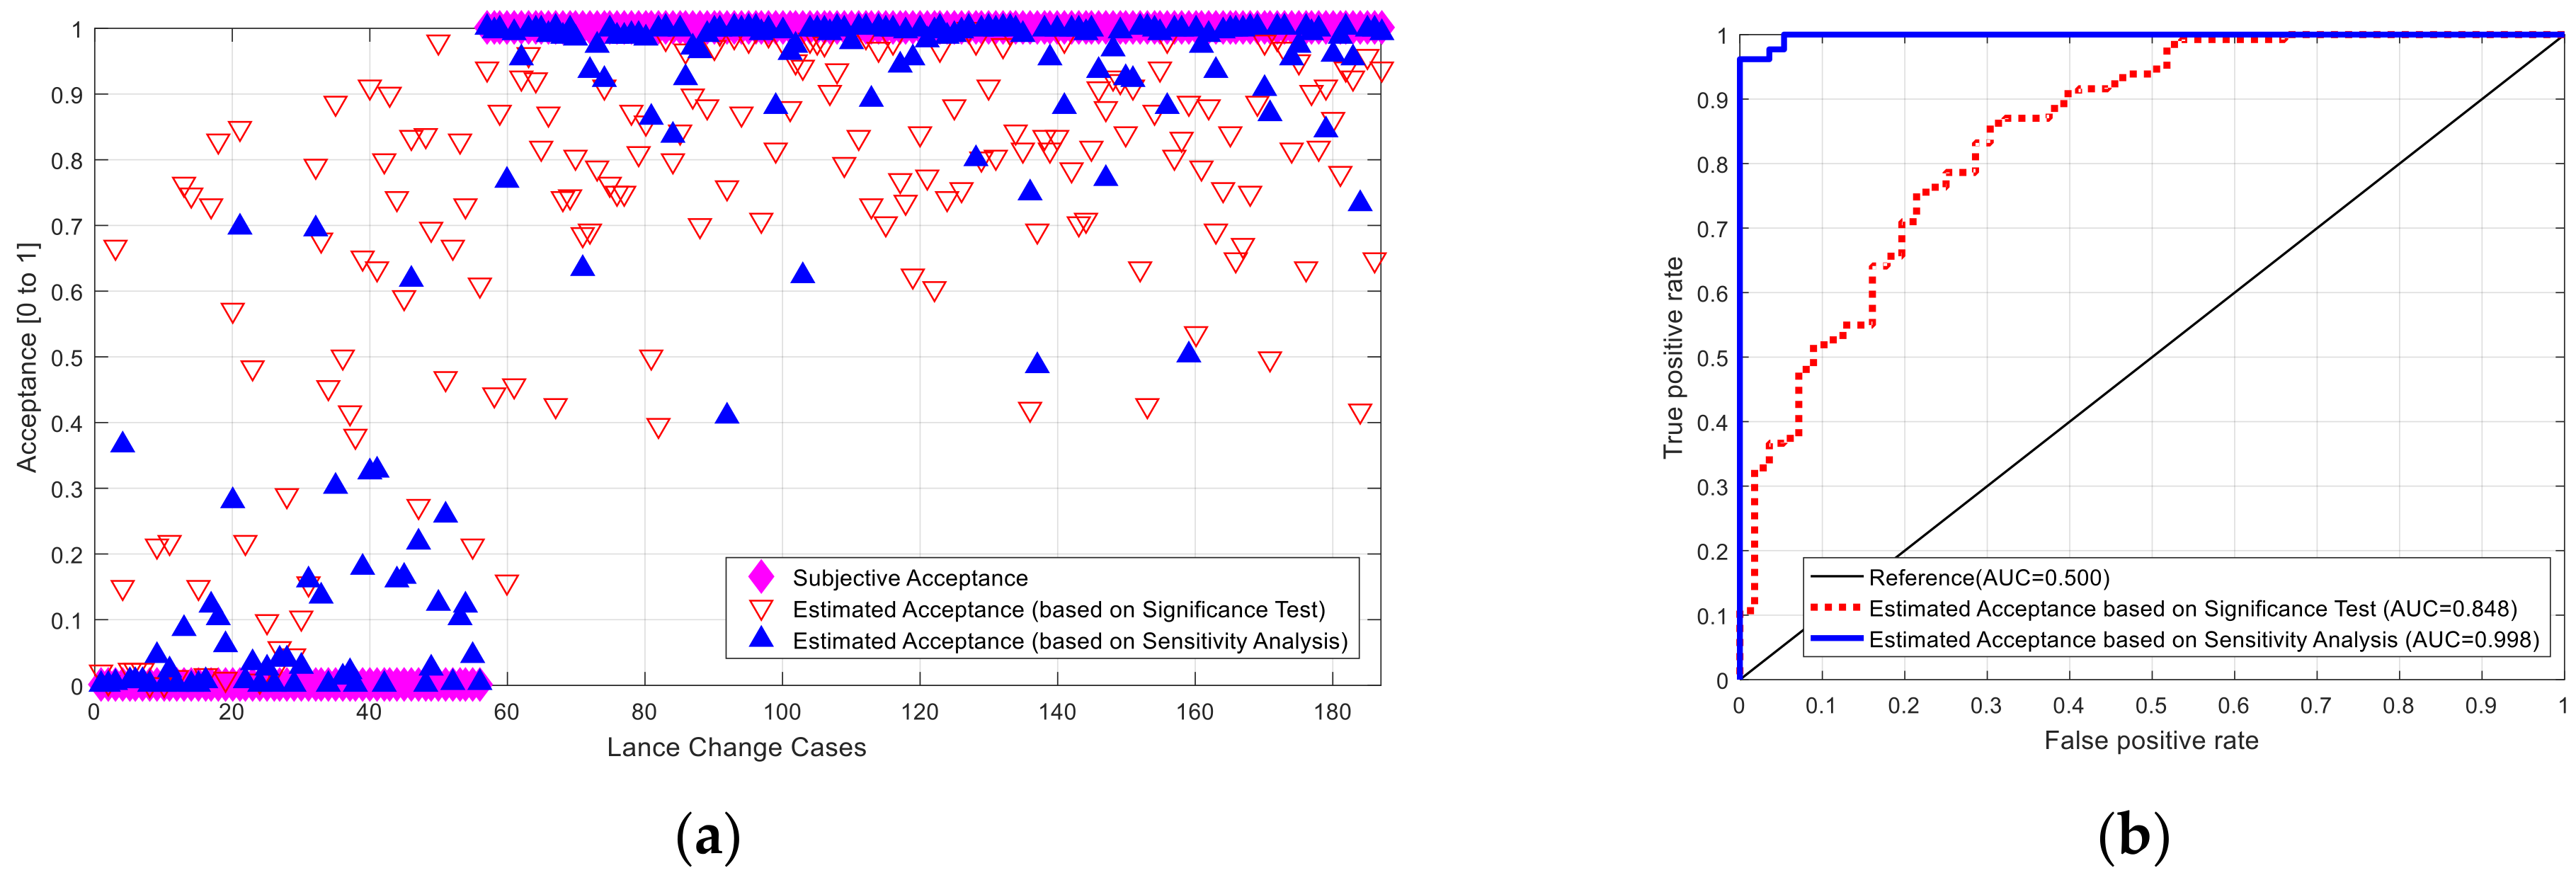
5.2. Modeling of Driver Acceptance

In this section, two driver acceptance models using two different parameter selection methods are presented: the statistical significance test and the suggested acceptance sensitivity. To derive the models, a specific set of data was considered: classified as driven by expert drivers, performing lane changes only as commanded, and lane changes with traffic. The formulations of the models are defined in Equation (5) in Section 4.2. The vectors of the p input variable x T and the p unknown parameters β T are also the same as those expressed in Equations (4) and (7), respectively.
From the results of the parameter selection study, the two different input variable vectors are presented in Table 2 and Table 3 in Section 5.1; as a result, 11 input variables and their coefficients were used for one model based on their statistical significances, and 38 input variables and their coefficients were used for the other model based on the results of the acceptance sensitivity analysis, which is the suggested method in this study.
Then, the vectors of their coefficients ( β T ) were designed by the maximum log-likelihood method described in Section 4.2 [27,28].
Table 5 presents the modeling results of the driver acceptance evaluation models using the different parameter selection methods, the two different sets of the input variables derived by the statistical significance test and the acceptance sensitivity, and their respective coefficient values. In addition, the effective ratios of the selected parameters for each method were analyzed using a Pareto chart as shown in Figure 4. It was observed that the parameters which were positioned higher had a greater impact on each parameter selection method. Specifically, the sensitivity analysis indicated that approximately 72% of the selected variables were from the top four parameters for the significance test, while the effective ratios of the top five parameters accounted for about 60% of the overall effect in the sensitivity analysis.
The performances of the two different models are compared in Figure 5, and the performance comparisons are summarized in several aforementioned indexes, as shown in Table 6. As seen in Figure 5a, the driver acceptance model using the acceptance sensitivity precisely estimated the driver’s acceptance. Considering the ROC curves in Figure 5b, the classification performance for the driver acceptance model using the suggested method showed a much better classification performance than that of the other driver acceptance model using the conventional method; the areas under the curves were 0.848 for the model using the statistical significance test method and 0.998 for the model using the acceptance sensitivity analysis method. Additionally, all the performance values of the model using the acceptance sensitivity analysis were much better than those of the other model in most of the performance indexes, as seen in the results: 0.256 vs. 0.064 for the standard error, 0.062 vs. 0.016 for the variance of the standard error, 23.905 vs. 3.822 for the sum of the squared error, 68.98% vs. 97.33% for the classification accuracy, and 0.848 vs. 0.998 for the area under the curve.
The estimation accuracy of the model using the statistical significance test between the rejected and accepted cases showed a considerable difference of about 22 percentage points: 53.57% for the rejected cases and 75.57% for the accepted cases. However, a smaller difference for the model using the acceptance sensitivity analysis with 94.64% for the rejected cases and 98.47% for the accepted cases was observed for the model using the acceptance sensitivity analysis. In those comparisons of the classification performance between the two different models, it was also observed that the driver acceptance model with the objective parameters selected by the suggested method was more robust for both the rejected events and the accepted events. The results showed that the classification accuracies for the rejected cases were generally worse than the accuracies for the accepted cases. This is due to the smaller size of the sample sets for estimating the sets of coefficients β T . Overall, the different pesrformance levels are based on the number of modeling parameters for each model. The estimation performance of the driver acceptance model could be improved by including a larger number of modeling parameters. This is because the model formulation is based on stochastic regression, which benefits from a more comprehensive set of parameters. However, even though a simple driver acceptance model with a smaller number of modeling parameters is desirable, it is not valuable if the estimation performance of the model with the smaller number of modeling parameters is insufficient. As seen in the results of the two different driver acceptance evaluation models, the driver acceptance model using the statistical significance test was insufficient to interpret the driver acceptance, meaning that the parameter selection method did not derive interpretable and important parameters well. However, the other driver acceptance evaluation model using the acceptance sensitivity analysis was interpretable for the acceptance, although the model had a comparably higher number of modeling parameters. Therefore, the parameter selection method of the acceptance sensitivity analysis can derive interpretable parameters, which are reasonably important to describe subjective driver acceptance.
Table 6. Performance comparisons of the driver acceptance models using the different parameter selection methods, the statistical significance test and the acceptance sensitivity analysis, for a specific data set classified as experts/commanded/with traffic.
Model ClassificationPerformance
Index
Rejected
(Sample Size: 56)
Accepted
(Sample Size: 131)
Total
(Sample Size: 187)
Driver Acceptance Model using
Statistical Significance
p-value
E[SE]0.4280.1830.256
Var[SE]0.1080.0250.062
SSE16.2677.63823.905
Accuracy
(number of correct)
53.57%
(30)
75.57%
(99)
68.98
(129)
AUC 0.848
Driver Acceptance Model using
Acceptance Sensitivity S Acceptance
E[SE]0.1070.0460.064
Var[SE]0.0280.0100.016
SSE2.2001.6223.822
Accuracy
(number of correct)
94.64%
(53)
98.47%
(129)
97.33
(182)
AUC 0.998

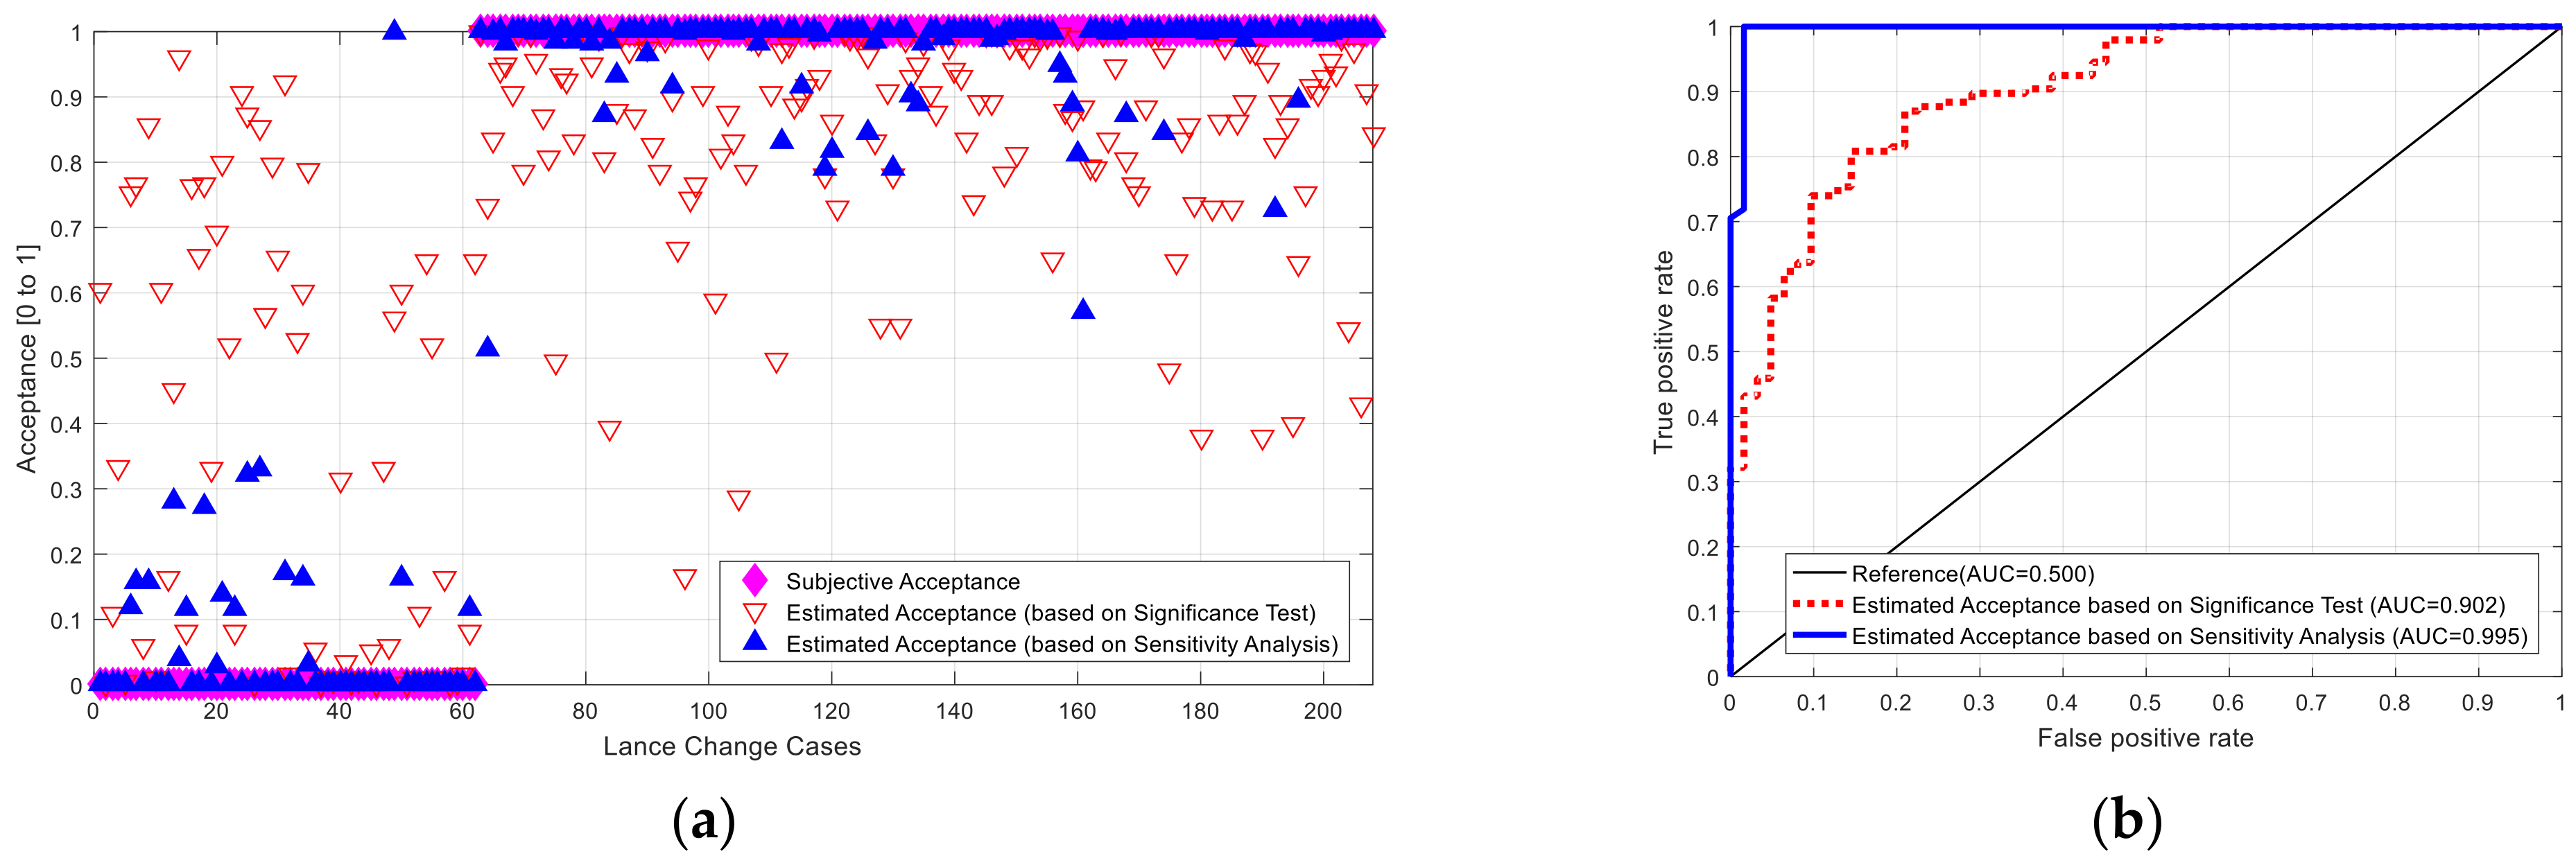
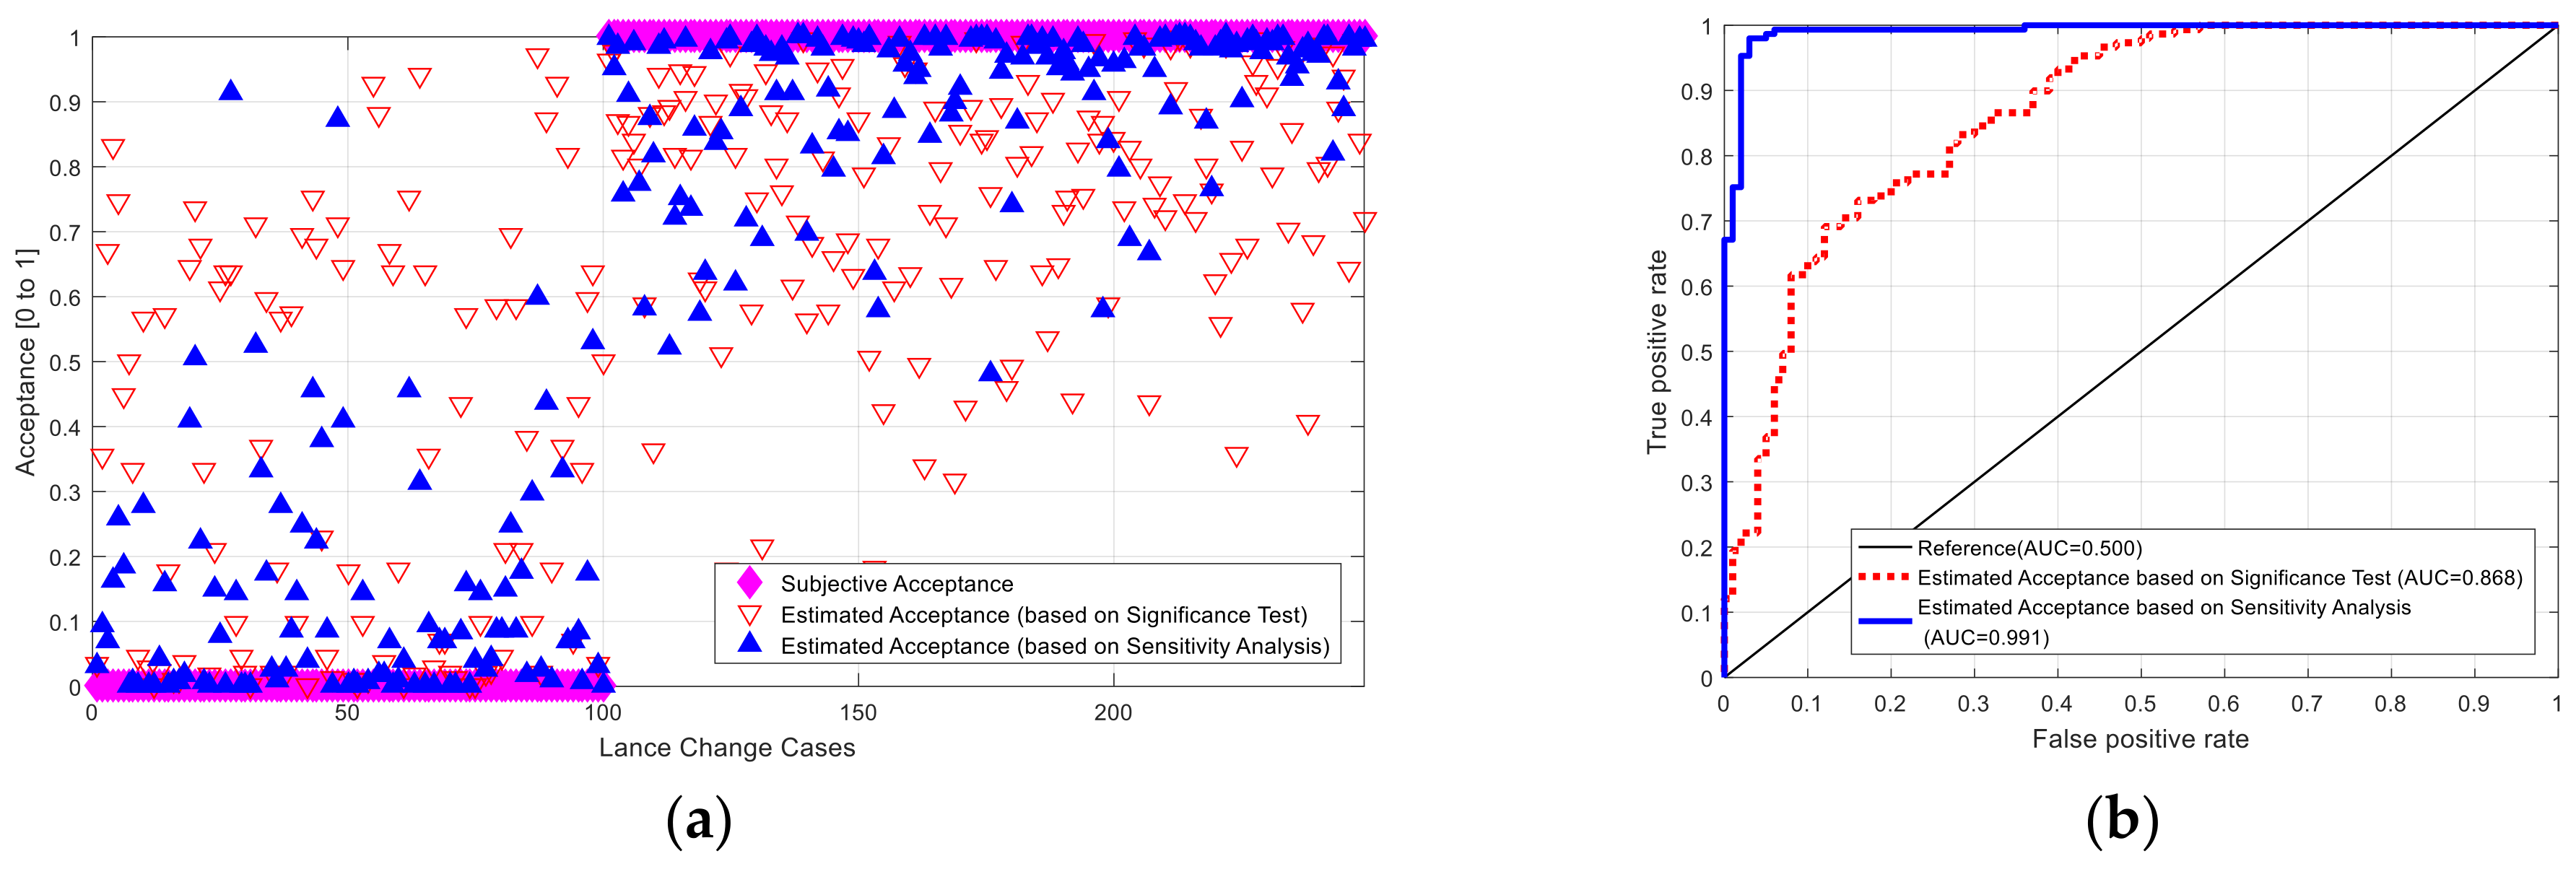
5.3. Verifications of the Suggested Model

To verify the driver acceptance models developed in Section 5.2, another data group consisting of self-decided lane changes was utilized and the suggested models were developed based on the data group with the as-commanded lane changes. For this validation study, both expert and novice drivers were used in the data group for the self-decided lane changes. Additionally, the performance of the driver acceptance models was compared between the two different parameter selection methods.
Referring to the target data groups designated above, Figure 6 and Figure 7 show the estimated results and ROC analysis of the two types of suggested models, respectively. Table 7 and Table 8 present a summary of the performances for each data set in several indexes.
As seen in Table 7 and Table 8, the model derived from the sensitivity analysis showed better performances compared with the other model in most indexes for both the experts and novices. The comparisons of the classification accuracy were as follows: 78.31% vs. 96.79% for the experts and 68.27% vs. 99.52% for the novices. The AUC comparison results were as follows: 0.868 vs. 0.991 for the experts and 0.902 vs. 0.995 for the novices.
In the results presented in this section, the same aspects shown in Section 5.2 were observed, i.e., that the driver acceptance model derived with the acceptance sensitivity analysis showed a better performance in most of the indexes. Moreover, it can be stated that the acceptance model with the sensitivity analysis showed much better performances in estimation accuracy. Meanwhile, both the acceptance evaluation models with the two different methods of parameter selection were satisfactory in estimating acceptance when considering the AUC.
Table 7. Performance comparisons of the driver acceptance models using the different parameter selection methods, the statistical significance test and the acceptance sensitivity analysis, for specific data sets classified as expert drivers/self-decided/with traffic.
Model ClassificationPerformance
Index
Rejected
(Sample Size: 100)
Accepted
(Sample Size: 149)
Total
(Sample Size: 249)
Driver Acceptance Model using
Statistical Significance
p-value
E[SE]0.3420.2300.275
Var[SE]0.0950.0350.062
SSE21.24213.02234.264
Accuracy
(number of correct)
61.00
(61)
89.93
(134)
78.31
(195)
AUC 0.868
Driver Acceptance Model using
Acceptance Sensitivity S Acceptance
E[SE]0.1340.0900.108
Var[SE]0.0340.0180.025
SSE5.1503.9109.059
Accuracy
(number of correct)
94.00
(94)
98.66
(147)
96.79
(241)
AUC 0.991
Table 8. Performance comparisons of the driver acceptance models using the different parameter selection methods, the statistical significance test and the acceptance sensitivity analysis, for specific data sets classified as novice drivers/self-decided/with traffic.
Model ClassificationPerformance
Index
Rejected
(Sample Size: 62)
Accepted
(Sample Size: 146)
Total
(Sample Size: 208)
Driver Acceptance Model using
Statistical Significance
p-value
E[SE]0.3570.1520.213
Var[SE]0.1120.0300.063
SSE14.8457.80322.648
Accuracy
(number of correct)
56.45%
(35)
73.29%
(107)
68.27%
(142)
AUC 0.902
Driver Acceptance Model using
Acceptance Sensitivity S Acceptance
E[SE]0.0600.0260.036
Var[SE]0.0220.0050.010
SSE1.5760.8372.413
Accuracy
(number of correct)
98.39%
(61)
100.00%
(146)
99.52%
(207)
AUC 0.995

6. Discussion

This paper proposed an objective evaluation method for passenger acceptance of an autonomous driving system using a stochastic estimation methodology. In this study, an automatic lane change system was the target system as one of the representative autonomous driving systems.
In this study, the selection methods for objective parameters related to acceptance were defined in two ways: via a significance test and sensitivity analysis. Additionally, an acceptance evaluation model was proposed to determine acceptance with respect to the previously derived objective parameters. Based on the suggested methods of parameter selection and modeling, two types of acceptance evaluation models were derived and then compared and validated.
The validations used other data groups not used for the modeling. In the results, the model derived from the sensitivity analysis showed better performances compared with the other model in most indexes; the accuracy comparisons were 78.31% vs. 96.79% for the experts and 68.27% vs. 99.52% for the novices; the AUC comparisons were 0.868 vs. 0.991 for the experts and 0.902 vs. 0.995 for the novices, respectively. While both acceptance evaluation models using the two different methods of parameter selection were satisfactory in estimating the acceptance when considering the AUC, the acceptance model with the sensitivity analysis showed much better performances in estimation accuracy.
The differences in the performances are based on the number of modeling parameters used for each one. The estimation performance must be higher for a driver acceptance model with a larger number of modeling parameters because the model formulation is based on stochastic regression. However, even though a simple driver acceptance model with a smaller number of modeling parameters is desirable, it has no value when the estimation performance of a model with a smaller number of modeling parameters is insufficient. As seen in the cases of the verification results for the two different driver acceptance models, the driver acceptance model using the statistical significance test was insufficient to interpret the driver acceptance because of the smaller number of modeling parameters, meaning that the parameter selection method did not derive interpretable and important parameters well. On the other hand, the other driver acceptance model using the acceptance sensitivity analysis was interpretable, although the model had a comparably higher number of modeling parameters. This aspect means that the parameter selection method of the acceptance sensitivity analysis can derive interpretable parameters, which are reasonably important to describe subjective driver acceptance. Nevertheless, there are remaining tasks to be addressed, including conducting further parameter analyses and studies to represent smaller parameter sets. Additionally, a validation study is needed to compare subjective human assessments with a real automatic lane change system in order to evaluate the suggested methods.
The results of this study contribute to the development process of autonomous driving systems in several features: the design targets can be clearly defined by the proposed parameter selection methods considering driver acceptance. The driver acceptance can be objectively assessed by estimating the probability of acceptance based on certain objective values. The development period can be substantially reduced, and the system may potential for modifications based on objective feedback during the development process. The modeling method of this proposed driver acceptance evaluation model is applicable to the development of a personalized autonomous driving system.

Funding

This research was funded by the Ministry of Trade, Industry & Energy (MOTIE, Republic of Korea), grant number 20014984.

Institutional Review Board Statement

Not applicable.

Informed Consent Statement

Informed consent was obtained from all subjects involved in the study.

Data Availability Statement

Data sharing is not applicable due to institute policy.

Conflicts of Interest

The author declares no conflict of interest.

References

  1. Neale, V.L.; Dingus, T.A.; Klauer, S.G.; Sudweeks, J.; Goodman, M. An overview of the 100-car naturalistic study and findings. In Proceedings of the 19th International Technical Conference Enhanced Safety Vehicles, Washington, DC, USA, 6–9 June 2005. [Google Scholar]
  2. Peden, M.; Scurfield, R.; Sleet, D.; Mohan, A.; Hyder, A.; Jrawan, E. World Report on Road Traffic Injury Prevention; World Health Organization: Geneva, Switzerland; World Bank: Geneva, Switzerland, 2004. [Google Scholar]
  3. Adell, E. Acceptance of driver support systems. In Proceedings of the European Conference on Human Centered Design for Intelligent Transport Systems, Berlin, Germany, 29–30 April 2010. [Google Scholar]
  4. Regan, M.; Mitsopoulos, E.; Haworth, N.; Young, K. Acceptability of in-Vehicle Intelligence Tranport Systems to Victorian Car Drivers; Monash University Accident Research Centre: Melbourne, Australia, 2002. [Google Scholar]
  5. Schade, J.; Baum, M. Reactance or acceptance? Reactions towards the introduction of road pricing. Transp. Res. Part A Policy Pract. 2007, 41, 41–48. [Google Scholar] [CrossRef]
  6. Van Der Laan, J.D.; Heino, A.; De Waard, D. A simple procedure for the assessment of acceptance of advanced transport telematics. Transp. Res. Part C Emerg. Technol. 1997, 5, 1–10. [Google Scholar]
  7. Venkatesh, V.; Morris, M.G. Why don’t men ever stop to ask for directions? Gender, social influence, and their role in technology acceptance and usage behavior. MIS Q. 2000, 24, 115–139. [Google Scholar] [CrossRef]
  8. Risser, R.; Lehner, U. Acceptability of speeds and speed limits to drivers and pedestrians. In Proceedings of the 9th International Conference on Road Safety in Europe, Bergisch Gladbach, Germany, 21–23 September 1998. [Google Scholar]
  9. Adell, E.; Varhelyi, A. Driver comprehension and acceptance of the active accelerator pedal after long-term use. Transp. Res. Part F Traffic Psychol. Behav. 2008, 11, 37–51. [Google Scholar] [CrossRef]
  10. Nishiwaki, Y.; Miyajima, C.; Kitaoka, N.; Terashima, R.; Wakita, T.; Takeda, K. Generating lane-change trajectories of individual drivers. In Proceedings of the IEEE International Conference on Vehicular Electronics and Safety, Columbus, OH, USA, 22–24 September 2008. [Google Scholar]
  11. Yao, W.; Zhao, H.; Bonnifait, P.; Zha, H. Lane change trajectory prediction by using recorded human driving data. In Proceedings of the IEEE Intelligent Vehicles Symposium (IV), Gold Coast, QLD, Australia, 23–26 June 2013. [Google Scholar]
  12. Butakov, V.A.; Ioannou, P. Personalized driver/vehicle lane change models for ADAS. IEEE Trans. Veh. Technol. 2015, 64, 4422–4431. [Google Scholar] [CrossRef]
  13. Gindele, T.; Brechtel, S.; Dillmann, R. Learning driver behavior models from traffic observations for decision making and planning. IEEE Intell. Transp. Syst. Mag. 2015, 7, 69–79. [Google Scholar] [CrossRef]
  14. Nobukawa, K.; Bao, S.; LeBlanc, D.J.; Zhao, D.; Peng, H.; Pan, C.S. Gap Acceptance During Lane Changes by Large-Truck Drivers—An Image-Based Analysis. IEEE Trans. Intell. Transp. Syst. 2016, 17, 772–781. [Google Scholar] [CrossRef] [PubMed]
  15. Chulwoo, M.; Youngseok, L.; Jeong, C.-H.; Seibum, C. Investigation of objective parameters for acceptance evaluation of automatic lane change system. Int. J. Automot. Technol. 2018, 19, 179–190. [Google Scholar]
  16. Najm, W.G.; Stearns, M.D.; Howarth, H.; Koopmann, J.; Hitz, J. Evaluation of an Automotive Rear-End Collision Avoidance System (Chapter 5); US Department of Transportation, National Highway Traffic Safety Administration; Report no. DOT HS 810 569; Research and Innovative Technology Administration, Volpe National Transportation Systems Centre: Cambridge, MA, USA, 2006. [Google Scholar]
  17. Van Driel, C. Driver Support in Congestion—An Assessment of User Needs and Impacts on Driver and Traffic Flow. Ph.D. Thesis, TRAIL Research School, Delft, The Netherlands, 2007. [Google Scholar]
  18. Risser, R.; Almqvist, S.; Ericsson, M. Fördjupade Analyser av Acceptansfrågor Kring Dynamisk Hastighetsanpassning; Bulletin 174; Lund University: Lund, Sweden, 1999. [Google Scholar]
  19. Nielsen, J. Usability Engineering; Academic Press: San Diego, CA, USA, 1993. [Google Scholar]
  20. Chismar, W.G.; Wiley-Patton, S. Does the Extended Technology Acceptance Model Apply to Physicians. In Proceedings of the 36th Hawaii International Conference on System Sciences (HICSS’03), Big Island, HI, USA, 6–9 January 2003. [Google Scholar]
  21. Dillon, A.; Morris, M. User acceptance of new information technology—Theories and models. Annu. Rev. Inf. Sci. Technol. 1996, 14, 3–32. [Google Scholar]
  22. Boff, K.R.; Kaufman, L.; Thomas, J.P. Handbook of Perception and Human Performance, Cognitive Processes and Performance; John Wiley: New York, NY, USA, 1986; Volume 2. [Google Scholar]
  23. De Warrd, D. The Measurement of Drivers’ Mental Workload. Ph.D. Thesis, University of Groningen, Traffic Research Centre, Haren, The Netherlands, 1996. [Google Scholar]
  24. Parasurman, R.; Davies, D.R. Varieties of Attention; Academic Press Series in Cognition and Perception; Academic Press: Cambridge, MA, USA, 1984. [Google Scholar]
  25. Damos, D.L. Multiple-Task Performance; Taylor & Francis: London, UK, 1991. [Google Scholar]
  26. Pregibon, D. Data analytic methods for matched case-control studies. Biometrics 1984, 40, 639–651. [Google Scholar] [CrossRef] [PubMed]
  27. Hosmer, D.W.; Lemeshow, S.; Sturdivant, R.X. Applied Logistic Regression, 3rd ed.; John Wiley Inc.: New York, NY, USA, 2013. [Google Scholar]
  28. Rao, C.R. Linear Statistical Inference and Its Application, 2nd ed.; Wiley Inc.: New York, NY, USA, 1973. [Google Scholar]
  29. Fawcett, T. An introduction to ROC analysis. Pattern Recognit. Lett. 2006, 27, 861–874. [Google Scholar] [CrossRef]
Figure 1. Overview of the constructed database, (a) distributions for individual participants, (b) ratios between commanded and self-decided cases, (c) ratios between accepted and rejected cases.
Applsci 13 09601 g001
Figure 2. A scheme of the evaluation methodology of driver acceptance considering an example of a single-variable stochastic estimation model for the evaluation of driver acceptance.
Applsci 13 09601 g002
Figure 3. Relative positions between the ego-vehicle and the target vehicles.
Applsci 13 09601 g003
Figure 4. Analysis of the effective ratios of the selected objective parameters: (a) the statistical significance test and (b) the acceptance sensitivity analysis.
Applsci 13 09601 g004
Figure 5. Comparisons of the estimation results for the observed true values between the driver acceptance models using the different parameter selection methods, the statistical significance test and the acceptance sensitivity analysis, for a specific set of data classified as experts/commanded/with traffic: (a) the estimated values for the subjective assessment and (b) the ROC curve.
Applsci 13 09601 g005
Figure 6. Comparisons of the estimation results for the observed true values between the driver acceptance models using the different parameter selection methods, the statistical significance test and the acceptance sensitivity analysis, for specific data sets classified as experts/self-decided: (a) the estimated values for the subjective assessment and (b) the ROC curve.
Applsci 13 09601 g006
Figure 7. Comparisons of the estimation results for the observed true values between the driver acceptance models using the different parameter selection methods, the statistical significance test and the acceptance sensitivity analysis, for specific data sets classified as novice/self-decided: (a) the estimated values for the subjective assessment and (b) the ROC curve.
Applsci 13 09601 g007
Table 2. Comparison of the parameter selection results between the significance test and acceptance sensitivity analysis regarding the control commands.
ParameterUnitDescriptive StatisticsSignificance Test (1)Acceptance Sensitivity
(%)
AcceptedRejected
E[X]Var[X]E[Y]Var[Y]tp-Value
T P S standard deviation%7.40030.4109.95414.0111.4970.14134.525
δ minimum°0.5351.8240.9941.9771.0200.31385.787
δ · median°/s0.0010.0000.0000.000−0.6140.54263.324
(1) for those selected by one method.
Table 3. Comparison of the results of selected parameters between the significance test and acceptance sensitivity analysis regarding the parameters associated with dynamic vehicle behaviors.
ParameterUnitDescriptive StatisticsSignificance Test (1)Acceptance Sensitivity
(%)
AcceptedRejected
E[X]Var[X]E[Y]Var[Y]tp-Value
V x minimumm/s28.28710.36725.63210.689−2.489 *0.0169.387
maximumm/s30.0289.87227.45410.492−2.465 *0.0178.574
medianm/s29.1389.61926.66711.711−2.356 *0.0238.478
meanm/s29.1489.75626.60611.144−2.428 *0.0198.723
V · x minimumm/s20.1640.057−0.1950.115−4.100 ***0.00018.831
maximumm/s20.5590.0680.3000.161−2.642 *0.01146.399
medianm/s20.3910.0600.0220.225−3.584 ***0.00194.391
meanm/s20.3840.054−0.0510.366−3.743 ***0.00086.642
standard deviationm/s20.1140.0050.1680.0042.439 *0.01847.525
V ¨ x minimumm/s3−0.4760.097−0.6880.122−2.0010.05144.520
maximumm/s30.5250.2280.6870.2381.0200.31330.748
medianm/s3−0.0010.008−0.0630.015−1.9480.05710,964.7
meanm/s30.0090.010−0.0540.017−1.8070.077492.66
standard deviationm/s30.0010.0000.0020.0001.5700.123207.065
ψ · minimum°/s0.0030.0000.0060.0001.2130.23192.947
median°/s0.0150.0000.0210.0001.4700.14846.190
mean°/s0.0150.0000.0210.0001.3650.17936.238
ϕ minimum°0.9762.0520.6030.844−0.8470.40138.249
standard deviation°0.4430.0650.6290.3671.5500.12842.135
ϕ · minimum°/s0.0030.0000.0010.000−0.7870.43546.556
(1) Level of significance: p < 0.05 *, p < 0.001 ***; light grey is for those selected by one method, dark grey is for those selected by two methods.
Table 5. Modeling results of the driver acceptance models using the two different parameter selection methods, the statistical significance test and the acceptance sensitivity analysis, for a specific data set classified as experts/commanded/with traffic.
Statistical Significance p-Value Acceptance   Sensitivity   S A c c e p t a n c e
Parameters   x Coefficients   β Parameters   x Coefficients   β
x 1 min V x β 1 −0.206 x 1 min T P S β 1 −0.013
x 2 max V x β 2 −0.839 x 2 min δ · β 2 −669.777
x 3 median V x β 3 −3.960 x 3 median δ · β 3 −2.214
x 4 mean V x β 4 5.243 x 4 max V · x β 4 −1.374
x 5 min V · x β 5 −7.263 x 5 median V · x β 5 14.199
x 6 max V · x β 6 5.274 x 6 mean V · x β 6 −3.881
x 7 median V · x β 7 5.189 x 7 SD V · x β 7 −20.073
x 8 mean V · x β 8 0.233 x 8 min V ¨ x β 8 0.148
x 9 SD V · x β 9 −19.741 x 9 max V ¨ x β 9 5.142
x 10 SD T T C y A β 10 0.103 x 10 median V ¨ x β 10 30.755
x 11 mean r e l V x A β 11 −0.142 x 11 mean V ¨ x β 11 −26.580
β 0 −6.663 x 12 min V ¨ y β 12 −1263.746
x 13 min ψ · β 13 −127.343
x 14 median ψ · β 14 −452.133
x 15 mean ψ · β 15 569.911
x 16 min ϕ β 16 1.046
x 17 SD ϕ β 17 −2.377
x 18 min ϕ · β 18 −148.541
x 19 max T T C x A β 19 −0.012
x 20 min T T C y A β 20 −0.179
x 21 SD T T C y A β 21 −0.730
x 22 mean r e l V x A β 22 −0.456
x 23 max r e l V y A β 23 −0.901
x 24 mean r e l V y A β 24 −0.103
x 25 max T T C B β 25 −0.174
x 26 SD T T C B β 26 0.707
x 27 min T T C x B β 27 −1.151
x 28 max T T C x B β 28 −0.156
x 29 median T T C x B β 29 1.085
x 30 mean T T C x B β 30 0.028
x 31 max r e l V x B β 31 −0.165
x 32 max r e l V y B β 32 0.604
x 33 min T T C x C β 33 0.188
x 34 median T T C x C β 34 −0.175
x 35 min T T C y C β 35 0.087
x 36 median T T C y C β 36 0.271
x 37 mean T T C y C β 37 −0.283
x 38 SD T T C y C β 38 0.139
β 0 309
Disclaimer/Publisher’s Note: The statements, opinions and data contained in all publications are solely those of the individual author(s) and contributor(s) and not of MDPI and/or the editor(s). MDPI and/or the editor(s) disclaim responsibility for any injury to people or property resulting from any ideas, methods, instructions or products referred to in the content.

