Abstract
Industrial waste in the form of abandoned mine tailings from a former lead plant in South Kazakhstan amounts to about 2 million tons, and this has led to environmental pollution with heavy metals (HMs) in Shymkent city. The concentrations of Pb, Zn, and Cd in the mine tailings were 1354.50, 262.90, and 61.08 mg/kg, respectively. The contamination of the adjacent soils with Pb, Zn, and Cd ranged from 7.76 to 551.49, from 8.25 to 245.74, and from 5.40 to 19.23 mg/kg, respectively. In this study, the phytoremediation properties of sweet potato on soils contaminated with HMs adjacent to mine tailings were investigated. The phytoremediation efficiency of sweet potato was assessed in terms of its capacity to biotransfer and bioaccumulate HMs. The concentrations of Pb, Zn, and Cd in sweet potato in the experimental fields were 28.70–45.10, 70.0–94.20, and 1.19–1.80 mg/kg, respectively. It was determined that the pollution class of the studied soils according to Igeo was high pollution (5.28–8.80), and the potential risk of HM accumulation according to the ecological risk index proposed by Hakanson was moderate pollution.
1. Introduction
The pollution of soil by heavy metals is a significant environmental problem all over the world. Active industrialization of the Republic of Kazakhstan in the last century was accompanied by intensive construction and operation of industrial enterprises and factories. As a consequence, there was significant pollution of the environment and growth of urbanization, with a subsequent increase in the concentrations of toxic metals. In particular, there were mine tailings from the industrial production of a lead factory located almost in the center of Shymkent city, which had operated for 70 years since 1937. These mine tailings were a source of HM pollution affecting the entire metropolis. The factory was abandoned between 2010 and 2015, and lead dust waste is still stored at the former factory site. Over 2 million tons of lead waste has accumulated over 70 years and poses a serious threat to residents living in the immediate vicinity [1].
Accumulation of certain amounts of HMs in the soil leads not only to its degradation [2], suppression of plant growth and development [3], and deterioration of its quality as a natural resource but also pollutes surface and groundwater through runoff and the vertical migration of water in the soil [4]. Unlike organic pollutants, heavy metals are not biodegradable and tend to accumulate in living organisms. Many heavy metal ions (salts) are hazardous or carcinogenic [5,6]. Major HM pollutants include cadmium (Cd), lead (Pb), copper (Cu), mercury (Hg), and arsenic (As), with densities exceeding 5 g/cm3 [7]. In particular, soils contaminated with lead (Pb) are difficult to remediate because of their low mobility, high toxicity, and high persistence [8]. HMs not only degrade the quality of the atmosphere, water, and agricultural crops [9] but also threaten the health of humans and fauna through the food chain [10,11]. HMs do not decompose, which means that they migrate from one place to another in the soil environment, causing a higher degree of pollution.
Given the wide range of dispersion of HM particles in the areas around abandoned industrial enterprises [12,13,14], it is necessary to carry out several stages of soil reclamation, including both technical treatment and biological reclamation [15]. One method of biological reclamation is phytoremediation. In this case, it is necessary to select plant species that have high phytoremediation activity and are able to grow in the recultivated soil [16].
Because of its high antioxidant activity, sweet potato (Ipomoea batatas L.) is a crop with wide ecological adaptation, drought tolerance, and high adaptability to harsh environmental conditions. In addition, it is considered a nutritionally valuable crop because it is rich in dietary fiber, potassium, minerals, and various antioxidants, including anthocyanins, carotenoids, vitamin C, and tocopherols [17,18]. Sweet potato has a high biomass ratio of both stem and tuber necessary for remediation [19]. Additionally, cultivation of sweet potato for the phytoremediation of lead-contaminated soils is possible with the subsequent production of biofuel [20].
Phytoremediation is considered to be the most environmentally friendly and economically feasible remediation technology for reducing the contamination of agricultural land. To evaluate potential ecological impact, the potential ecological risk and geoaccumulation indexes are used to assess the levels of HM concentrations in soil [21]. Fly ash from mine tailings increases HM concentrations in roots by increasing HM uptake and translocation from the root to the aerial part of the plants [22]. To evaluate the phytoremediation properties of plant species, it is also necessary to take into account the bioconcentration factor (BCF), which reflects the ability of plant parts to accumulate HMs, and the translocation factor, which reflects the movement of HMs from the root to the aerial part of the plants [23]. Determination of heavy metals in different samples is difficult due to the complex nature of the sample and the different chemical forms in which the metals can be found. Atomic absorption spectrometry with flame is a very precise, simple method to determine HM for single measurement of large samples [9,13,24,25].
This research attempted to determine the phytoremediation properties of sweet potato for the biological remediation of soils contaminated with HMs. It consists of a determination of the dynamics of HM distribution in the soil on the territory of the abandoned Shymkent lead factory and an experimental study of the phytoremediation properties of sweet potato grown on soils contaminated with HMs.
2. Materials and Methods
2.1. Site Description
The study concerned the mine tailings of the lead factory (42°18′51″ N 69°32′21″ E) and the adjacent area of Shymkent City, which has a population of over 1.1 million people [26].
The climate of the region is characterized by aridity, with a maximum annual precipitation of 600 mm in Shymkent, most of which falls in the autumn and winter (according to meteorological data from 2000 to 2022). The average annual temperature is 13 °C. The highest (47.2 °C) and lowest (−31.1 °C) temperatures were recorded in July and January, respectively. The main wind direction is east-northeast, with an average speed of 1.63 m/s per year and a maximum speed of 18 m/s [27,28].
The factory was founded in the 1940s and was originally located outside the city boundaries; however, because of the high rate of urbanization, a new district of the city was formed in 2022, and new residential buildings were constructed in the mine tailings area. Over 2 million tons of waste were generated in the form of mine tailings over the lifetime of the factory [1] (Figure 1). The factory produced mainly metallic zinc and lead.
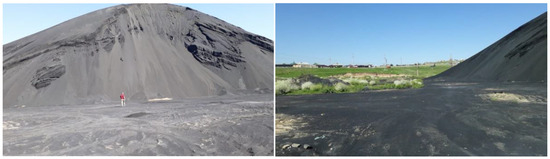
Figure 1.
Side view of the mine tailings of the Shymkent lead factory.
2.2. Cultivation Methods for Sweet Potatoes
Sweet potato plants were used in the experiment. Propagation and cultivation of the sweet potato were carried out using 25–30 cm long cuttings and planting them in a boat-shaped orientation relative to the ridges at a depth of 7–10 cm [29]. Cuttings from sweet potato plants were planted in the farmsteads of local residents at 10–15 plants per 30 cm ridge. The duration of the planting period was 133 days from May to September 2022. Samples were collected on day 133 to analyze the sweet potato components for their HM concentration.
2.3. Sampling Procedures
Experimental cultivation of sweet potatoes on the land adjacent to the mine tailings was carried out at the following coordinates: Field 1, 42°18’30.6” N 69°31’60.0” E; Field 2, 42°18’29.7” N 69°31’58.1” E; Field 3, 42°18’58.4” N 69°32’42.9” E; and the control, 42°21’15.7” N 69°36’43.5” E (Figure 2). Cuttings from sweet potato plants were planted by local households in 30 cm ridges of 10–15 plants each. The sweet potato crop was harvested.
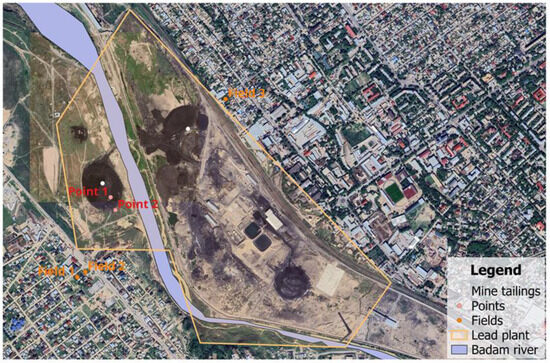
Figure 2.
Mine tailings sampling site.
Sweet potato samples were collected from the three experimental plots, and 1–2 g of the homogenized dried sample was weighed into a 50 mL quartz crucible. The sample was placed into a cool muffle furnace, and the temperature of the oven was raised to 500–550 °C for several hours. Next, the ash was dissolved in 25 mL of 1% nitric acid and diluted to 25 mL in a volumetric flask [30].
2.4. Soil Sampling
Soil samples were taken from the three fields of private farmsteads around the mine tailings in which sweet potato crops had been planted. Soil from the control plot on a private farmstead significantly distant from the contaminated site (42°21’15.7” N 69°36’43.5” E) was also sampled.
Soil samples were taken from one or more layers using the envelope sampling method (along the diagonal). Combined samples were created by mixing five point samples taken from one sample site. The point samples were taken layer by layer from depths of 5 and 15 cm, with the mass of each sample not exceeding 200 g. The mass of the combined sample was at least 1 kg.
The soil samples were collected and sieved. A quantity of 2 g of dried soil sample was transferred into a 100 mL Erlenmeyer flask, and concentrated nitric acid was added. Then, the sample was boiled in a water bath at 80 °C for 3 h. Next, it was cooled at room temperature, 25 mL water was added, and the resulting extract was filtered on filter paper into a 25 mL volumetric flask. These clear filtrate solutions were analyzed using an atomic absorption spectrometer [31].
2.5. Ecological Risk Assessment and Geoaccumulation Index (Contamination Assessment Methodology)
The potential environmental risk index was proposed by Hakanson [21]. This method simultaneously takes into account several factors: concentration of HMs in soil, type of pollutant, and toxicity level. It comprehensively estimates the potential impact of HMs on environmental systems. It is possible to estimate the risk presented by a single factor (environmental risk coefficient, Er) as well as the risk presented by a number of elements (potential environmental risk index, RI). The risk is calculated using the following equations [32]:
where Cf is the contamination factor, Csample is the concentration of HMs in polluted soil, mg∙kg−1, and Cbackground is the natural background concentration in the soil, mg∙kg−1;
where RI is the comprehensive potential ecological risk index, Er is the individual potential ecological risk index of HM, Tr is the toxicity coefficient of the HMs (Pb–5, Zn–1, Cd–30), and Cf is the pollution coefficient of the HMs.
Cf = Csample/Cbackground
Er = Tr × Cf
The value of RI indicates the type and quantity of the pollution. The classification criteria proposed by Hakanson [21] for the RIand Er values are shown in Table 1.

Table 1.
Interpretation of the value of the potential environmental risk indicator.
Geoaccumulation Index
The geoaccumulation index, Igeo, estimates the degree of soil contamination by heavy metals, and is calculated on the basis of the concentrations of the metal present in the soil, the geochemical background value of this metal, and a coefficient of 1.5 to take possible deviations into account [33,34]:
where Igeo is the geoaccumulation index of the HM, Cn is the concentration of the HM in the soil, Bn is the geochemical background value of the HM, and 1.5 is the deviation coefficient. The level of pollution is divided into 7 classes, ranging from no pollution to extremely high pollution:
Igeo = log2(Cn/1.5 × Bn)
Igeo ≤ 0, uncontaminated (Class 0);
0 < Igeo ≤ 1, uncontaminated to moderately contaminated (Class 1);
1 < Igeo ≤ 2, moderately contaminated (Class 2);
2 < Igeo ≤ 3, moderately to heavily contaminated (Class 3);
3 < Igeo ≤ 4, heavily contaminated (Class 4);
4 < Igeo ≤ 5, heavily to extremely contaminated (Class 5);
Igeo > 5, extremely contaminated (Class 6).
The bioconcentration factor was used to determine the phytoremediation properties of plants. According to this, if the index value of the factor is below 1, the plant is tolerant of HMs, and if it is above 1, it is a hyperaccumulator. The bioconcentration factor denotes the ability of the parts of the plant to elementally accumulate pollutants from the environment [35]:
where BCF is the bioconcentration factor, Cplant is the concentration of heavy metals present in the sweet potato, mg∙kg−1, and Csoil is the concentration of heavy metals in the soil, mg∙kg−1.
BCF = Cplant/Csoil
The translocation factor (TF) is the value of the metal concentration in the aerial part of the plant in relation to the concentration in the root of the plant. This value is used to estimate the ability of plants to transfer HMs to their aerial parts [35]:
TF = Caerial/Croots
2.6. Spatial Interpolation
The geo-ecological map based on actual data was constructed using Qgis 3.30.1. with the IDW (inverse distance weighting) method. IDW is one of the most commonly used deterministic interpolation algorithms in soil investigation, and it focuses on areas directly around the objects of study and given coordinate points. The inversion of width around the investigation objects from the interpolation point is used to determine the weighted particles of the assigned location of the conducted interpolation. Therefore, it is shaped in such a way that close points have a higher weighting (and, therefore, a greater influence) than distant points, and vice versa. The Qgis system is self-managed and does not require additional calculations during map creation [34,36].
2.7. Atomic Absorption Spectrometry
The calibration curves were prepared using lead (Pb), zinc (Zn), and cadmium (Cd) (Ecroskhim Co., Ltd., Moscow, Russia) with atomic absorption stock solutions (1.0 g/L) by making successive dilutions. A working calibration solution between 1 mg/L and 10 mg/L was prepared. For the preparation of the solutions, ultrapure water obtained from a Milli-Q system (Merck, Millipore) was used. All chemical reagents used were of standard analytical grade, including nitric acid (65%) and hydrogen peroxide (30%).
For validation of the analytical procedure, reference standard solutions were used, and the results should lay within ±1 of the certified values. The method was validated in terms of linearity and range of the calibration curves. Linearity was validated using reference standard solutions by repeating the process five times for each metal. The limit of detection (LOD) and limit of qualification (LOQ) values for each metal were calculated for each solution: 1 mg/L, 2 mg/L, 5 mg/L, and 10 mg/L concentrations for Pb, Zn, and Cd, respectively.
Pb, Zn, and Cd concentrations were determined using a flame atomic absorption spectrometer (Analytik Jena AG, novAA 350, Jena, Germany) equipped with a hollow cathode lamp and an air–acetylene flame. The wavelengths (nm) used for the determination of the analyses were Pb 283.3 nm, Zn 232.0 nm, and Cd 228.8 nm. The gas flow was 50 dm3/h, and the aspiration rate was 5 cm3/min. Single-element hollow cathode lamps (Hamamatsu Photonics K.K., Hamamatsu, Japan) of Pb, Zn, and Cd were used as light sources.
2.8. Scanning Electron Microscope
The surface morphology and topography of the mine tailings lead samples were observed using scanning electron microscopy with an energy dispersive spectrometer (SEM-EDS) (JSM-6510, JEOL/EO, Tokyo, Japan) at an accelerated voltage of 10 kV. The surface structural images were obtained using the high vacuum secondary electron detector of the microscope. Lead slag was fixed inside the instrument at a working distance of 7 mm (WD 7 mm), magnification value of 3000× (maximum), and spot size 50 (SS50).
2.9. Statistical Analysis
Pearson’s correlation coefficient was used to understand the HM concentration correlations. Principal component analysis (PCA) was used to determine the source of the HM in the soil and sweet potato plants. PCA was used to analyze the HM value after checking the suitability.
3. Results and Discussion
3.1. Validation of the Method
A quantitative analysis of the HM was carried out, and calibration curve equations were plotted between concentrations 1.0 and 100 mg/L. The calibration curves consisted of four concentrations. Table 2 shows correlation coefficients, calibration curve equations, ranges, LOD, and LOQ values for each HM. The correlation coefficients were more than 99%, confirming excellent response. The LOD value was between 0.06 mg/L and 0.10 mg/L, and the LOQ values varied between 0.18 mg/L and 0.31 mg/L, which showed that the method is sensitive.
Table 2.
LOD and LOQ values and linear parameters for the HM calibration standards.
Table 3 shows the mean recovery and standard deviation results using reference standard solution for each HM. Results for HM were in agreement at a 95% confidence level with the certified values for each metal. Mean recovery results were between 99.6 and 100.5% for all metals.
Table 3.
Reference standard certified and measured values and the recovery.
3.2. Soil Characterization
The mine tailings had high heavy metal concentrations of 1354.50 ± 2.26, 226.90 ± 1.61, and 61.08 ± 0.20 mg/kg for Pb, Zn, and Cd, respectively. At Point 1 (50 m from the mine tailings epicenter) in the top layer (5 cm) of soil close to the mine tailings, the highest concentrations of Pb, Zn, and Cd were 551.49 ± 1.91, 245.74 ± 0.49, and 19.23 ± 0.02 mg/kg, and at a depth of 15 cm they were 368.73 ± 0.40, 216.21 ± 0.37, and 11.91 ± 0.01 mg/kg, respectively (Figure 1). At Point 2 (200 m from the epicenter of the mine tailings), the concentrations of Pb, Zn, and Cd were 12.79 ± 0.03, 48.18 ± 0.08, and 14.28 ± 0.02 mg/kg in the upper layer and 7.76 ± 0.07, 8.25 ± 0.07, and 5.40 ± 0.04 mg/kg, respectively, in the lower layer. (Table 4). Our results were consistent with those of other researchers [1] in showing concentrations of 350.6, 54.3, and 11.8 mg/kg of Pb, Zn, and Cd, respectively, around 500 m from the mine tailings. Thus, the amount of Pb at Point 1 in the area adjacent to the factory was found to be 11.5 to 17 MPC. Zn concentration at Point 1 was 9 to 10 MPC. Cd concentrations were the highest at all sampled points in the mine tailings area at 2.5 to 20 MPC.
Table 4.
HM concentration of soil samples from mine tailing slag at different depths (5 and 15 cm).
HM concentrations in polluted soils exceeding the MPC were determined according to the regulations. MPC values (mg/kg) for HMs were 32.0 for Pb, 23.0 for Zn, and 2.0 for Cd [37].
The territories adjacent to Shymkent City are characterized by ordinary greyzem [38]. These are soils with a low-moisture, low-humus surface, an arid moisture regime, and the absence of permafrost within 200 cm of the surface [39]. As these are alkaline soils, with a pH of 7.5–8 and absolute dominance of oxidative processes, they do not have a high capacity to accumulate Pb, Zn, or Cd directly, but Pb processing wastes, as shown in Figure 2, have contaminated the area for more than 70 years. [1]. In Figure 3, the distribution of Pb, Zn, and Cd is illustrated using color interpolation. The areas of distribution of certain HM concentrations are highlighted by isolines and displayed at the scale of the sampling points and the adjacent mine tailings territory.
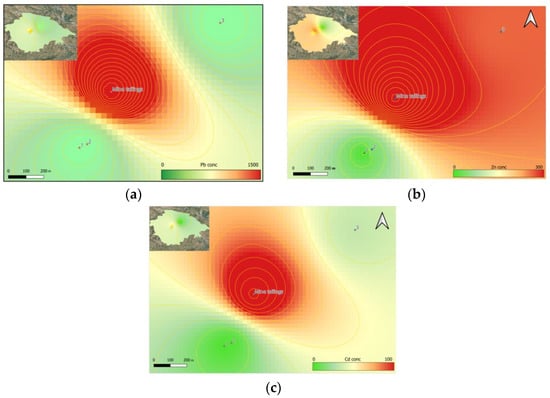
Figure 3.
Spatial distribution map of heavy metals: (a) Pb, (b) Zn, and (c) Cd.
3.3. SEM Analyses
SEM produced two-dimensional data, which allowed visual identification of metal slag particle surfaces without sputter coating. According to the results of SEM-EDS analysis, the slag from mine tailings mainly contained SiO2 (22.2%), oxides (46%), and carbon (17.8%), in addition to Zn (9.08%) and Pb (4.22%), as shown in Figure 4c. Figure 4a,b show SEM images at 400× and 3000× magnification, respectively.
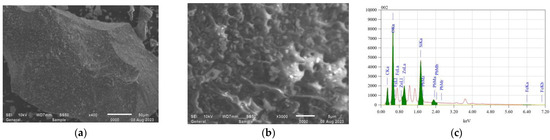
Figure 4.
SEM analysis of metals in slag from the lead factory: (a) the magnified image is 400 times larger, (b) 3000 times larger, (c) structural analysis of lead slag.
An atomic absorption spectrometer was used to estimate the distribution of heavy metal concentration at each site. The average Pb concentration of the soil samples from the three experimental (Fields 1, 2, and 3) and control sites were 4.94 ± 0.07, 2.72 ± 0.03, 5.34 ± 0.06, and 2.20 ± 0.03 mg/kg, respectively (Table 5). These data showed that Pb concentrations were different at the three sites and varied by as much as 51%. The mean Zn concentrations at the sites were 3.87 ± 0.02, 24.63 ± 0.02, 109.69 ± 0.03, and 3.70 ± 0.03 mg/kg, respectively. Zn concentrations were very different at the three sites. In addition, the Cd concentrations were 4.04 ± 0.01, 5.97 ± 0.04, 14.56 ± 0.04, and 3.18 ± 0.01 mg/kg, respectively (Table 5).
Table 5.
HM concentrations of mine tailings, soils, and sweet potatoes.
3.4. Heavy Metal Concentration in Sweet Potato Samples
The concentrations of Pb, Zn, and Cd in the sweet potato samples are presented in Table 5, which shows that the HM concentrations of tubers and leaves differed significantly. The HM concentrations were significantly higher in the sweet potato samples than in the control samples. The highest HM concentrations were found in Field 3, in which the Pb, Zn, and Cd concentrations in tubers were 34.0 ± 0.03, 94.2 ± 0.07, and 1.19 ± 0.03 mg/kg and in leaves were 32.5 ± 0.09, 59.4 ± 0.01, and 2.75 ± 0.01, respectively. Furthermore, in the experimental sites Field 1 and Field 2, the Pb, Zn, and Cd concentrations in tubers varied from 28.7 ± 0.07 to 45.1 ± 0.09, 70.0 ± 0.05 to 94.1 ± 0.09, and 0 to 1.80 ± 0.02 mg/kg, respectively. At the control site, the tubers showed 0.96 (Pb), 38.5 (Zn), and Cd was not detected. Thus, in the control samples, the Pb and Zn values were 31 and 2.14 times lower.
The concentrations of Pb, Zn, and Cd in leaves from Field 3 showed very high values of 32.5 ± 0.09, 59.4 ± 0.01, and 2.75 ± 0.01 mg/kg, respectively. Cd was detected in the sweet potatoes grown at the Field 3 experimental site. Pb concentrations in Field 1 and Field 2 were 2.34 ± 0.06 and 10.1 ± 0.07 mg/kg, respectively, whereas at the control site, it was 1.09 ± 0.02 mg/kg. Additionally, Zn concentrations in Field 1 and Field 2 were 8.24 ± 0.06 and 14.1 ± 0.01 mg/kg, respectively, whereas the control sample measured 7.6 ± 0.01 mg/kg. According to the results in Table 5, Pb concentration was highest in mine tailings and lower in soil and sweet potatoes. However, Zn concentrations were lower in lead slag samples but showed higher concentrations in soil and sweet potatoes than other HMs. Different behaviors were reported for Zn concentration. For example, high Zn concentration accumulated in control and contaminated sites [40]. HM (Pb, Zn, Cd, Cu) in soil samples transferred in grains, but Zn concentration was not predicted by total HM in soil [41]. The results of other researchers highlighted different absorption levels of HM, where sweet potatoes cultivated from contaminated mine tailings soils and sweet potato cultivars influenced accumulation properties [42].
According to data presented by other researchers involving 14 sweet potato varieties, the tendency for Cd and Pb to accumulate in tubers was consistently proved, but a lower index was indicated in shoots and roots [43]. Pb accumulation in roots was found to be characteristic of rapeseed (Brassica napus), mustard (Brassica carinata) [44], red amaranth (Amaranthus gangeticus) [45], and water spinach (Ipomoea aquatica Forsk) [46]. Maize (Zea mays L.) accumulated Cd in its leaves [47], and lettuce was characterized by Cd accumulation in its roots [48]. Other studies considered Zn accumulation. Compared with these results, low concentrations of Zn were found in radish [49]. On the other hand, high concentrations were reported for leek, paddy rice (Oryza sativa L.) [50], and maize [47].
According to our data, there was a clear trend of HM accumulation in tubers (Table 5). Such stability and accumulation of HMs in the plant root system were characteristic of some hyperaccumulator ecotypes [51], in which HMs were predominantly accumulated in the plant roots or root walls [52]. It was proved that in T. caerulescens, the main part of Cd was stored in the root apoplast [53], and other studies showed that Cd retention after root uptake occurred in the root cell walls [54]. Pb also accumulated in the root walls or in the vacuole [55]. The accumulation of pollutants in separate parts of the plant cell is referred to as compartmentalization, and its purpose is to move HMs into vacuoles, trichomes, and hydropotes in order to prevent cellular destruction [56].
3.5. Heavy Metal Accumulation and Ecological Risk Assessment
The contamination factor, geoaccumulation index, and environmental risk for Pb, Zn, and Cd are presented in Table 6. According to the contamination coefficients [21] for the soils containing Pb, higher figures were noted for samples taken at a depth of 5 cm, with six samples being characterized by a low level of contamination, and the only samples shown as moderately contaminated were those taken from a depth of 5 cm for Point 1 (which was on the leeward side) and Field 3 (the closest site to the mine tailings). The results for Cd contamination showed a similar trend, with the samples from the fields characterized by moderate contamination. For Zn, there was a significant degree of contamination in the field samples and a predominance of moderate contamination among the other soil samples.
Table 6.
HM concentrations of mine tailings, soils, and sweet potatoes.
The geoaccumulation index proposed by Muller [33] was used to identify and determine the metal contamination of soil. The HM geoaccumulation factor indicated high levels for all metals at all sampling points. The highest index was 11.32 units for Zn in Field 3 at a depth of 5 cm and was characterized as extreme Zn contamination. This was also seen in the other soil samples with values of 3.2 and 2.26 (as shown in Table 7), which are higher than those identified by other authors [57,58]. Extreme Pb contamination was noted in Fields 1 and 3, for which the indices were 5.26 and 7.32, respectively, also higher concentrations than those reported by other authors [58,59,60]. Excessive concentrations of Cd were also found in Field 3. The environmental risk values associated with Pb and Zn showed a low level of risk. However, the values for Cd in Field 3 were described as a moderate level of risk, consistent with the findings of other researchers [24,61].
Table 7.
Comparison of the ecological assessment in soil samples with other studies from industry sites.
3.6. Bioconcentration and Translocation Factors
The bioconcentration factor is one of the main indicators of the phytoremediation efficiency of a plant; it is an indicator of the ability of the plant to accumulate HMs from the soil [62]. Table 8 provides the BCF calculation results for sweet potato grown in three contaminated fields. The sweet potato tuber BCFs for Zn in Fields 1, 2, and 3 were 18.08, 35.77, and 0.85, respectively. This correlated with the results for the leaf BCF, which were 12.18, 17.72, and 1.34, respectively. A lower absorption of Zn was observed for Field 3 and higher for Fields 1 and 2. Brown rice used as a food plant in South Korea showed a low BCF [63], but plants such as Corchorus olitorius and Solanum nigrum had a Zn BCF greater than 1 [64]. BCF and TF also depended on sweet potato varieties, where authors showed the effectiveness of phytoremediation properties of sweet potatoes lead removal efficiencies by kg/ha. Also, the process has been accelerated with the addition of fertilizer to obtain more yields, correspondingly more accumulation of HM. HM accumulation and transfer mechanisms at the whole plant level in these plants depend on several processes: tuber metal uptake, translocation between roots and aerial parts, transport to deciduous organs or less active tissues or cell types, and transfer to seeds [44].
Table 8.
Bioconcentration and translocation factors in sweet potato.
The BCFs for Cd were 0.3 and 0.08 for Fields 2 and 3, respectively. These values indicated low HM accumulation. However, there was a clear correlation between the decrease in the BCF and the increase in the TIF of the plant. There were high values for Cd in the leaves compared with the tuber, with a TF of 2.31 indicating active movement of metal ions in the plant, and similar dynamics were observed in four species of Brassica [44]. The opposite dynamic was observed in a study of Virginia fanpetals [65].
Pb values for Fields 1, 2, and 3 were 10.5, 9.12, and 6.36, and for leaves 1.7, 4.22, and 6.01, respectively. Previous studies by Dinçer et al. concerning Carthamus tinctorius L. [66] and Parthenium hysterophorus [25] observed the same correlation between Pb concentration in soil, BCF, and TF.
The ability of sweet potato to accumulate metals was as follows: Zn > Pb > Cd. With the exception of Cd with BCF < 1, this indicator was >1 for Zn and Pb, from which we can conclude that sweet potato has great potential for use in phytoremediation.
3.7. Correlation and Principal Component Analysis
Pearson’s correlation analysis of soil heavy metals (Table 9) showed statistically significant strong positive correlations >0.90 between Pb at 5 cm and 15 cm, Zn at 5 cm and 15 cm, and Cd at 5 cm and 15 cm. A strong correlation was observed between metals at different depths. However, the variation in the heavy metal concentrations in the investigated soil samples was correlated in each field. There were also strong correlations between Zn (5 and 15 cm), Pb (5 and 15 cm), and Cd (5 and 15 cm), with the correlation coefficients ranging from 0.78 to 0.85.
Table 9.
Pearson’s correlation coefficient (r) between HMs in soil.
Pearson’s correlation analysis of the different parts of the sweet potato plants is shown in Table 10. There were significant positive correlations between the Pb (tuber) and Zn (tuber) at 0.95, Pb (tuber) and Cd (tuber) at 0.79, Zn (tuber) and Cd (tuber) at 0.83, Zn (leaves) and Cd (leaves) at 0.99, Pb (leaves) and Cd (leaves) at 0.96, and Pb (leaves) and Cd (leaves) at 0.98. Strong correlations between the different parts of the sweet potato plants were noted.
Table 10.
Pearson’s correlation coefficient (r) between parts of sweet potato plants.
In our research, PCA was used to conduct a multidimensional analysis of the influence of the concentration of heavy metals as dependent variables. In Figure 5, PCA explained 98.46% of the total variation, with p1 for 90.71% and p2 for 7.75%. The PCA plot revealed several groups, with six dependent variables distinguishing each group. Point 1 and Field 3 soils were close together because of their higher Zn concentration. The control, Point 2, and Fields 1 and 2 had lower concentrations of HMs. The mine tailings sample was dependent on higher concentrations of Pb and Cd. In the PCA results in Figure 5, the scores for the sweet potato tubers were mainly related to higher concentrations of metals. The results indicated that factors extracted 50.97% from the soils and 49.88% from the sweet potatoes of the total variances. In addition, the loadings showed that Pb (5 cm), Pb (15 cm), Pb (leaves), Zn (leaves), and Cd (leaves) were higher, at 96%, 96%, 92%, 97%, and 99%, respectively.
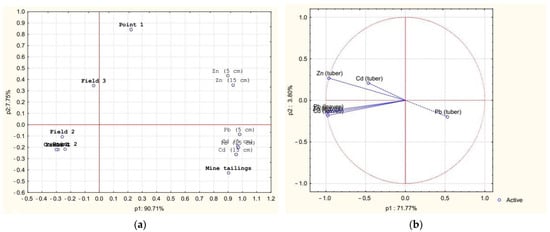
Figure 5.
Principal component analysis for HM concentrations: (a) PCA loading plot of HM biplot; (b) loading plot of HM in sweet potatoes.
4. Conclusions
The mine tailings of the former lead factory in Shymkent City represent a serious threat to the surrounding urban environment. In our study, it was determined that soils from adjacent territories were heavily polluted with HMs, with Pb, Zn, and Cd concentrations of 7.76–551.49, 8.25–245.74, and 5.40–19.23 mg/kg, respectively, whereas at the control site (in the city area), the concentrations of Pb, Zn, and Cd were 2.20, 3.70, and 3.18 mg/kg, respectively.
It was found that sweet potato plants accumulated HMs in their aerial and root parts. According to the data obtained, concentrations in the roots (tubers) were higher than those in the aerial parts (leaves). In addition, Pb and Zn concentrations in plants were high, whereas Cd was found only in tubers from Field 3.
According to the contamination coefficients obtained for HM concentrations, the soil in the experimental plots was moderately contaminated. It was found that sweet potato is a hyperaccumulative plant for two heavy metals, Pb and Zn.
Author Contributions
Conceptualization, K.Z. (Kabyl Zhambakin) and M.S.; methodology, M.T. and Z.A.; formal analysis, M.T., Z.A., R.K. and Z.S. (Zukhra Stamgaliyeva); investigation, D.D., K.Z. (Kuanysh Zhapar) and A.D.; resources, Z.S. (Zagipa Sapakhova); data curation, Z.S. (Zagipa Sapakhova); writing—original draft preparation, M.T. and Z.A.; writing—review and editing, K.Z. (Kabyl Zhambakin); visualization, M.T. and Z.A.; supervision, M.S.; project administration, M.S.; funding acquisition, K.Z. (Kabyl Zhambakin). All authors have read and agreed to the published version of the manuscript.
Funding
This research was carried out with grant funding support for the project AP09259945 «Potential of sweetpotatoes (Ipomoea batatas L.) for phytoremediation of plumbum in contaminated areas of southern Kazakhstan» from the Committee of Science of the Ministry of Science and Higher Education of the Republic of Kazakhstan, for 2021–2023.
Institutional Review Board Statement
Not applicable.
Informed Consent Statement
Not applicable.
Data Availability Statement
Not applicable.
Conflicts of Interest
The authors declare no conflict of interest.
References
- Salim, Y.; Issayeva, A.; Kidirbayeva, K.; Zhumadulayeva, A.; Dossybayeva, G.; Bozhbanbaeva, N.; Ashirbayeva, S. Influence of Lead-Zinc Slags of the Shymkent City on the Environment. J. Ecol. Eng. 2022, 23, 83–89. [Google Scholar] [CrossRef]
- Calabró, M.R.; Roqueiro, G.; Tapia, R.; Crespo, D.C.; Bargiela, M.F.; Young, B.J. Chronic Toxicity, Bioavailability and Bioaccumulation of Zn, Cu and Pb in Lactuca Sativa Exposed to Waste From an Abandoned Gold Mine. Chemosphere 2022, 307, 135855. [Google Scholar] [CrossRef] [PubMed]
- DalCorso, G.; Fasani, E.; Manara, A.; Visioli, G.; Furini, A. Heavy Metal Pollutions: State of the Art and Innovation in Phytoremediation. Int. J. Mol. Sci. 2019, 20, 3412. [Google Scholar] [CrossRef]
- Shao, Y.; Yan, T.; Wang, K.; Huang, S.; Yuan, W.; Qin, F.G. Soil Heavy Metal Lead Pollution and Its Stabilization Remediation Technology. Energy Rep. 2020, 6, 122–127. [Google Scholar] [CrossRef]
- Khalef, R.N.; Hassan, A.I.; Saleh, H.M. Heavy Metal’s Environmental Impact. In Environmental Impact and Remediation of Heavy Metals; Hosam, M.S., Amal, I.H., Eds.; IntechOpen: London, UK, 2022. [Google Scholar] [CrossRef]
- Alengebawy, A.; Abdelkhalek, S.T.; Qureshi, S.R.; Wang, M.-Q. Heavy Metals and Pesticides Toxicity in Agricultural Soil and Plants: Ecological Risks and Human Health Implications. Toxics 2021, 9, 42. [Google Scholar] [CrossRef]
- Zheng, X.J.; Chen, M.; Wang, J.F.; Li, F.G.; Liu, Y.; Liu, Y.C. Ecological Risk Assessment of Heavy Metals in the Vicinity of Tungsten Mining Areas, Southern Jiangxi Province. Soil Sediment Contam. Int. J. 2020, 29, 665–679. [Google Scholar] [CrossRef]
- Duruibe, O.; Ogwuegbu, O.; Egwurugwu, N. Heavy Metal Pollution and Human Biotoxic Effects. Int. J. Phys. Sci. 2007, 2, 112–118. [Google Scholar]
- Yang, Q.; Li, Z.; Lu, X.; Duan, Q.; Huang, L.; Bi, J. A Review of Soil Heavy Metal Pollution from Industrial and Agricultural Regions in China: Pollution and Risk Assessment. Sci. Total Environ. 2018, 642, 690–700. [Google Scholar] [CrossRef]
- Yang, Q.; Zeng, X.; Kuang, W.; Liu, D. Heavy Metal Enrichment and Edible Safety of Two Vegetables in Rare Earth Tailings. Acad. J. Agric. Res. 2016, 4, 268–276. [Google Scholar]
- Pipoyan, D.; Beglaryan, M.; Costantini, L.; Molinari, R.; Merendino, N. Risk Assessment of Population Exposure to Toxic Trace Elements via Consumption of Vegetables and Fruits Grown in Some Mining Areas of Armenia. Hum. Ecol. Risk Assess. Int. J. 2018, 24, 317–330. [Google Scholar] [CrossRef]
- Zeng, J.; Luo, X.; Cheng, Y.; Ke, W.; Hartley, W.; Li, C.; Xue, S. Spatial Distribution of Toxic Metal (loid) s at an Abandoned Zinc Smelting Site, Southern China. J. Hazard. Mater. 2022, 425, 127970. [Google Scholar] [CrossRef] [PubMed]
- Ech-Charef, A.; Dekayir, A.; Jordán, G.; Rouai, M.; Chabli, A.; Qarbous, A.; El Houfy, F.Z. Soil heavy Metal Contamination in the Vicinity of the Abandoned Zeïda Mine in the Upper Moulouya Basin, Morocco. Implications for Airborne Dust Pollution Under Semi-Arid Climatic Conditions. J. Afr. Earth Sci. 2023, 198, 104812. [Google Scholar] [CrossRef]
- Abilda, Z.K.; Daurov, D.L.; Daurova, A.K.; Zhapar, K.K.; Sapakhova, Z.B.; Zhambakin, K.Z.; Shamekova, M.K. Construction of a Geoecological Map of Dust Particles Transfer from the Surface of the Shymkent lead (Plumbum) Factory Dump. Eurasian J. Ecol. 2023, 74, 4–15. [Google Scholar] [CrossRef]
- Zhambakin, K.; Zhapar, K. Current Status and Prospects of Plant Biotechnology in Kazakhstan. Plant Biotechnol. Rep. 2020, 14, 177–184. [Google Scholar] [CrossRef]
- Daurov, D.; Zhambakin, K.; Shamekova, M. Phytoremediation as a Way to Clean Technogenically Polluted Areas of Kazakhstan. Braz. J. Biol. 2023, 83, e271684. [Google Scholar] [CrossRef]
- Sapakhova, Z.; Raissova, N.; Daurov, D.; Zhapar, K.; Daurova, A.; Zhigailov, A.; Shamekova, M. Sweet Potato as a Key Crop for Food Security under the Conditions of Global Climate Change: A Review. Plants 2023, 12, 2516. [Google Scholar] [CrossRef]
- Zhapar, K.; Daurov, D.; Volkov, D.; Daurova, A.; Tolegenova, D.; Abay, Z.; Argynbaeva, A.; Kim, H.S.; Kwak, S.S.; Shamekova, M.; et al. Selection of Sweetpotato Cultivars with High Yields in Almaty Region, Kazakhstan. Exp. Biol. 2021, 88, 45–52. [Google Scholar] [CrossRef]
- Kafle, A.; Timilsina, A.; Gautam, A.; Adhikari, K.; Bhattarai, A.; Aryal, N. Phytoremediation: Mechanisms, Plant Selection and Enhancement by Natural and Synthetic Agents. Environ. Adv. 2022, 8, 100203. [Google Scholar] [CrossRef]
- Umaru, M.A.; Adam, P.; Zaharah, S.S.; Daljit, S.K. Impact of Soil Compaction on Soil Physical Properties and Physiological Performance of Sweet Potato (Ipomea batatas L.). Malays. J. Soil Sci. 2021, 25, 15–27. [Google Scholar]
- Hakanson, L. An Ecological Risk Index for Aquatic Pollution Control. A Sedimentological Approach. Water Res. 1980, 14, 975–1001. [Google Scholar]
- Dar, M.I.; Green, I.D.; Naikoo, M.I.; Khan, F.A.; Ansari, A.A.; Lone, M.I. Assessment of Biotransfer and Bioaccumulation of Cadmium, Lead and Zinc from Fly Ash Amended Soil in Mustard–Aphid–Beetle Food Chain. Sci. Total Environ. 2017, 584, 1221–1229. [Google Scholar] [CrossRef] [PubMed]
- Zakaria, Z.; Zulkafflee, N.S.; Mohd Redzuan, N.A.; Selamat, J.; Ismail, M.R.; Praveena, S.M.; Tóth, G.; Abdull Razis, A.F. Understanding Potential Heavy Metal Contamination, Absorption, Translocation and Accumulation in Rice and Human Health Risks. Plants 2021, 10, 1070. [Google Scholar] [CrossRef] [PubMed]
- Horasan, B.Y. The Environmental Impact of the Abandoned Mercury Mines on the Settlement and Agricultural Lands; Ladik (Konya, Turkey). Environ. Earth Sci. 2020, 79, 237. [Google Scholar] [CrossRef]
- Ahmad, A.; Al-Othman, A.A. Remediation Rates and Translocation of Heavy Metals from Contaminated Soil through Parthenium Hysterophorus. Chem. Ecol. 2014, 30, 317–327. [Google Scholar] [CrossRef]
- Bureau of National Statistics of the Republic of Kazakhstan. Demographic Statistics. Available online: https://stat.gov.kz/en/ (accessed on 3 April 2023).
- Salnikov, V.; Talanov, Y.; Polyakova, S.; Assylbekova, A.; Kauazov, A.; Bultekov, N.; Musralinova, G.; Kissebayev, D.; Beldeubayev, Y. An Assessment of the Present Trends in Temperature and Precipitation Extremes in Kazakhstan. Climate 2023, 11, 33. [Google Scholar] [CrossRef]
- National Hydrometeorological Service of Kazakhstan. Meteorological and Hydrological Databases. Available online: https://www.kazhydromet.kz/en/klimat/shymkent (accessed on 5 May 2023).
- Li, H.; He, T.; Liu, H.; Shi, S.; Wang, B.; Zhou, J.; Zhang, R. Efficacy of Sweet Potato Transplanting Machine for Different Cultivation Systems in Northern China. Agriculture 2022, 12, 1184. [Google Scholar] [CrossRef]
- Arshad, A.; Iqbal, H.; Siddiqa, A.; Zulfiqar, T.; Tareen, M.B.K.; Amna, D.; Shakir, M.; Hazafa, A.; Naeem, M.; Lorenzo, J.M.; et al. Comparative Study of Potato (Solanum tuberosum L.) and Sweet Potato (Ipomoea batatas L.): Evaluation of Proximate Composition, Polyphenol Content, Mineral and Antioxidant Activities. Appl. Sci. 2021, 11, 11844. [Google Scholar] [CrossRef]
- Operacz, A.; Bigaj, A.; Hap, K.; Kotowski, T. The Effect of Sample Preparation and Measurement Techniques on Heavy Metals Concentrations in Soil: Case Study from Kraków, Poland, Europe. Appl. Sci. 2022, 12, 2137. [Google Scholar] [CrossRef]
- Latosińska, J.; Kowalik, R.; Gawdzik, J. Risk Assessment of Soil Contamination with Heavy Metals from Municipal Sewage Sludge. Appl. Sci. 2021, 11, 548. [Google Scholar] [CrossRef]
- Müller, G. Schwermetalle in den sediments des Rheins-Veranderungenseitt. Umschan 1979, 79, 778–783. [Google Scholar]
- Monjardin, C.E.F.; Senoro, D.B.; Magbanlac, J.J.M.; de Jesus, K.L.M.; Tabelin, C.B.; Natal, P.M. Geo-accumulation Index of Manganese in Soils due to Flooding in Boac and Mogpog Rivers, Marinduque, Philippines with Mining Disaster Exposure. Appl. Sci. 2022, 12, 3527. [Google Scholar] [CrossRef]
- Ragonezi, C.; Nunes, N.; Oliveira, M.C.O.; de Freitas, J.G.R.; Ganança, J.F.T.; de Carvalho, M.Â.A.P. Sewage Sludge Fertilization—A Case Study of Sweet Potato Yield and Heavy Metal Accumulation. Agronomy 2022, 12, 1902. [Google Scholar] [CrossRef]
- Anjali, P.; Ashna, K.N. Precipitation Interpolation of Kozhikode District Using QGIS. Int. J. Eng. Res. Dev. 2015, 11, 56–61. [Google Scholar]
- HS 2.1.7.2041-06; Maximum Permissible Concentration (MPC) of Chemicals in Soi. Federal Center for Hygiene and Epidemiology of Rospotrebnadzor: Moscow, Russia, 2006; p. 15.
- Saparov, A.; Pachikin, K.; Erokhina, O.; Nasyrov, R. Dynamics of Soil Carbon and Recommendations on Effective Sequestration of Carbon in the Steppe Zone of Kazakhstan; Lal, R., Suleimenov, M., Stewart, B.A., Hansen, D.O., Doraiswamy, P., Eds.; Taylor & Francis: London, UK, 2007; pp. 177–188. ISBN 0-203-93269-2. [Google Scholar]
- UNESCO; FAO. Soil Map of the World: 1: 5000000. Available online: https://www.fao.org/soils-portal/data-hub/soil-maps-and-databases/faounesco-soil-map-of-the-world/en/ (accessed on 22 June 2023).
- Bose, S.; Bhattacharyya, A.K. Heavy metal accumulation in wheat plant grown in soil amended with industrial sludge. Chemosphere 2008, 70, 1264–1272. [Google Scholar] [CrossRef] [PubMed]
- Nan, Z.; Zhao, C.; Li, J.; Chen, F.; Sun, W. Relations between soil properties and selected heavy metal concentrations in spring wheat (Triticum aestivum L.) grown in contaminated soils. Water Air Soil Pollut. 2002, 133, 205–213. [Google Scholar] [CrossRef]
- Noviardi, R.; Karuniawan, A.; Sofyan, E.T.; Suryatmana, P. Heavy metals content in sweet potato (Ipomoea batatas L.) grown on soil contaminated by gold mine tailings with composted cow manure amendment. J. Degrad. Min. Lands Manag. 2023, 10, 4601–4610. [Google Scholar] [CrossRef]
- Huang, F.; Zhou, H.; Gu, J.; Liu, C.; Yang, W.; Liao, B.; Zhou, H. Differences in Absorption of Cadmium and Lead Among Fourteen Sweet Potato Cultivars and Health Risk Assessment. Ecotoxicol. Environ. Saf. 2020, 203, 111012. [Google Scholar] [CrossRef]
- Marchiol, L.; Sacco, P.; Assolari, S.; Zerbi, G. Reclamation of Polluted Soil: Phytoremediation Potential of Crop-Related Brassica Species. Water Air Soil Pollut. 2004, 158, 345–356. [Google Scholar] [CrossRef]
- Sulaiman, F.R.; Ibrahim, N.H.; Syed Ismail, S.N. Heavy Metal (As, Cd, and Pb) Concentration in Selected Leafy Vegetables from Jengka, Malaysia, and Potential Health Risks. SN Appl. Sci. 2020, 2, 1–9. [Google Scholar] [CrossRef]
- Chanu, L.B.; Gupta, A. Phytoremediation of Lead Using Ipomoea aquatica Forsk. in Hydroponic Solution. Chemosphere 2016, 156, 407–411. [Google Scholar] [CrossRef]
- Armienta, M.A.; Beltrán, M.; Martínez, S.; Labastida, I. Heavy Metal Assimilation in Maize (Zea mays L.) Plants Growing Near Mine Tailings. Environ. Geochem. Health 2020, 42, 2361–2375. [Google Scholar] [CrossRef]
- Lim, H.S.; Lee, J.S.; Chon, H.T.; Sager, M. Heavy Metal Contamination and Health Risk Assessment in the Vicinity of the Abandoned Songcheon Au–Ag Mine in Korea. J. Geochem. Explor. 2008, 96, 223–230. [Google Scholar] [CrossRef]
- Li, Q.; Han, Z.; Tian, Y.; Xiao, H.; Yang, M. Risk Assessment of Heavy Metal in Farmlands and Crops Near Pb–Zn Mine Tailing Ponds in Niujiaotang, China. Toxics 2023, 11, 106. [Google Scholar] [CrossRef]
- Wang, Q.R.; Cui, Y.S.; Liu, X.M.; Dong, Y.T.; Christie, P. Soil Contamination and Plant Uptake of Heavy Metals at Polluted Sites in China. J. Environ. Sci. Health Part A 2003, 38, 823–838. [Google Scholar] [CrossRef] [PubMed]
- Memon, A.R.; Schröder, P. Implications of Metal Accumulation Mechanisms to Phytoremediation. Environ. Sci. Pollut. Res. 2009, 16, 162–175. [Google Scholar] [CrossRef] [PubMed]
- Lal, N. Molecular Mechanisms and Genetic Basis Of Heavy Metal Toxicity and Tolerance in Plants. In Plant Adaptation and Phytoremediation; Springer: Dordrecht, The Netherlands, 2010; pp. 35–58. [Google Scholar] [CrossRef]
- Vázquez, M.D.; Barceló, J.; Poschenrieder, C.H.; Madico, J.; Hatton, P.; Baker, A.J.M.; Cope, G.H. Localization of Zinc and Cadmium in Thlaspi Caerulescens (Brassicaceae), a Metallophyte that can Hyperaccumulate Both Metals. J. Plant Physiol. 1992, 140, 350–355. [Google Scholar] [CrossRef]
- Nedelkoska, T.V.; Doran, P.M. Hyperaccumulation of Cadmium by Hairy Roots of Thlaspi Caerulescens. Biotechnol. Bioeng. 2000, 67, 607–615. [Google Scholar] [CrossRef]
- Kumar, A.; Prasad, M.N.V. Plant-lead Interactions: Transport, Toxicity, Tolerance, and Detoxification Mechanisms. Ecotoxicol. Environ. Saf. 2018, 166, 401–418. [Google Scholar] [CrossRef]
- Bhat, J.A.; Shivaraj, S.M.; Singh, P.; Navadagi, D.B.; Tripathi, D.K.; Dash, P.K.; Solanke, A.U.; Sonah, H.; Deshmukh, R. Role of Silicon in Mitigation of Heavy Metal Stresses in Crop Plants. Plants 2019, 8, 71. [Google Scholar] [CrossRef]
- Radomirović, M.; Ćirović, Ž.; Maksin, D.; Bakić, T.; Lukić, J.; Stanković, S.; Onjia, A. Ecological Risk Assessment of Heavy Metals in the Soil at a Former Painting Industry Facility. Front. Environ. Sci. 2020, 8, 560415. [Google Scholar] [CrossRef]
- Liu, J.; Zhuo, Z.; Sun, S.; Ning, X.; Zhao, S.; Xie, W.; Wang, Y.; Zheng, L.; Huang, R.; Li, B. Concentrations of Heavy Metals in Six Municipal Sludges from Guangzhou and Their Potential Ecological Risk Assessment for Agricultural Land Use. Pol. J. Environ. Stud. 2015, 24, 165–174. [Google Scholar] [CrossRef] [PubMed]
- Williams, J.A.; Antoine, J. Evaluation of the Elemental Pollution Status of Jamaican Surface Sediments Using Enrichment Factor, Geoaccumulation Index, Ecological Risk and Potential Ecological Risk Index. Mar. Pollut. Bull. 2020, 157, 111288. [Google Scholar] [CrossRef] [PubMed]
- Sofianska, E.; Michailidis, K. Assessment of Heavy Metals Contamination and Potential Ecological Risk in Soils Affected by a Former Mn Mining Activity, Drama District, Northern Greece. Soil Sediment Contam. Int. J. 2016, 25, 296–312. [Google Scholar] [CrossRef]
- Mendoza, E.O.; Custodio, M.; Ascensión, J.; Bastos, M.C. Heavy Metals in Soils from High Andean Zones and Potential Ecological Risk Assessment in Peru’s Central Andes. J. Ecol. Eng. 2020, 21, 108–119. [Google Scholar] [CrossRef]
- Cheng, S.F.; Huang, C.Y.; Chen, K.L.; Lin, S.C.; Lin, Y.C. Exploring the Benefits of Growing Bioenergy Crops to Activate Lead-Contaminated Agricultural Land: A Case Study on Sweet Potatoes. Environ. Monit. Assess. 2015, 187, 1–9. [Google Scholar] [CrossRef] [PubMed]
- Lee, C.S.; Nzioka, A.M.; Kim, Y.J.; Sakong, J. Evaluation of Bioconcentration Factors of Metals and Non-Metals in Crops and Soil from Abandoned Mines in Korea. Contemp. Probl. Ecol. 2017, 10, 583–590. [Google Scholar] [CrossRef]
- Aboubakar, A.; El Hajjaji, S.; Douaik, A.; Mfopou Mewouo, Y.C.; Birang a Madong, R.C.; Dahchour, A.; Mabrouki, J.; Labjar, N. Heavy Metal Concentrations in Soils and Two Vegetable Crops (Corchorus Olitorius and Solanum Nigrum L.), their Transfer from Soil to Vegetables and Potential Human Health Risks Assessment at Selected Urban Market Gardens of Yaoundé, Cameroon. Int. J. Environ. Anal. Chem. 2021, 103, 3522–3543. [Google Scholar] [CrossRef]
- Pachura, P.; Ociepa-Kubicka, A.; Skowron-Grabowska, B. Assessment of the Availability of Heavy Metals to Plants Based on the Translocation Index and the Bioaccumulation Factor. Desalination Water Treat. 2016, 57, 1469–1477. [Google Scholar] [CrossRef]
- Çelebi, Ş.Z.; Ekin, Z.; Zorer, Ö.S. Accumulation and Tolerance of Pb in some Bioenergy Crops. Pol. J. Environ. Stud. 2018, 27, 591–596. [Google Scholar] [CrossRef]
Disclaimer/Publisher’s Note: The statements, opinions and data contained in all publications are solely those of the individual author(s) and contributor(s) and not of MDPI and/or the editor(s). MDPI and/or the editor(s) disclaim responsibility for any injury to people or property resulting from any ideas, methods, instructions or products referred to in the content. |
© 2023 by the authors. Licensee MDPI, Basel, Switzerland. This article is an open access article distributed under the terms and conditions of the Creative Commons Attribution (CC BY) license (https://creativecommons.org/licenses/by/4.0/).