
An Epileptic Seizure Detection Technique Using EEG Signals with Mobile Application Development

 ,
, 
Abstract
1. Introduction
1.1. Background
1.2. Contribution and Paper Organization
2. Structure and Materials
2.1. General Structure of Epilepsy
2.2. Electroencephalograph (EEG)
3. State of the Art
4. Proposed Method and Procedures
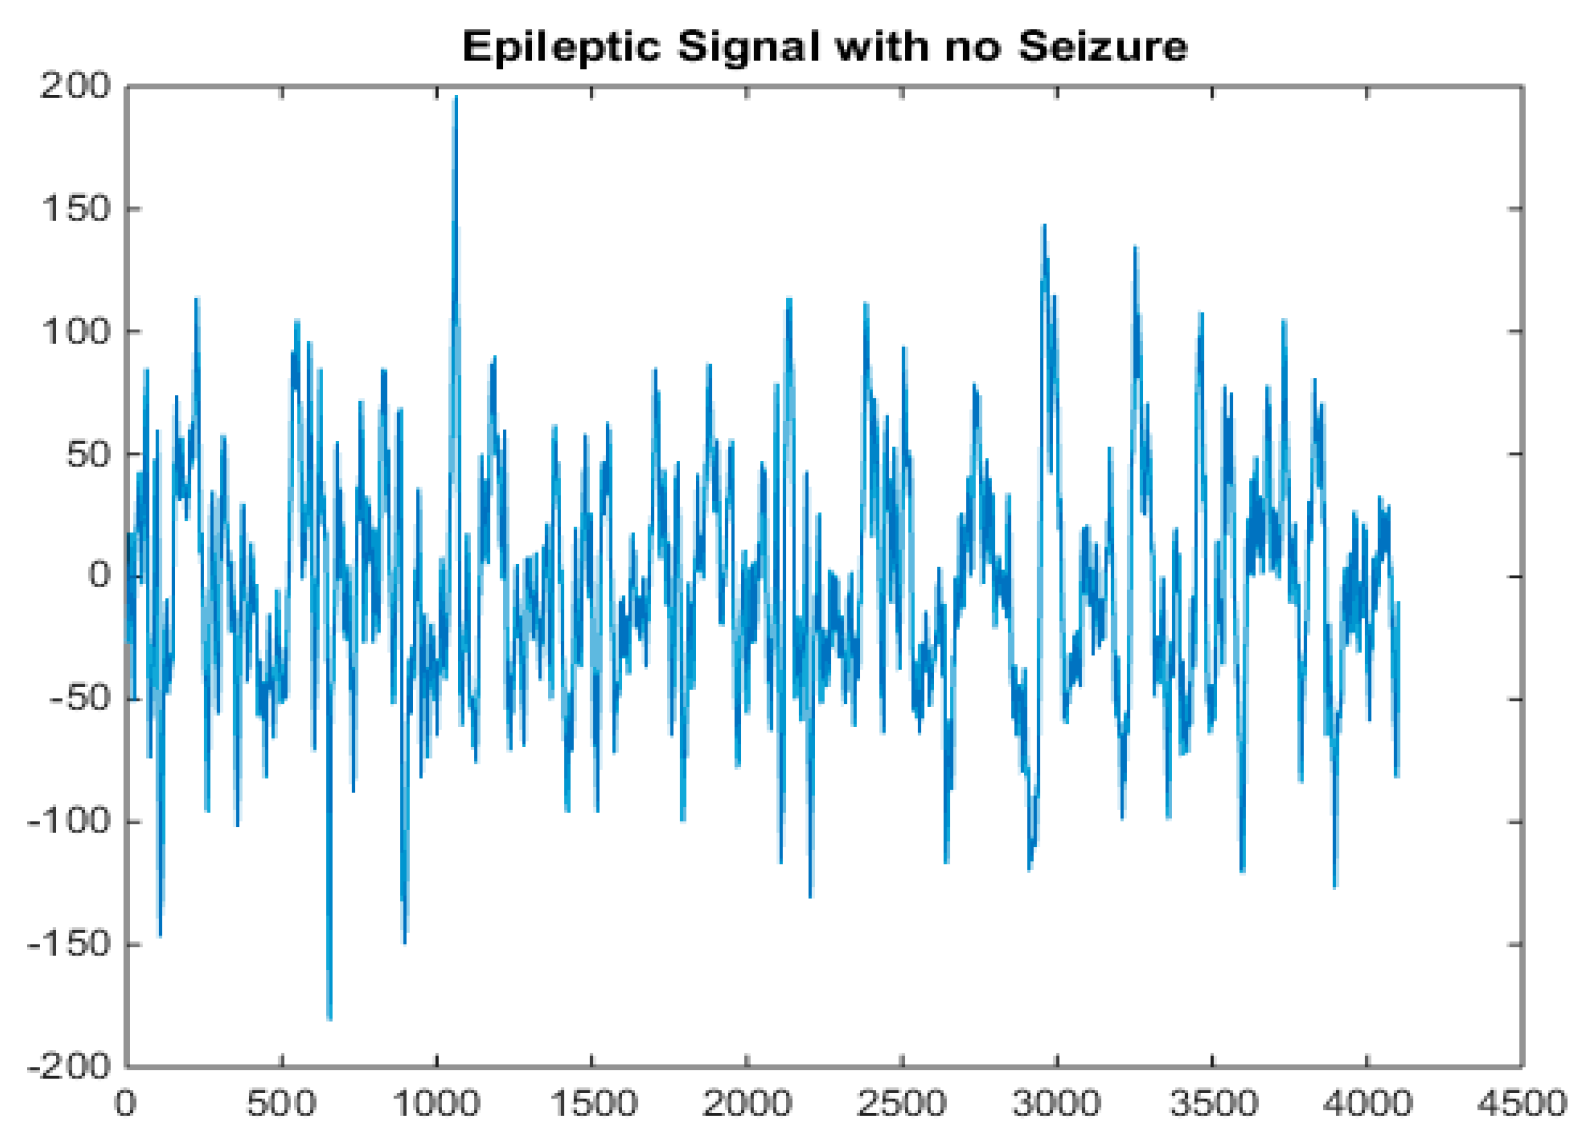
4.1. Input EEG Signal
4.2. Filtering
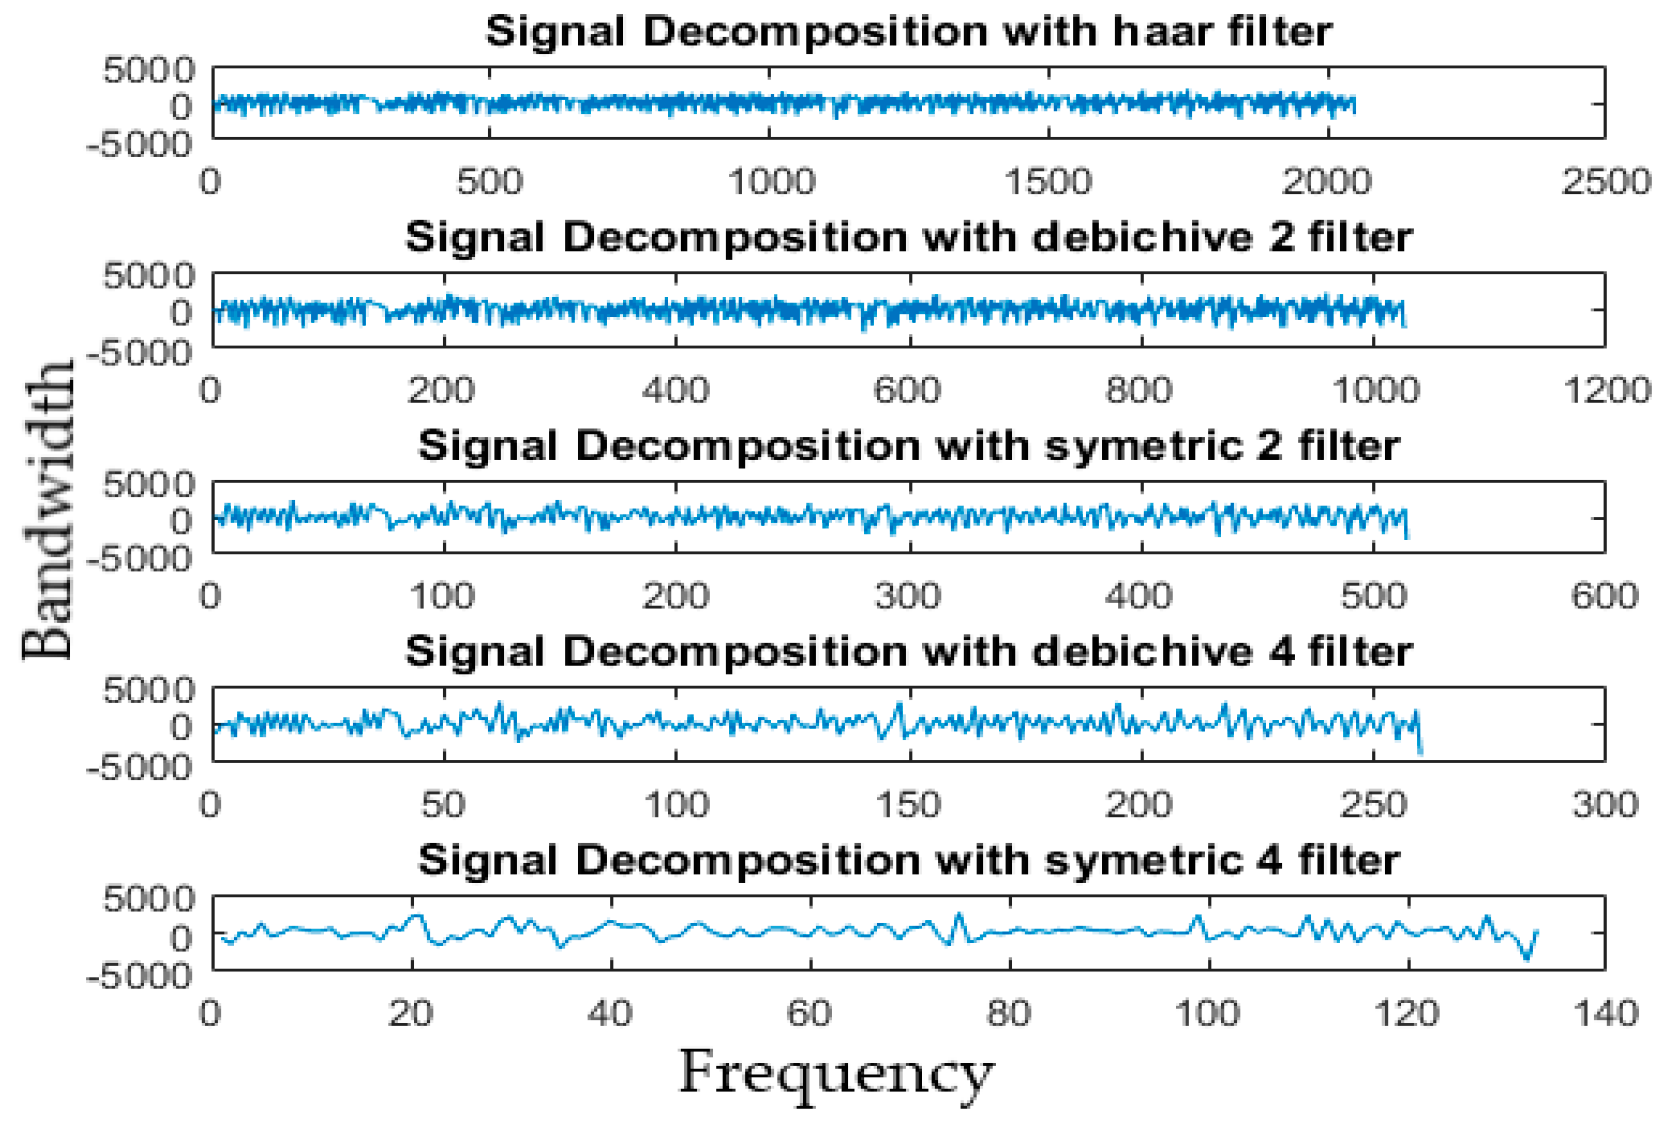
4.3. Decomposition
4.4. Feature Extraction
4.4.1. Amplitude Range
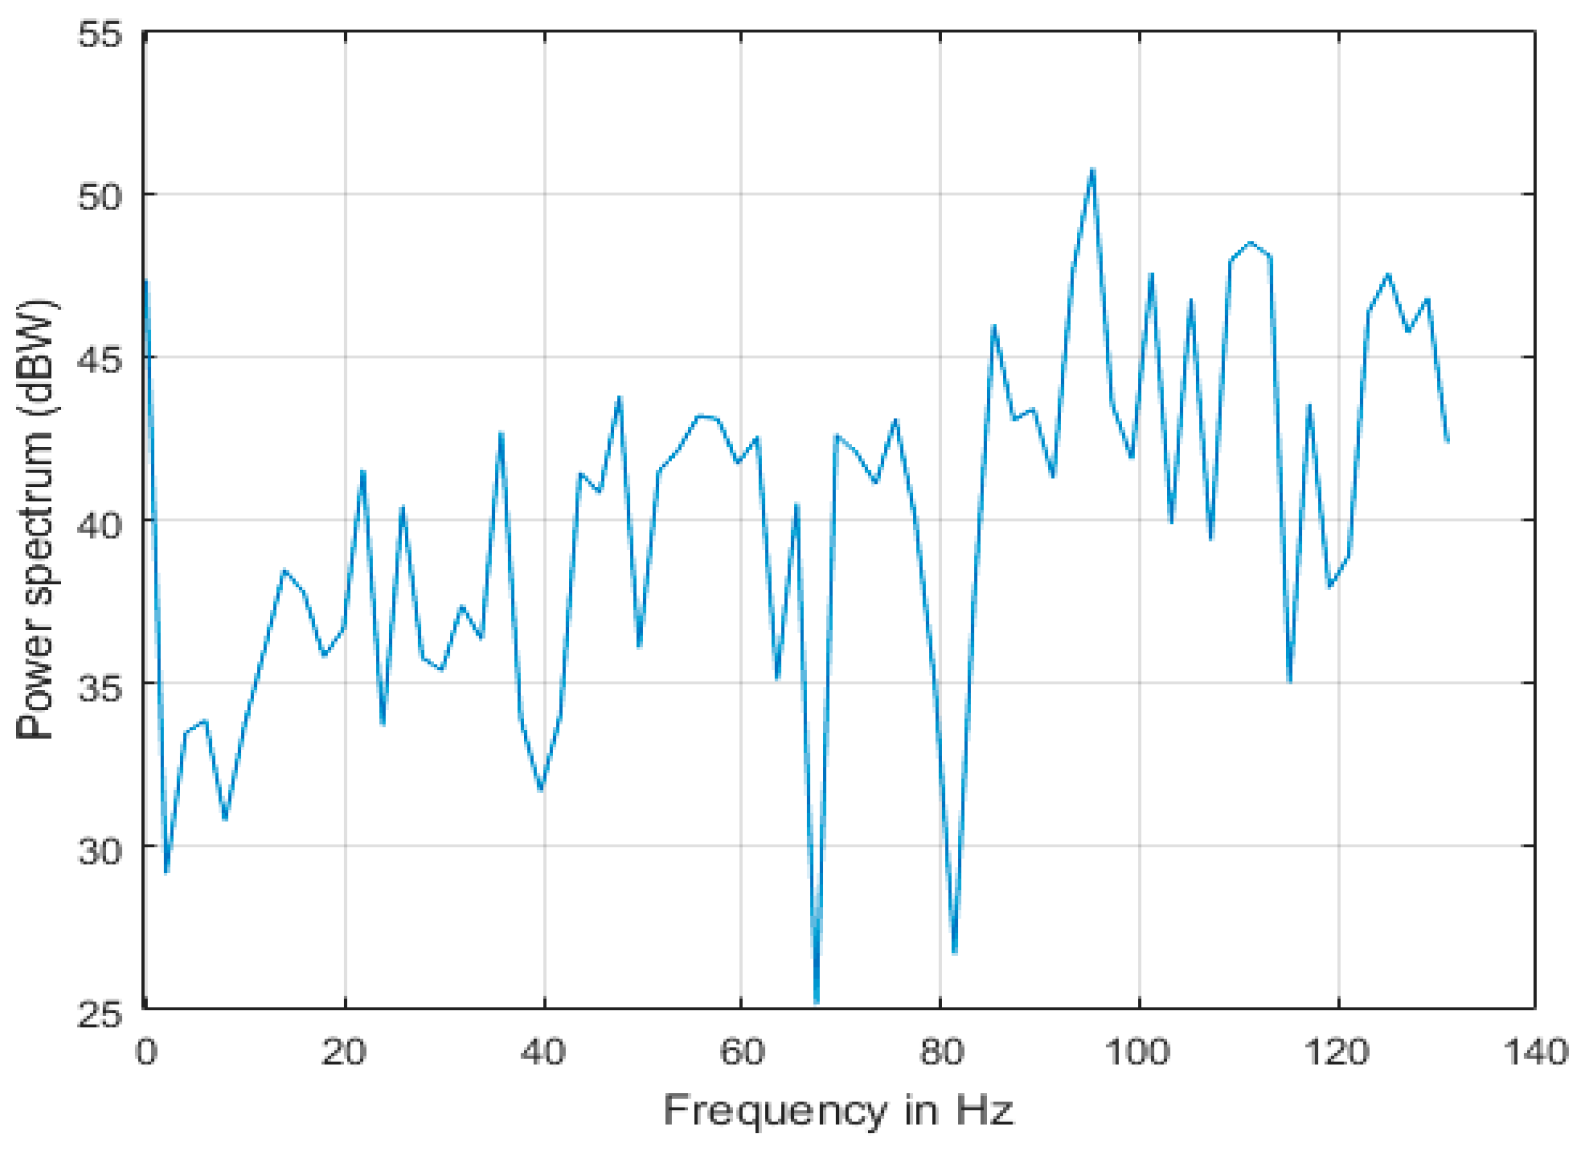
4.4.2. Band Power
4.4.3. Proposed Crest Range
4.5. Machine Learning and Classification
5. Results
5.1. Dataset
5.2. Pre-Processing
5.3. Feature Extraction
5.4. Classification
5.5. Performance
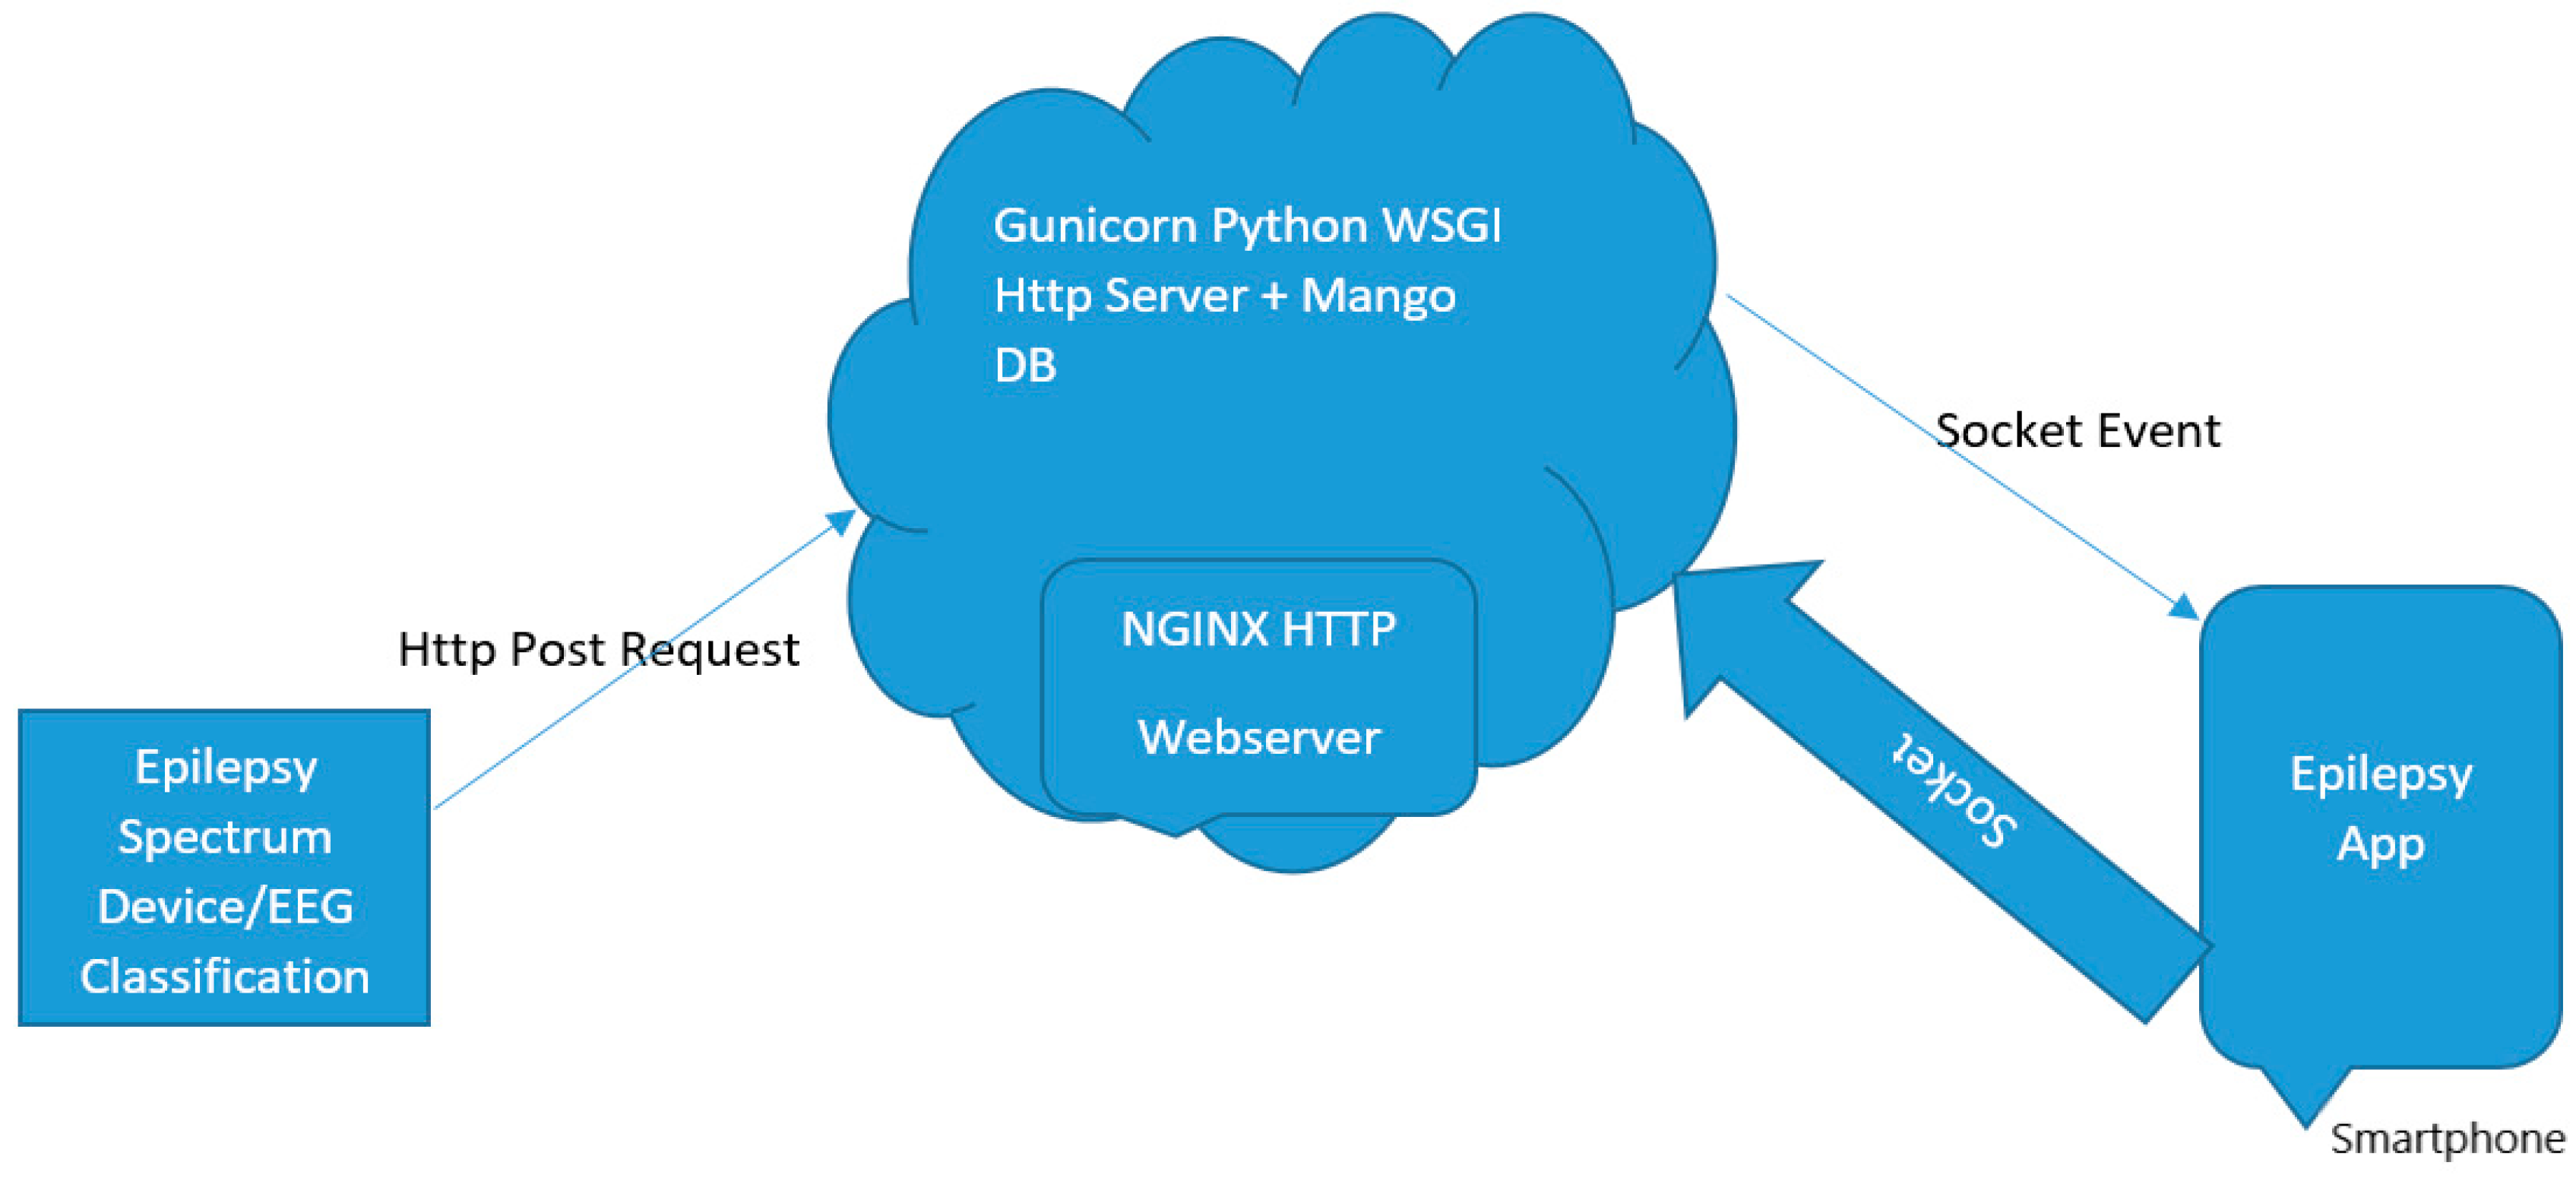
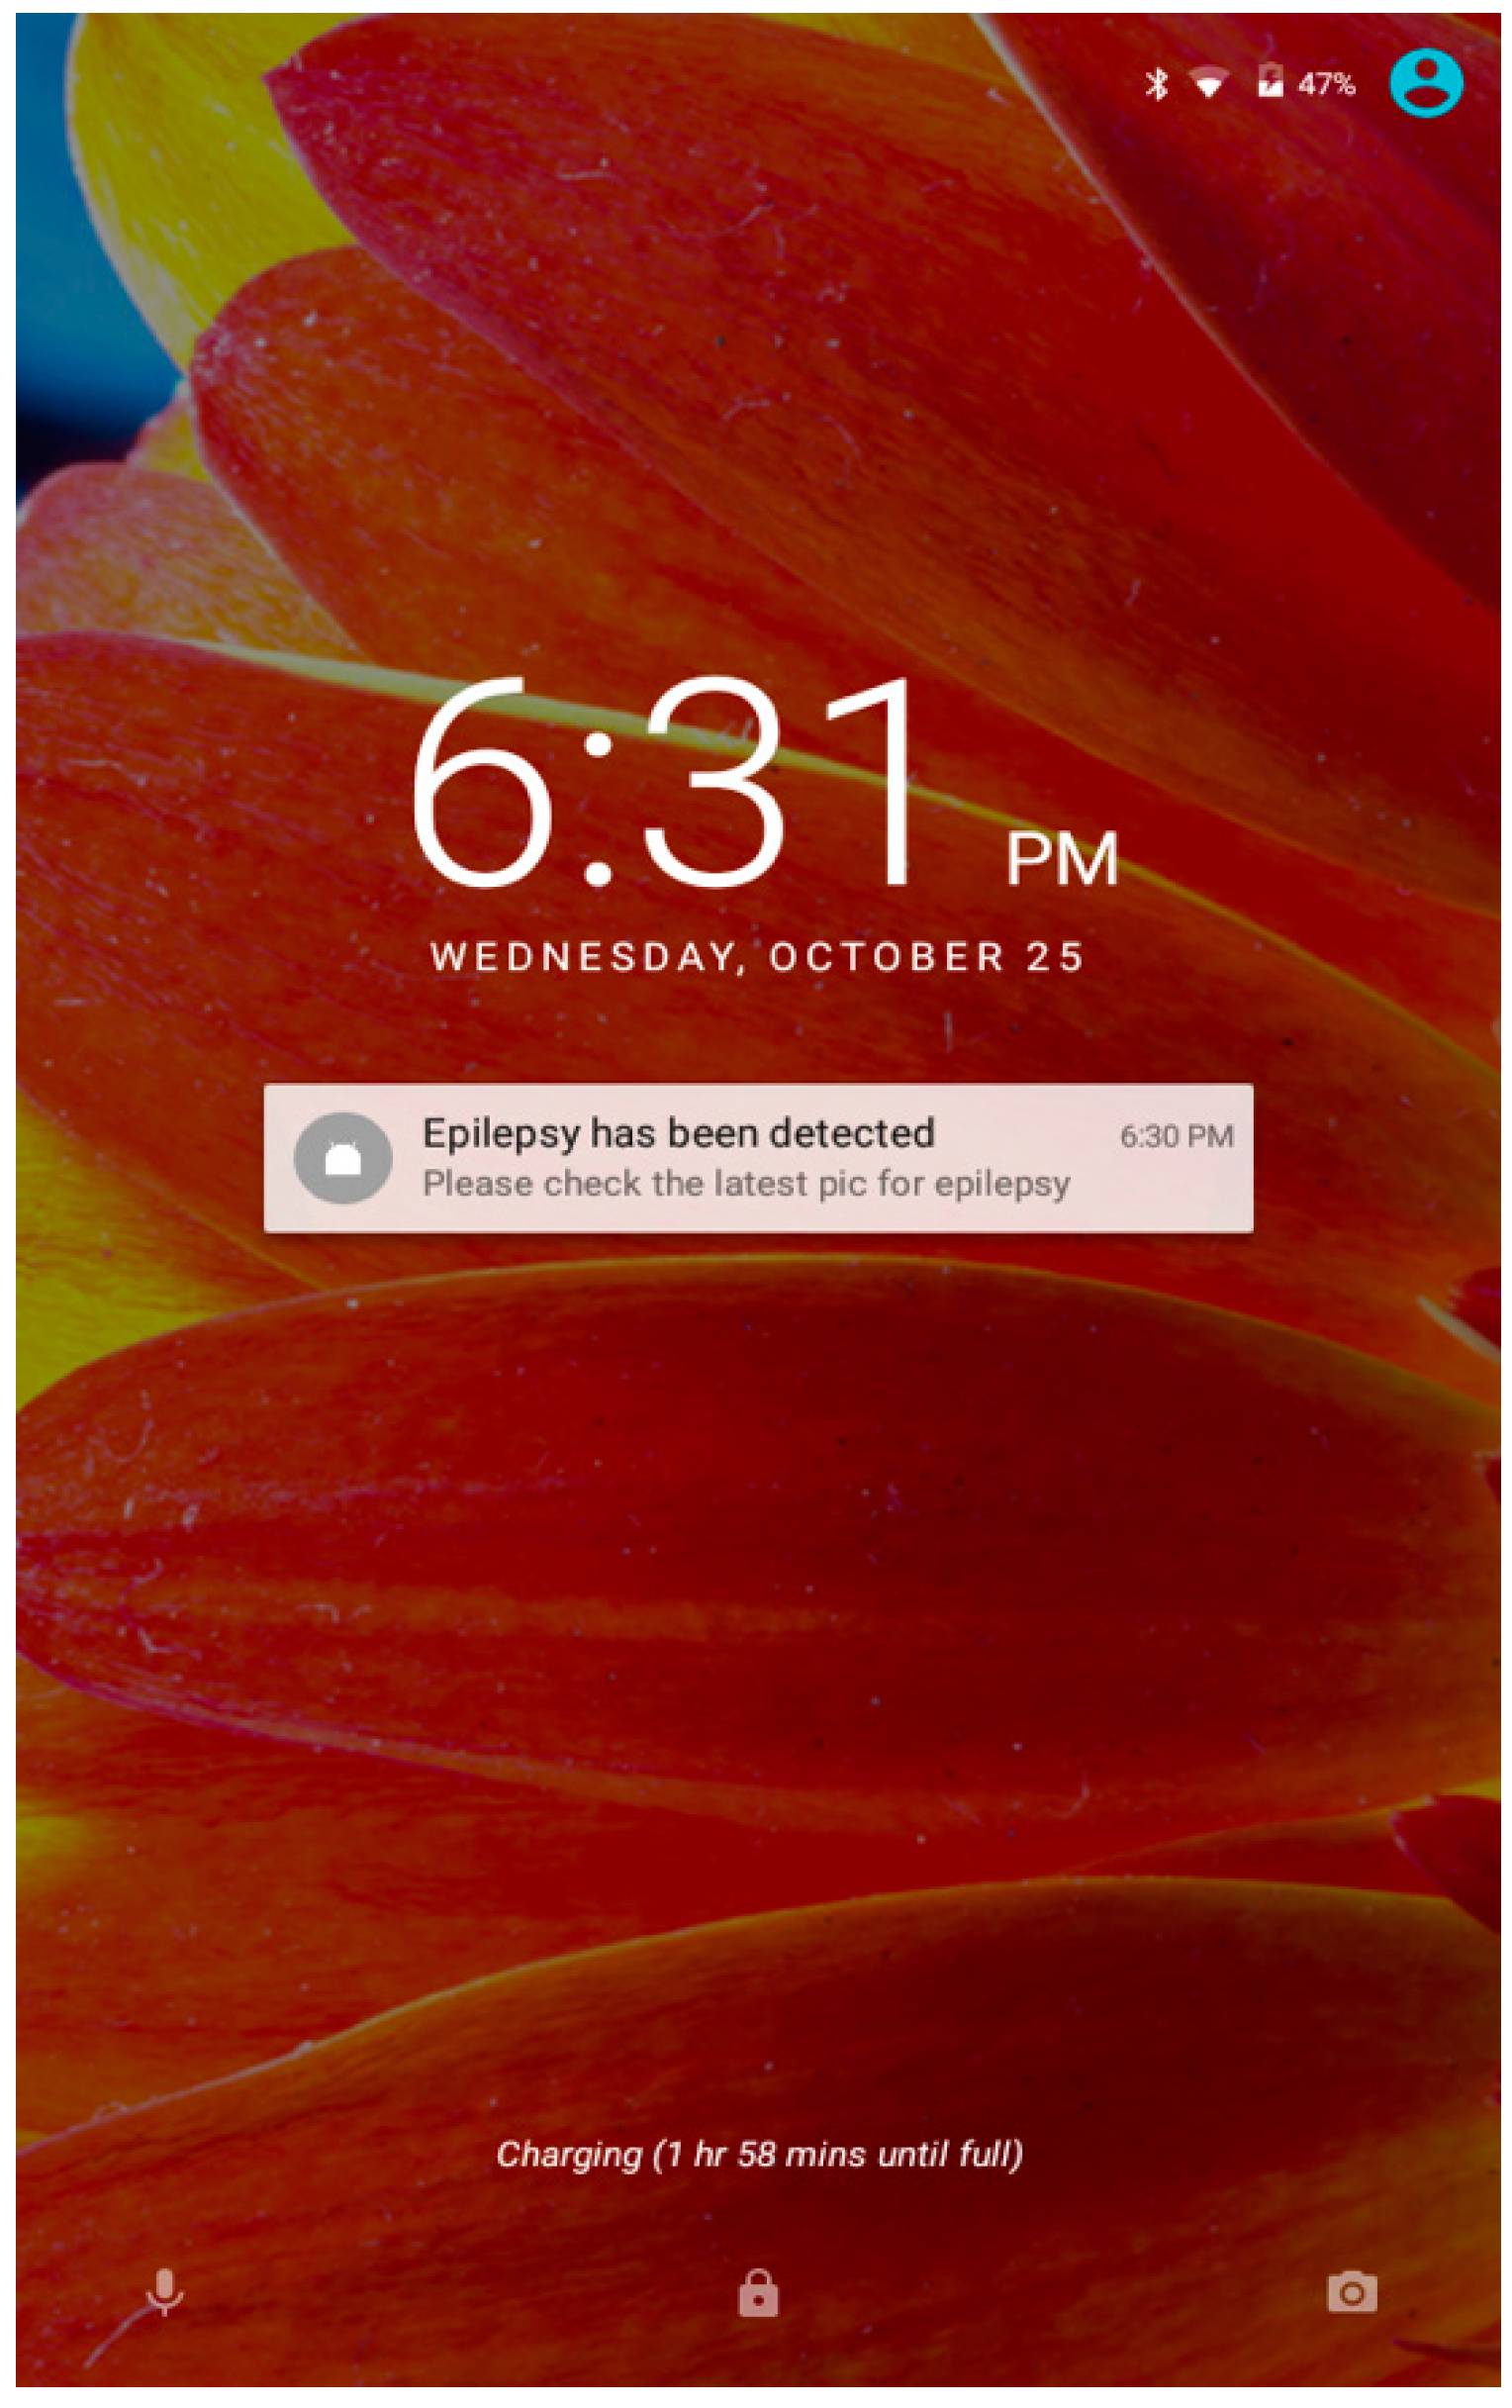
6. Mobile Application Development
7. Conclusions
Author Contributions
Funding
Institutional Review Board Statement
Informed Consent Statement
Data Availability Statement
Conflicts of Interest
Abbreviations
| ANN | Artificial Neural Network |
| CEEMD | Complementary ensemble empirical mode decomposition |
| CNN | Convolutional Neural Network |
| DFA | Detrended Fluctuation Analysis |
| DT | Detection Rate |
| DWT | Discrete Wavelet Transform |
| EEG | Electroencephalograph |
| FFac | Form Factor |
| FF-ANN | Feedforward Artificial Neural Network |
| FFNN | Feedforward Neural Network |
| FFT | Fast Fourier transform |
| FInfo | Fisher information |
| FIR | Finite Impulse Response |
| FMQAS | fuzzy measure-theoretic quantum approximation of an abstract system |
| GMM | Gaussian mixture model |
| HComp | Hjorth Parameters: Complexity |
| HFD | Higuchi Fractal Dimension |
| HMob | Hjorth Parameters: Mobility |
| HuExp | Hurst Exponent |
| IQR | Hounsfield units |
| KNN | k-Nearest Neighbor |
| Kurt | Kurtosis |
| LAD | Latent Dirichlet Allocation |
| LMBPPN | Levenberg–Marquardt back propagation network |
| LR | Layer-wise Relevance |
| LS-SVM | Least Squares Support Vector Machines |
| MAD | Median Absolute Deviation |
| MAX | Maximum |
| MFD | Mandelbrot Fractal Dimension |
| MIN | Minimum |
| NB | Naïve Bayes |
| NN | Neural Network |
| PAPR | Peak-to-Average Power Ratio |
| PeEn | Permutation Entropy |
| PFD | Petrosian Fractal Dimension |
| PNN | Probabilistic Neural Network |
| PSI_RIR | Power Spectral Intensity, and the relative intensity Ratio |
| RBFNN | Radial Basis Function Neural Network |
| RBF-SVM | Radial Basis Function Support Vector Machine |
| Recurrent NN | Recurrent Neural Network |
| RMS | Root Mean Square |
| SampEn | Sample Entropy |
| Sen | Spectral Entropy |
| Skw | Skewness |
| STDHR | standard deviation of the heart rate |
| SVDEn | SVD Entropy |
| SVM | Support Vector Machine |
| TotVar | Total Variation |
| Trough | Minimum value |
| Var | Variance |
| XGBoost | eXtreme Gradient Boosting |
References
- Orhan, U.; Hekim, M.; Ozer, M.; Provaznik, I. Epilepsy diagnosis using probability density functions of EEG signals. In Proceedings of the 2011 International Symposium on Innovations in Intelligent Systems and Applications (INISTA), Istanbul, Turkey, 15–18 June 2011; pp. 626–630. [Google Scholar]
- World Health Organization. Epilepsy; World Health Organization: Geneva, Switzerland, 2018.
- Acharya, U.R.; Sree, S.V.; Swapna, G.; Martis, R.J.; Suri, J.S. Automated EEG analysis of epilepsy: A review. Knowl. Based Syst. 2013, 45, 147–165. [Google Scholar] [CrossRef]
- Sanz-García, A.; Vega-Zelaya, L.; Pastor, J.; Sola, R.G.; Ortega, G.J. Towards Operational Definition of Postictal Stage: Spectral Entropy as a Marker of Seizure Ending. Entropy 2017, 19, 81. [Google Scholar] [CrossRef]
- Veisi, I.; Pariz, N.; Karimpour, A. Fast and Robust Detection of Epilepsy in Noisy EEG Signals Using Permutation Entropy. In Proceedings of the 2007 IEEE 7th International Symposium on BioInformatics and BioEngineering, Boston, MA, USA, 14–17 October 2007; pp. 200–203. [Google Scholar]
- Li, J.; Yan, J.; Liu, X.; Ouyang, G. Using permutation entropy to measure the changes in EEG signals during absence seizures. Entropy 2014, 16, 3049–3061. [Google Scholar] [CrossRef]
- Prince, P.G.K.; Hemamalini, R. A survey on soft computing techniques in epileptic seizure detection. In Proceedings of the International Conference on Emerging Trends in Robotics and Communication Technologies (INTERACT), Chennai, India, 3–5 December 2010; pp. 377–380. [Google Scholar]
- Orosco, L.; Laciar, E.; Correa, A.G.G.; Torres, A.; Graffigna, J.P. An epileptic seizures detection algorithm based on the empirical mode decomposition of EEG. In Proceedings of the 2009 Annual International Conference of the IEEE Engineering in Medicine and Biology Society, Minneapolis, MN, USA, 3–6 September 2009; pp. 2651–2654. [Google Scholar]
- Shalbaf, R.; Hosseini, P.T.; Analoui, M. Epilepsy detection using detrended fluctuation analysis. In Proceedings of the 2009 International Conference on Wavelet Analysis and Pattern Recognition, ICWAPR 2009, Baoding, China, 12–15 July 2009; pp. 235–240. [Google Scholar]
- England, M.J.; Liverman, C.T.; Schultz, A.M.; Strawbridge, L.M. Epilepsy across the spectrum: Promoting health and understanding.: A summary of the Institute of Medicine report. Epilepsy Behav. 2012, 25, 266–276. [Google Scholar] [CrossRef] [PubMed]
- Lasefr, Z.; Ayyalasomayajula, S.S.V.; Elleithy, K. Epilepsy seizure detection using EEG signals. In Proceedings of the 2017 IEEE 8th Annual Ubiquitous Computing, Electronics and Mobile Communication Conference (UEMCON), New York, NY, USA, 19–21 October 2017; pp. 162–167. [Google Scholar]
- Weissman, D. What is EEG? Available online: https://lsa.umich.edu/psych/danielweissmanlab/whatiseeg.htm (accessed on 15 May 2017).
- Ba-Karait, N.O.S.; Shamsuddin, S.M.; Sudirman, R. Swarm negative selection algorithm for electroencephalogram signals classification. J. Comput. Sci. 2009, 5, 995. [Google Scholar] [CrossRef][Green Version]
- Zhao, Z.; Hu, Q. The application of a computer monitoring system using IoT technology. Comput. Intell. Neurosci. 2022, 2022, 4033886. [Google Scholar] [CrossRef]
- Katona, J.; Ujbanyi, T.; Sziladi, G.; Kovari, A. Electroencephalogram-based brain-computer interface for internet of robotic things. In Cognitive Infocommunications, Theory and Applications; Springer: Berlin/Heidelberg, Germany, 2019; pp. 253–275. [Google Scholar]
- Kovari, A. Study of algorithmic problem-solving and executive function. Acta Polytech. Hung 2020, 17, 241–256. [Google Scholar] [CrossRef]
- Costescu, C.; Rosan, A.; Brigitta, N.; Hathazi, A.; Kovari, A.; Katona, J.; Demeter, R.; Heldal, I.; Helgesen, C.; Thill, S. Assessing visual attention in children using gp3 eye tracker. In Proceedings of the 2019 10th IEEE International Conference on Cognitive Infocommunications (CogInfoCom), Naples, Italy, 23–25 October 2019; pp. 343–348. [Google Scholar]
- Ujbányi, T.; Kővári, A.; Sziládi, G.; Katona, J. Examination of the eye-hand coordination related to computer mouse movement. Infocommun. J. 2020, 12, 26–31. [Google Scholar] [CrossRef]
- Katona, J.; Kovari, A.; Heldal, I.; Costescu, C.; Rosan, A.; Demeter, R.; Thill, S.; Stefanut, T. Using eye-tracking to examine query syntax and method syntax comprehension in LINQ. In Proceedings of the 2020 11th IEEE International Conference on Cognitive Infocommunications (CogInfoCom), Mariehamn, Finland, 23–25 September 2020; pp. 000437–000444. [Google Scholar]
- Aboalayon, K.A.I.; Faezipour, M.; Almuhammadi, W.S.; Moslehpour, S. Sleep stage classification using EEG signal analysis: A comprehensive survey and new investigation. Entropy 2016, 18, 272. [Google Scholar] [CrossRef]
- Gonzalez-Vellon, B.; Sanei, S.; Chambers, J.A. Support vector machines for seizure detection. In Proceedings of the 3rd IEEE International Symposium on Signal Processing and Information Technology, ISSPIT 2003, Darmstadt, Germany, 17 December 2003; pp. 126–129. [Google Scholar]
- Joel, J. Detection of seizure precursors from depth EEG using a sign periodogram transform. IEEE Trans. Bio Med. Eng. 2004, 51, 449–458. [Google Scholar]
- Mammone, N.; Duun-Henriksen, J.; Kjaer, T.W.; Morabito, F.C. Differentiating interictal and ictal states in childhood absence epilepsy through permutation Rényi entropy. Entropy 2015, 17, 4627–4643. [Google Scholar] [CrossRef]
- Martín, M.T.; Plastino, A.; Vampa, V. A maximum entropy approach for predicting epileptic tonic-clonic seizure. Entropy 2014, 16, 4603–4611. [Google Scholar] [CrossRef]
- Sharanreddy, M.; Kulkarni, P. Review of significant research on EEG based automated detection of epilepsy seizures and brain tumor. Int. J. Sci. Eng. Res. 2011, 2, 1–9. [Google Scholar]
- Harikumar, R.; Sukanesh, R.; Bharathi, P.A. Genetic algorithm optimization of fuzzy outputs for classification of epilepsy risk levels from EEG signals. In Proceedings of the Conference Record of the Thirty-Eighth Asilomar Conference on Signals, Systems and Computers, Pacific Grove, CA, USA, 7–10 November 2004; pp. 1585–1589. [Google Scholar]
- Sharma, R.; Pachori, R.B.; Acharya, U.R. An integrated index for the identification of focal electroencephalogram signals using discrete wavelet transform and entropy measures. Entropy 2015, 17, 5218–5240. [Google Scholar] [CrossRef]
- Sinha, A.K.; Loparo, K.A.; Richoux, W.J. A new system theoretic classifier for detection and prediction of epileptic seizures. In Proceedings of the 26th Annual International Conference of the IEEE Engineering in Medicine and Biology Society, San Francisco, CA, USA, 1–5 September 2004; pp. 415–418. [Google Scholar] [PubMed]
- Aarabi, A.; Fazel-Rezai, R.; Aghakhani, Y. Seizure detection in intracranial EEG using a fuzzy inference system. In Proceedings of the Engineering in Medicine and Biology Society, EMBC 2009, Minneapolis, MN, USA, 3–6 September 2009; pp. 1860–1863. [Google Scholar]
- Bao, F.S.; Lie, D.Y.-C.; Zhang, Y. A new approach to automated epileptic diagnosis using EEG and probabilistic neural network. In Proceedings of the 2008 20th IEEE International Conference on Tools with Artificial Intelligence, Dayton, OH, USA, 3–5 November 2008; pp. 482–486. [Google Scholar]
- Bezobrazova, S.; Golovko, V. Comparative Analysis of Forecasting Neural Networks in the Application for Epilepsy Detection. In Proceedings of the 2007 4th IEEE Workshop on Intelligent Data Acquisition and Advanced Computing Systems: Technology and Applications, Dortmund, Germany, 6–8 September 2007; pp. 202–206. [Google Scholar]
- Fani, M.; Azemi, G. Automatic epilepsy detection using the instantaneous frequency and sub-band energies of the EEG signals. In Proceedings of the 2011 19th Iranian Conference on Electrical Engineering (ICEE), Tehran, Iran, 17–19 May 2011; pp. 1–5. [Google Scholar]
- Sivasankari, N.; Thanushkodi, K. Epileptic seizure detection on eeg signal using statistical signal processing and neural networks. In Proceedings of the 1st WSEAS International Conference on Sensors and Signals, Stevens Point, WI, USA, 7–9 November 2008; pp. 98–102. [Google Scholar]
- Juarez-Guerra, E.; Alarcon-Aquino, V.; Gomez-Gil, P. Epilepsy seizure detection in EEG signals using wavelet transforms and neural networks. In New Trends in Networking, Computing, E-learning, Systems Sciences, and Engineering; Springer: Berlin/Heidelberg, Germany, 2015; pp. 261–269. [Google Scholar]
- Kumar, S.P.; Sriraam, N.; Benakop, P. Automated detection of epileptic seizures using wavelet entropy feature with recurrent neural network classifier. In Proceedings of the TENCON 2008-2008 IEEE Region 10 Conference, Hyderabad, India, 19–21 November 2008; pp. 1–5. [Google Scholar]
- Kiranmayi, G.; Udayashankara, V. Neural network classifier for the detection of epilepsy. In Proceedings of the 2013 International conference on Circuits, Controls and Communications (CCUBE), Bengaluru, India, 27–28 December 2013; pp. 1–4. [Google Scholar]
- Ghosh-Dastidar, S.; Adeli, H.; Dadmehr, N. Principal component analysis-enhanced cosine radial basis function neural network for robust epilepsy and seizure detection. IEEE Trans. Biomed. Eng. 2008, 55, 512–518. [Google Scholar] [CrossRef] [PubMed]
- Dilber, D.; Kaur, J. EEG based detection of epilepsy by a mixed design approach. In Proceedings of the 2016 IEEE International Conference on Recent Trends in Electronics, Information & Communication Technology (RTEICT), Bangalore, India, 20–21 May 2016; pp. 1425–1428. [Google Scholar]
- Mihandoost, S.; Amirani, M.C.; Varghahan, B.Z. Seizure detection using wavelet transform and a new statistical feature. In Proceedings of the 2011 5th International Conference on Application of Information and Communication Technologies (AICT), Azerbaijan, Baku, 12–14 October 2011; pp. 1–5. [Google Scholar]
- Kumari, R.S.S.; Jose, J.P. Seizure detection in EEG using time frequency analysis and SVM. In Proceedings of the 2011 International Conference on Emerging Trends in Electrical and Computer Technology (ICETECT), Nagercoil, India, 23–24 March 2011; pp. 626–630. [Google Scholar]
- Panda, R.; Khobragade, P.S.; Jambhule, P.D.; Jengthe, S.N.; Pal, P.R.; Gandhi, T.K. Classification of EEG signal using wavelet transform and support vector machine for epileptic seizure diction. In Proceedings of the 2010 International Conference on Systems in Medicine and Biology, Kharagpur, India, 16–18 December 2010; pp. 405–408. [Google Scholar]
- Liu, Y.; Zhou, W.; Yuan, Q.; Chen, S. Automatic Seizure Detection Using Wavelet Transform and SVM in Long-Term Intracranial EEG. IEEE Trans. Neural Syst. Rehabil. Eng. 2012, 20, 749–755. [Google Scholar] [CrossRef]
- Murugavel, A.M.; Ramakrishnan, S.; Balasamy, K.; Gopalakrishnan, T. Lyapunov features based EEG signal classification by multi-class SVM. In Proceedings of the 2011 World Congress on Information and Communication Technologies, Mumbai, India, 11–14 December 2011; pp. 197–201. [Google Scholar]
- Schneider, M.; Mustaro, P.N.; Lima, C.A. Automatic recognition of epileptic seizure in EEG via support vector machine and dimension fractal. In Proceedings of the 2009 International Joint Conference on Neural Networks, Atlanta, GA, USA, 14–19 June 2009; pp. 2841–2845. [Google Scholar]
- Shen, C.-P.; Chan, C.-M.; Lin, F.-S.; Chiu, M.-J.; Lin, J.-W.; Kao, J.-H.; Chen, C.-P.; Lai, F. Epileptic seizure detection for multichannel EEG signals with support vector machines. In Proceedings of the 2011 IEEE 11th International Conference on Bioinformatics and Bioengineering, Taichung, Taiwan, 24–26 October 2011; pp. 39–43. [Google Scholar]
- Seng, C.H.; Demirli, R.; Khuon, L.; Bolger, D. Seizure detection in EEG signals using support vector machines. In Proceedings of the Bioengineering Conference (NEBEC), 2012 38th Annual Northeast, Philadelphia, PA, USA, 16–18 March 2012; pp. 231–232. [Google Scholar]
- Yuan, Y. Detection of epileptic seizure based on EEG signals. In Proceedings of the 2010 3rd International Congress on Image and Signal Processing (CISP), Yantai, China, 16–18 October 2010; pp. 4209–4211. [Google Scholar]
- Hadj-Youcef, M.; Adnane, M.; Bousbia-Salah, A. Detection of epileptics during seizure free periods. In Proceedings of the 2013 8th International Workshop on Systems, Signal Processing and their Applications (WoSSPA), Algiers, Algeria, 12–15 May 2013; pp. 209–213. [Google Scholar]
- Rafiuddin, N.; Khan, Y.U.; Farooq, O. Feature extraction and classification of EEG for automatic seizure detection. In Proceedings of the 2011 International Conference on Multimedia, Signal Processing and Communication Technologies (IMPACT), Aligarh, India, 17–19 December 2011; pp. 184–187. [Google Scholar]
- Chua, K.C.; Chandran, V.; Acharya, R.; Lim, C.M. Automatic identification of epilepsy by HOS and power spectrum parameters using EEG signals: A comparative study. In Proceedings of the 30th Annual International Conference of the IEEE Engineering in Medicine and Biology Society, EMBS 2008, Vancouver, BC, Canada, 20–25 August 2008; pp. 3824–3827. [Google Scholar]
- Kumar, S.S.P.; Ajitha, L. Early detection of epilepsy using EEG signals. In Proceedings of the 2014 International Conference on Control, Instrumentation, Communication and Computational Technologies (ICCICCT), Kanyakumari, India, 10–11 July 2014; pp. 1509–1514. [Google Scholar]
- Vijith, V.S.; Jacob, J.E.; Iype, T.; Gopakumar, K.; Yohannan, D.G. Epileptic seizure detection using non linear analysis of EEG. In Proceedings of the 2016 International Conference on Inventive Computation Technologies (ICICT), Coimbatore, India, 26–27 August 2016; pp. 1–6. [Google Scholar]
- Rashid, M.M.o.; Ahmad, M. Epileptic seizure classification using statistical features of EEG signal. In Proceedings of the 2017 International Conference on Electrical, Computer and Communication Engineering (ECCE), Cox’s Bazar, Bangladesh, 16–18 February 2017; pp. 308–312. [Google Scholar]
- Vandecasteele, K.; De Cooman, T.; Gu, Y.; Cleeren, E.; Claes, K.; Paesschen, W.V.; Huffel, S.V.; Hunyadi, B. Automated Epileptic Seizure Detection Based on Wearable ECG and PPG in a Hospital Environment. Sensors 2017, 17, 2338. [Google Scholar] [CrossRef]
- Wang, L.; Xue, W.; Li, Y.; Luo, M.; Huang, J.; Cui, W.; Huang, C. Automatic epileptic seizure detection in EEG signals using multi-domain feature extraction and nonlinear analysis. Entropy 2017, 19, 222. [Google Scholar] [CrossRef]
- Gu, Y.; Cleeren, E.; Dan, J.; Claes, K.; Van Paesschen, W.; Van Huffel, S.; Hunyadi, B. Comparison between Scalp EEG and Behind-the-Ear EEG for Development of a Wearable Seizure Detection System for Patients with Focal Epilepsy. Sensors 2018, 18, 29. [Google Scholar] [CrossRef]
- Wu, J.; Zhou, T.; Li, T. Detecting Epileptic Seizures in EEG Signals with Complementary Ensemble Empirical Mode Decomposition and Extreme Gradient Boosting. Entropy 2020, 22, 140. [Google Scholar] [CrossRef]
- Aileni, R.M.; Pasca, S.; Florescu, A. EEG-Brain Activity Monitoring and Predictive Analysis of Signals Using Artificial Neural Networks. Sensors 2020, 20, 3346. [Google Scholar] [CrossRef]
- Molla, M.K.I.; Hassan, K.M.; Islam, M.R.; Tanaka, T. Graph Eigen Decomposition-Based Feature-Selection Method for Epileptic Seizure Detection Using Electroencephalography. Sensors 2020, 20, 4639. [Google Scholar] [CrossRef] [PubMed]
- Abiyev, R.; Arslan, M.; Bush Idoko, J.; Sekeroglu, B.; Ilhan, A. Identification of Epileptic EEG Signals Using Convolutional Neural Networks. Appl. Sci. 2020, 10, 4089. [Google Scholar] [CrossRef]
- Zhang, Y.; Yang, S.; Liu, Y.; Zhang, Y.; Han, B.; Zhou, F. Integration of 24 Feature Types to Accurately Detect and Predict Seizures Using Scalp EEG Signals. Sensors 2018, 18, 1372. [Google Scholar] [CrossRef]
- Mansouri, A.; Singh, S.P.; Sayood, K. Online EEG Seizure Detection and Localization. Algorithms 2019, 12, 176. [Google Scholar] [CrossRef]
- Shabarinath, B.; Challagulla, K.; Visodhan, M.R. A Comparative Study of Epileptic Seizure Detection Framework using SVM and ELM. In Proceedings of the 2019 International Conference on Intelligent Computing and Control Systems (ICCS), Madurai, India, 15–17 May 2019; pp. 302–306. [Google Scholar]
- Ahmed, A.; Benoudnine, H. A Novel Blending Hilbert-Kolmogorov Approach for Epileptic Seizures detection. In Proceedings of the 2020 International Joint Conference on Neural Networks (IJCNN), Glasgow, UK, 19–24 July 2020; pp. 1–7. [Google Scholar]
- Abedin, M.Z.; Akther, S.; Hossain, M.S. An artificial neural network model for epilepsy seizure detection. In Proceedings of the 2019 5th International Conference on Advances in Electrical Engineering (ICAEE), Dhaka, Bangladesh, 26–28 September 2019; pp. 860–865. [Google Scholar]
- Gupta, S.; Bagga, S.; Maheshkar, V.; Bhatia, M. Detection of Epileptic Seizures using EEG Signals. In Proceedings of the 2020 International Conference on Artificial Intelligence and Signal Processing (AISP), Amaravati, India, 10–12 January 2020; pp. 1–5. [Google Scholar]
- Prasanna, J.; Thomas, G.S.; Subathra, M.; Sairamya, N. Automatic Epileptic Seizure Classification using MODWT and SVM. In Proceedings of the 2019 2nd International Conference on Signal Processing and Communication (ICSPC), Coimbatore, India, 29–30 March 2019; pp. 113–116. [Google Scholar]
- Karim, A.Z.; Bashar, S.S.; Miah, M.S.; Al Mahmud, M.A.; Al Amin, M.A. Identification of seizure from single channel EEG using Support Vector Machine & Hilbert Vibration Decomposition. In Proceedings of the 2020 IEEE Symposium on Industrial Electronics & Applications (ISIEA), Kuala Lumpur, Malaysia, 17–18 July 2020; pp. 1–6. [Google Scholar]
- Lasefr, Z.; Ayyalasomayajula, S.S.V.; Elleithy, K. An efficient automated technique for epilepsy seizure detection using EEG signals. In Proceedings of the 2017 IEEE 8th Annual Ubiquitous Computing, Electronics and Mobile Communication Conference (UEMCON), New York, NY, USA, 26–29 October 2017; pp. 76–82. [Google Scholar]
- Hassan, A.R.; Bhuiyan, M.I.H. Automatic sleep scoring using statistical features in the EMD domain and ensemble methods. Biocybern. Biomed. Eng. 2016, 36, 248–255. [Google Scholar] [CrossRef]
- Scott, M.T.; Scott, T.J.; Kelly, V.G. The validity and reliability of global positioning systems in team sport: A brief review. J. Strength Cond. Res. 2016, 30, 1470–1490. [Google Scholar] [CrossRef]
- Ghosh-Dastidar, S.; Adeli, H.; Dadmehr, N. Mixed-band wavelet-chaos-neural network methodology for epilepsy and epileptic seizure detection. IEEE Trans. Biomed. Eng. 2007, 54, 1545–1551. [Google Scholar] [CrossRef]
- Lasefr, Z.; Reddy, R.R.; Elleithy, K. Smart phone application development for monitoring epilepsy seizure detection based on EEG signal classification. In Proceedings of the 2017 IEEE 8th Annual Ubiquitous Computing, Electronics and Mobile Communication Conference (UEMCON), New York, NY, USA, 19–21 October 2017; pp. 83–87. [Google Scholar]
- Cattani, L.; Saini, H.P.; Ferrari, G.; Pisani, F.; Raheli, R. SmartCED: An Android application for neonatal seizures detection. In Proceedings of the 2016 IEEE International Symposium on Medical Measurements and Applications (MeMeA), Benevento, Italy, 15–18 May 2016; pp. 1–6. [Google Scholar]
- DeVaul, R.; Barkalow, D.; Carlton-Foss, J.; Elledge, C. Method and System for Fall Detection and Motion Analysis. U.S. Patent Application No. 11/372,843, 14 December 2006. [Google Scholar]
- Madansingh, S.; Thrasher, T.A.; Layne, C.S.; Lee, B.-C. Smartphone based fall detection system. In Proceedings of the 2015 15th International Conference on Control, Automation and Systems (ICCAS), Busan, South Korea, 13–16 October 2015; pp. 370–374. [Google Scholar]
- Fang, S.H.; Liang, Y.C.; Chiu, K.M. Developing a mobile phone-based fall detection system on Android platform. In Proceedings of the 2012 Computing, Communications and Applications Conference, Hong Kong, China, 11–13 January 2012; pp. 143–146. [Google Scholar]
- Yavuz, G.; Kocak, M.; Ergun, G.; Alemdar, H.O.; Yalcin, H.; Incel, O.D.; Ersoy, C. A smartphone based fall detector with online location support. In Proceedings of the International Workshop on Sensing for App Phones, Zurich, Switzerland, 2 November 2010; pp. 31–35. [Google Scholar]


| Authors | Signal | Dataset | Features | Classifiers | Results |
|---|---|---|---|---|---|
| Sinha et al., 2004 [28] | EEG | Collected from 5 patients | Spectral Power | FMQAS | Satisfactory |
| Arabi et al., 2009 [29] | EEG | Collected from 21 patients | Entropy, Dominant frequency, Average amplitude, and Rhythmicity | PNN | 98.7% ACC |
| Bao et al., 2008 [30] | EEG | Bonn University | Power spectral features (PSF), Petrosian and Higuchi fractal dimensions (PFD, HFD), and Hjorth parameters | PNN | 96.7% ACC |
| Bezobrazova and Golovko, 2007 [31] | EEG | Collected from 6 patients | ANN | 96.7% ACC | |
| Fani and Azmi, 2011 [32] | EEG | Bonn University | Mean of IF, Mean of Kaiser energy, and Energy | ANN | 94% ACC |
| Sivasankari and Thanushkodi, 2008 [33] | EEG | Bonn University | Mean, Absolute value, and Variance | ANN | 93.23% ACC |
| Juarez-Guerra et al., 2015 [34] | EEG | Bonn University | Mean, Absolute median, and Variance | FF-ANN | 93.23% ACC |
| Kumar et al., 2008 [35] | EEG | Bonn University | Wavelet entropy and Spectral entropy | Recurrent NN | 96.3% ACC |
| Kiranmaji and Udayashankara, 2013 [36] | EEG | JSS medical hospital, Mysuru, India | Maximum, Minimum, Mean, and Standard deviation | FFNN | 81.67 ACC |
| Ghosh-Dastidar et al., 2008 [37] | EEG | Bonn University | Standard deviation, Correlation dimension, and Largest Lyapunov exponent | K-Means Clustering, Discrimination analysis, LMBPPN, and RBFNN | 96.7% ACC |
| Dawood Dilber et al., 2016 [38] | EEG | PhysioNet | Mean, Standard deviation, Variance FFT, and Wavelet transform | K-Means and Discrimination analysis | 70% ACC, 93% ACC |
| Mihandoos et al., 2011 [39] | EEG | Bonn University | Fourth moment of wavelet coefficient divided by the second moment, Max–Min, Zero-crossing of wavelet coefficient, Variance of wavelet coefficient, Mean of wavelet coefficient | KNN and Bayesian learning machine | 96.8% ACC, 98% ACC |
| Kumari and Jose, 2011 [40] | EEG | Bonn University | Variance, Energy, and Power spectral density | SVM | 98% ACC |
| Panda et al., 2010 [41] | EEG | Bonn University | Energy, Entropy, and Standard deviation | SVM | 91.2% ACC |
| Liu et al., 2012 [42] | EEG | University Hospital of Freiburg, Germany | Relative entropy, Relative amplitude, Coefficient of variation, and Fluctuation index | RBF-SVM | 95.33% ACC |
| Murugavel et al., 2011 [43] | EEG | Bonn University | Maximum, Minimum, Mean, and Standard deviation | PNN, RBFNN, MSVM | 94% ACC, 93% ACC, 96% ACC |
| Schneider et al., 2009 [44] | EEG | Bonn University | Higuchi algorithm, Katz algorithm, and Sevcik algorithm | SVM | Higuchi algorithm has the higher accuracy |
| Shen et al., 2011 [45] | EEG | National Taiwan University Hospital | Total variation, Standard Deviation, and Energy | SVM | 98.9% ACC |
| Seng et al., 2012 [46] | EEG | Bonn University | Mean, Coefficient of variation, Dominant frequency, Mean of power spectrum, and Variance | SVM | 98% ACC |
| Yuan, 2010 [47] | EEG | Collected from epileptic patients | Cao’s method | PNN and SVM | 96.3% ACC |
| Hadj-Youcef et al., 2013 [48] | EEG | Bonn University | Maximum, Minimum, Range standard deviation, Energy, and Entropy | SVM | 98% ACC |
| Rafiuddin et al., 2011 [49] | EEG | AMU University | Energy, Coefficient of variation, IQR, and MAD | LAD | 96.5% ACC |
| Chua et al., 2008 [50] | EEG | Bonn University | Mean of spectral magnitude, Entropy, and Power spectrum | GMM | 93.11% ACC |
| Kumar et al., 2014 [51] | EEG | Bonn University | Normalized bispectral (NB) entropy, NB squared entropy, and NB cubed entropy, Bispectrum phase entropy, Mean bispectrum magnitude, and Moment of bispectrum | PNN, KNN, DT, and SVM | 96% ACC, 96% ACC, 95% ACC, 98% ACC |
| Vijith et al., 2016 [52] | EEG | Government Medical College Thiruvananthapuram, Kerala | Approximate entropy, Sample entropy, and Hurst exponent | SVM | 91% ACC |
| Rashid et al., 2017 [53] | EEG | Bonn University | Mean, Median, Maximum, Minimum, Range, Standard deviation, Median absolute deviation, Mean absolute deviation, 12 Norm, and Max Norm | NN | 80% ACC |
| Vandecasteele et al., 2017 [54] | ECG | Collected from patient at UZ Leuven Gasthuisberg | HR peak, HR base, and STDHR base | SVM | 70% Sen |
| Wang et al., 2017 [55] | EEG | Bonn University | Mean, Variance, Coefficient of variation, Total variation, Maximum, Minimum | SVM, KNN, LDA, NB, and LR | 99.25% ACC |
| Gu et al., 2018 [56] | EEG | Collected from patients | Mean powers, and Peak frequency | SVM | 100% Sen, 94.5% Sen |
| Wu, 2020 [57] | EEG | Bonn University and CHB-MIT dataset | Time domain, Frequency domain, Time–frequency domain, and Entropy-based features | CEEMD + XGBoost | 99% ACC, 95.7% ACC |
| Maria et al., 2020 [58] | EEG, EMG, PPG | CAP Sleep Database | DWT | ANN | 91.1% ACC |
| Molla et al., 2020 [59] | EEG | Bonn University | SODP, Squared coefficient of variation of the absolute series, Fluctuation index, Permutation entropy, Approximate entropy, and Renyi’s entropy | FFNN | 99.5% ACC |
| Abiyev et al., 2020 [60] | EEG | Bonn University | Features obtained from the convolutional layers of CNN | CNN | 96.67% ACC |
| Zhang et al., 2018 [61] | EEG | American Clinical Neurophysiology Society | PFD, MFD, FInfo, HComp, HMob, DFA, HuExp, TotVar, FFac, PAPR, RMS, Peak, Kurt, Skw, Var, Trough, Crest, Mean, HFD, SampEn, PeEn, SVDEn, SEn, and PSI_RIR | SVM | 99.40% ACC |
| Mansouri et al., 2019 [62] | EEG | Physionet CHB-MIT | Power in band of interest | Adaptive threshold, Distance network | 83% Sen |
| Shabarinath et al., 2019 [63] | EEG | Bonn University | Power spectral density and Wavelet coefficients | SVM | 90.1% ACC |
| Adda et al., 2020 [64] | EEG | Bonn University | Amplitude and Kolmogorov complexity | SVM | 97% ACC |
| Abedin et al., 2019 [65] | EEG | Bonn University | Mean, Standard deviation, Median, Kurtosis, Skewness, Variance, Maximum, Minimum, and Root mean square | ANN | 97.33% ACC |
| Gupta et al., 2020 [66] | EEG | Bonn University | Mean, Standard deviation, Root mean square, Skew, Kurtosis, Maximum, Coefficient of variation, and Shannon entropy | CNN | 99.29% ACC |
| Prasanna et al., 2019 [67] | EEG | Karunya EEG database | Mean and Standard deviation | SVM | 95.8% ACC |
| Karim et al., 2020 [68] | EEG | Bonn University | Mean instantaneous frequencies | LS-SVM | 97.66% ACC |
| Percentage Using Maximum–Minimum Feature | Classifiers | ||
|---|---|---|---|
| ANN | SVM | KNN | |
| 80% Training and 20% Testing | 96.49% | 94.13% | 98.61% |
| 70% Training and 30% Testing | 96.18% | 94.57% | 97.7% |
| 60% Training and 40% Testing | 95.77% | 93.27% | 96.54% |
| 50% Training and 50% Testing | 94.95% | 93.18% | 95.06% |
| Percentage Using Band-Power Feature | Classifiers | ||
|---|---|---|---|
| ANN | SVM | KNN | |
| 80% Training and 20% Testing | 90.97% | 89.89% | 92.92% |
| 70% Training and 30% Testing | 88.41% | 89.99% | 91.60% |
| 60% Training and 40% Testing | 89.01% | 88.27% | 90.42% |
| 50% Training and 50% Testing | 86.21% | 88.27% | 89.23% |
| Percentage Using Crest-Range Feature | Classifiers | ||
|---|---|---|---|
| ANN | SVM | KNN | |
| 80% Training and 20% Testing | 98.03% | 95.34% | 97.92% |
| 70% Training and 30% Testing | 96.05% | 93.56% | 97.93% |
| 60% Training and 40% Testing | 95.17% | 94.73% | 96.54% |
| 50% Training and 50% Testing | 94.48% | 94.92% | 95.68% |
| Percentage Using Amplitude-Range and Band-Power Features | Classifiers | ||
|---|---|---|---|
| ANN | SVM | KNN | |
| 80% Training and 20% Testing | 97.87% | 96.40% | 96.72% |
| 70% Training and 30% Testing | 95.91% | 95.97% | 95.63% |
| 60% Training and 40% Testing | 94.72% | 93.53% | 93.62% |
| 50% Training and 50% Testing | 94.40% | 93.21% | 93.23% |
| Percentage Using Band-Power and Crest-Range Features | Classifiers | ||
|---|---|---|---|
| ANN | SVM | KNN | |
| 80% Training and 20% Testing | 96.66% | 97.06% | 96% |
| 70% Training and 30% Testing | 96.02% | 96.20% | 95.51% |
| 60% Training and 40% Testing | 95.07% | 94.64% | 93.70% |
| 50% Training and 50% Testing | 94.24% | 93.57% | 92.71% |
| Percentage Using Amplitude-Range and Crest-Range Features | Classifiers | ||
|---|---|---|---|
| ANN | SVM | KNN | |
| 80% Training and 20% Testing | 97.25% | 96.94% | 98.27% |
| 70% Training and 30% Testing | 96.44% | 95.40% | 97.36% |
| 60% Training and 40% Testing | 94.75% | 94.25% | 96.23% |
| 50% Training and 50% Testing | 94.17% | 93.82% | 95.76% |
| Percentage Using Three Combined Features | Classifiers | ||
|---|---|---|---|
| ANN | SVM | KNN | |
| 80% Training and 20% Testing | 98.43% | 97.92% | 98.10% |
| 70% Training and 30% Testing | 96.38% | 97.20% | 96.52% |
| 60% Training and 40% Testing | 96.20% | 96.55% | 95.68% |
| 50% Training and 50% Testing | 96.06% | 94.32% | 93.83% |
| No | Title | Author | Features | Classifier | Accuracy Results |
|---|---|---|---|---|---|
| 1 | Automatic epilepsy detection using the instantaneous frequency and sub-band energies of the EEG signals (2011) | Fani and Azemi [32] | frequency and the energies of the EEG signals in different sub-bands | Artificial neural network (ANN) | 94% |
| 2 | Neural network classifier for the detection of epilepsy (2013) | Kiranmayi and Udayashankara [36] | maximum value in the non-redundant region, minimum value in the non-redundant region, mean value of the non-redundant region, maximum value along the principal diagonal, minimum value along the principal diagonal, standard deviation along the principal diagonal | ANN | 81.67% |
| 3 | Early detection of epilepsy using EEG signals (2014) | Kumar and Ajitha [51] | bispectral entropy, bispectral squared entropy, bispectrum phase entropy, mean bispectrum magnitude, weighted center of bispectrum | PNN, KNN, DT, SVM | 96% 96% 95% 98% |
| 4 | Epileptic seizure detection in EEG signals using wavelet transforms and neural networks (2015) | Juarez-Guerra et al. [34] | mean, absolute, median, variance | Feed-forward neural network | 93.23% |
| 5 | EEG based detection of Epilepsy by a mixed design approach (2016) | Dilber and Kaur [38] | mean, standard deviation, variance, FFT, wavelet transform | Support-vector machine Discriminant Analysis technique | 70%/93% |
| 6 | Epileptic seizure detection using nonlinear analysis of EEG (2016) | Vijith et al. [52] | approximate entropy, sample entropy, hurst exponent | Support-vector machine | 89%/91% |
| 7 | Epileptic seizure classification using statistical features of EEG signal (2017) | Ahmad et al. [53] | mean, median, maximum, minimum, range, standard deviation, median absolute deviation, mean absolute deviation, l2 norm, max norm, | Neural Network (NN) | 80.0% 78.7% 80.0% 79.3% |
| 8 | Mixed-band wavelet-chaos-neural network methodology for epilepsy and epileptic seizure detection (2007) | Ghosh-Dastidar and Adeli [72] | standard deviation, correlation dimension, largest Lyapunov exponent | unsupervised K-means clustering, linear and quadratic discriminant analysis, radial basis function neural network, Levenberg–Marquardt backpropagation neural network | 96.7% Using (LMBPNN) |
| 9 | Seizure detection using wavelet transform and a new statistical feature (2011) | Mihandoost et al. [39] | fourth moment divided by second moment, difference between maximum and minimum, zero-crossing of the wavelet coefficients | K-nearest neighbors (KNN), Bayesian | 96.83% 98.17% |
| 10 | Seizure detection in EEG using time-frequency analysis and SVM (2011) | Kumari and Jose [40] | variance, energy, power spectral density (PSD) | Support-vector machine (SVM) | 98.75% |
| 11 | Classification of EEG signal using wavelet transform and support vector machine for epileptic seizure diction (2010) | Panda et al. [41] | energy, entropy, standard deviation | Support-vector machine (SVM) | 91.2% |
| 12 | Automatic seizure detection using wavelet transform and SVM in long-term intracranial EEG (2012) | Liu [42] | relative energy, relative amplitude, coefficient of variation, fluctuation index | Support-vector machine (SVM) | 95.33% |
| 13 | Lyapunov features based EEG signal classification by multi-class SVM (2011) | Murugavel et al. [43] | maximum, minimum, mean, standard deviation | Multi-class Support-vector machine (MSVM), Probabilistic Neural Network (PNN), Radial Basis Function Neural Network (RBFNN) | 96%/94%/93% |
| 14 | Seizure detection in EEG signals using support vector machines (2012) | Seng et al. [46] | mean, variance, dominant frequency, mean power spectrum | Support-vector machine (SVM) | 98% |
| 15 | Detection of epilepsy during seizure-free periods (2013) | Hadj-Youcef et al. [48] | maximum, minimum, range, standard deviation | Support-vector machine (SVM) | 98% |
| 16 | Feature extraction and classification of EEG for automatic seizure detection (2011) | Rafiuddin [49] | inter-quartile range (IQR), median absolute deviation (MAD), energy of variation, coefficient of variation | Linear Discriminate Analysis (LAD) | 96.5% |
| 17 | Automatic Identification of epilepsy by HOS and power spectrum parameters using EEG signals: a comparative study (2008) | Chua et al. [50] | mean of spectral magnitude for PSD, mean of spectral magnitude for HOS, entropy | Gaussian mixture model (GMM) | - (PSD) 88.78% - (HOS) 93.11% |
| 18 | Proposed method: (2023) | Lasefr et al. | amplitude range, band power, crest range | ANN, SVM, KNN | 96% 95% 98% |
| Application | Author | Method | Features |
|---|---|---|---|
| Android application for neonatal colonic seizures detection | Cattani et al. [74] | Movement of some body parts, video and image processing | A laptop required for processing. No real users. |
| Android application | DeVaul et al. [75] | Fall detection | Low accuracy. |
| Android application | Madansingh et al. [76] | Analyzing body movement using existing embedded sensors | No notification. |
| Fitbit devices | Fang et al. [77] | SMS and GPS alerts | Lack the compatibility. High cost. |
| Android application | Yavuz et al. [78] | Fall detection | GPS locations/SMS. |
| Proposed android application | Lasefr et al. | EEG signal processing | High accuracy. Immediate notification. Development for real-time processing. |
Disclaimer/Publisher’s Note: The statements, opinions and data contained in all publications are solely those of the individual author(s) and contributor(s) and not of MDPI and/or the editor(s). MDPI and/or the editor(s) disclaim responsibility for any injury to people or property resulting from any ideas, methods, instructions or products referred to in the content. |
© 2023 by the authors. Licensee MDPI, Basel, Switzerland. This article is an open access article distributed under the terms and conditions of the Creative Commons Attribution (CC BY) license (https://creativecommons.org/licenses/by/4.0/).
Share and Cite
Lasefr, Z.; Elleithy, K.; Reddy, R.R.; Abdelfattah, E.; Faezipour, M. An Epileptic Seizure Detection Technique Using EEG Signals with Mobile Application Development. Appl. Sci. 2023, 13, 9571. https://doi.org/10.3390/app13179571
Lasefr Z, Elleithy K, Reddy RR, Abdelfattah E, Faezipour M. An Epileptic Seizure Detection Technique Using EEG Signals with Mobile Application Development. Applied Sciences. 2023; 13(17):9571. https://doi.org/10.3390/app13179571
Chicago/Turabian StyleLasefr, Zakareya, Khaled Elleithy, Ramasani Rakesh Reddy, Eman Abdelfattah, and Miad Faezipour. 2023. "An Epileptic Seizure Detection Technique Using EEG Signals with Mobile Application Development" Applied Sciences 13, no. 17: 9571. https://doi.org/10.3390/app13179571
APA StyleLasefr, Z., Elleithy, K., Reddy, R. R., Abdelfattah, E., & Faezipour, M. (2023). An Epileptic Seizure Detection Technique Using EEG Signals with Mobile Application Development. Applied Sciences, 13(17), 9571. https://doi.org/10.3390/app13179571