Article

Study on Shielding Effect of the Pile Group in a Soft-Soil Foundation

1
China Railway Siyuan Survey and Design Group Co., Ltd., Wuhan 430063, China
2
Badong National Observation and Research Station of Geohazards, China University of Geosciences, Wuhan 430074, China
*
Authors to whom correspondence should be addressed.
Appl. Sci. 2023, 13(16), 9478; https://doi.org/10.3390/app13169478
Submission received: 28 July 2023 / Revised: 17 August 2023 / Accepted: 18 August 2023 / Published: 21 August 2023
(This article belongs to the Special Issue Advanced Numerical Simulations in Geotechnical Engineering II)

Abstract

:
Pile groups are frequently employed to reinforce soft soil foundations, while the piling process frequently disturbs the adjacent foundation. The shielding effect, which prevents the transmission of disturbances from pile installation, is indispensable for minimizing engineering disturbances and optimizing pile group construction techniques. However, current research focuses predominantly on characterizing the phenomenon of shielding, with a limited exploration of the mechanism. To eliminate the limitation, a numerical investigation of the shielding mechanism of pile groups in a pile–soil system is performed this study. Using the finite difference program FLAC3D and the cavity expansion theory, a three-dimensional numerical model of a pile–soil foundation was created. During the sequential penetration of piles, the response characteristics of the soil surrounding the piles were investigated. Displacement field was first investigated to determine the presence of shielding effects in the pile group and then highlighted the effective role of the existing piles in controlling deformation. Furthermore, through a combined analysis of the stress and strain fields during piling, the mechanism of the shielding effect induced by pile construction is proposed, which is attributed to the direct obstruction effect of piles and the “soil arching effect” created by the soil between piles. The former is reflected by the direct barrier of the existing pile to the soil displacement induced via the installation of the new piles. The latter is reflected by the obstruction of soil between two existing piles to the displacement of soil passing through the two existing piles. This research provides a comprehensive understanding of the mechanical behavior of the pile–soil system and has practical implications for controlling disturbances and optimizing construction techniques in piling engineering projects.

1. Introduction

In regions with deep soft soil, pile group schemes are frequently used to reinforce the foundation of infrastructure in order to control settlement. Hydrostatic piles are widely used in soft soil foundations due to their high strength, efficient construction, and low noise generation [1]. However, the installation of hydrostatic piles generates horizontal additional stress in the surrounding soil, which can easily induce deformation in the adjacent foundation and cause damage to existing structures. As urban land resources become increasingly scarce, many construction projects are conducted in close proximity to residential buildings, railways, and bridge structures, amplifying the issue of disturbance resulting from pile installation. Notably, the deformation control of high-speed railway embankments in soft-soil areas has received significant attention [2]. Given the extremely high speeds of trains, even minor disturbances in the embankment can pose considerable risks [3]. Therefore, research on disturbance control during piling holds great significance for infrastructure development in soft-soil areas.
Research on disturbance effects during hydrostatic pile installation has long been a focal point. Some field monitoring studies [4,5,6] and model experiments [7,8,9] have investigated the disturbance effects from piling on the surrounding soil, but long durations and high costs were required to reach an intuitive and accurate result. In terms of the analytical characterization of piling, researchers first proposed the cavity expansion method (CEM) [10,11,12,13] and the strain path method (SPM) [14,15] based on extensive theoretical and practical experience. In recent years, numerical simulation techniques have rapidly advanced. Many studies employed finite element methods to simulate the pile installation process using software. Simulations of single-pile installations have achieved promising results, as techniques such as the coupled Eulerian–Lagrangian (CEL) method [16,17,18], the arbitrary Lagrangian–Eulerian (ALE) method [19,20,21], the material point method (MPM) [22,23,24] and the press–replace method (PRM) [25,26] are efficient at addressing grid distortion issues in pile penetration models. However, when multiple piles are present in the penetration model, computational efficiency tends to decrease [27]. In comparison, the expansion model based on the cavity expansion method has a better simulation effect on pile group installation [28,29,30,31,32], and is also the method used in this study.
The shielding effect is significant for piling sequences and construction technology. Existing studies have pointed out the presence of a “shielding effect” during pile installation. Luo et al. (2020) proposed a two-pile analytical model for soil displacement based on the shielding effect [33]. Zhou et al. (2021) further investigated the response mechanisms of existing piles and of soil to the neighboring pile installation, and enhanced the analytical model for pile group responses based on the shielding effect [34]. In addressing the shielding effect, some studies have compared the magnitude of disturbance caused by different pile group construction sequences and provided optimized construction approaches for pile groups. Shan et al. [35] and Nguyen et al. [32] established numerical models for bored piles and CMC piles, respectively, comparing the lateral displacement response of soils under different sequential construction orders, and then they concluded that constructing the pile closest to the disturbance control zone first, followed by piles farther away, resulted in smaller soil disturbances. Le Kouby et al. [36] conducted model experiments to verify the shielding effect of previously installed surrounding piles on subsequently installed center piles, and Geramian et al. [37] reached the same conclusion through finite element numerical simulations. Although several theories and models have been proposed, current research mainly focuses on describing the shielding phenomenon, with a limited exploration of the mechanisms behind the shielding effect. This limitation restricts its applicability in more complex construction environments and technologies. For the further enhancement and validation of the theoretical framework, it is essential to conduct experiments and numerical simulations.
As a result, this paper presents a numerical study on the disturbance effects and shielding mechanism with a typical pile group, a soft soil system, using the case of a high-speed railway project in China. The finite difference program FLAC3D is utilized to simulate the piling process of a pile group, employing the cylindrical–spherical expansion method. Multiple response characteristics, such as displacements, stresses, and strains, were analyzed to systematically investigate the mechanisms underlying the shielding effects induced by pile group construction in the soft soil foundation. The research findings may provide valuable guidance for minimizing disturbances during pile group construction in soft-soil regions.

2. Materials and Methodology
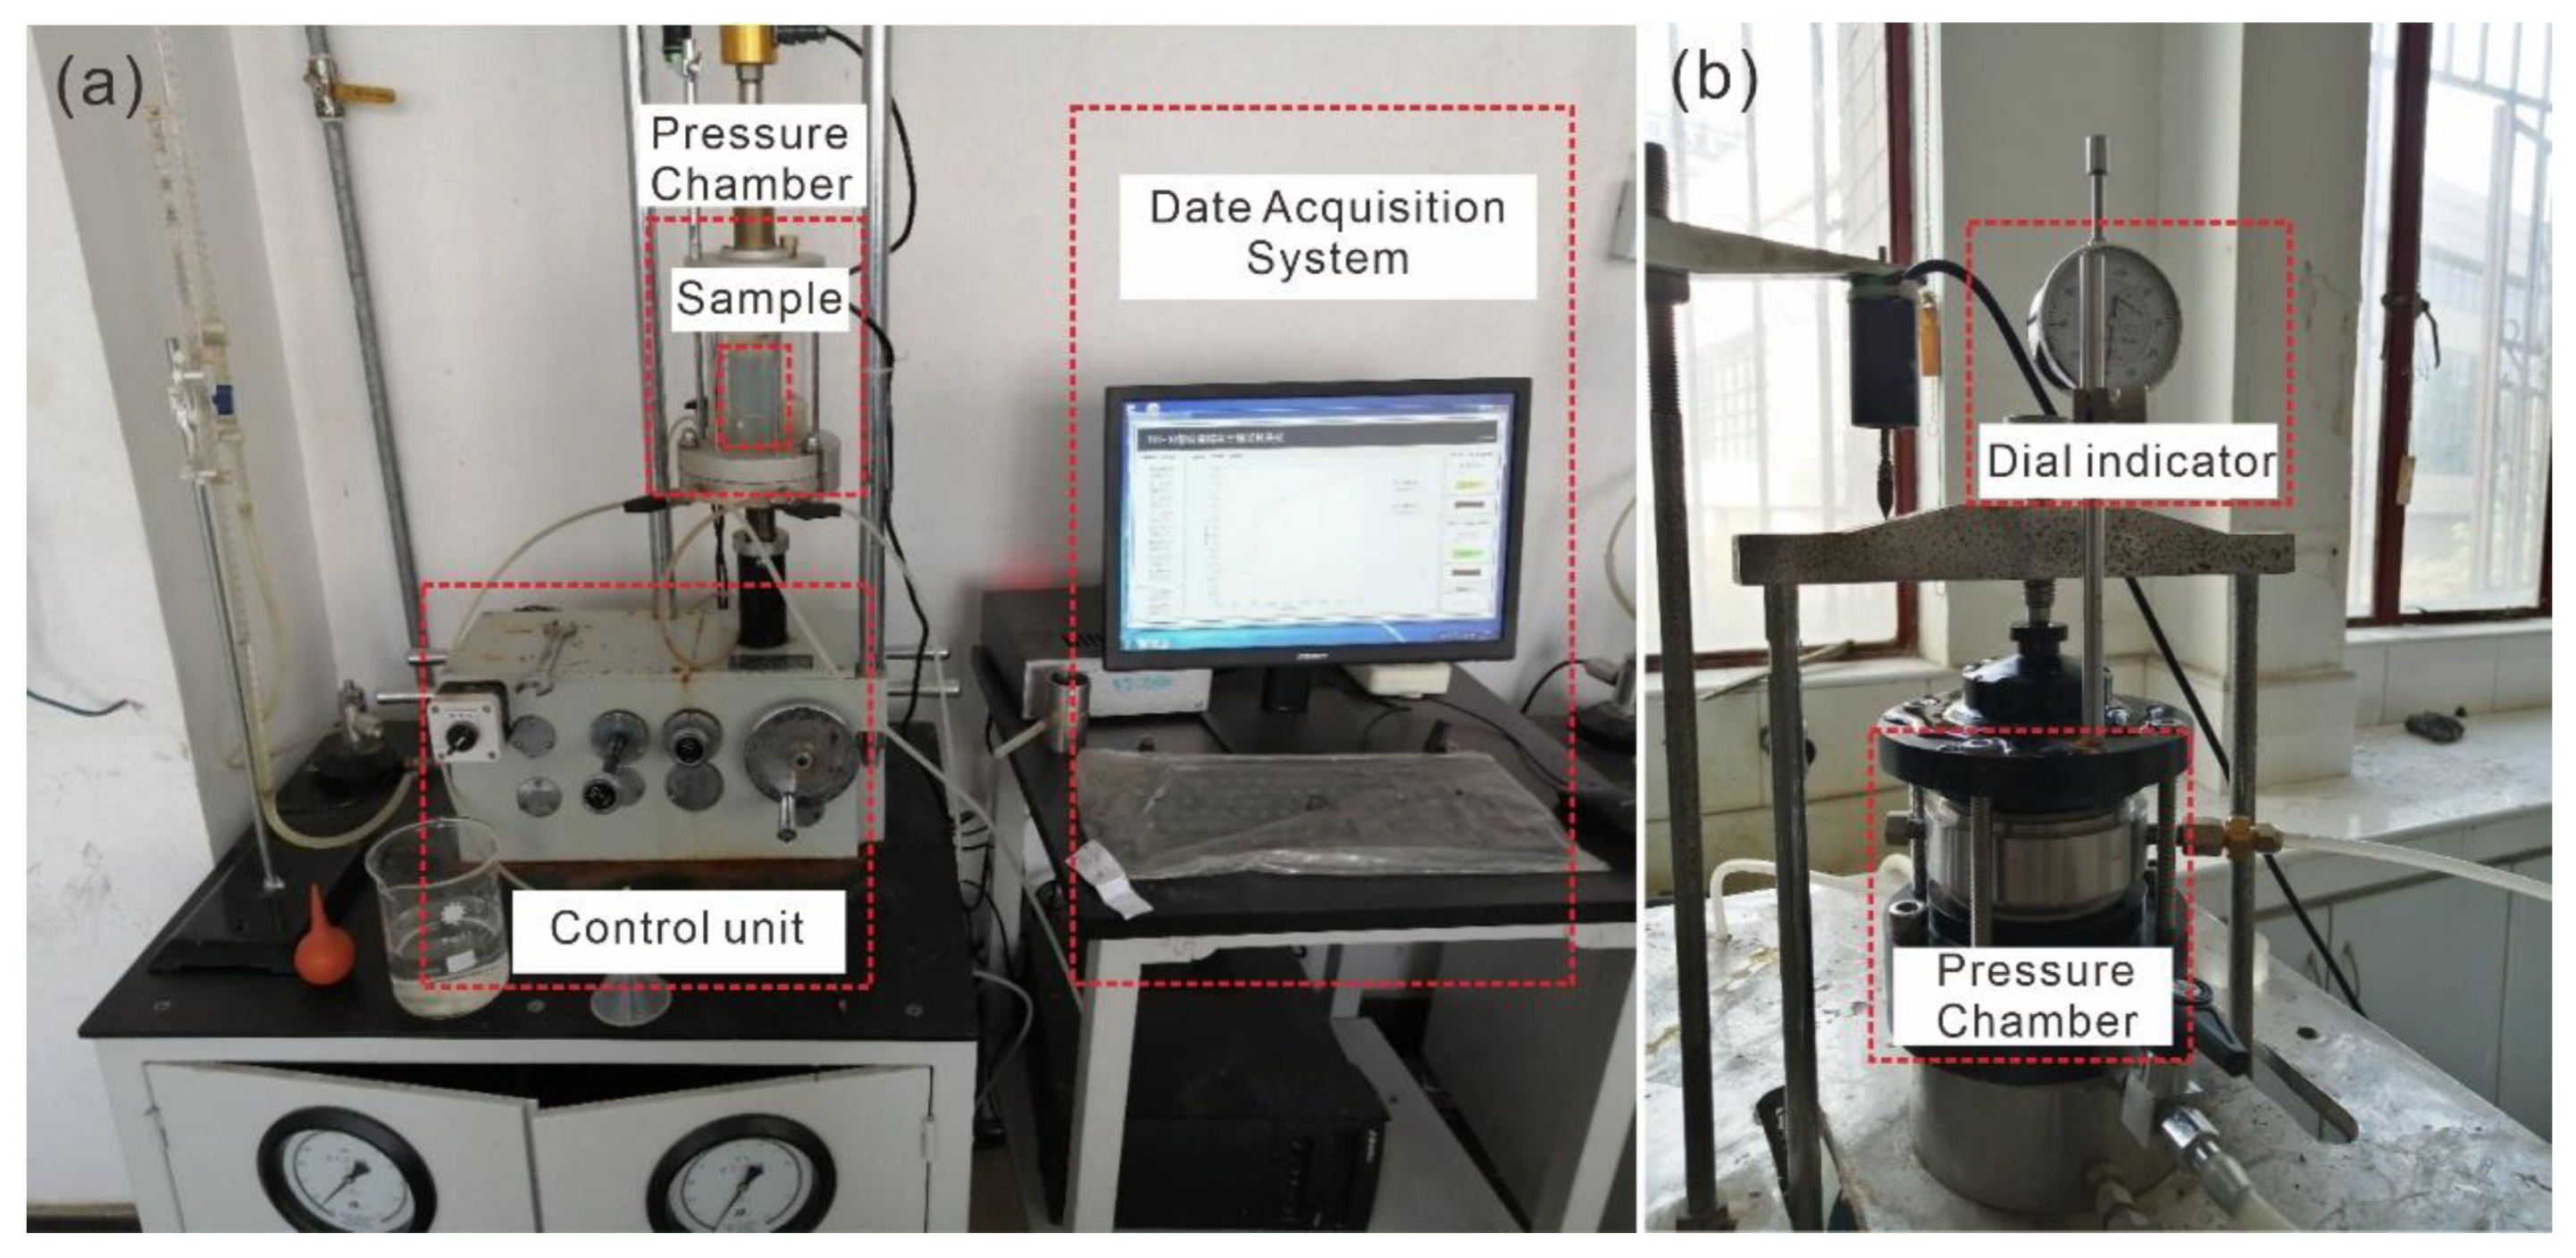
2.1. Samples

The study is based on a high-speed rail project in Taicang, a city in eastern China on the alluvial plains of the lower Yangtze River, where the terrain is flat and open, and the foundation of the site is relatively homogeneous silty clay with a thickness of more than 30 m. To simulate the mechanical behavior of the soft soil in FLAC3D, a modified Cam–Clay model built into the software was employed in the finite element analysis, as this model has been validated to be suitable for describing the pile–soil interaction in soft-soil areas, and a limited number of input parameters are required [38,39]. Since the soil of the site is relatively homogeneous, the foundation is simplified into a homogeneous soft soil in the model in order to more intuitively analyze the disturbance mechanism of pile installation, and the parameters of the foundation soil are obtained through the following experiments.
Natural density, natural moisture content, and specific gravity were measured using the ring knife method, drying method and specific gravity bottle method, and the initial porosity ratio was converted via the above three indexes.
The critical failure ratio (M) is the slope of the critical state line, which is related to the effective stress friction angle of the Mohr–Coulomb yield function. To obtain the effective stress friction angle, a series of triaxial shear tests were performed using the TSY10-1.0 strain-controlled triaxial apparatus (Figure 1a), which was manufactured by Jiangsu Yongchang Science and Education Instrument Manufacturing Co., Ltd. in Yongchang, China. The testing system comprises a pressure chamber, axial compression equipment, a surrounding pressure system, back pressure system, pore water pressure force measurement system, as well as an axial deformation and volume change measurement system. During the experiment, four soil samples with dimensions of Φ 391 × 800 mm were saturated using the vacuum saturation method. Confining pressures of 100, 200, 300, and 400 kPa were, respectively, applied to the specimens, while the shear rate was set at 0.0064 mm/min. The confining pressure was modulated through a hydraulic servo controller, and axial deformations were automatically collected. The experiment was concluded upon reaching an axial strain of 20%.
The compression index (Cc) and rebound index (Cs) of soil are the other two essential parameters that characterize soil deformation. They were successfully obtained from the K0 consolidation compression–unloading test conducted on the soil sample. The test was performed on a sample with a diameter of 6.18 cm and a height of 4 cm, following the vacuum saturation method. The GJY-type K0 consolidation apparatus, manufactured by Nanjing Ningxi Soil Instrument Co., Ltd. in Nanjing, China, was used for this experiment, as shown in Figure 1b. All air bubbles were eliminated from the sealed pressure chamber and pressure measurement system before the test was started. The water pressure inside the sealed pressure chamber was not allowed to exceed 3 kPa. During the test, lateral pressure was exerted through the water pressure in the enclosed compression chamber. Vertical loads of 12.5, 25, 50, 100, 200, 300, 400, 300, 200, 100, 50, 25, 12.5 and 0 kPa were sequentially applied to the top surface of the sample using calibrated weights, and the vertical displacements were measured using displacement sensors. The duration of each load level was governed by a vertical deformation rate of at least 0.01 mm per hour.
The reference porosity ratio (e1) is the porosity ratio on the NCL line when the pressure applied is 1 kPa. The over-consolidation ratio (R) is set to 2 through the survey data of the site. Therefore, a summary of the soil model parameters is provided in Table 1.

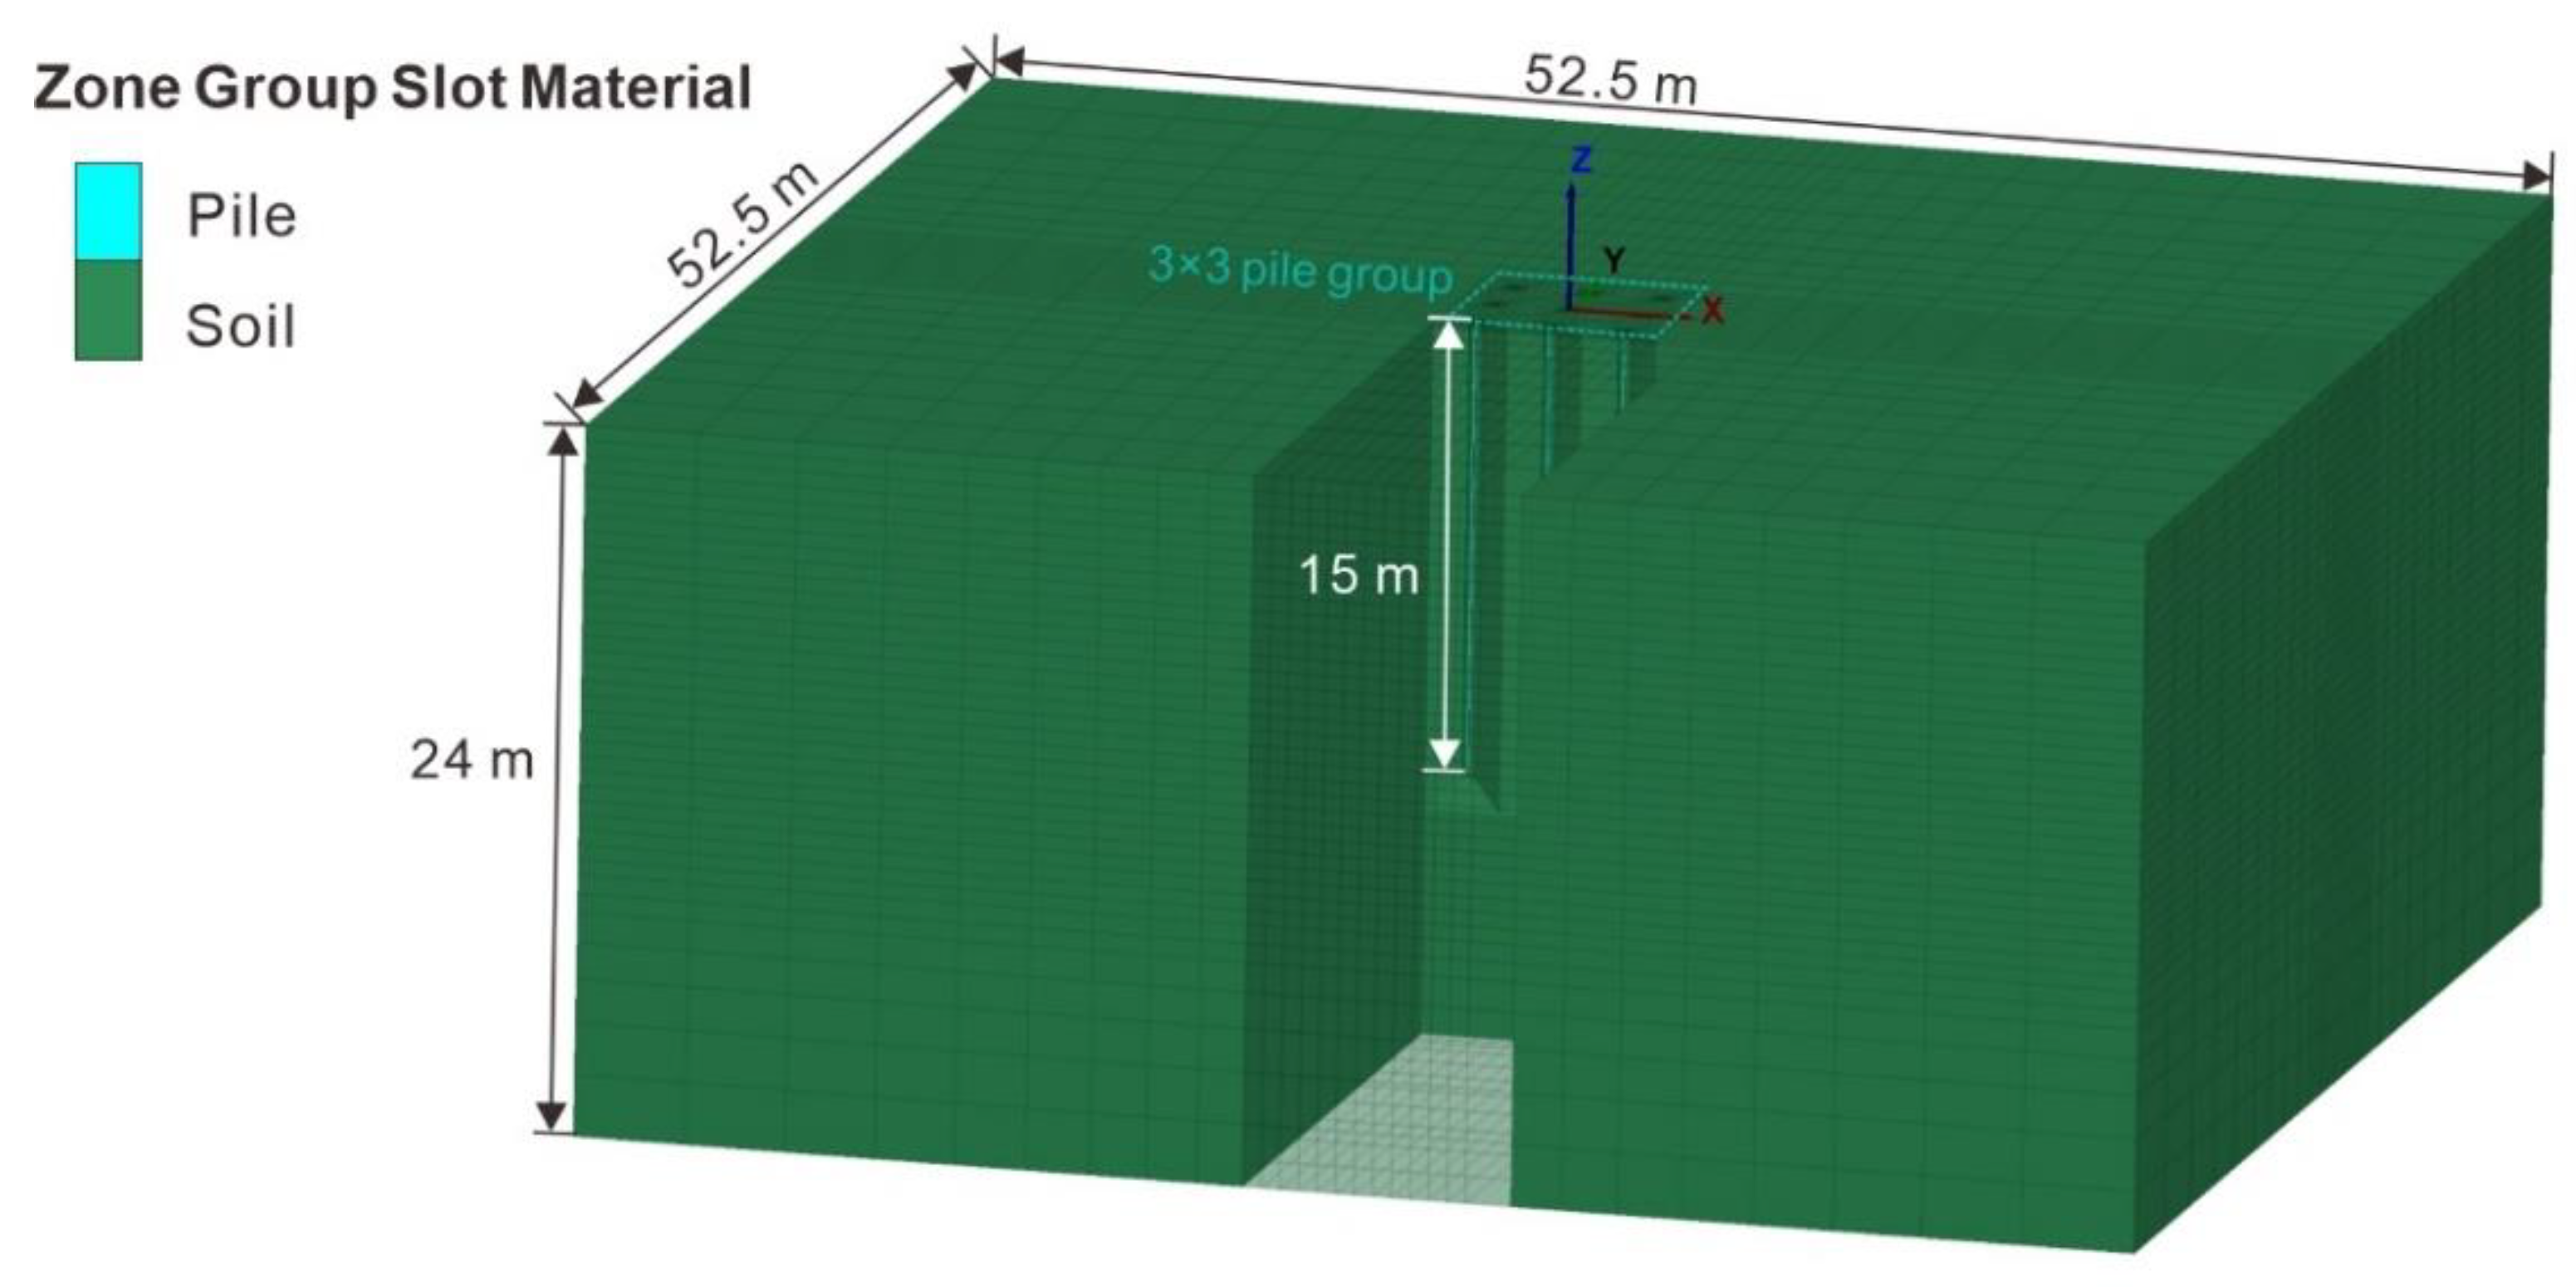
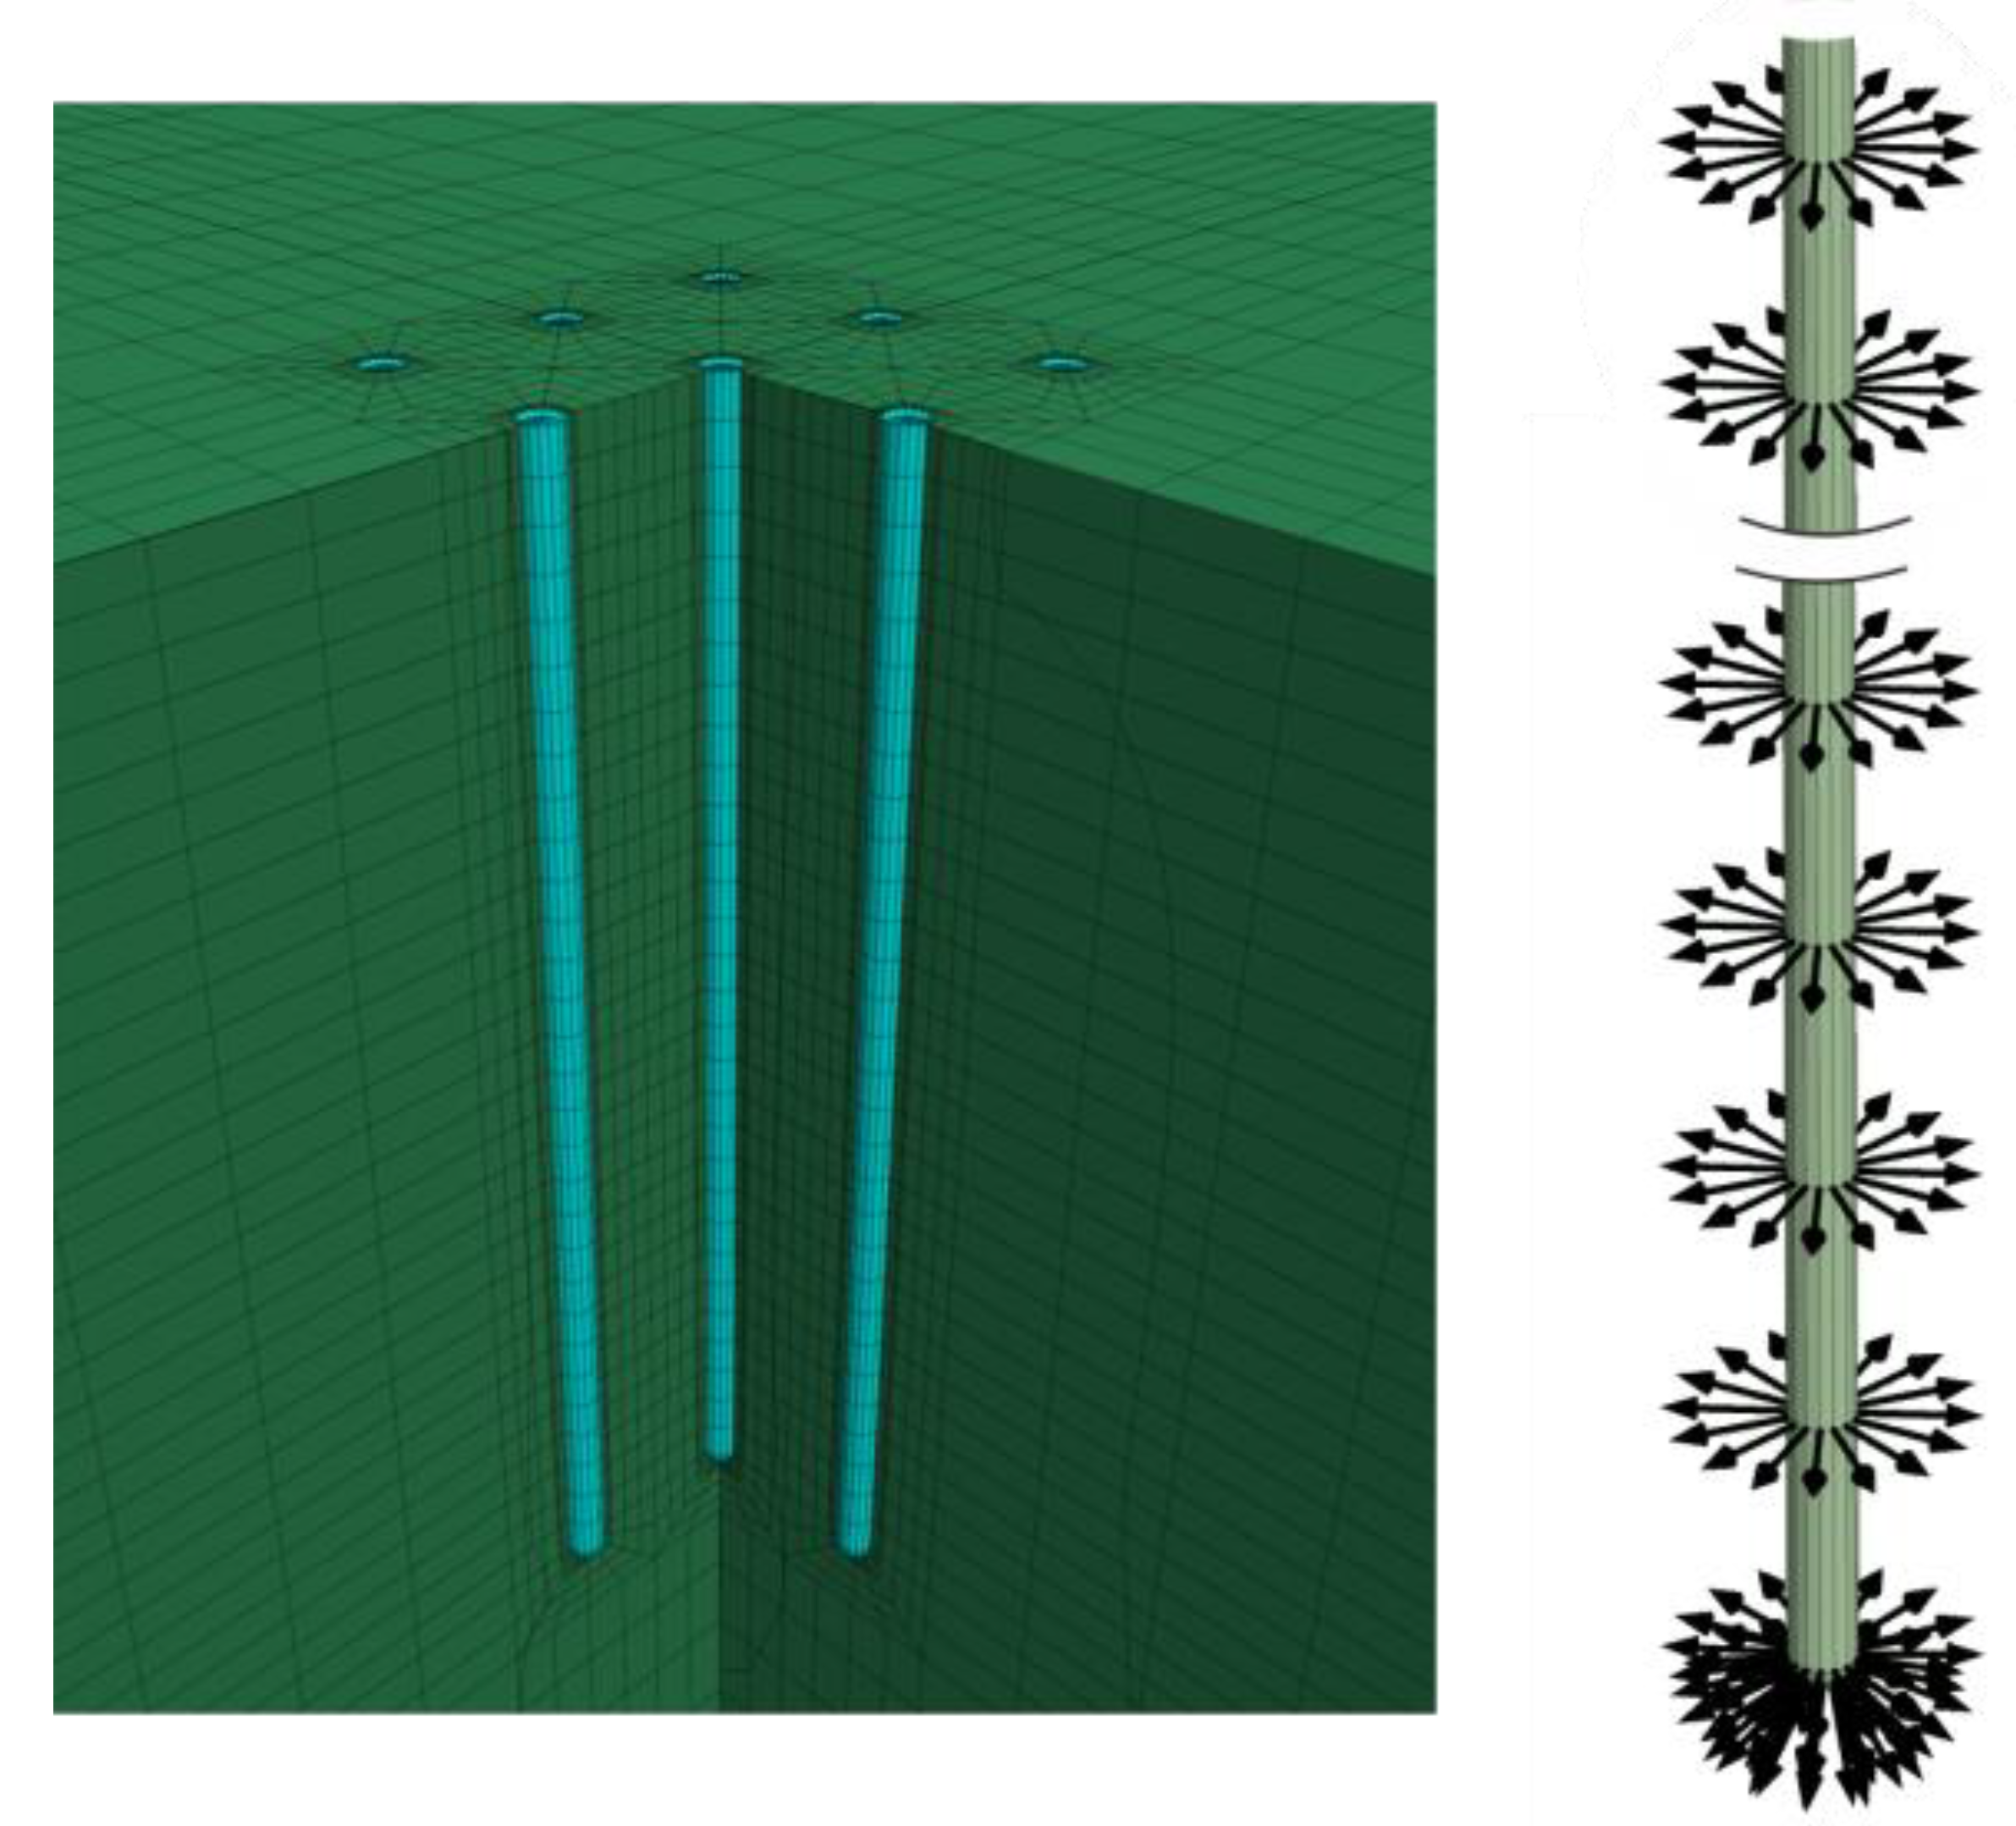
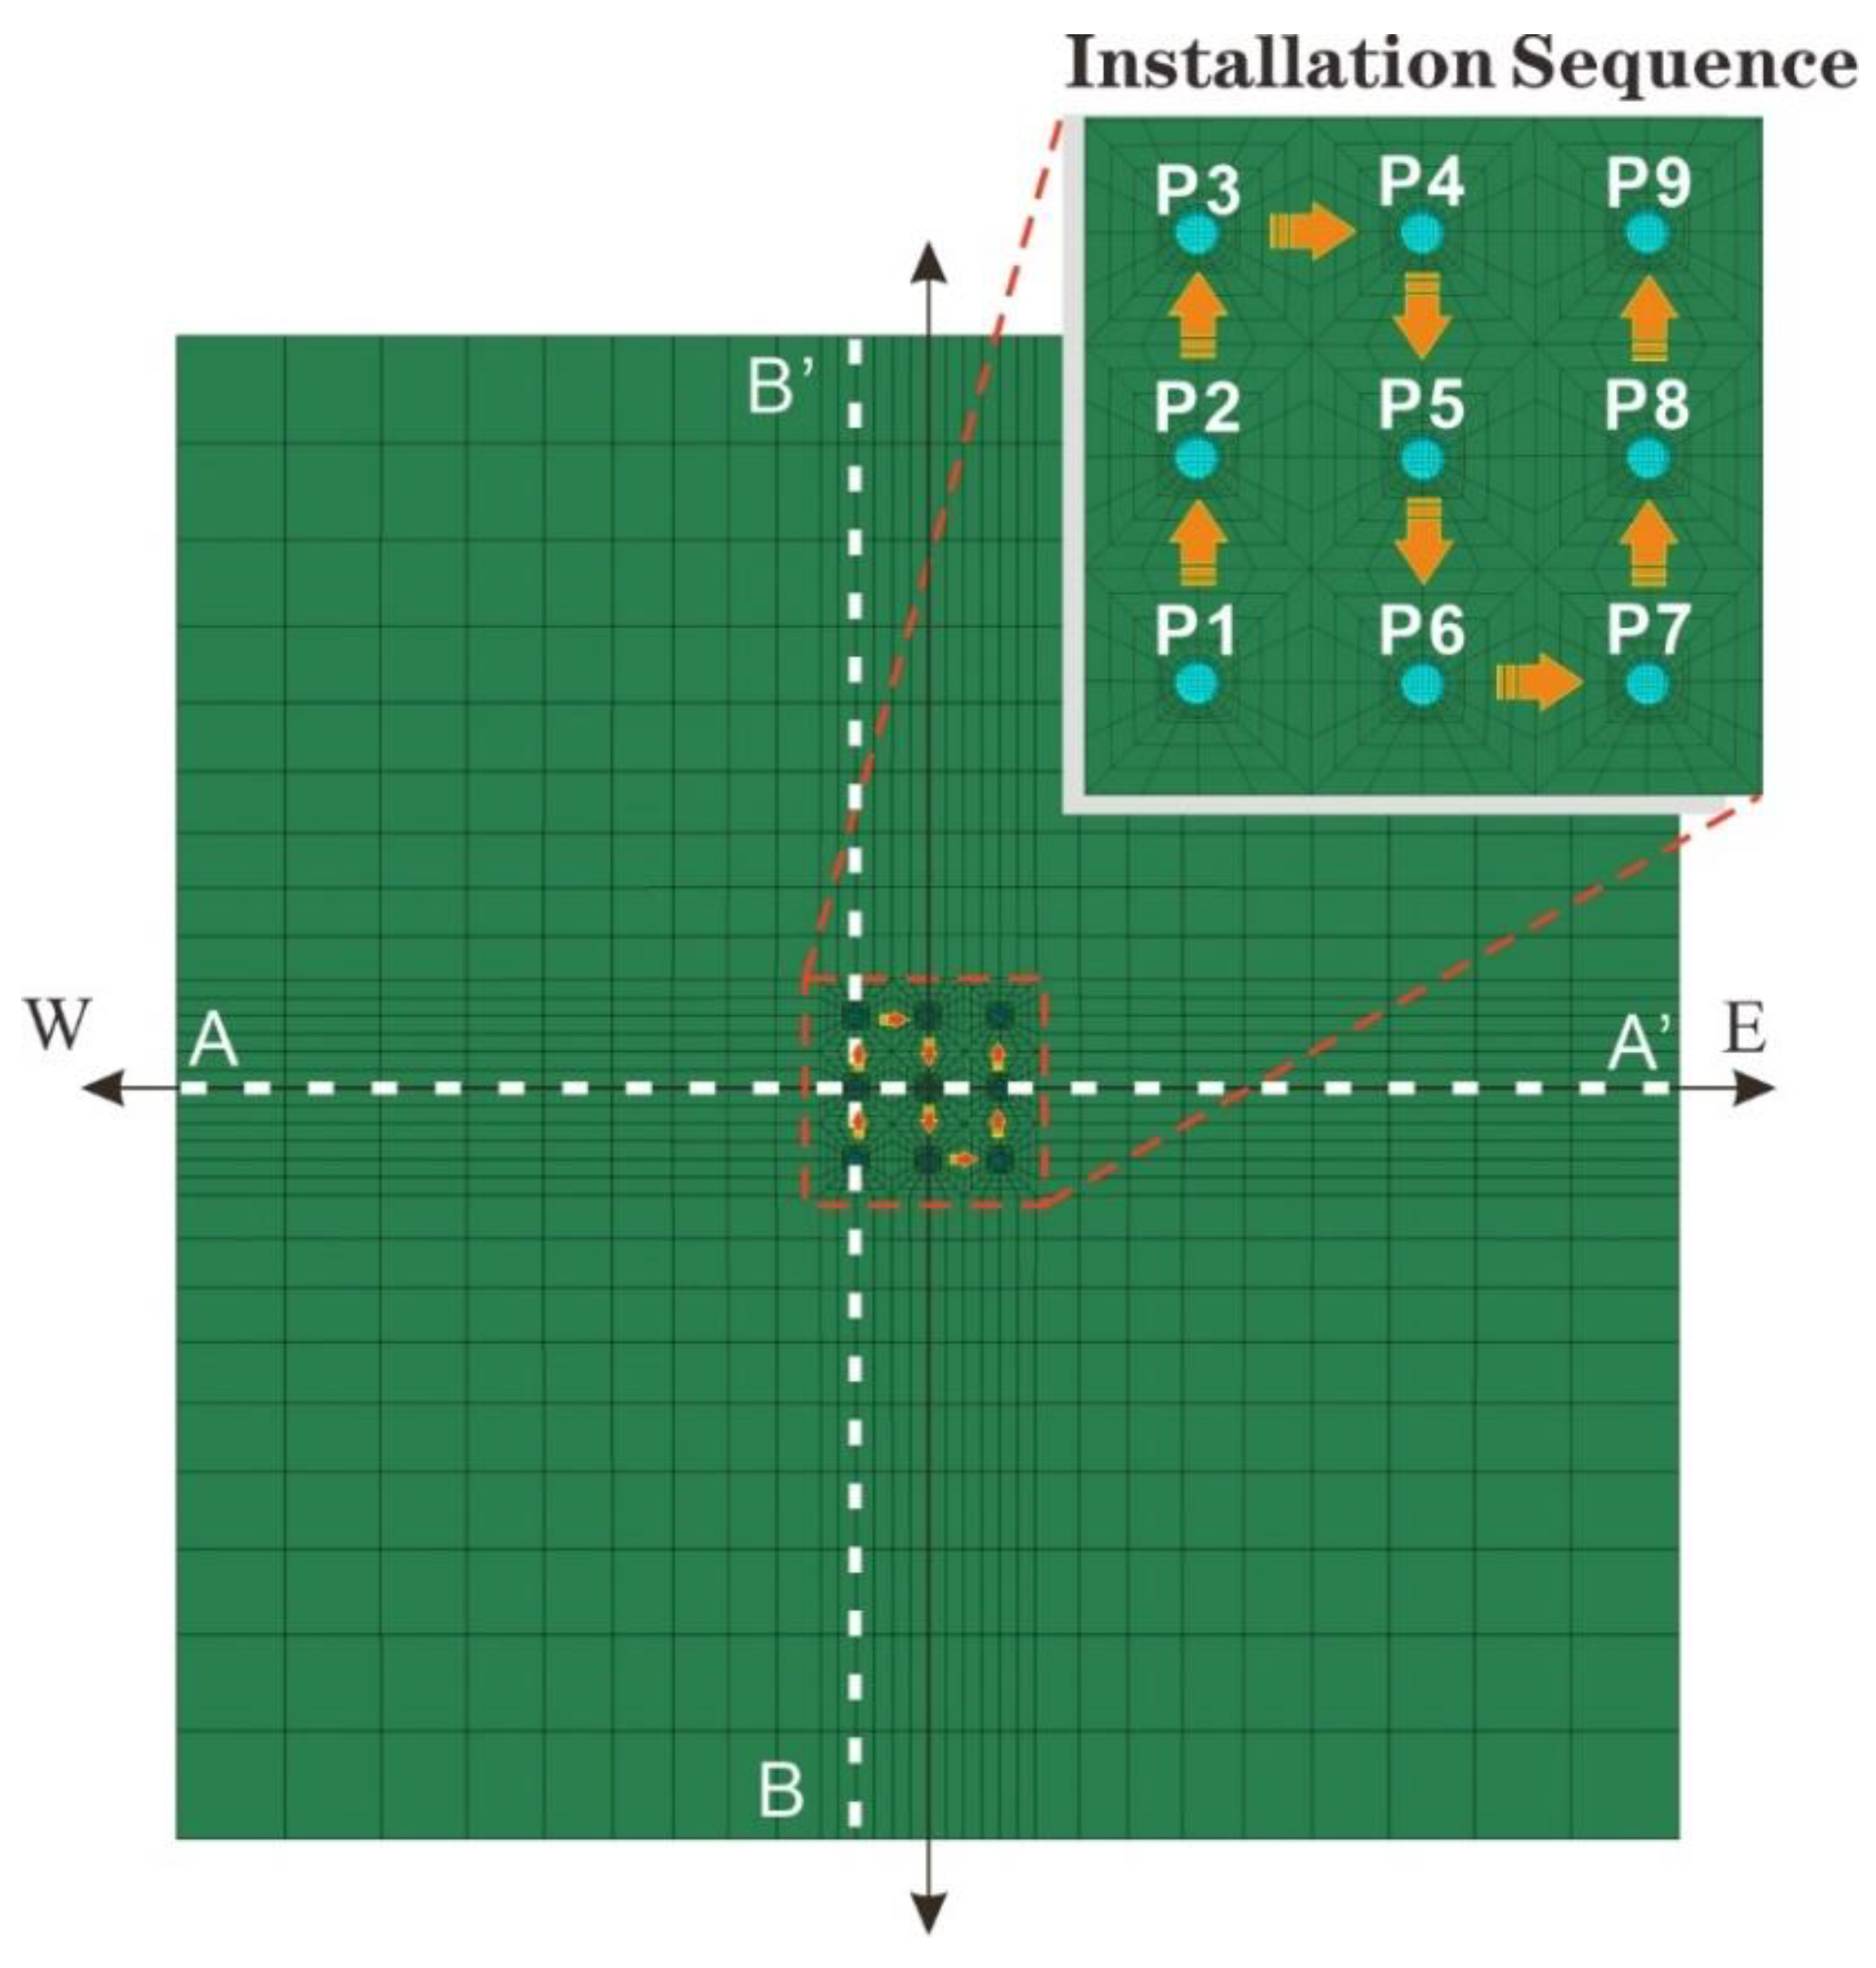
2.2. Numerical Modeling

A three-dimensional numerical model of a foundation containing a pile group was established to study the hydrostatic pile–soft soil interaction, using the FLAC3D Version 7.0 software. In the modeling, both piles and the soft soil foundation were constructed using solid elements. Specifically, the construction of pile zones and adjacent soil zones was conducted based on the geometric parameters of the piles; the pile tip was set to be semi-spherical and the pile shaft was cylindrical. The piles had a diameter of 0.25 m and a length of 15 m, establishing a 2.5 m spaced matrix of pile group. To facilitate the analysis, the soft soil layer was presumed to be homogeneous. Thus, a symmetric three-dimensional numerical model was developed, centered on a 3 × 3 pile group (Figure 2). Considering the special properties of the soft soil foundation, the boundaries were assumed to be impervious. The top boundary of the grid was set to the stress-free ground surface, and normal displacement constraints were applied around and at the bottom of the model. To eliminate the influence of boundary effects, the distances from the model edges to the pile group edges in the horizontal direction were greater than 1.5 times the pile length, and the bottom edge was greater than 0.6 times the pile length. Finally, a grid model of 52.5 m × 52.5 m × 24 m was established (Figure 2), comprising a total of 76,068 zones and 80,015 grid points.
Thereafter, the model parameters (Table 1) were assigned to the soil. To compute the initial state of the numerical model, initial ground stresses were imposed. Subsequently, pile installation was simulated based on the cavity expansion theory. Soil compaction during piling was simulated by simultaneously expanding the pile body and the pile tip to reach the final pile diameter; for this simulation, the initial radius was set to one-third of the final radius. The pile was modeled using an elastic constitutive model, and the parameters in the model are consistent with the standard parameters of the precast pile used in this project, as shown in Table 2. The procedure of installing piles primarily involved expanding the cylinder (pile body) and semi-sphere (pile tip), then activating the pile grids. To realize this, the reserved pile position grids were initially closed, and expansion displacement vectors were applied (Figure 3). After reaching the actual pile diameter, the adjusted node pile body grids were activated, and the displacement and stress fields of the completed pile–soil interaction were computed. As this study focuses on the lateral interaction between pile and soil, the interface element is not defined as a simplification. This numerical simulation method, which approximates the pile installation process to the expansion of a finite radius cavity, has been implemented in previous studies [31,32].

2.3. Methodology

Figure 4 demonstrates the most typical installation sequence in engineering practices that was adopted for the numerical pile group, where the piles were driven sequentially from the negative X-axis direction to the positive X-axis direction, totaling 9 piles (P1–P9) in a 3 × 3 distribution. Due to the symmetrical distribution of the numerical model, the influence of various piling sequences on soil can be easily realized by observing at various directions. Therefore, to clearly observe the shielding effects, two opposite piling sequences were determined to be compared by setting monitoring points to the west and the east off the pile group. Thus, one sequence (W direction) indicated that piles were penetrated and moved away; the other sequence (E direction) indicated that the piles were penetrated and moved closer. Additionally, two parallel monitoring profiles, A-A′ and B-B′, were established along the X and Y axis to conduct further analysis.
According to our early numerical simulation tests, during expansion, the vertical interaction between the pile and soil is weak, and the shielding effect should be explained by focusing on the lateral interaction between the pile and soil. Thus, the lateral displacement and lateral stress of the soft soil foundation were assumed as the disturbance indicators. The response characteristics of the displacement field, stress field as well as strain field of the soil will be simulated and discussed to verify the applicability of the model. Subsequent investigations will explore the shielding effects caused by pile squeezing, and ultimately make clear the shielding mechanism of the pile group.

3. Results

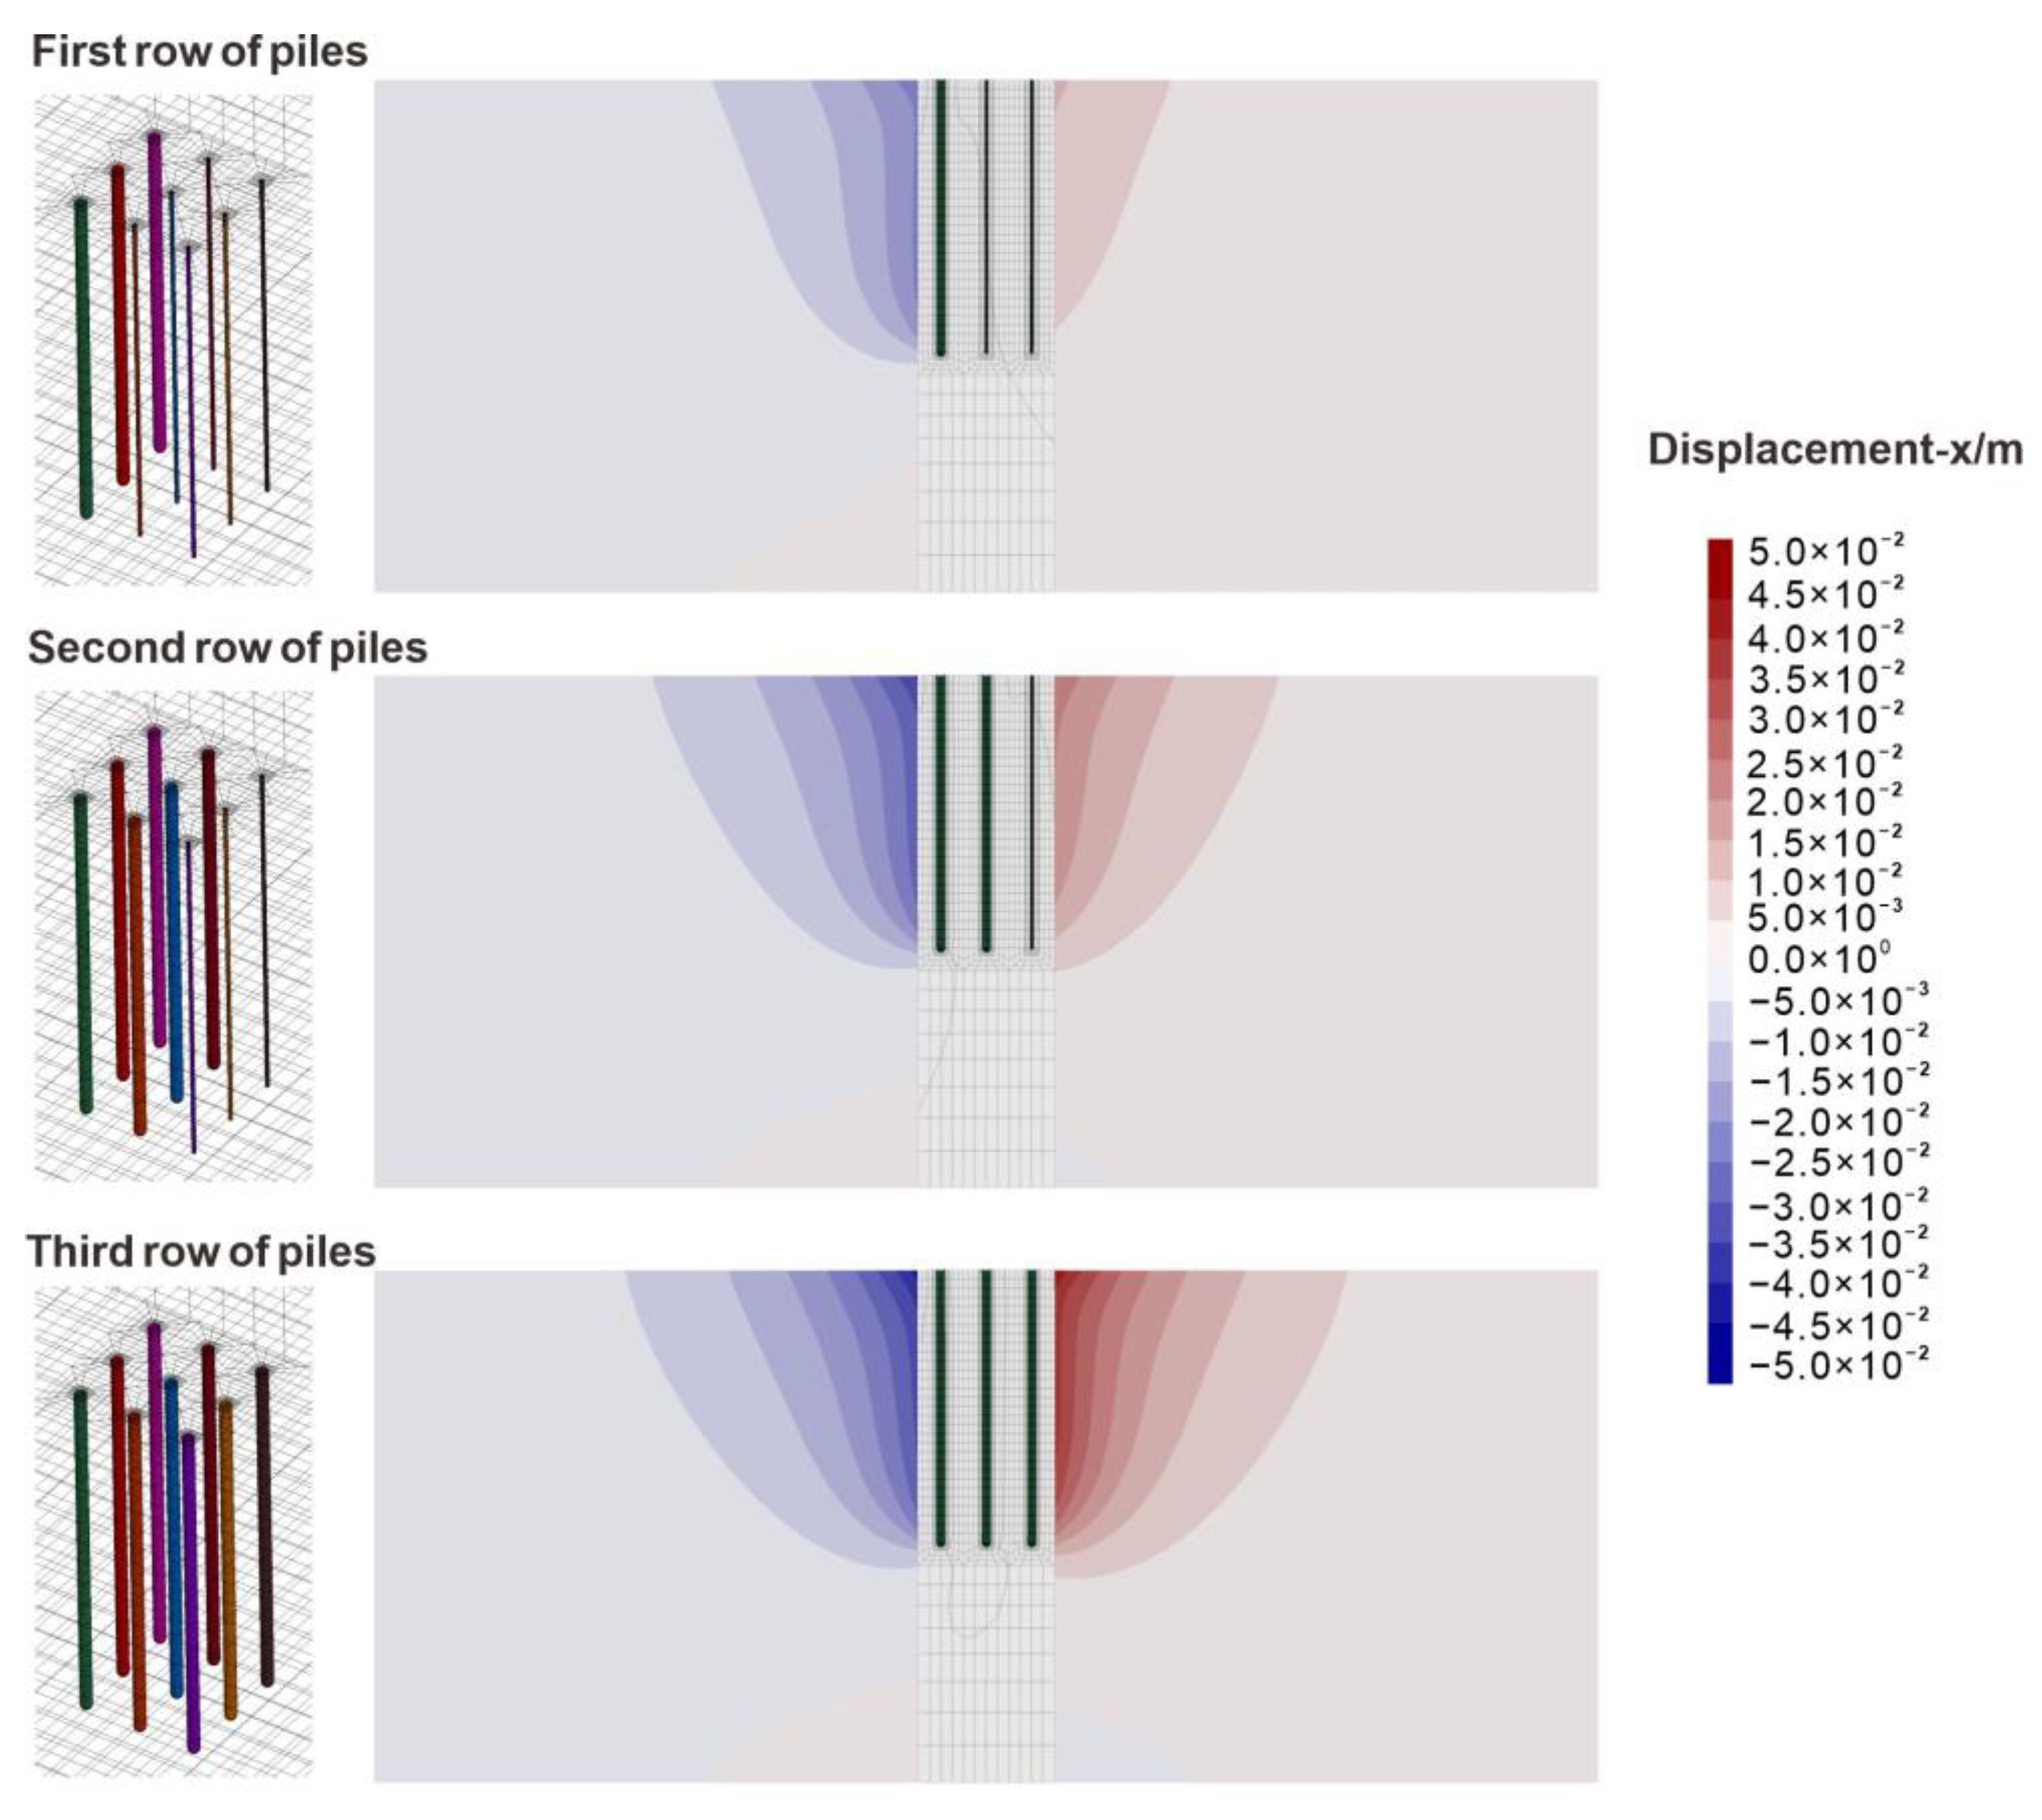
3.1. Displacement Analysis

Figure 5 depicts the variation in the lateral displacement of the soil along the A-A′ profile during the sequential installation of three rows of hydrostatic piles. As the three rows of piles are successively installed, the displacement off both sides of the pile group increases. The lateral displacement curve takes a parabolic shape, where smallest values appear at the bottom and larger values appear in the shallow ground. Following the installation of the first row of piles, the left region experiences a significant increase in displacement, while the right region only has a minor increase in displacement. After the installation of the second row, the displacement in both sides increase, with the displacement on the left side being greater; even so, the displacement increase caused by the second row of piles is noticeably smaller on the right side. After the third row of piles is installed, the accumulated displacement on the right side exceeds that on the left. This indicates that the first and second rows of piles effectively controlled the deformation of the left side, namely the shielding effect.
To quantify the response characteristics of the shielding effect in the displacement field, a comparison study was conducted between the “actual accumulative displacement” of single-row piles considering the shielding effect and the “superimposed accumulative displacement” without the shielding effect. After the installation of three rows of piles, monitoring point A (see Figure 6b) was established at a distance of 2.5 m from the left side of the first row of piles, and the horizontal displacement of the soil at this location, defined as the “actual displacement”, was measured. Since the distances from the first, second, and third rows of piles to point A are 2.5 m, 5.0 m and 7.5 m, respectively, the superimposed accumulative displacement could be acquired by summing up the displacement obtained at individual rows (Figure 6a,c–e). Comparing the two displacement types revealed that the superimposed accumulative displacement was 21.43% greater than the actual accumulative displacement (Figure 6f).
Further, dynamic disturbance characteristics of soil as well as existing piles during the sequential piling were investigated, regarding both the magnitude and direction of the disturbance. In Figure 7, monitoring points were set to dynamically track the displacement trajectories of the pile heads (circles) and the ground surface soil (rectangles). Specifically, the red circles represent the undisturbed pile head, and the black circles indicate the updated pile positions after the installation of each new pile. Similarly, the blue rectangles represent the undisturbed soil positions, while the black ones indicate the track of the soil after each pile was installed. Notably, these trajectories have all been visually amplified so that the variations can be seen clearly. The results demonstrate that each penetration of pile induces a directional disturbance both on the soil and piles. Given the sequential installation of the piles from the W direction to E direction, the pile head trajectories go towards the W direction. For the soil, the final displacement at point A in the W direction is 32.55 mm, which is smaller than the lateral displacement of 33.92 mm at point B in the E direction. After the first row of piles was driven, point A experienced significant displacement, while the installation of the subsequent two rows of piles resulted in obviously smaller displacement; for point B, the displacement caused by the first row of piles was not large, but the displacement caused by the third row of piles was significant. The final displacement of point A was smaller than that of point B, indicating that a shielding effect was formed for point A given this piling sequence. Furthermore, for the first row of piles, the disturbance induced by the installation of the last three piles was significantly greater than that of the soil mass (point A), which indicates that the pile itself contributed to the shielding effect.
Figure 8 depicts the lateral displacements caused by soil compression in the E and W directions after piling, with the starting points being the model’s center (center of P5). As the pile spacing is 2.5 m and the pile radius is 0.25 m, the displayed data starts only from HD (horizontal distance) = 2.75 m, referring to the soil zones immediately adjacent to the outer perimeter of the pile group. The results indicate that disturbance magnitudes on the soil of both sides are distinct, where larger deformation is observed for the soil of the east side. As discussed above, this phenomenon comes from the shielding effect from the first row of piles (P1, P2 and P3). Additionally, the disturbance range is indicated as well; that is, the pile installation no longer affects the foundation soil from HD = 15 m.

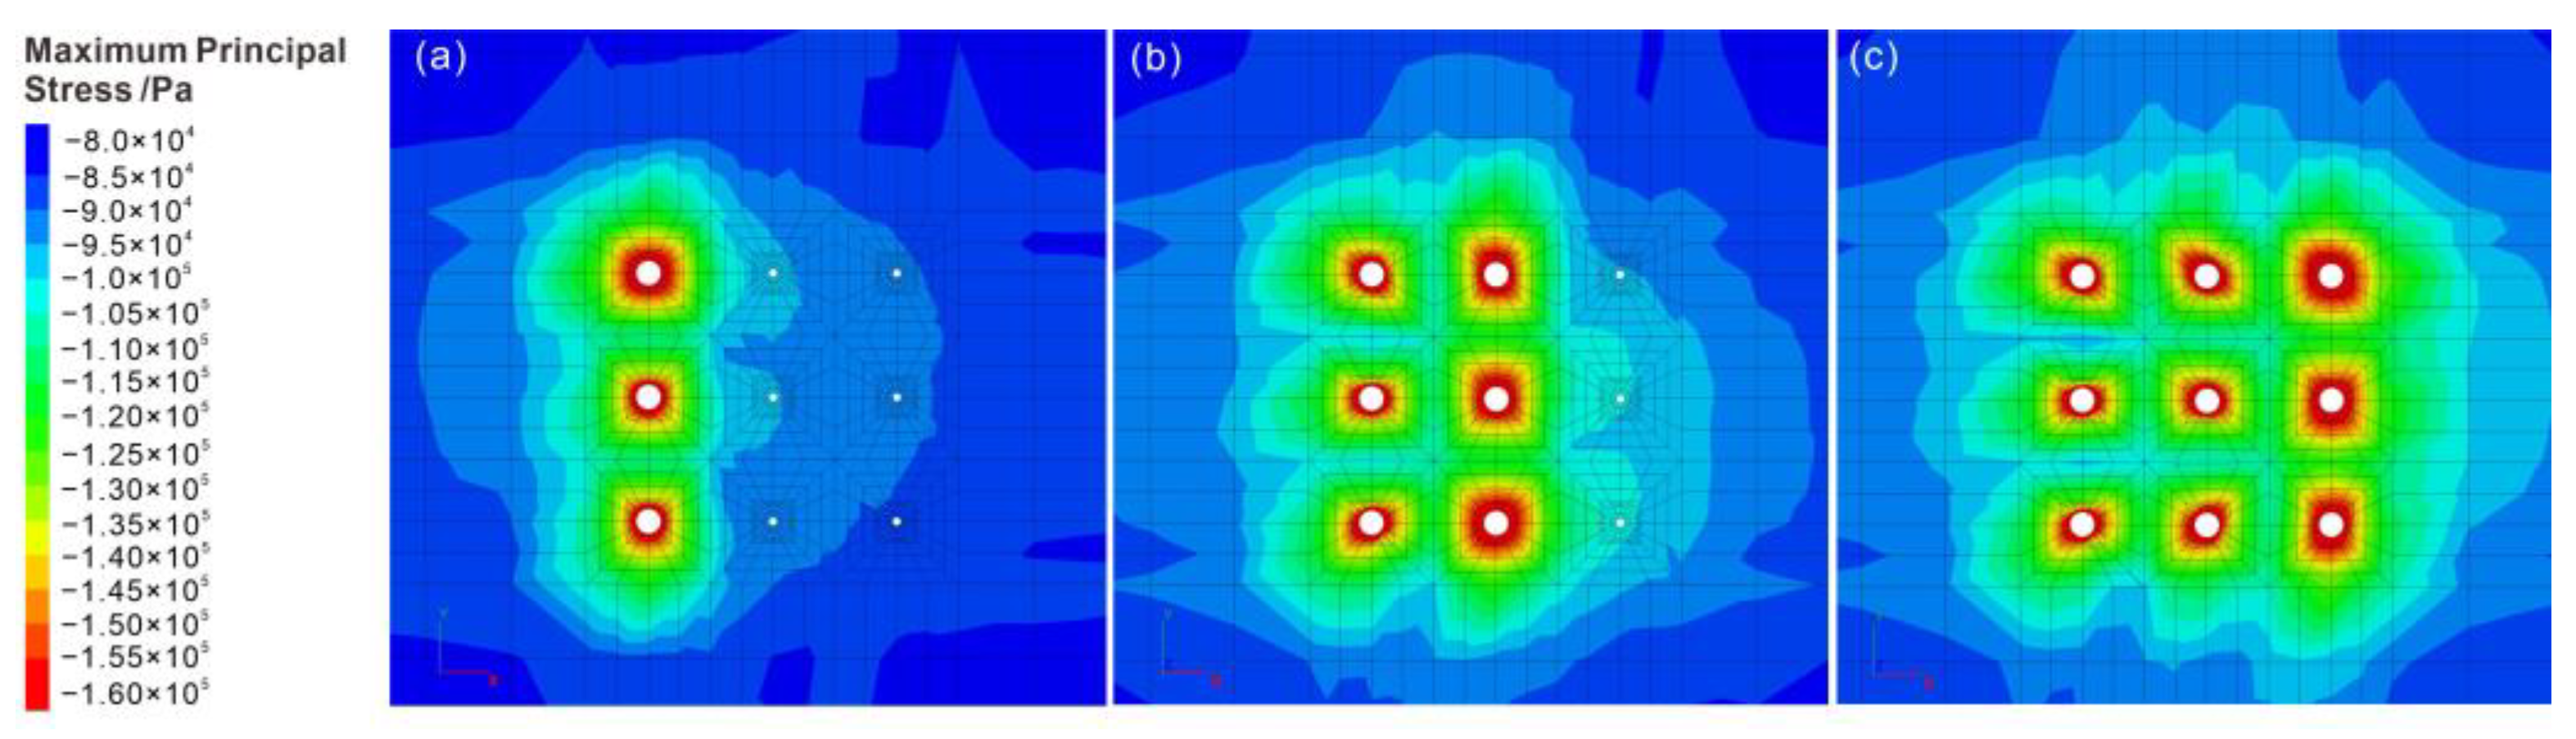
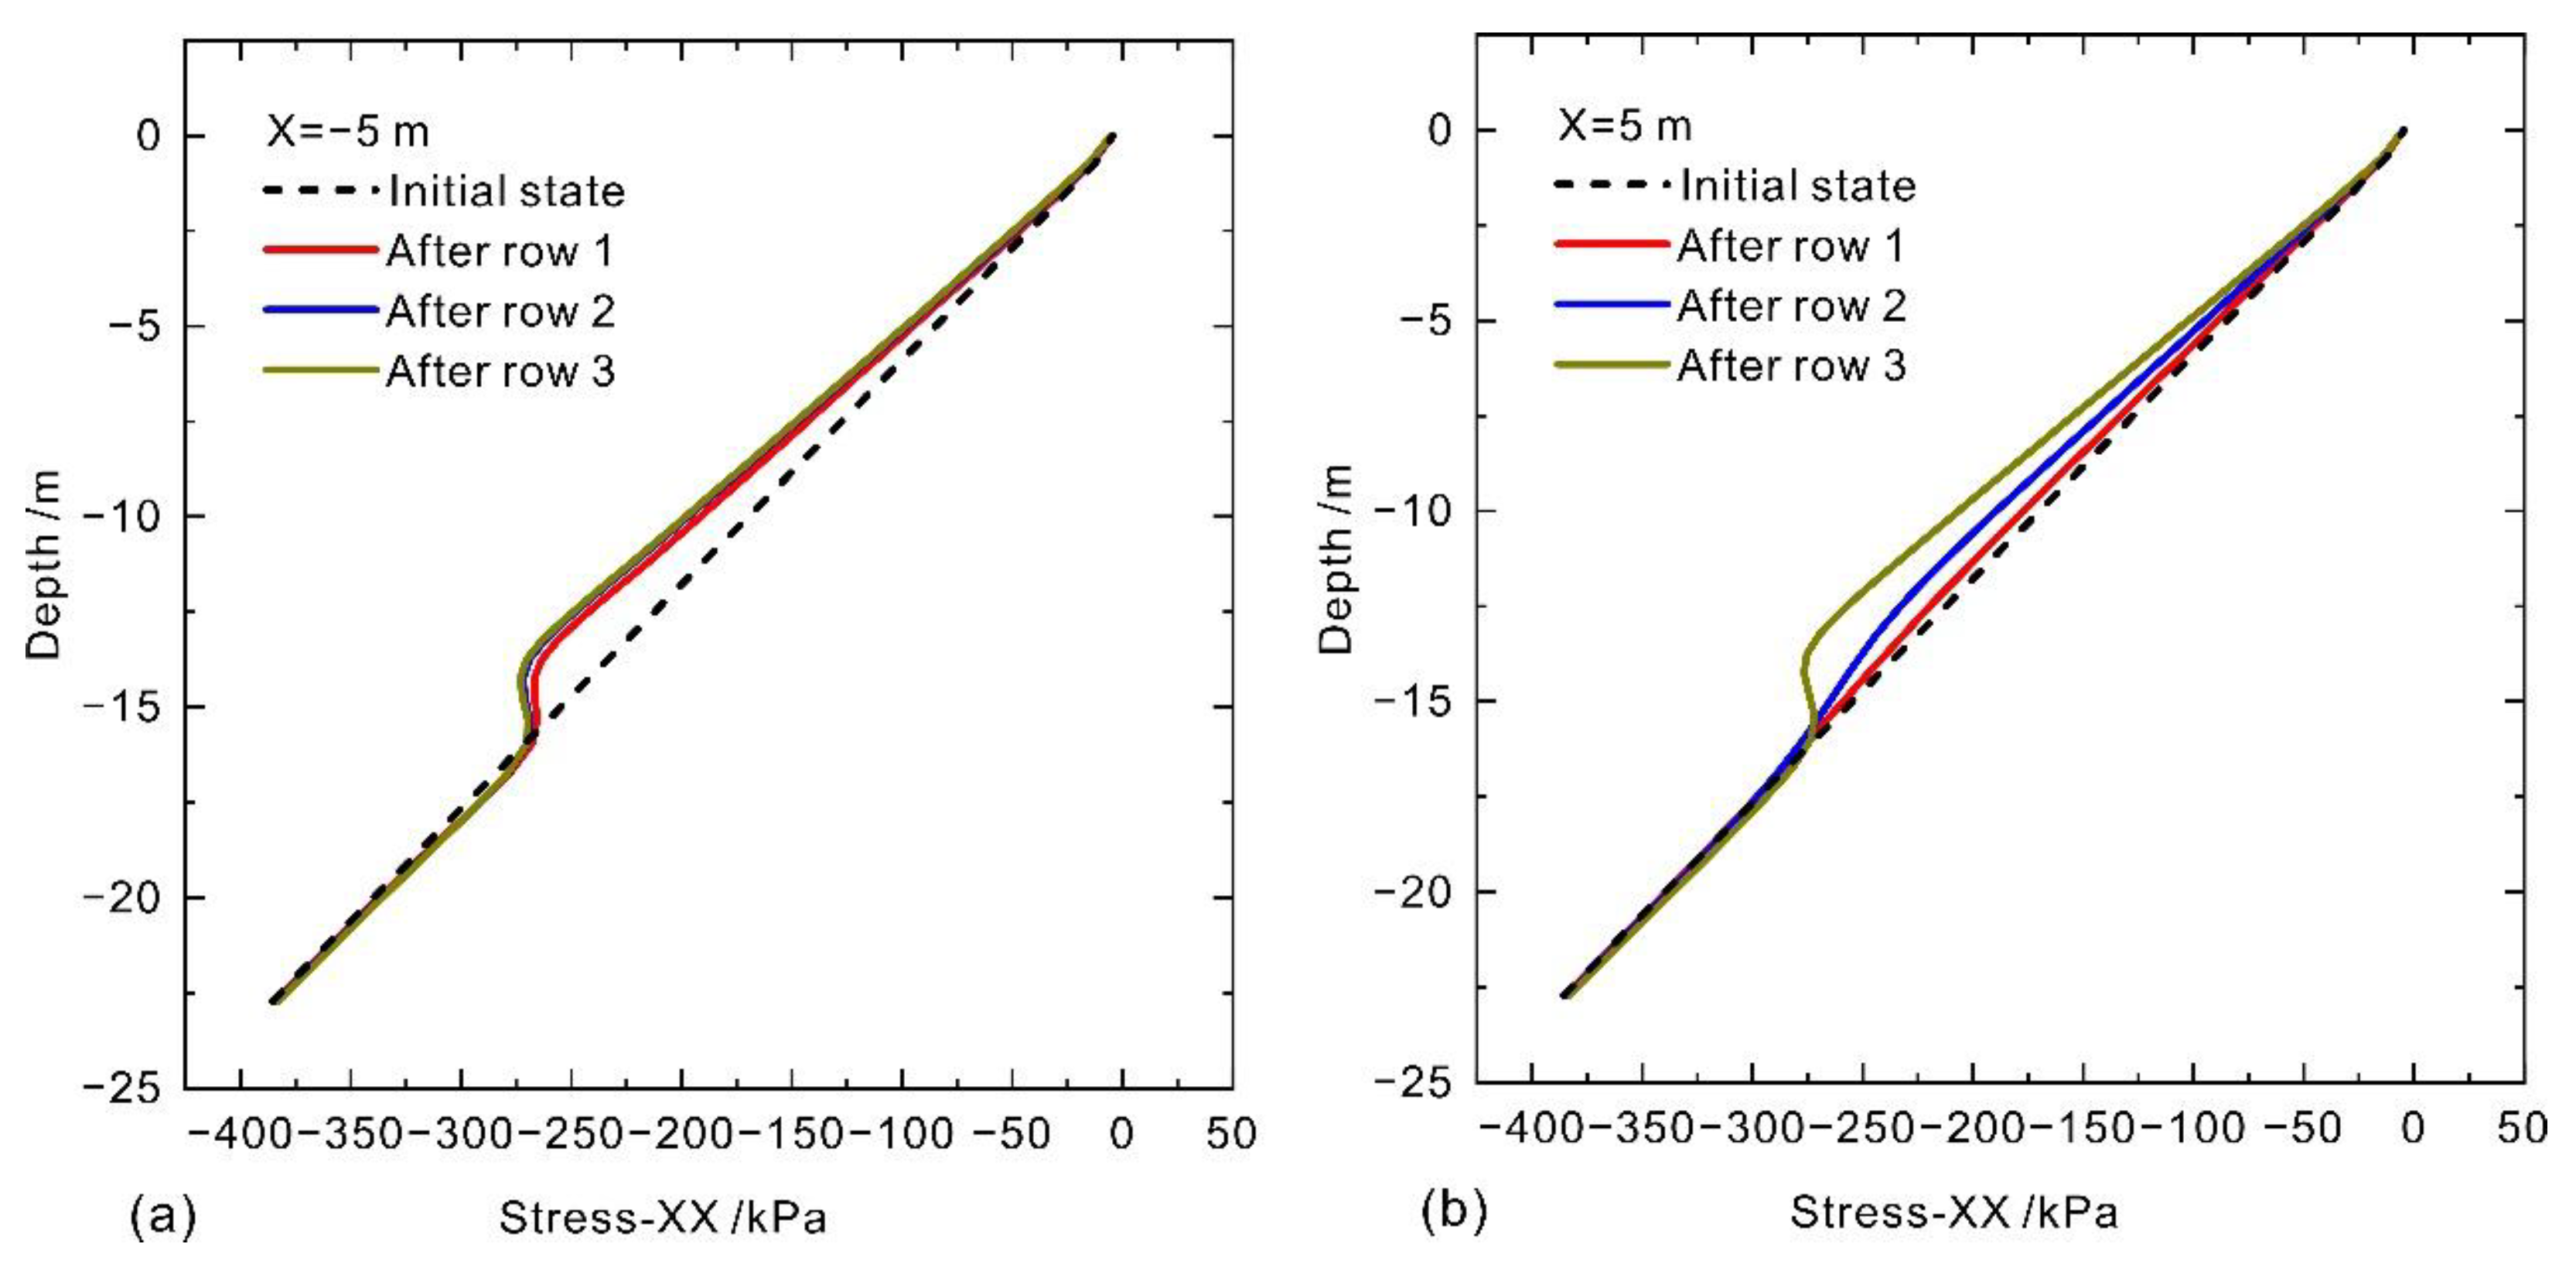
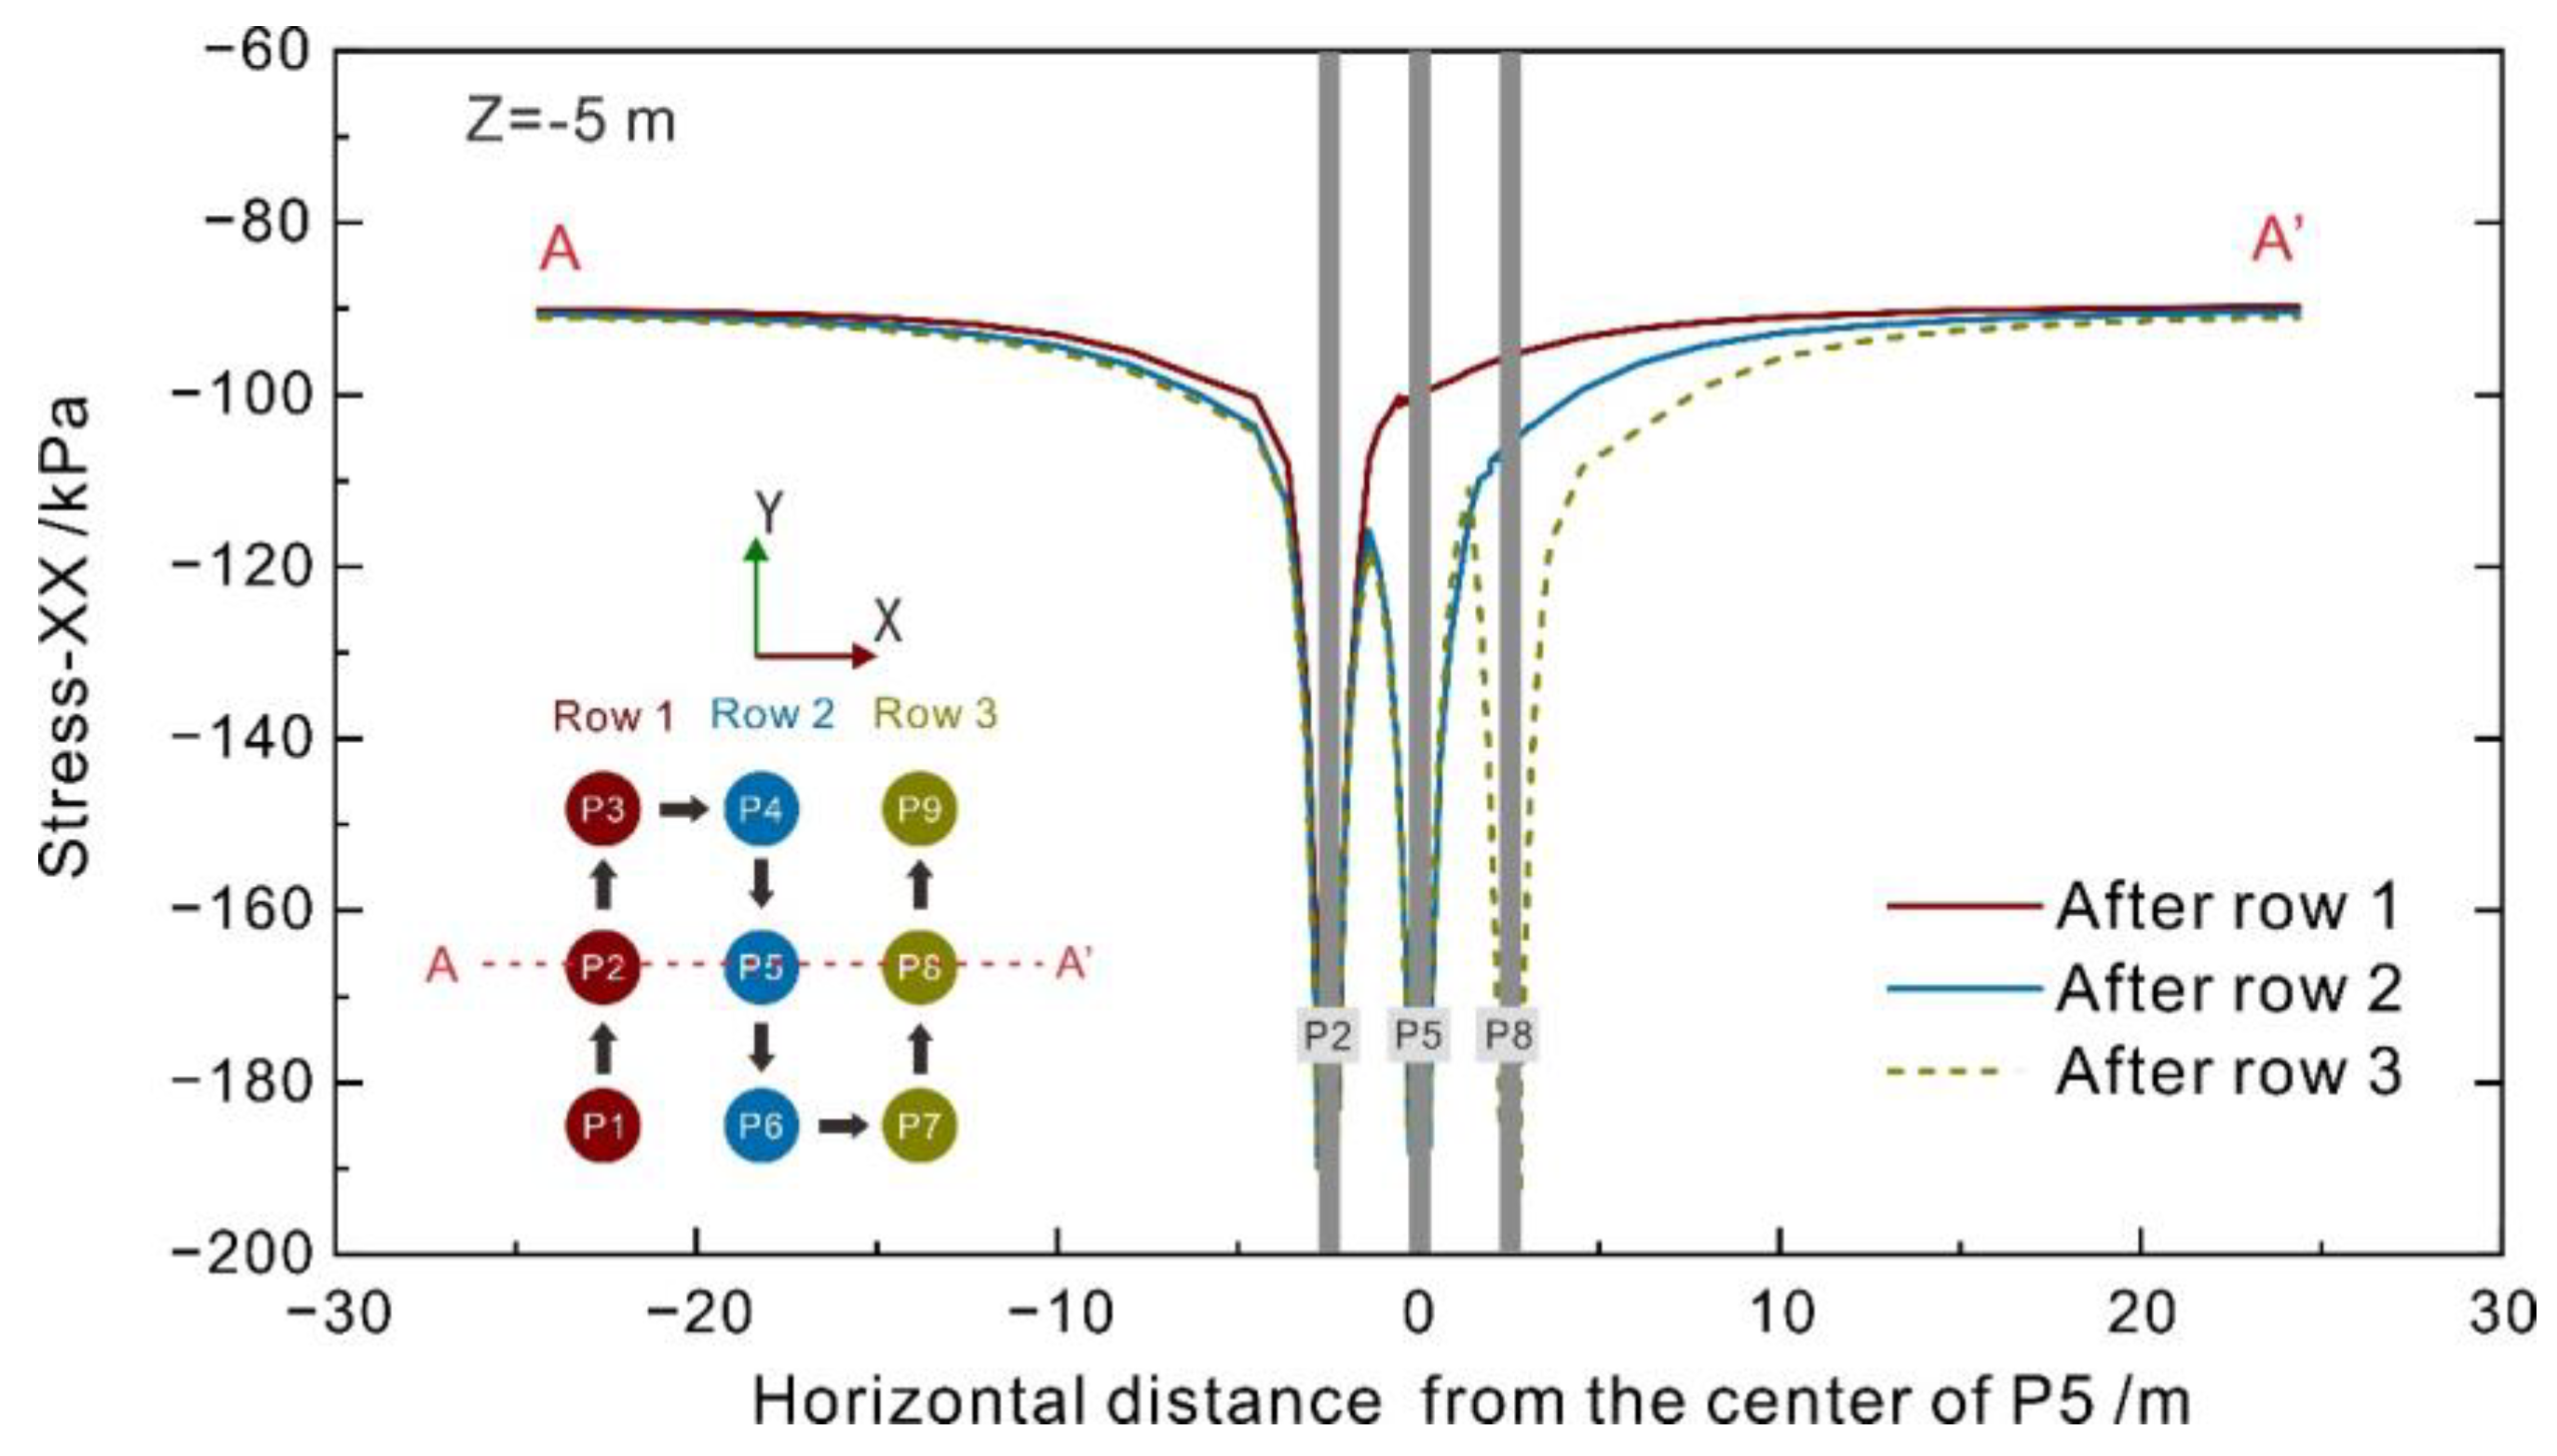
3.2. Stress Analysis

The displacement field provides a visual representation of the disturbance effects caused by the pile group, whereas the analysis of soil stress field is essential for elucidating the mechanism of piling disturbance [40]. Particularly, the distribution of maximum principal stress can reflect the soil’s strength, stress transmission, and deformation characteristics [41]. Figure 9 depicts the maximum principal stress distribution of soil at a depth of 5 m. For a newly installed row of piles (Figure 9a), there is a connected zone of stress increase in the Y direction between piles. As subsequent piles are installed, this high-stress connected zone extends in the X direction (Figure 9b,c), with the stress between piles in the same row decreasing. The results suggest the redistribution of soil stress after piling in order.
To comprehend the redistribution pattern of soil stress surrounding the piles, radial stress values, quantitatively equal to the maximum principal stress, of the soil grids in the outermost ring of the pile body were extracted. Figure 10 presents the radial stresses of the soil grids around piles (P1–P9) after the consecutive installation of three pile rows. When a pile row is just finished, the radial stress distribution around the piles is uniform in all directions. With the penetration of new piles, the original stress ring is deflected, and a stress-increasing zone is formed along the W–E direction (disturbance direction), meantime the stress increases along the N–E direction and S_E direction. The former indicates that the stress on the front side of the pile is exerted by soil compressions, while the latter indicates that the local soil around is inclined to form a stress concentration area, and both of them may contribute to shielding the soil behind the pile.
Furthermore, to quantitatively characterize the stress distribution, the X-direction stress values of soil along the depth were extracted at a distance of 5 m from the P5 center in both the W and E directions (Figure 11). This showed that in the initial state, the X-direction stress of soil increases linearly with depth, while as the three rows of piles are installed, there is a distinct inflection that appears at the bottom of the piles (depth = 15 m), where soil stress significantly increases. This implies that the existing piles, of which the length was 15 m, had a certain shielding effect on soil disturbance. Moreover, the superposition effect of soil stress was observed in both the W and E directions during the sequential installation of the three pile rows. Following the installation of the first row of piles, a larger stress increment was caused in the W direction, and the shielding effect of the existing piles reduced the disturbance of the soil mass, which was manifested by the extremely small stress increase caused by the penetration of the second and the third rows of piles. For the E-direction soil (Figure 11b), as the piles approached row by row, the stress superposition effect of the soil gradually increased, and the third row of piles caused a significant stress increase in the soil.
Figure 12 demonstrates the variation of soil stress-XX for the A-A’ profile at a depth of 5 m. Following pile penetration, the X-directional stress of soil near the pile increases sharply. As the horizontal distance from the P5 center increases, the stress significantly decreases. When the distance exceeds 20 m, the incremental X-direction stress induced by the piles tends toward zero, and the X-direction stress reaches approximately 90 kPa; this indicates that the piles no longer disturb the soil foundation. As each row of piles is installed, the X-direction stress of soil on both sides of the pile group experiences a superimposed effect, with the stress increase on the right side of the first row of piles being more pronounced than that on the left side. The result verifies that the existing piles provide a certain shielding effect on the left-side soil foundation.
The X-direction stress of soil in the B-B′ profile at a depth of 5 m was also extracted (Figure 13). Unlike the A-A′ profile, the soil stress on both sides of B-B′ profile is less affected by the shielding effect of existing piles, and has a similar change trend. The soil stress between piles is much smaller than that near the pile body. As the distance from P2 center increases, the soil stress on both sides of the pile group exhibits a decreasing-then-increasing trend, and stabilizes at around 90 kPa from HD = ±15 m. With the penetration of three pile rows, the soil stress between piles significantly increases; it contributes to the shielding effect as well.

3.3. Shielding Effect Mechanism

A row of pile bodies and the soil between them have been proved to contribute to shielding effects, and the simulated response characteristics of stress and the displacement of the foundation are essentially consistent with other research results [33,37], thereby indirectly validating the rationality of the model. Nonetheless, how the soil in between piles behaves as a shield remained unsolved. Consequently, this section will synthetically analyze the formation mechanism of the shielding effect from the pile group, based on the above studies.
Figure 13 displays an interesting phenomenon that in the B-B′ profile, the soil stress between the piles is obviously smaller than that out of the pile group. To explain this phenomenon, an analysis of the strain characteristics is needed. As depicted in Figure 14, the strain increases relative to the initial state after the installation of the first pile row are extracted. The soil between the piles displays positive strain (tensile strain) increases in the X direction, as shown in Figure 14a, but has negative strain (compressive strain) increases in the Y direction, as shown in Figure 14b.
Figure 15 further depicts the soil strain variations between piles of the first row following the installation of subsequent rows. In Figure 15, the green line denotes the difference in soil strain increments between the installation of the second and first rows of piles, while the red line represents the difference between the installation of the third and second rows of piles. According to the results, the X-direction strain increase in soil between the piles is larger than that near the piles (Figure 15a), which corresponds to the result of Figure 14. This result generally demonstrates a distinction between the strain distribution of soil near the pile and between the piles and implies that the uneven pattern is correlated to “shielding”.
Based on the comprehensive analysis, during pile group installation, the shielding effect of an existing row of piles on new rows of piles is caused by two factors: a. the direct obstruction effect from the existing piles, and b. the obstruction from the soil between the existing piles. The former is reflected in the direct barrier of the existing pile to the soil displacement caused by the installation of the new piles, as explicated in the analysis of Figure 7, Figure 10, Figure 11 and Figure 12. The latter is reflected in the obstruction of the soil between two existing piles to the displacement of the soil passing through two existing piles, as depicted in Figure 13, Figure 14 and Figure 15.
In fact, the principle of the obstruction from the soil between existing piles is similar to the “soil arch effect”. When the soil is compressed laterally and tends to pass through adjacent piles, it may produce relative movement with the soil near the pile shaft, thus transmitting the soil thrust to the soil near piles and finally producing a soil arch. Figure 16 exhibits the X-direction stress distribution in the soil between piles. The stress between two adjacent piles (region B) is relatively lower than that of the soil near pile shafts (region A), where the stress is concentrated. The stress contours resemble an arch (indicated by yellow dashed lines) with obvious arching bodies and feet (see Figure 16). This conclusion is firmly supported by the results of Figure 10 and Figure 13.
Actually, this proposed shielding mechanism of the “soil arch effect” is essentially consistent with the theories on foundation pit engineering and landslide control engineering [42,43]. However, the soil arching effect is sensitive to pile spacing, and it is generally considered that the soil arching effect is virtually eliminated when the pile spacing exceeds five times the pile diameter [44,45]. In such cases, the shielding effect of the pile group mainly originates from the direct obstruction effect of the existing piles. Based on the above analysis, the shielding effect of pile groups in soft soil foundations is provided by both the piles and the soil between the piles. Therefore, in practical engineering, the shielding effect can be utilized to effectively control and optimize the disturbance caused during pile group construction.

4. Conclusions

The mechanism of shielding effects of a pile group–soft soil system was investigated through a numerical study. Using FLAC3D and the cavity expansion theory, a three-dimensional numerical model was created. Multiple response characteristics including displacement, stress and strain were combined to systematically study the mechanisms of shielding effects. The following are the particular conclusions:
(1)
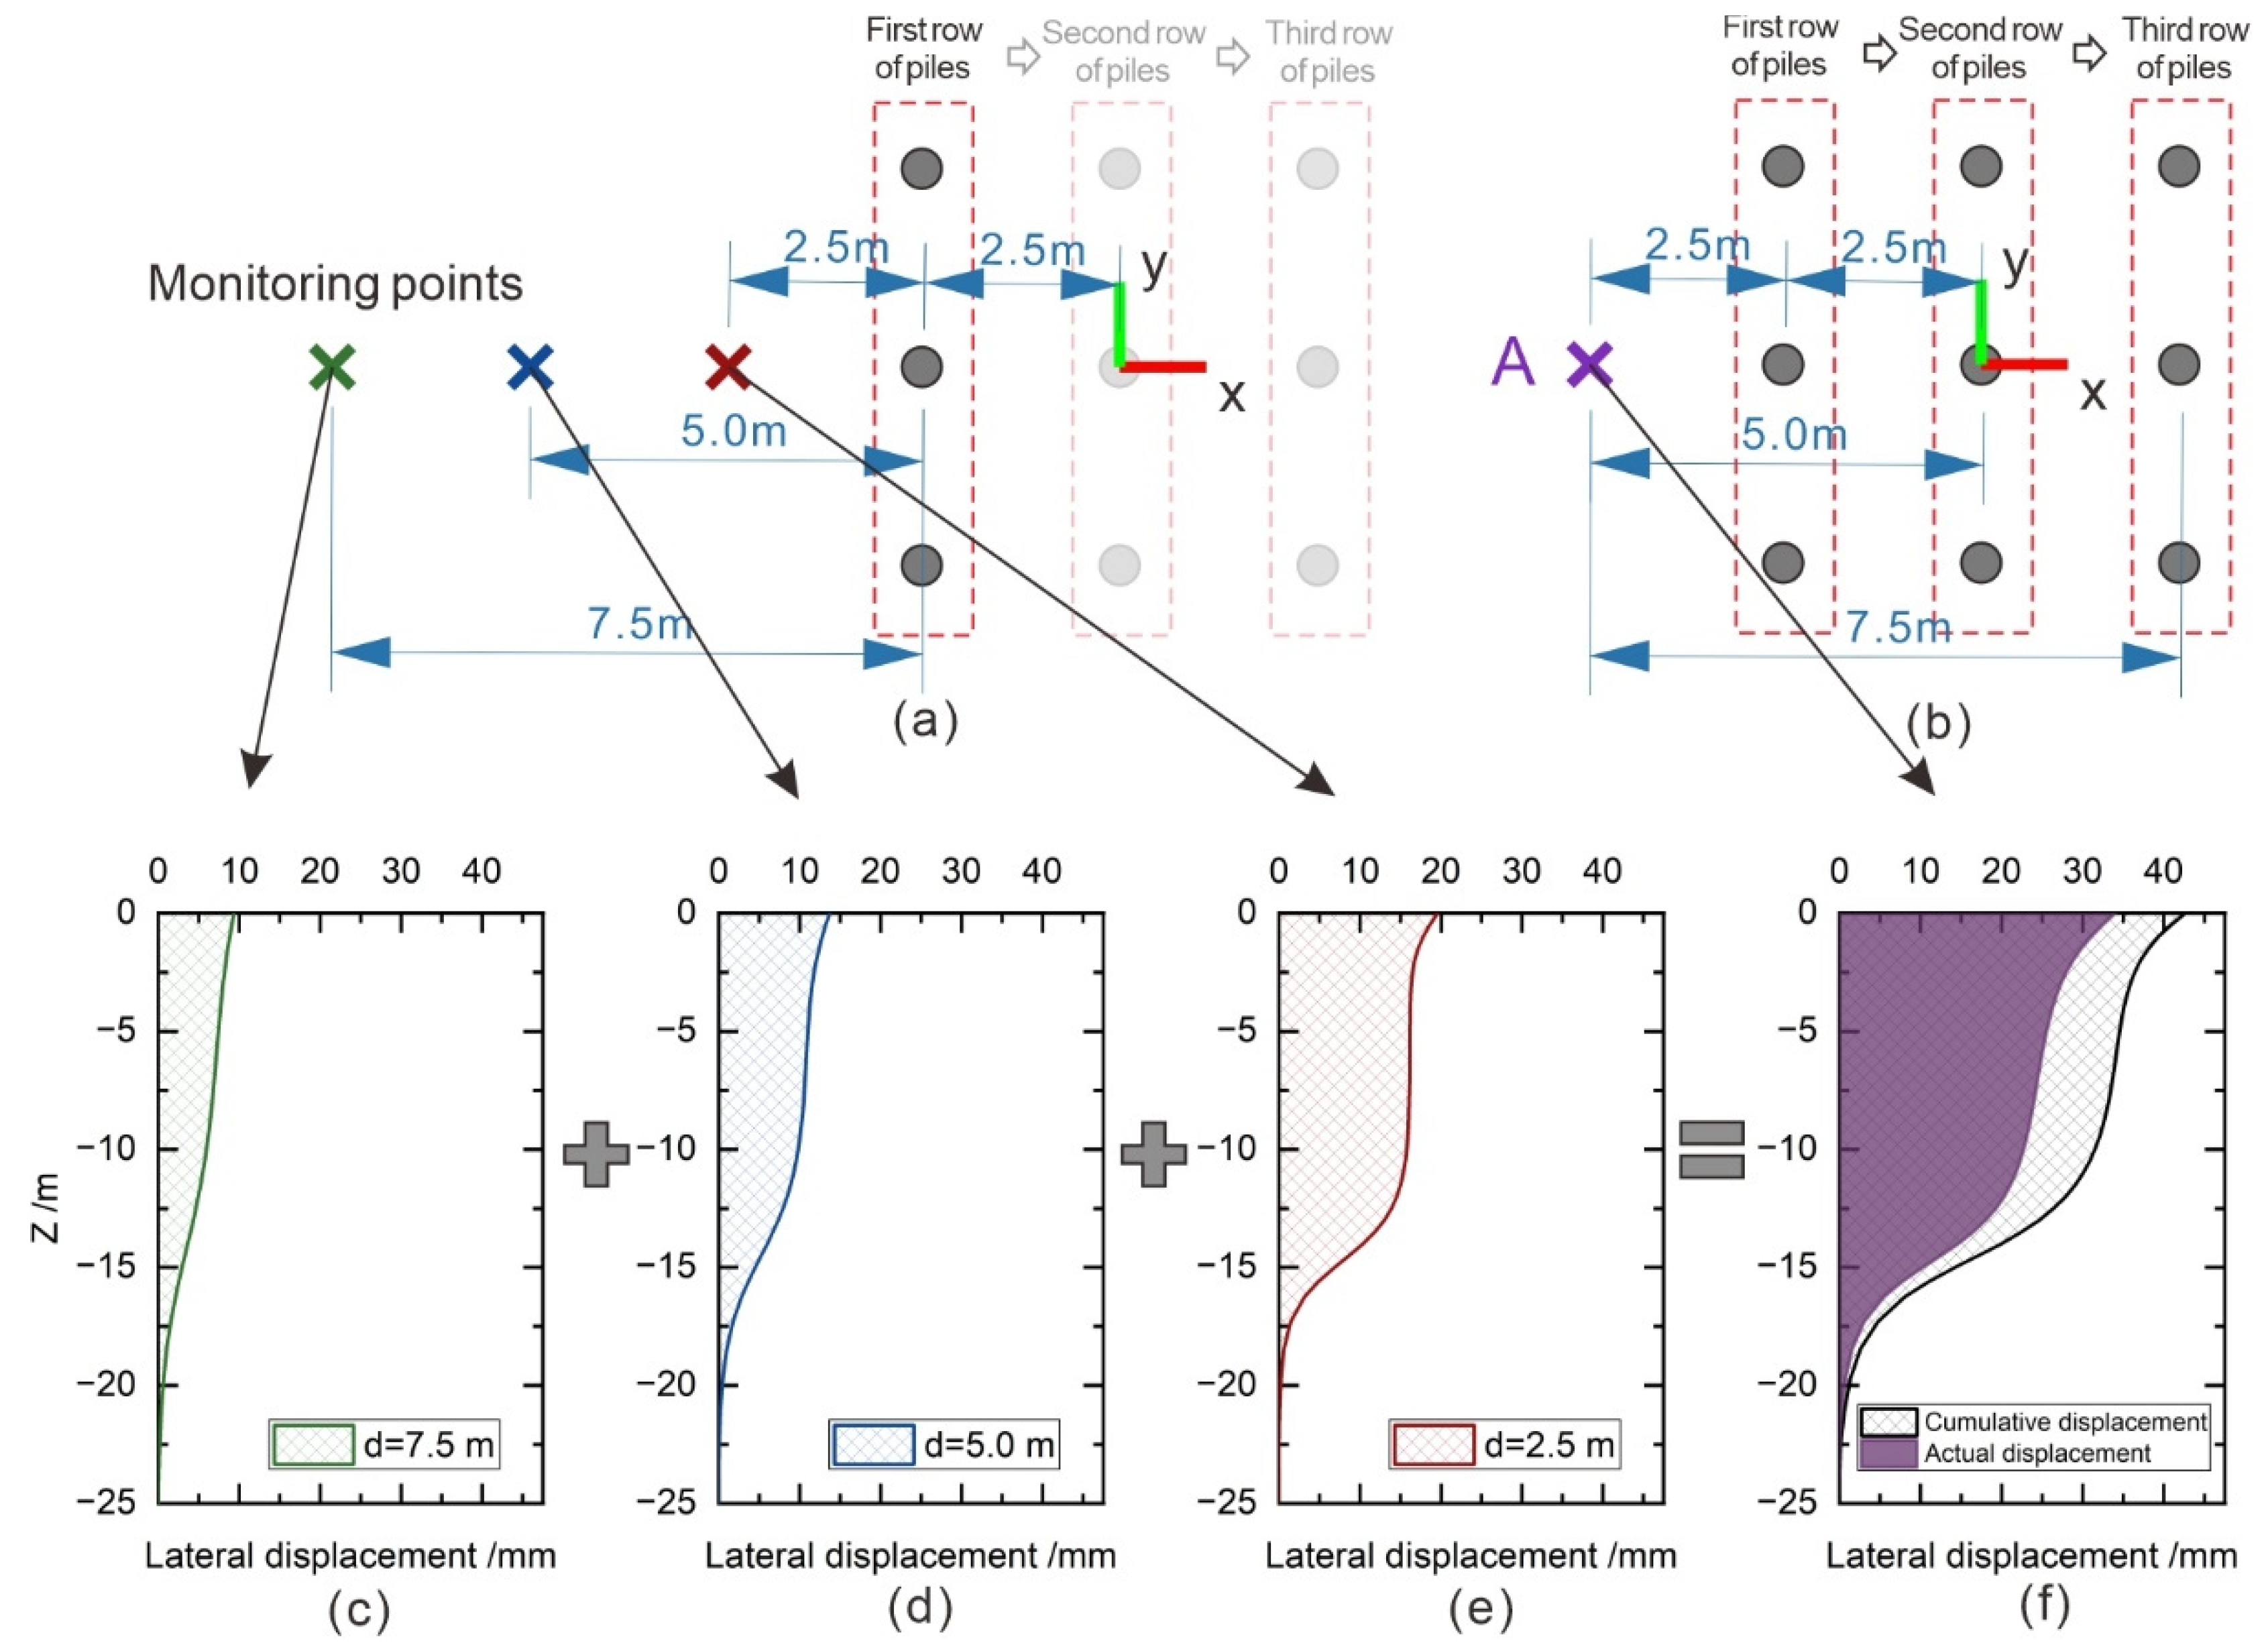
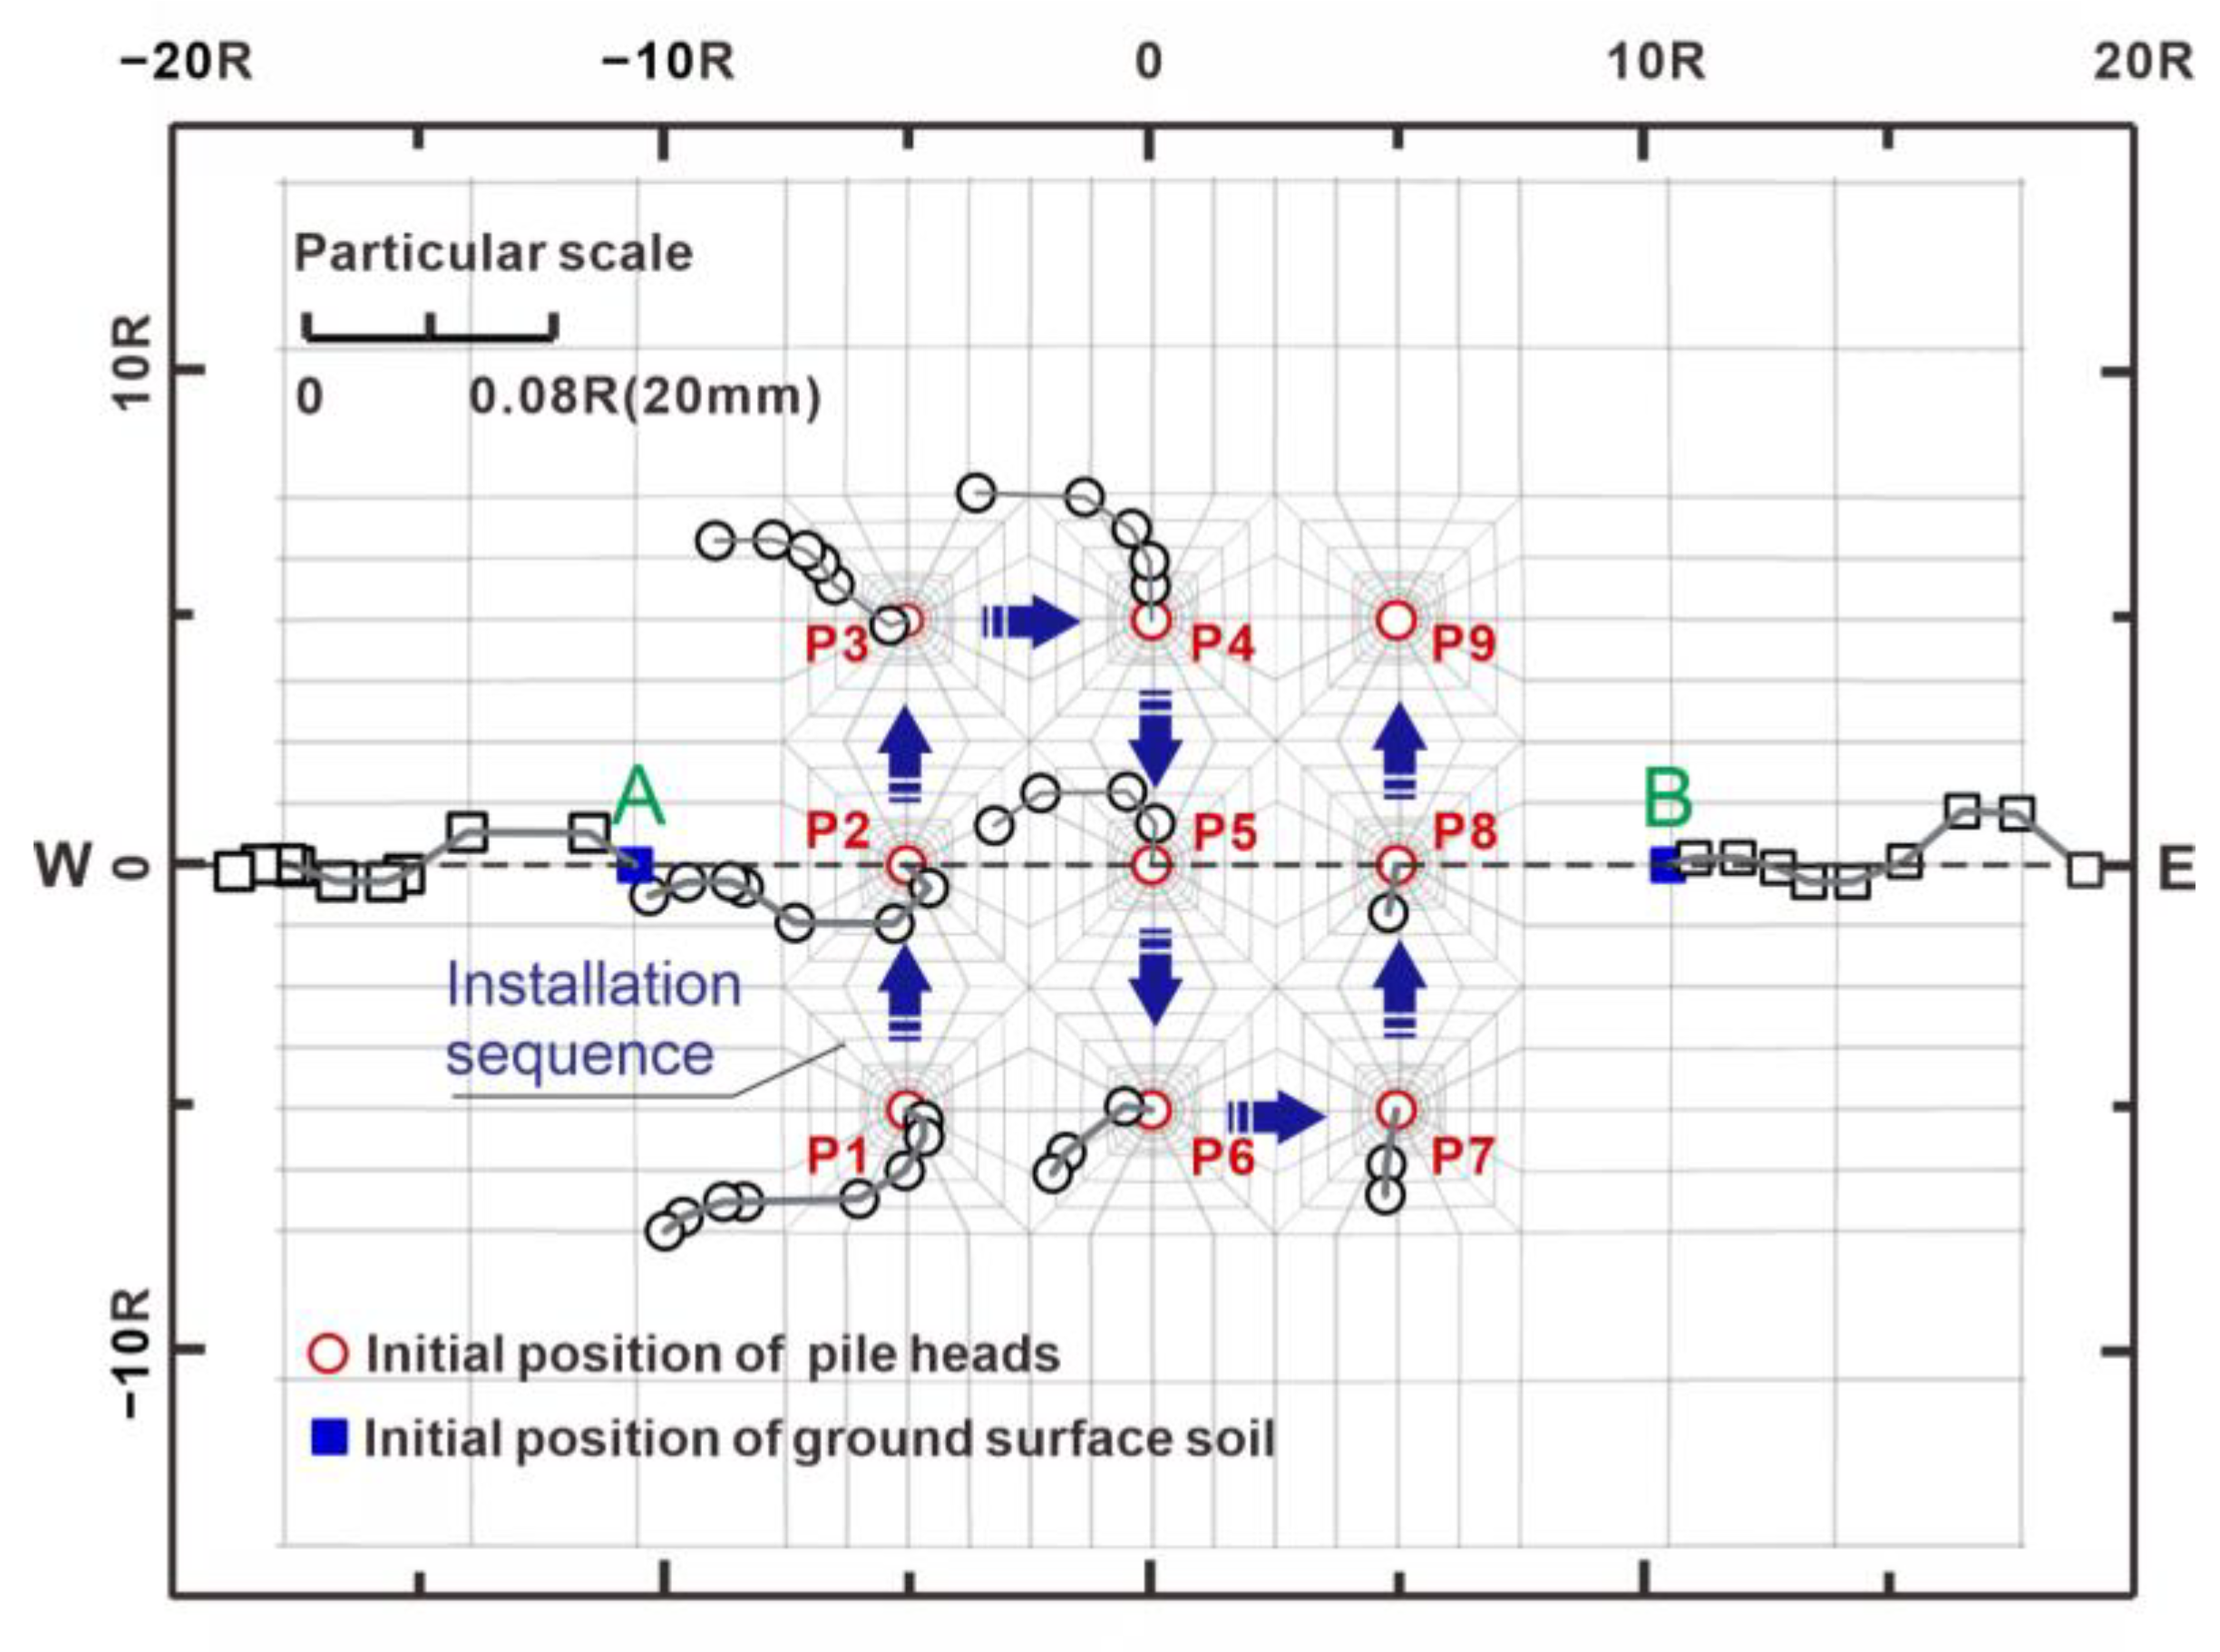
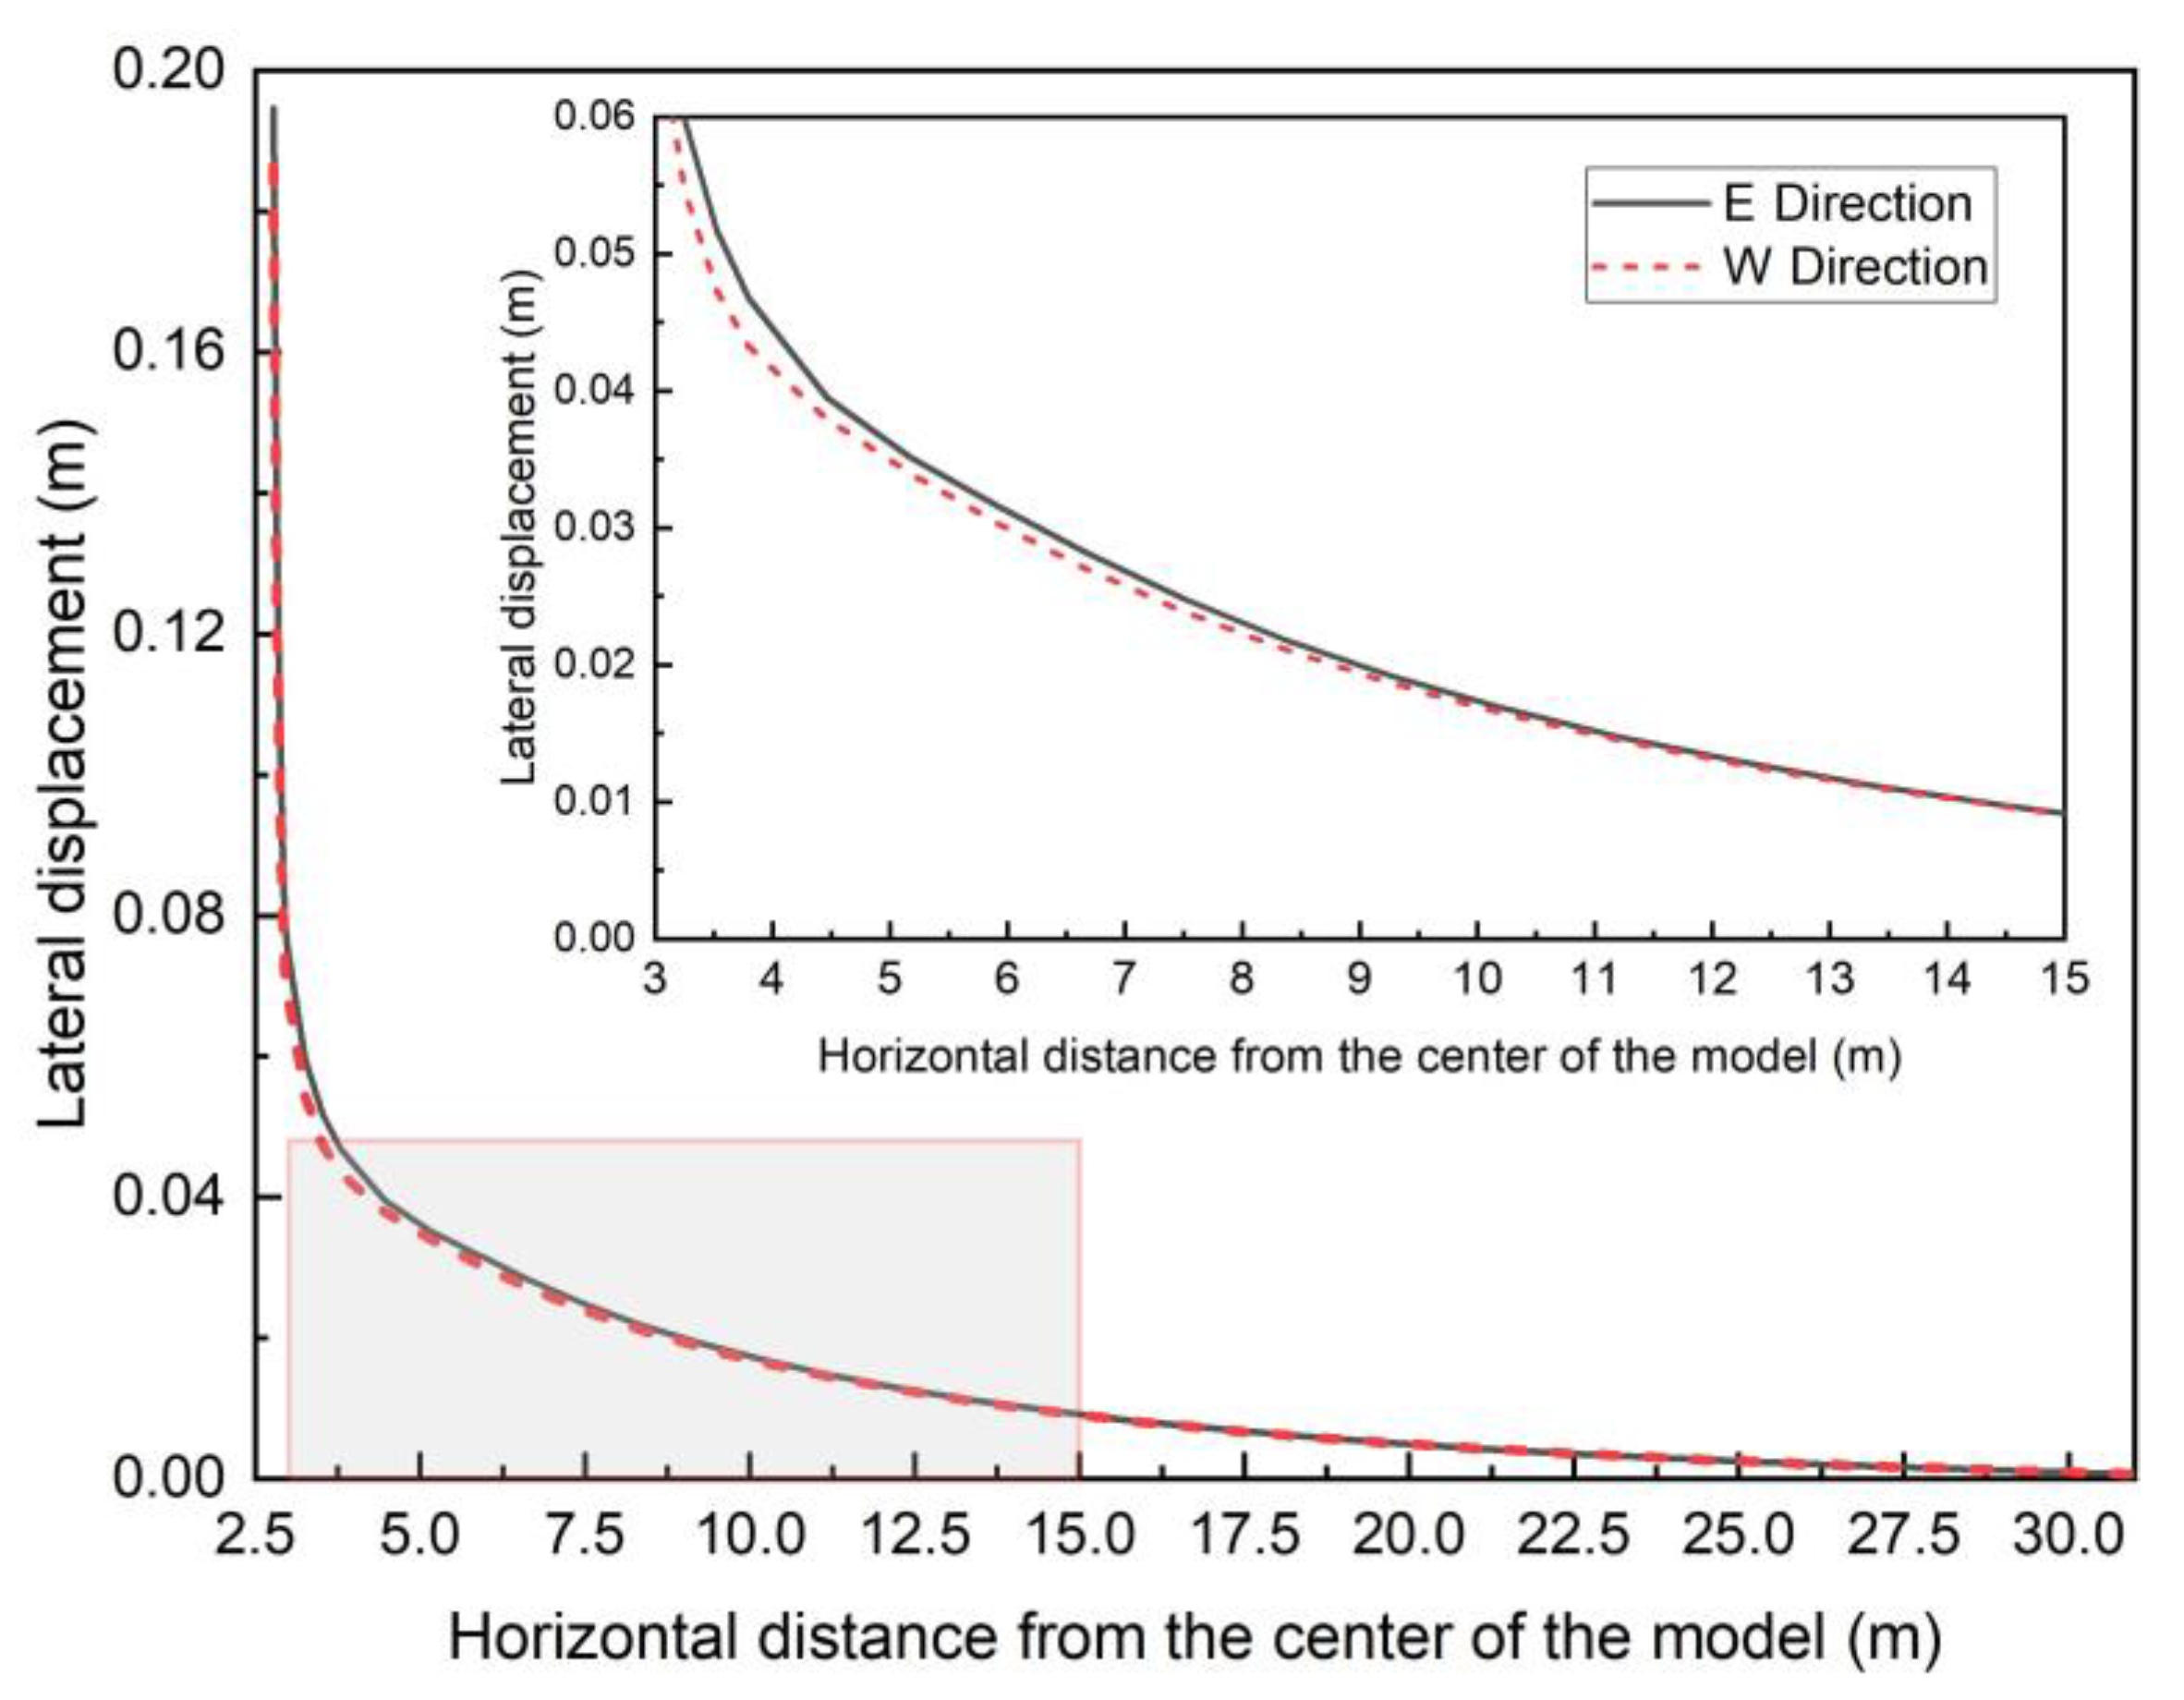
Displacement field analysis revealed that the “actual accumulative displacement” considering the shielding effect was 21.43% less than the “superimposed displacement” without the shielding effect, indicating the pronounced presence of superposition and shielding effects in the pile group. A further examination of the displacement trajectories of pile heads and ground surface soil revealed that each penetration of a pile induces a directional disturbance both on the soil and piles, and the pile itself contributes to the shielding effect. Specifically, on both sides of the pile group, the displacement of soil near the existing piles (W direction) exhibited a relatively smaller superposition effect. This observation highlights the effective role of the existing piles in controlling deformation.
(2)
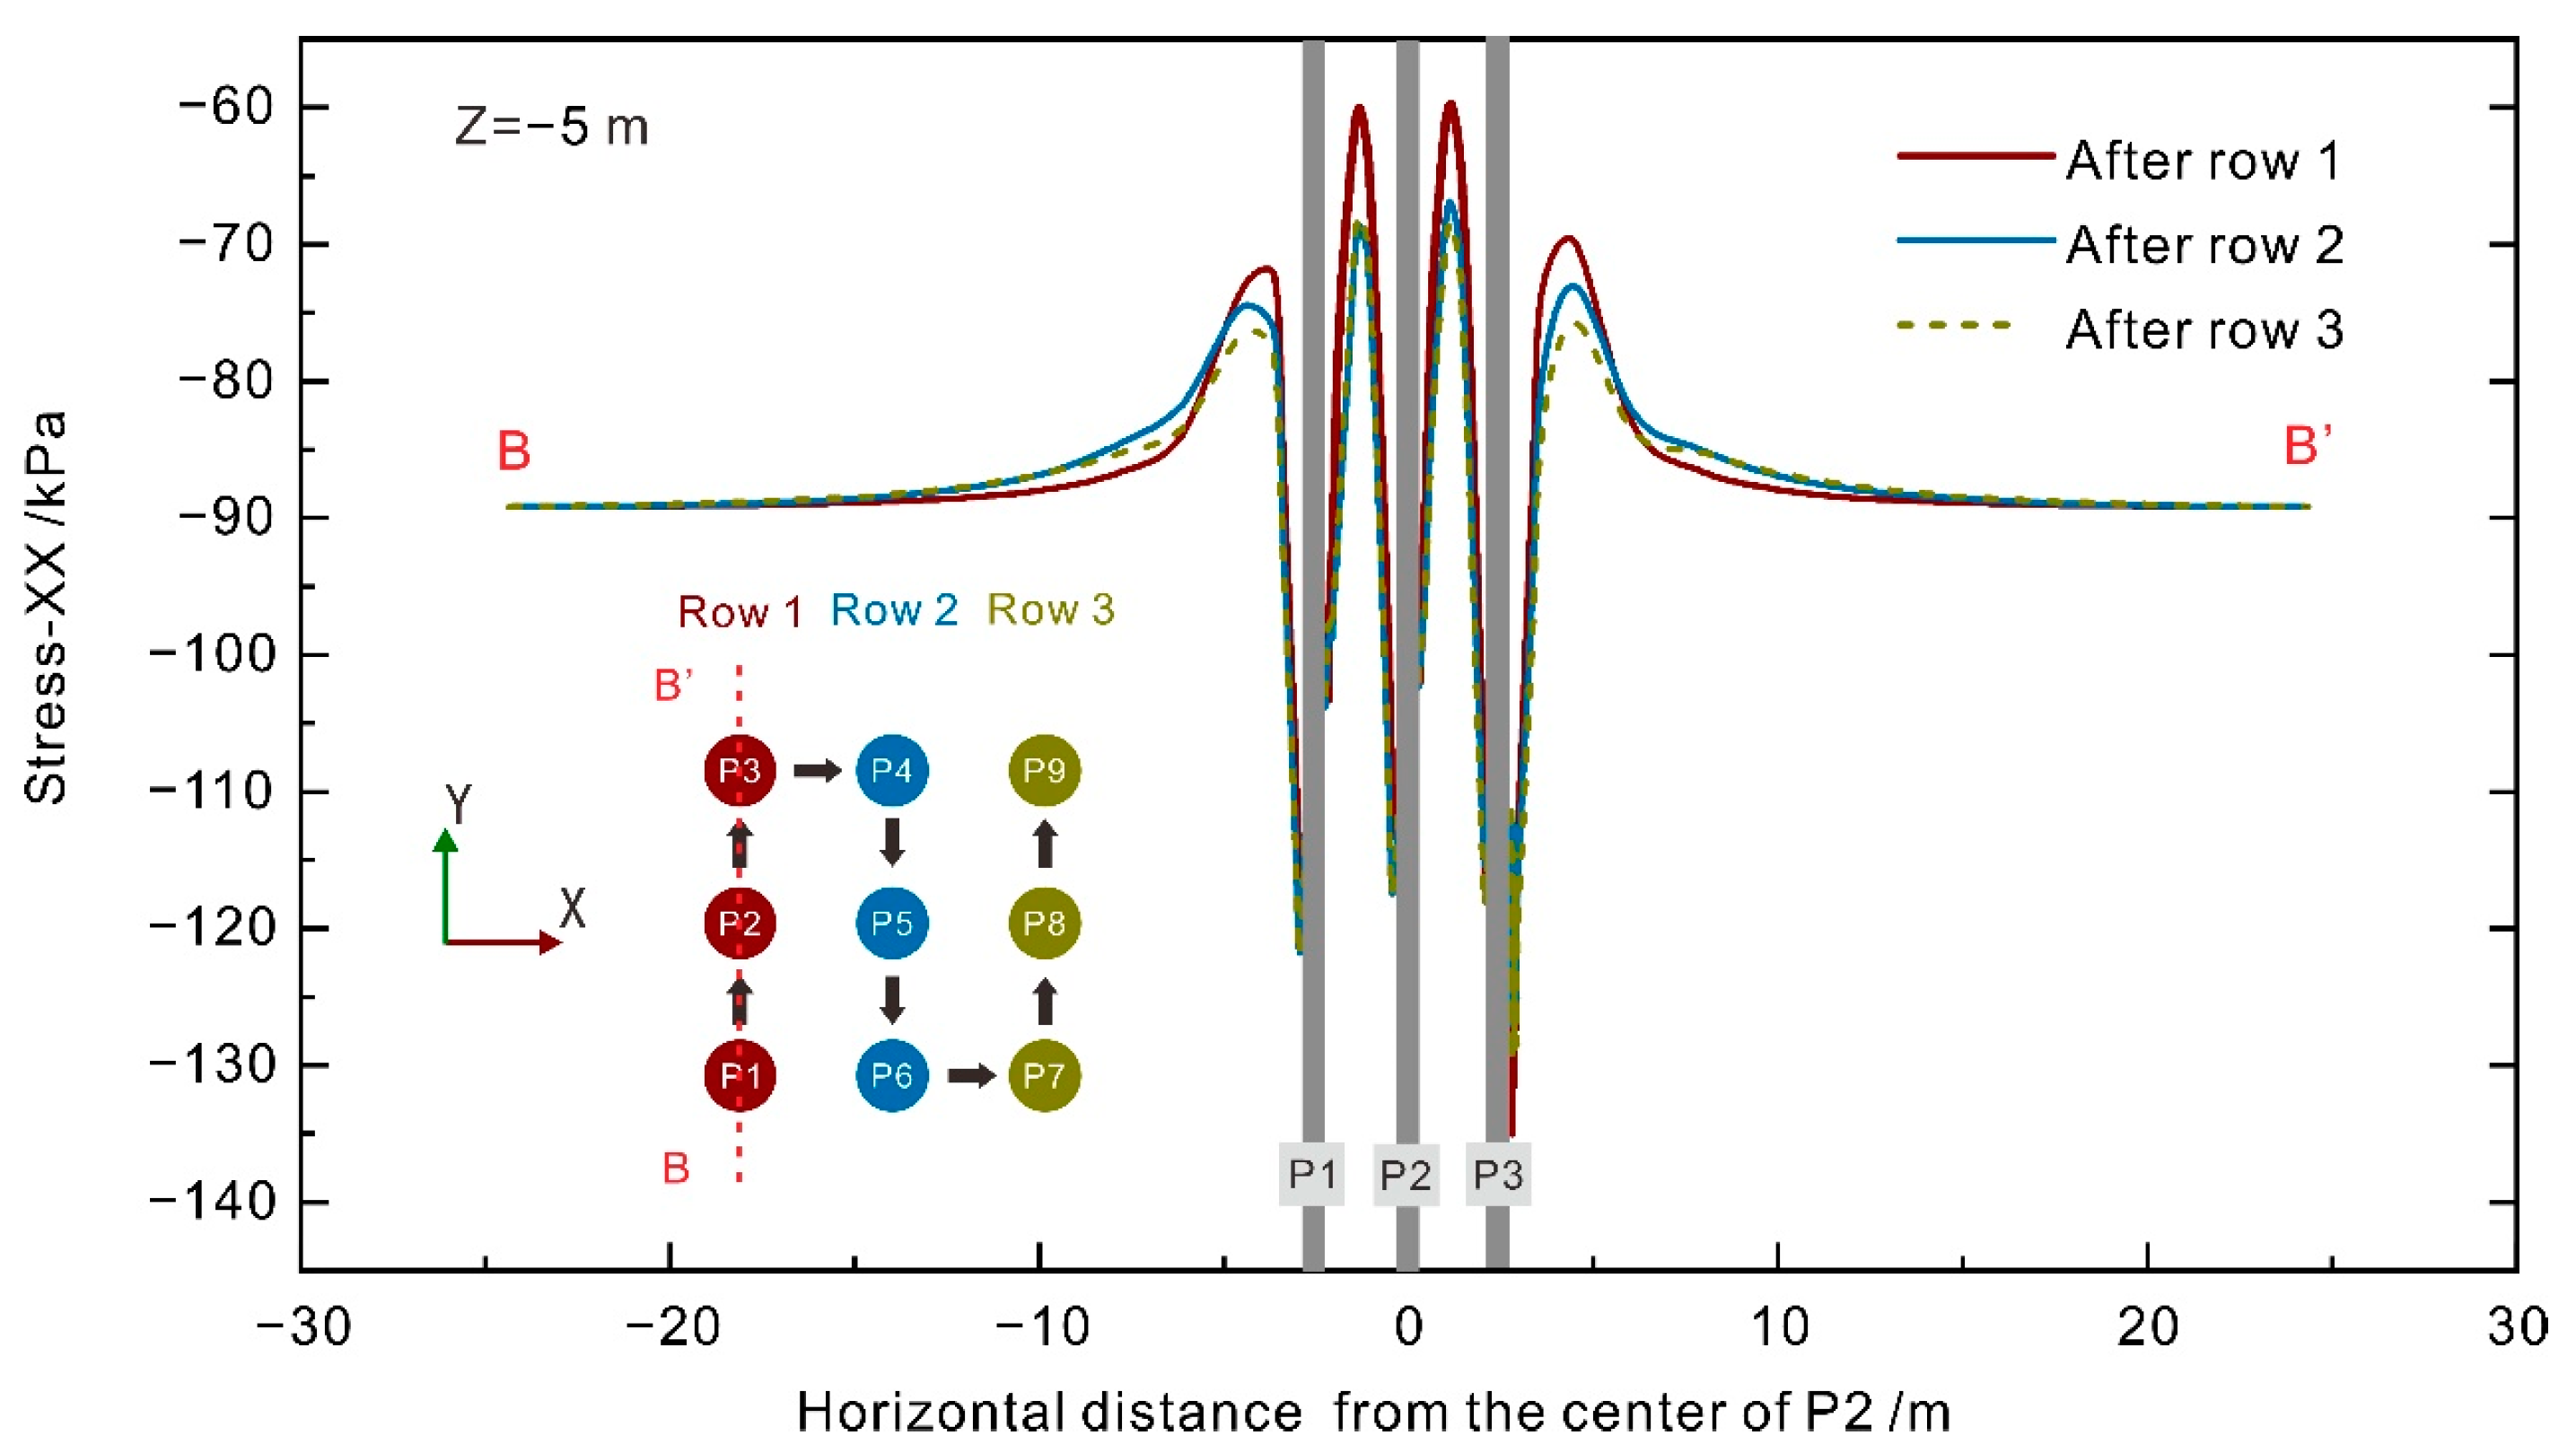
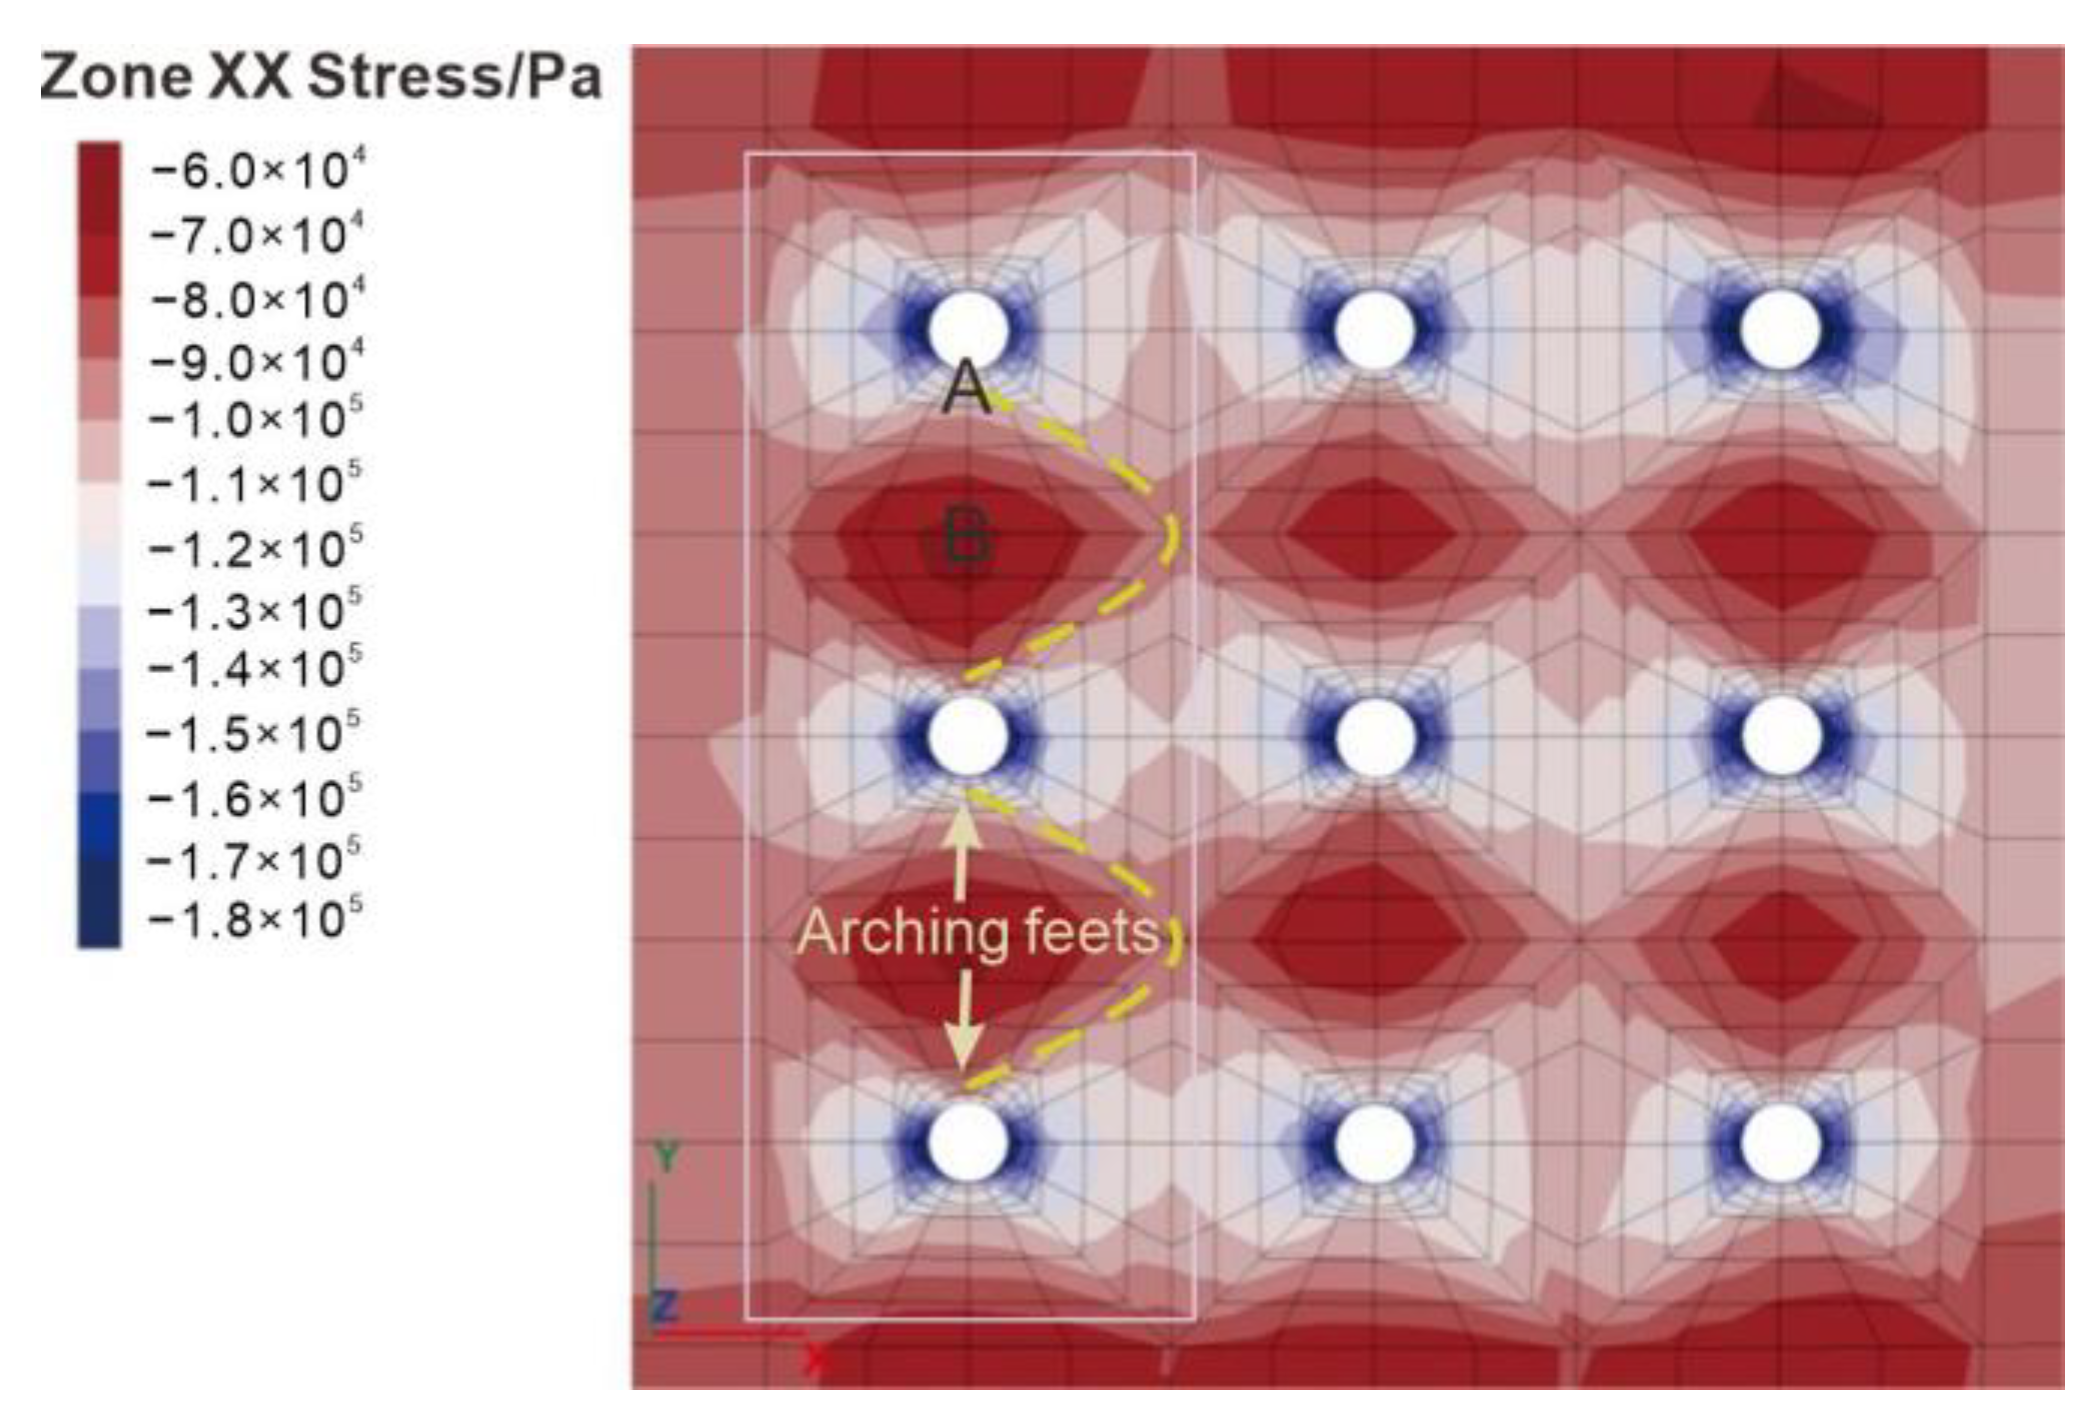
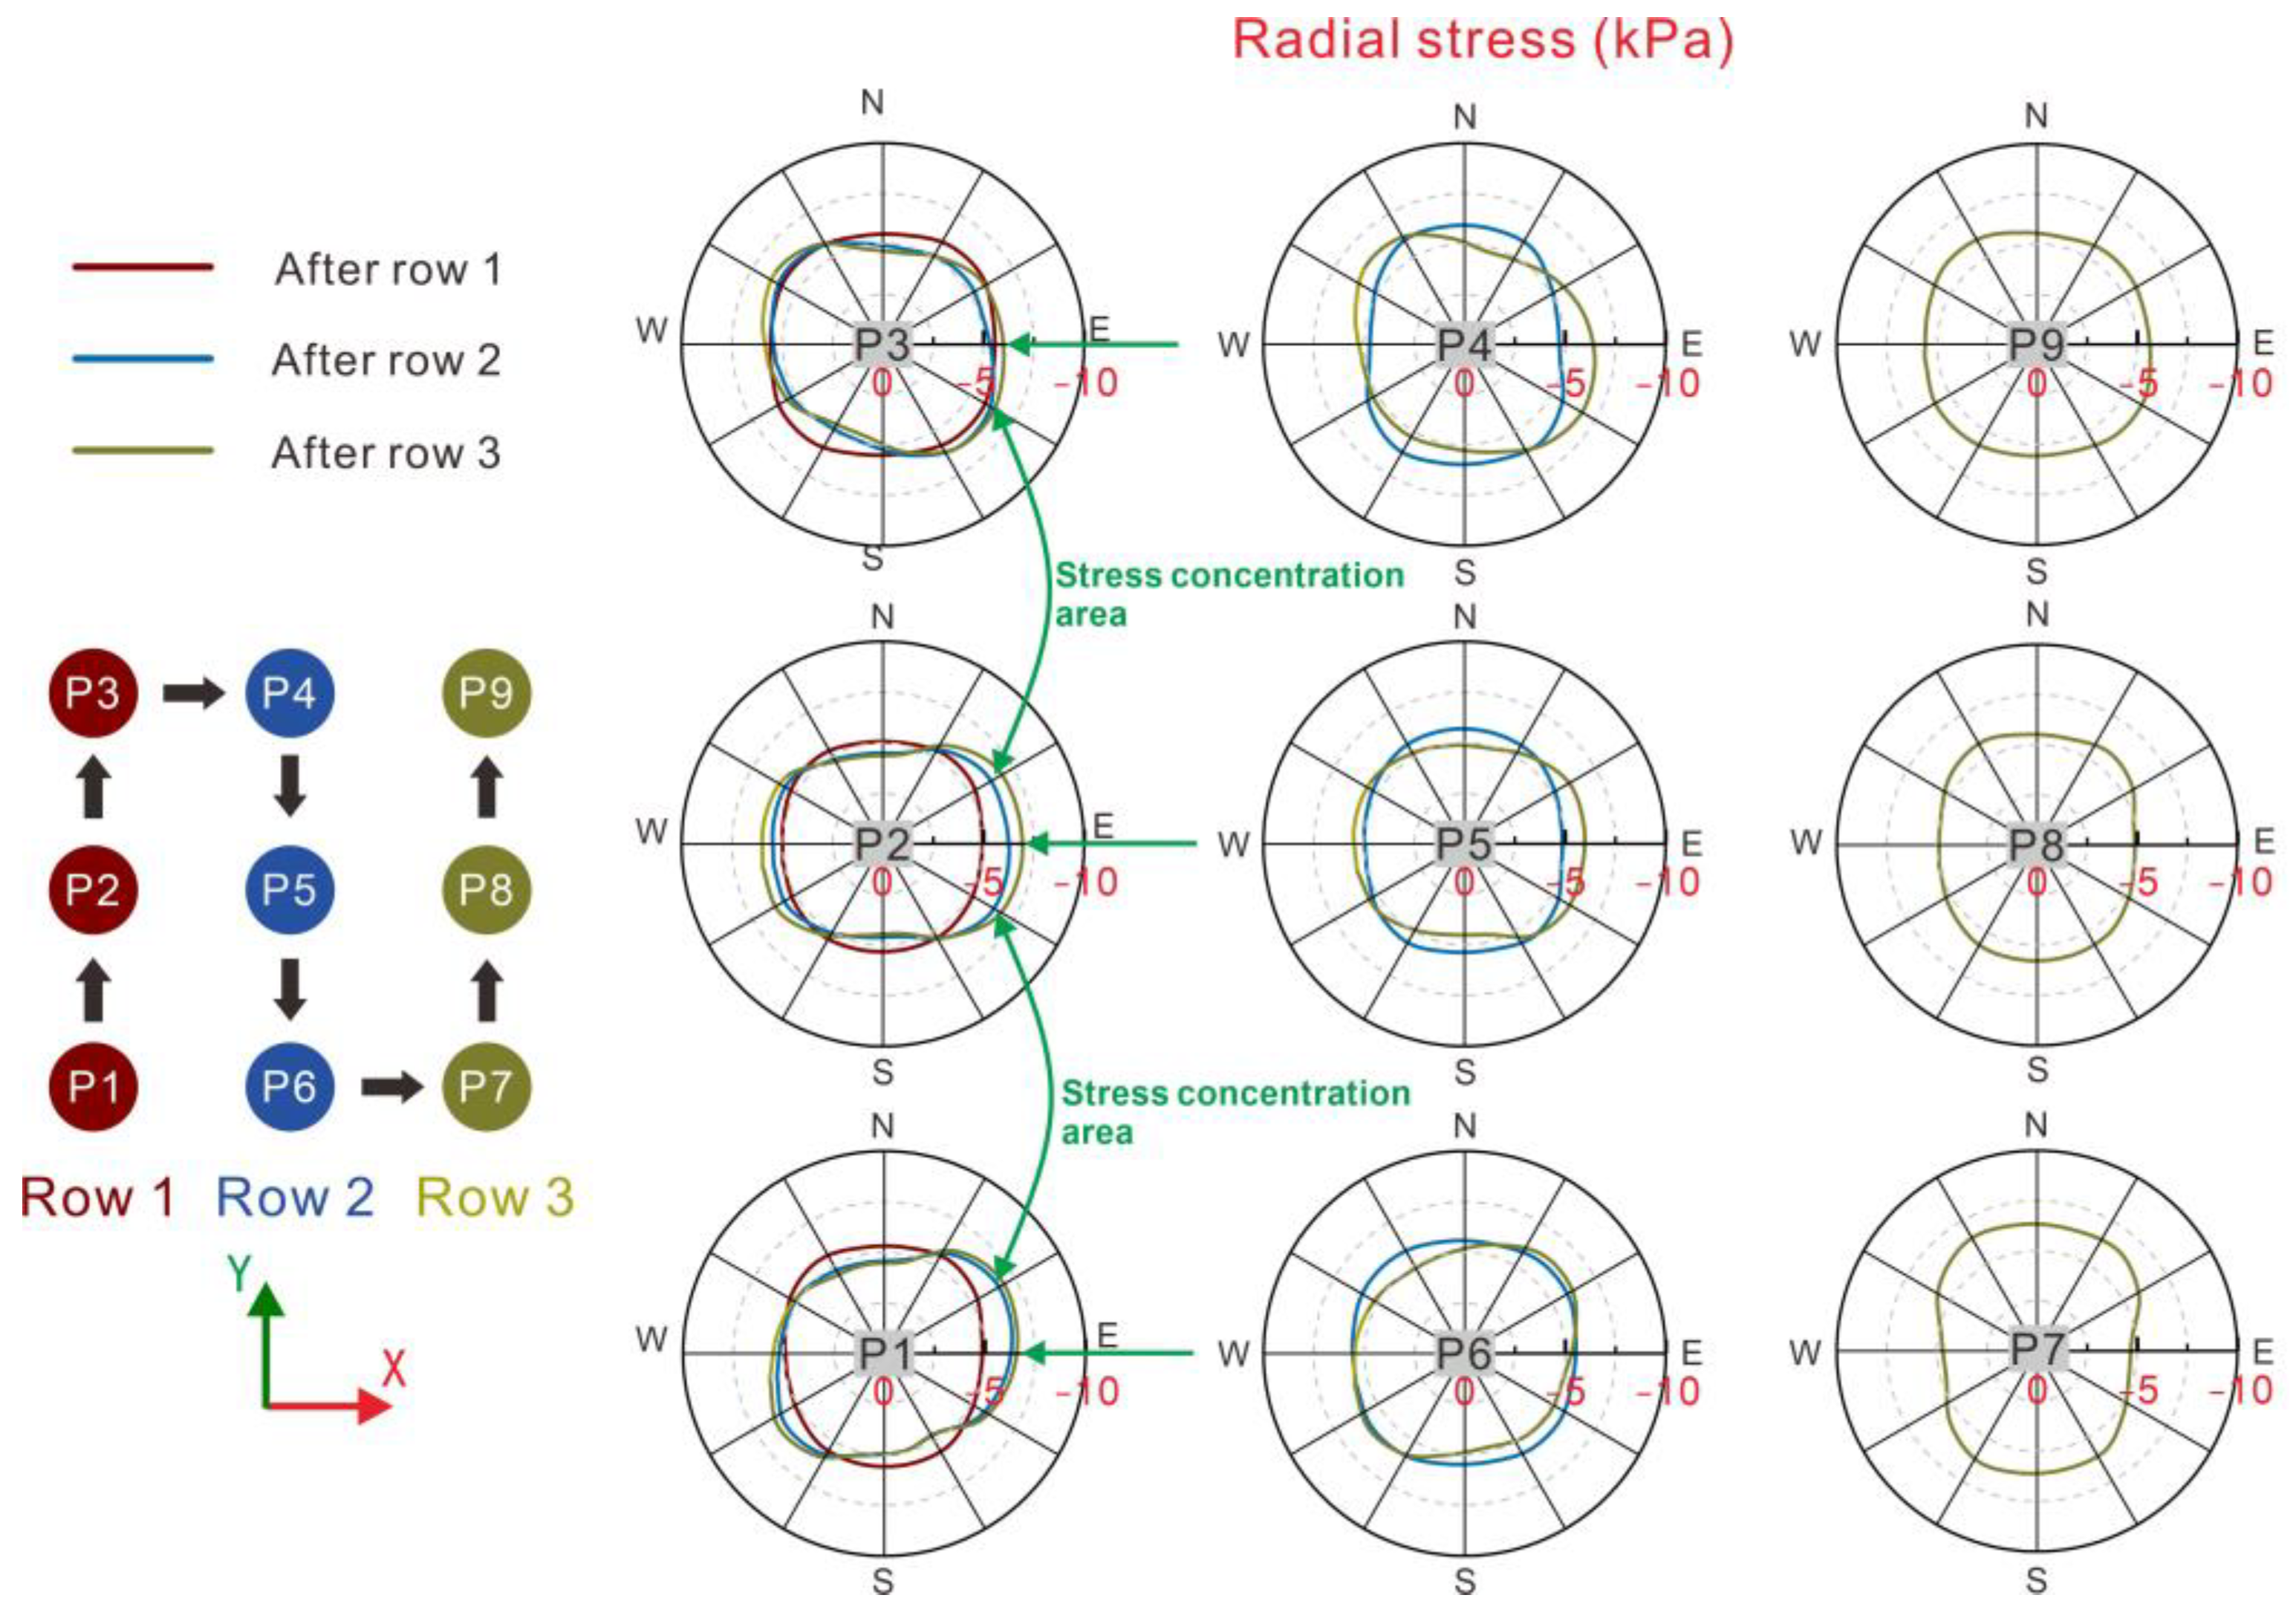
Stress field indicates that pile installation caused a redistribution of soil stress. For a newly installed row of piles, there is a connected zone of stress increase in the Y direction between piles. After piling in order, this high-stress connected zone extends in the X direction, with the stress between piles in the same row decreasing; the original stress ring of soil in the outermost ring of the pile body is deflected, and a stress-increasing zone is formed along the W–E direction. In the meantime, stress increases along the N–E direction and S–E direction, which indicates that both piles and the local soil around may contribute to shielding the soil behind the pile.
(3)
The X-direction strain increase in the soil between the piles is larger than that near the piles. This result generally demonstrates a distinction between the strain distribution of the soil near the pile and between the piles and implies that the uneven pattern is correlated to “shielding”.
(4)
Through a synthetical analysis of displacement, stress and strain fields, the mechanism of the shielding effect induced by pile construction is proposed, and is attributed to the direct obstruction effect of piles and the “soil arching effect” caused by the soil between piles. The former is reflected in the direct barrier of the existing pile to the soil displacement caused by the installation of the new piles. The latter is reflected in the obstruction of soil between the two existing piles to the displacement of the soil passing through the two existing piles.

Author Contributions

Conceptualization, C.L.; methodology, Q.T.; software, M.H.; validation, L.H. and R.W.; formal analysis, L.H.; investigation, L.H. and S.C.; resources, C.L. and Q.T.; writing—original draft preparation, C.L.; writing—review and editing, Q.T.; visualization, M.H. supervision, S.C. All authors have read and agreed to the published version of the manuscript.

Funding

This work was funded by the Research Project of China Railway Siyuan Survey and Design Group Co., Ltd. (No. 2022K003), the National Natural Science Foundation of China (No. 42007268), postdoctoral innovation practice positions in Hubei Province (No. RCXM2022002) and the China Postdoctoral Science Foundation (No. 2021M703002).

Institutional Review Board Statement

Not applicable.

Informed Consent Statement

Not applicable.

Data Availability Statement

Not applicable.

Conflicts of Interest

The authors declare no conflict of interest.

References

  1. Lehane, B.; Pennington, D.; Clarke, S. Jacked end-bearing piles in the soft alluvial sediments of Perth. Aust. Geomech. 2003, 38, 123–133. [Google Scholar]
  2. Zhou, S.; Shan, Y.; Wu, Z.; Zhao, W.; Yang, L.; Lin, Y. Lateral deformation of high-speed railway foundation induced by adjacent embankment construction in soft soils: Numerical and field study. Transp. Geotech. 2023, 41, 101005. [Google Scholar] [CrossRef]
  3. Li, T.; Su, Q.; Kaewunruenc, S. Influences of piles on the ground vibration considering the train-track-soil dynamic interactions. Comput. Geotech. 2020, 120, 103455. [Google Scholar] [CrossRef]
  4. Bond, A.J.; Jardine, R.J. Effects of installing displacement piles in a high OCR clay. Geotechnique 1991, 40, 341–363. [Google Scholar] [CrossRef]
  5. Hwang, J.H.; Liang, N.; Chen, C.H. Ground response during pile driving. J. Geotech. Geoenviron. 2001, 127, 939–949. [Google Scholar] [CrossRef]
  6. Yang, J.; Tham, L.G.; Lee, P.K.K.; Chan, S.T.; Yu, F. Behaviour of jacked and driven piles in sandy soil. Geotechnique 2006, 56, 245–259. [Google Scholar] [CrossRef]
  7. Lee, F.H.; Juneja, A.; Tan, T.S. Stress and pore pressure changes due to sand compaction pile installation in soft clay. Geotechnique 2004, 54, 1–16. [Google Scholar] [CrossRef]
  8. Liu, C.; Tang, X.; Wei, H.; Zhao, H. A new spatial deformation measurement method using 3D reconstruction technology during pile penetration. KSCE J. Civ. Eng. 2021, 25, 4106–4120. [Google Scholar] [CrossRef]
  9. Li, Y.; Zhang, G.; Liu, C. Effects of Pile Installation Simulation on Behavior of Pile Groups in Centrifuge Model Tests. Geotech. Test. J. 2018, 41, 221. [Google Scholar] [CrossRef]
  10. Carter, J.P.; Randolph, M.F.; Wroth, C.P. Stress and pore pressure changes in clay during and after the expansion of a cylindrical cavity. Int. J. Numer. Anal. Met. 1979, 3, 305–322. [Google Scholar] [CrossRef]
  11. Carter, J.P.; Yu, H.S. Cavity expansion in cohesive-frictional soils with limited dilation. Géotechnique 2021, 73, 629–635. [Google Scholar] [CrossRef]
  12. Chai, J.; Carter, J.P.; Miura, N.; Zhu, H. Improved Prediction of Lateral Deformations due to Installation of Soil-Cement Columns. J. Geotech. Geoenviron. Eng. 2009, 135, 155. [Google Scholar] [CrossRef]
  13. Zhai, Z.; Ma, S.; Zhang, Y.; Zhang, C. Undrained solution of cylindrical cavity expansion for unsaturated soils with modified Cam-clay model. IOP Conf. Ser. Earth Environ. Sci. 2021, 787, 012159. [Google Scholar] [CrossRef]
  14. Baligh, M.M. Strain path method. J. Geotech. Eng. 1985, 111, 1108–1136. [Google Scholar] [CrossRef]
  15. Sagaseta, C.; Whittle, A.J.; Santagata, M. Deformation analysis of shallow penetration in clay. Int. J. Numer. Anal. Met. 1997, 21, 687–719. [Google Scholar] [CrossRef]
  16. Ko, J.; Jeong, S.; Lee, J.K. Large deformation FE analysis of driven steel pipe piles with soil plugging. Comput. Geotech. 2016, 71, 82–97. [Google Scholar] [CrossRef]
  17. Pucker, T.; Grabe, J. Numerical simulation of the installation process of full displacement piles. Comput. Geotech. 2012, 45, 93–106. [Google Scholar] [CrossRef]
  18. Qiu, G.; Henke, S.; Grabe, J. Application of a Coupled Eulerian–Lagrangian approach on geomechanical problems involving large deformations. Comput. Geotech. 2011, 38, 30–39. [Google Scholar] [CrossRef]
  19. Sabetamal, H.; Nazem, M.; Carter, J.P.; Sloan, S.W. Large deformation dynamic analysis of saturated porous media with applications to penetration problems. Comput. Geotech. 2014, 55, 117–131. [Google Scholar] [CrossRef]
  20. Sheng, D.; Nazem, M.; Carter, J.P. Some computational aspects for solving deep penetration problems in geomechanics. Comput. Mech. 2009, 44, 549–561. [Google Scholar] [CrossRef]
  21. Yang, Z.X.; Gao, Y.Y.; Jardine, R.J.; Guo, W.B.; Wang, D. Large Deformation Finite-Element Simulation of Displacement-Pile Installation Experiments in Sand. J. Geotech. Geoenviron. Eng. 2020, 146, 2274. [Google Scholar] [CrossRef]
  22. Lorenzo, R.; da Cunha, R.P.; Cordão Neto, M.P.; Nairn, J.A. Numerical simulation of installation of jacked piles in sand using material point method. Can. Geotech. J. 2018, 55, 131–146. [Google Scholar] [CrossRef]
  23. Phuong, N.T.V.; van Tol, A.F.; Elkadi, A.S.K.; Rohe, A. Numerical investigation of pile installation effects in sand using material point method. Comput. Geotech. 2016, 73, 58–71. [Google Scholar] [CrossRef]
  24. Gao, L.; Guo, N.; Yang, Z.; Jardine, R.J. MPM modeling of pile installation in sand: Contact improvement and quantitative analysis. Comput. Geotech. 2022, 151, 104943. [Google Scholar] [CrossRef]
  25. Lim, Y.; Tan, S.; Phoon, K. Application of Press-Replace Method to Simulate Undrained Cone Penetration. Int. J. Geomech. 2018, 18, 1186. [Google Scholar] [CrossRef]
  26. Tan, J.; Goh, S.; Tan, S. Numerical Analysis of a Jacked-In Pile Installation in Clay. Int. J. Geomech. 2023, 23, 7946. [Google Scholar] [CrossRef]
  27. Mabsout, M.E.; Sadek, S.M.; Smayra, T.E. Pile driving by numerical cavity expansion. Int. J. Numer. Anal. Met. 1999, 23, 1121–1140. [Google Scholar] [CrossRef]
  28. Al Ammari, K.; Clarke, B.G. Effect of vibro stone-column installation on the performance of reinforced soil. J. Geotech. Geoenviron. Eng. 2018, 144, 04018056. [Google Scholar] [CrossRef]
  29. Guetif, Z.; Bouassida, M.; Debats, J.M. Improved soft clay characteristics due to stone column installation. Comput. Geotech. 2007, 34, 104–111. [Google Scholar] [CrossRef]
  30. Oliveira, B.C.; Sales, M.M.; Angelim, R.R.; Galvani, L.C., Jr. Numerical simulations of displacement piles in a tropical soil. Soils Rocks 2023, 46, 4522. [Google Scholar] [CrossRef]
  31. Lin, C.; Wang, R.; Huang, M.; Huang, L.; Tan, Q. Study on Disturbance Mechanism of Squeezed and Non-Squeezed Soil Piles on Soft Soil Foundation. Appl. Sci. 2023, 13, 7757. [Google Scholar] [CrossRef]
  32. Nguyen, H.H.; Khabbaz, H.; Fatahi, B. A numerical comparison of installation sequences of plain concrete rigid inclusions. Comput. Geotech. 2019, 105, 1–26. [Google Scholar] [CrossRef]
  33. Luo, Z.; Tao, Y.; Gong, X.; Zou, B. Soil compacting displacements for two jacked piles considering shielding effects. Acta Geotech. 2020, 15, 2367–2377. [Google Scholar] [CrossRef]
  34. Zhou, P.; Li, J.; Li, L.; Xie, F. Analysis of the existing pile response induced by adjacent pile driving in undrained clay. Comput. Geotech. 2021, 138, 104319. [Google Scholar] [CrossRef]
  35. Shan, Y.; Xiao, W.; Ma, W.; Liu, J.; Xiang, K. Influence of developed Benoto piling on the deformation of adjacent high-speed railway subgrade in soft soil area. J. Railw. Sci. Eng. 2022. [Google Scholar] [CrossRef]
  36. Le Kouby, A.; Dupla, J.C.; Canou, J.; Francis, R. The effects of installation order on the response of a pile group in silica sand. Soils Found. 2016, 56, 174–188. [Google Scholar] [CrossRef]
  37. Geramian, A.; Castro, J.; Ghazavi, M.; Miranda, M. Installation of groups of stone columns in clay: 3D Coupled Eulerian Lagrangian analyses. Comput. Geotech. 2022, 151, 104931. [Google Scholar] [CrossRef]
  38. de Farias Dias, A.B.; da Silva, T.A.; Gomes, I.F.; Ferreira, S.R.D.M.; Gusmão, A.D.; Joseph, J.B.; Cordão Neto, M.P. Numerical Simulation of Embankment Construction on Soft Soil: A Case. Geotech. Geol. Eng. 2022, 40, 5181–5204. [Google Scholar] [CrossRef]
  39. Oliveira, P.J.V.; Pinheiro, J.L.; Correia, A.A. Numerical analysis of an embankment built on soft soil reinforced with deep mixing columns: Parametric study. Comput. Geotech. 2011, 38, 566–576. [Google Scholar] [CrossRef]
  40. Li, Z.; Chen, Z.; Wang, L.; Zeng, Z.; Gu, D. Numerical simulation and analysis of the pile underpinning technology used in shield tunnel crossings on bridge pile foundations. Undergr. Space 2021, 6, 396–408. [Google Scholar] [CrossRef]
  41. Zeng, Y.; Bai, Y.; Zou, Y.; Huang, B. Numerical Study on Stratigraphic and Structural Deformation Patterns Considering Surface Load with Pile-Beam-Arch Method Construction. Symmetry 2022, 14, 1892. [Google Scholar] [CrossRef]
  42. Chen, G.; Zou, L.; Wang, Q.; Zhang, G. Pile-Spacing Calculation of Anti-Slide Pile Based on Soil Arching Effect. Adv. Civ. Eng. 2020, 2020, 7149379. [Google Scholar] [CrossRef]
  43. Zhang, D.; Cui, H.; Lei, Z.; Zhang, X.; Wang, Z.; Bai, Y.; Zhao, H. Soil arching effect of composite piles supporting foundation pits based on mechanical model and photoelastic experiment. Opt. Lasers Eng. 2023, 6, 396–408. [Google Scholar] [CrossRef]
  44. Dong, J. Study on Three-Dimensional Soil Arching Effect of Cantilever Piles and Ground Resisting Force Acted on Its Build-in Zone; Chongqing University: Chongqing, China, 2009. [Google Scholar]
  45. Kourkoulis, R.; Gelagoti, F.; Anastasopoulos, I.; Gazetas, G. Slope Stabilizing Piles and Pile-Groups: Parametric Study and Design Insights. J. Geotech. Geoenviron. Eng. 2011, 137, 663–677. [Google Scholar] [CrossRef]
Figure 1. (a) Triaxial test system; (b) K0 consolidation meter.
Applsci 13 09478 g001
Figure 2. Three-dimensional numerical model of a foundation containing a pile group.
Applsci 13 09478 g002
Figure 3. Pile body grids and expansion vectors of the cylinder/semi-sphere.
Applsci 13 09478 g003
Figure 4. Pile group installation sequence and layout of monitoring profiles.
Applsci 13 09478 g004
Figure 5. Displacement contour maps along A-A’ profile during sequential installation of three rows of hydrostatic piles.
Applsci 13 09478 g005
Figure 6. Comparison of superimposed accumulative displacement and actual accumulative displacement of single-row piles: (a) layout of monitoring points for single row piles; (b) layout of monitoring points for three row piles; (ce) displacement curves at monitoring points located at distances of 2.5 m, 5.0 m, and 7.5 m from the single row pile, respectively; (f) displacement curves of superimposed displacement and actual displacement.
Applsci 13 09478 g006
Figure 7. Horizontal displacement trajectories of pile heads and soil points during sequential installation of a 3 × 3 pile group.
Applsci 13 09478 g007
Figure 8. Lateral displacements induced by soil squeezing in the E and W directions at the ground surface.
Applsci 13 09478 g008
Figure 9. Distribution of the maximum principal stress in the soil profile at a depth of 5 m; (ac) the maximum principal stress contour maps of the soil after the installation of the first row, second row, and third row piles, respectively.
Applsci 13 09478 g009
Figure 10. Distribution of radial stress in soil around the piles at the ground surface.
Applsci 13 09478 g010
Figure 11. Variation of soil stress-XX with depth at (a) X = −5 m and (b) X = 5 m along the x-axis.
Applsci 13 09478 g011
Figure 12. Variation in soil stress-XX along the A-A’ profile at a depth of 5 m.
Applsci 13 09478 g012
Figure 13. Variation in soil stress-XX along the B-B′ profile at a depth of 5 m.
Applsci 13 09478 g013
Figure 14. Contour maps of soil strain increments at a depth of 5 m after the first row of piles is installed; (a) Strain increment in the X direction; (b) Strain increment in the Y direction.
Applsci 13 09478 g014
Figure 15. Additional strain increases in soil between the first row of piles after the installation of the second and third rows of piles; (a) additional strain increase in the X direction; (b) additional strain increase in the Y direction.
Applsci 13 09478 g015
Figure 16. Distribution of soil stress-XX and soil arching effect between piles at a depth of 5 m.
Applsci 13 09478 g016
Table 1. Parameters used in the modified Cam–Clay model.
ParametersDensity (ρ/ kg∙m−3)Compression Index (Cc)Rebound Index (Cs)Critical Failure Ratio (M)Reference Porosity Ratio (e1)Initial Porosity Ratio (e0)Over
Consolidation Ratio (R)
Value16990.11920.01730.51830.51830.77092.0
Table 2. Pile properties used in the numerical model.
ParametersYoung’s
Modulus (E/MPa)
Poisson’s Ratio
(ν)
Bulk Modulus (K/MPa)Shear Modulus (G/MPa)
Value257.10.286200100
Disclaimer/Publisher’s Note: The statements, opinions and data contained in all publications are solely those of the individual author(s) and contributor(s) and not of MDPI and/or the editor(s). MDPI and/or the editor(s) disclaim responsibility for any injury to people or property resulting from any ideas, methods, instructions or products referred to in the content.

