Abstract
Compared to maximum state parameters, such as maximum altitude and Mach, the number of hovers and S turns can be used as process parameters representing the complexity of military aircraft maneuvers when classifying big flight mission data to compile flight load spectra for structures. This study developed intelligent statistical algorithms based on yaw angle data from flight parameters such as the number of hovers and S turns. Using the median-crossing de-redundant function of Phase-Sensitive Detection (PSD) and analyzing the characteristics of 360° hovering flight parameters, a statistical algorithm for the number of hovers during a flight profile is presented. Using the split-half function of PSD, a triangle layering algorithm based on the yaw angle signal was developed to count the number of S turns during a flight profile, where the signal of each sublayer is segmented into median-crossing intervals to eliminate the redundant median-crossing marks from the previous layer. Compared with artificial means, the statistical results of the flight example showed that the developed intelligent algorithms are effective.
1. Introduction
When compiling the full-scale load spectrum related to the rotor or bearing vibration in military engines based on flight parameters, there are more than 13 flight parameters on maneuvering operations involved in dynamic simulation analysis [1,2]. Because of the serious coupling between so many flight parameters, it is feasible to make the actual flight parameters of the flight mission the input for dynamic simulations so as to retain the actual coupling relationships. To simplify the load spectrum compilation work while achieving this goal, we need to classify the flight missions that are included in big flight data.
In Europe, Turbistan [3] first proposed a load spectrum compilation method related to aircraft missions, where the middle section of the aircraft is decomposed into three categories: air cruise, low maneuver, and high maneuver. In China, altitude and Mach are two flight parameters commonly used to compile mission spectra [4,5,6]. However, the yaw angle that represents the direction of flight maneuvers lacks attention, but we know that the direction of the maneuver, along with the altitude and the speed, are the three key factors in evaluating aircraft maneuverability. More than 7 out of 16 basic actions are related to aircraft hover, and S turns in Reference [4], and there are specific introductions to the load theory of turning actions in the pilot’s handbook [7], which implies that the flight direction should not be ignored when classifying flight missions.
On the other hand, compilation methods for full-scale load spectra do not ignore the yaw angle information, such as a severe spectrum [8,9,10], but the number of selected subjects about full-scale flight missions may be far less than which of the actual subjects [10]. The actual flight mission of military aircraft has very serious subject frequency mixing, and there are many subjects for the same engine models under different service environments; some subjects even include many subcategories generated at different flight altitudes and speeds so that the actual subjects cannot compile full-scale spectra for the rotor, and the dynamic simulations require further classification to flight subjects.
Hovers and S turns that reflect the directional changes in the flight process are closely related to the complexity of maneuvers, and many violent maneuvering actions need hovers or S turns as auxiliary movements, such as fancy somersaults, barrel rolls, etc. The number of hovers and S turns—along with the maximum altitude, maximum Mach, and flight time—are the feature parameters of flight mission classification for big flight data of the same engine model; in this study, we focus on introducing the flight state denoted by the number of hovers, and S turns into the compilation framework of load spectrum, similar to the current maximum flight states. However, studies using flight turn counting or detailed maneuvering actions to classify flight missions in big flight data are difficult to find; therefore, this study investigated a statistical method to analyze the number of hovers, and S turns by extracting the yaw angle features to create a pioneering exploration in this field.
Hovers and S turns during aircraft cruising may not be ideal actions due to weather, geographical conditions, flight operations, etc.; an aircraft often experiences occasional changes in direction during hover or S turn actions, and yaw angle data during these maneuvers often appear as violent jumps and weak fluctuations. This makes statistical analysis of the number of hovers, and S turns difficult. The actual flight parameter data have many weak fluctuations, so the peak–valley value method, which is suitable for calculating the number of inflection points, cannot be used for counting the number of hovers and S turns. Due to the instability of frequency, it is challenging for methods such as rain flow filtering [11] and cyclic counting, which are often used in the compilation of aircraft spectra, to accurately calculate the number of hovers and S turns in a flight profile, while other methods such as time-delay correlation [12] and empirical mode decomposition [13], used in the statistical analysis field of non-ergodic data, are highly dependent on frequency information and are not suitable for calculating the number of hovers and S turns. Due to the uncertainty of flight time history characteristics, methods that use theoretical fundamentals to solve the distance between two maneuvering profiles, such as principal component analysis [14], neural networks [15,16], or other types of machine learning algorithms [17,18], are unstable when applied to the classification and statistics of such yaw angle data.
This article presents the development of Phase-Sensitive Detection (PSD) statistical algorithms to calculate the number of 360° hovers, and S turns in a flight profile. Upon removing redundancy in the median-crossing marks of yaw angle data, the number of hovers can be deduced; meanwhile, through the layering function of PSD and layer-by-layer decomposition of the yaw angle signal, the number of S turns can also be obtained. Finally, the effectiveness of the statistical algorithms presented in this article was verified through a practical flight example.
2. History of Flight Yaw Angle
Figure 1 shows the time histories of the yaw angle obtained from two flight profiles. The yaw angle histories during aircraft cruising have obvious non-stationary and non-ergodic characteristics. There is a significant difference in hovering or turning time in the figure. One hover may take 3.7 s, while the other takes 74 s, a 20-fold difference. The angle rate of a hover is not constant but oscillates quickly or slowly throughout the process, and the frequency of the yaw angle changes unstably. Each maneuver is not ideal either, and many actions that change the yaw angle or angle rate are found in the hovering or turning process. For example, an aircraft enters a hover from a level flight state with a constant yaw angle or from an S-turn action with variable yaw angles and angle rates while completing a hover with a turn or other actions. All the above shows that the profiles of flight yaw angles do not have obvious time history characteristics. Thus, it is difficult to intelligently extract the number of 360° hovers, and S turns using signal analysis, but it is easy to manually count them from the time history according to the concepts of hovers and S turns. However, the latter is unsuitable for compiling flight service environment spectra when there are a large number of flight profile samples; thus, signal processing algorithms need to be investigated further to intelligently count the number of hovers, and S turns.
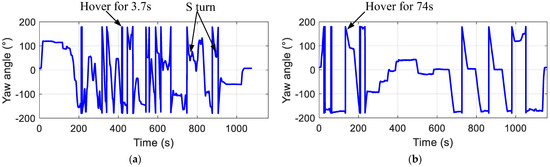
Figure 1.
Time history of yaw angles: (a) profile 1; (b) profile 2.
3. Phase Sensitive Detection
After clarifying the characteristics of yaw angle time history, this section details the design of statistical algorithms for calculating the number of hovers and S turns based on yaw angle data of the flight profile.
PSD is a signal demodulation method that uses equilibrium position processing of the positive and negative phases of vibration signals. This method can be easily implemented with diode circuits and is commonly used in hardware devices such as dynamic strain gauges and wireless receiving devices. Since the angle time history vibrates near its median during hover or S turn maneuvers, PSD algorithms with median theory can be used to decompose the time history signal and process yaw angle time history data to count the number of hovers and S-turns.
Let the yaw angle signal in a certain profile be as follows:
where is the ith sample point in signal and is the length of .
The following subsections provide PSD algorithms for processing yaw angle signals, including median retrieval, removing median-crossing redundancy, and signal splitting.
3.1. Median Retrieving Algorithm
Calculate the median of the yaw angle sequence as ; the sequence is defined by
where denotes a row vector. The median of the sequence is zero.
Let be the set of zero-crossing marks. For , we set Criterion 1:
If or , then the yaw angle signal passes through a value of zero one time and .
That is, if the sign of the yaw angles and are opposites, it can be inferred that passes through a zero point, and the number i (the time mark in this case) is put into set .
The number set yielded by Criterion 1 is annotated as , where is the ith term in the sequence and is the length of and the number of zero-crossing points in . Due to the number of zero-crossing points must be less than the length of the yaw angle time history (), we know that belongs to the natural number field with .
Through these operations, PSD retrieves the median terms and can count the number of median-crossing marks of the original signal .
3.2. Median De-Redundancy Algorithm
Mathematically, the time points and number of median-crossing marks from Criterion 1 are accurate, but for an actual yaw angle time history, it is necessary to remove the redundancy in the zero-crossing mark set . The reason for this operation is that, during an aircraft flight, there are always some deviations in the angle history due to factors such as weather conditions, geographic environment, etc.; however, these small deviations or oscillations near the median cannot denote hovering or S turn maneuvers. A threshold for such minor deviations will be set based on actual flight conditions so as to eliminate redundancy of such time points in .
Let the deviation threshold of yaw angles in a profile be c and the zero-crossing set of the yaw angle signal be as follows:
Then, we developed a de-redundancy algorithm that only retains the zero-crossing marks with a yaw angle variation larger than c in a small interval.
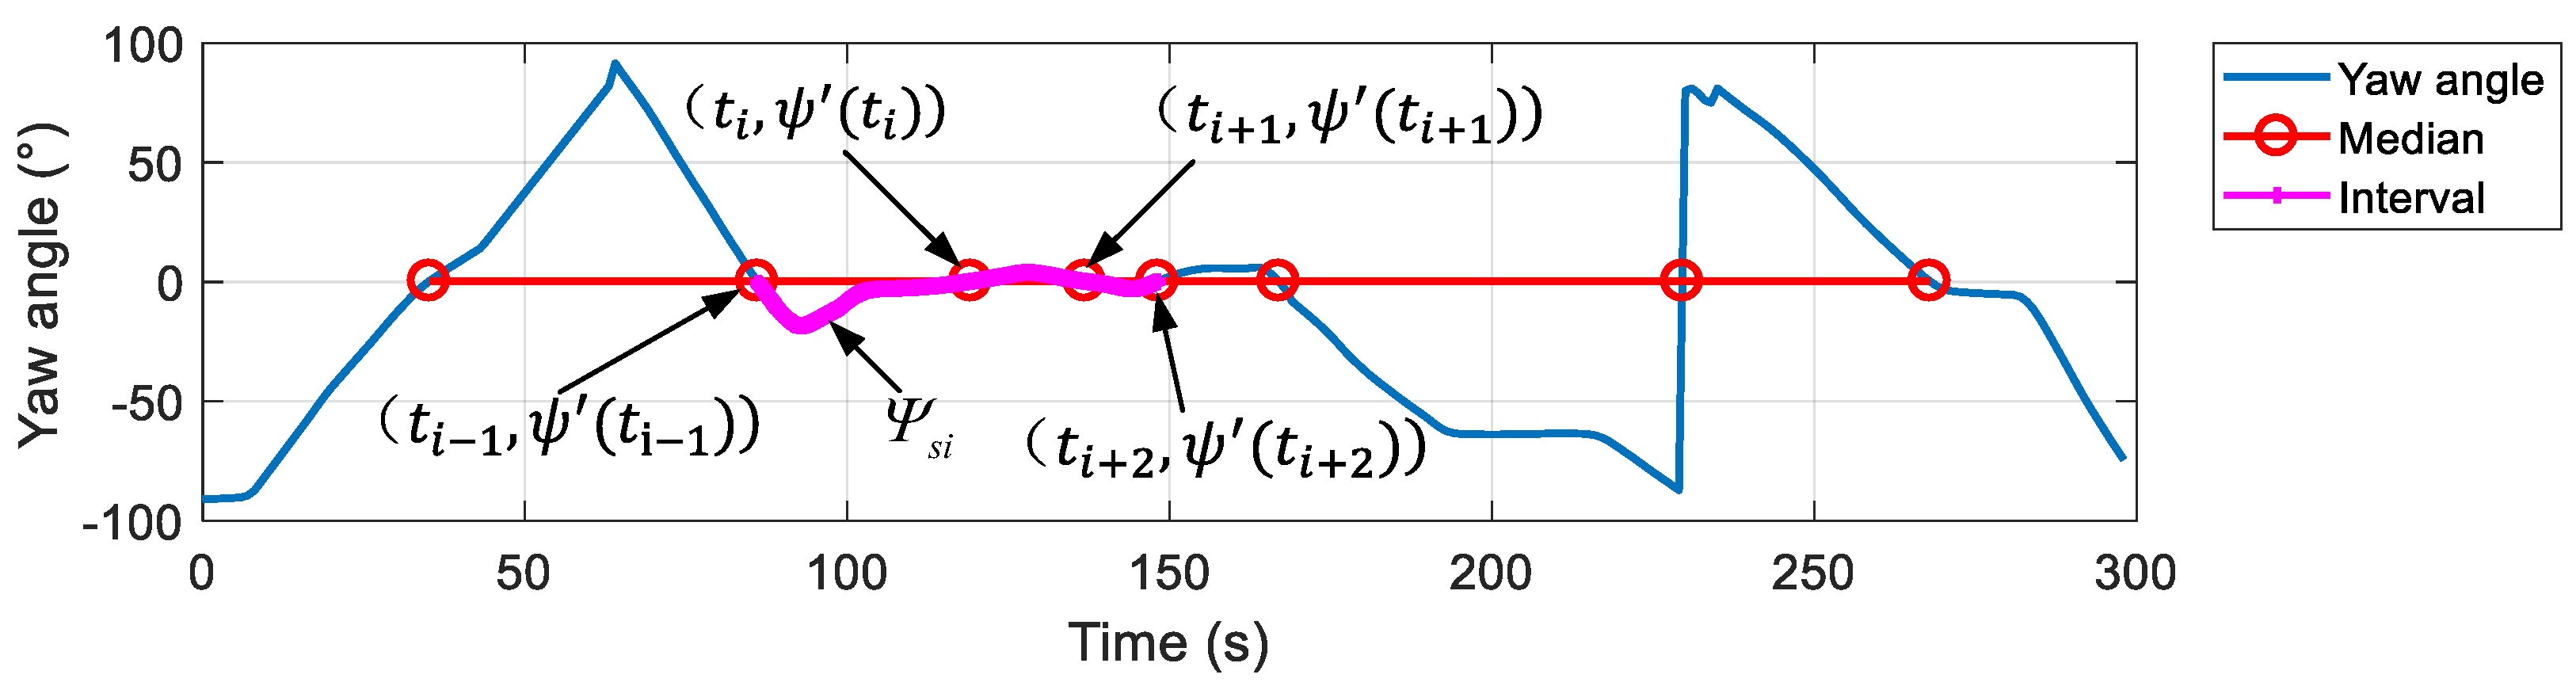
As shown in Figure 2, for a segmental sequence , define a semi-open interval where is the positive natural number field; then, the elements of the yaw angle within this argument interval partition are as follows:
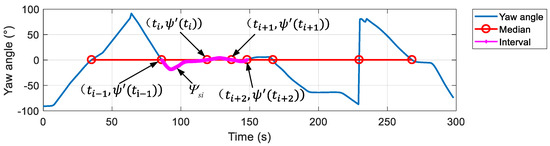
Figure 2.
The interval partition from zero-crossing marks.
Let and let the set of redundant zero-crossing points be . The criterion to judge whether zero-crossing points and are redundant is as follows:
Criterion 2: If , then and are redundant and .
Similar to obtaining set through Criterion 1, set can be yielded through Criterion 2. The meaning of Criterion 2 is that, for the zero-crossing points and , if the maximum fluctuation value of the yaw angles near them is less than the threshold c, it is determined that both of them are caused by small deviations in the yaw angles, but not the zero-crossing points that can represent a hover or S turn.
Calculate the difference set , where and are the zero-crossing set and the zero-crossing redundant set, respectively; the symbol “” denotes the difference operator, that is, removing the elements belonging to from we can write the following:
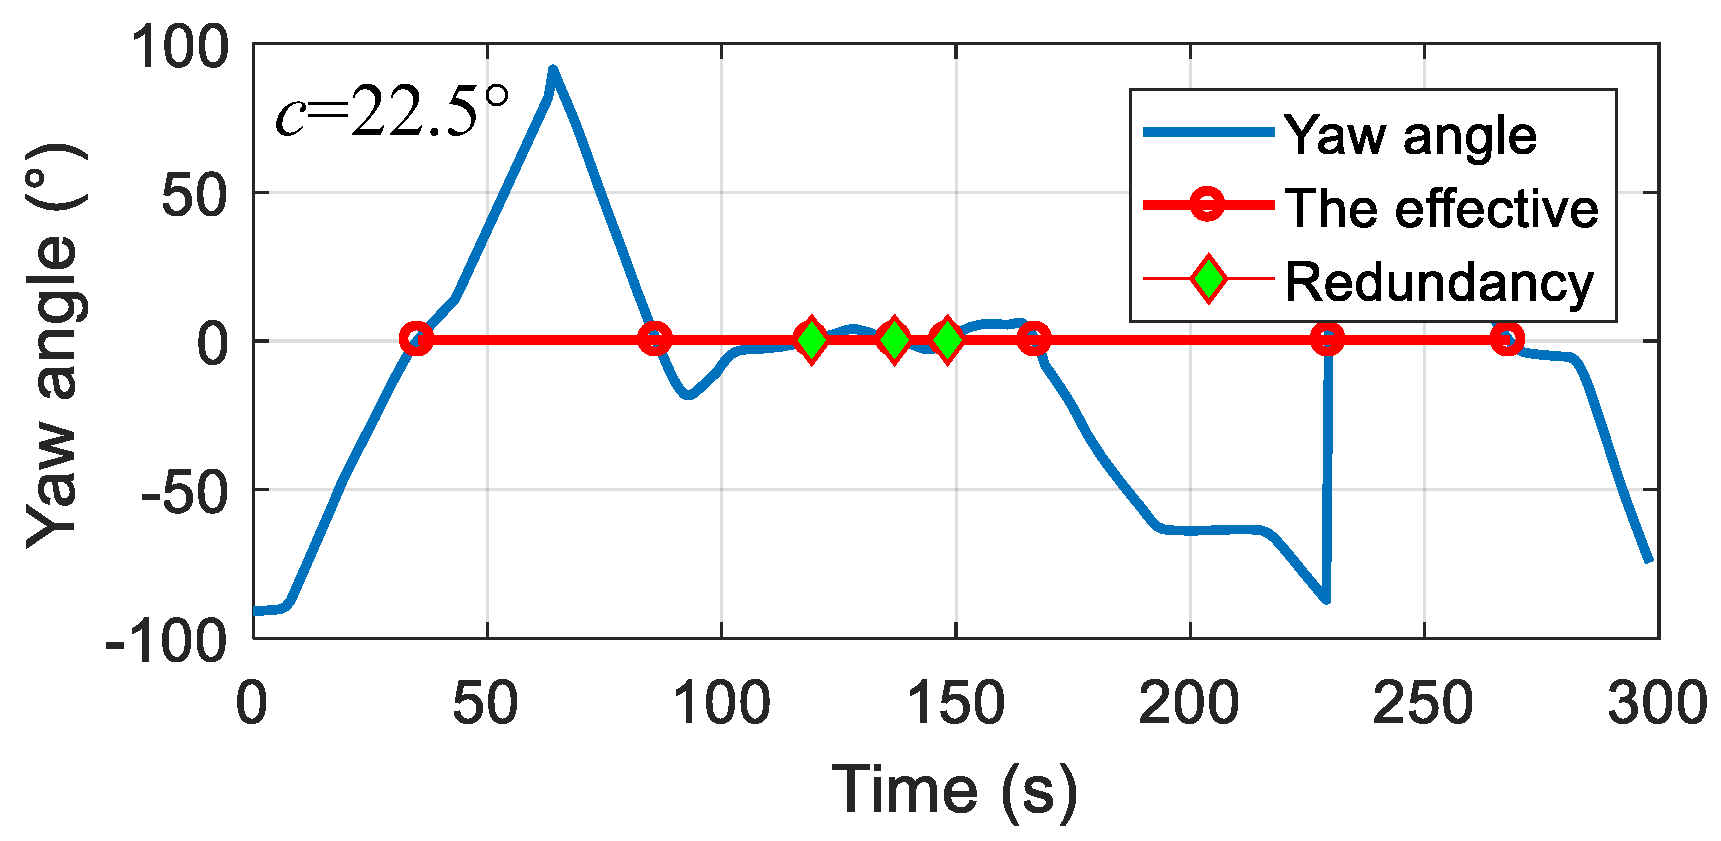
where is the length of . Thus, is the number of effective zero-crossing or median-crossing marks in the yaw angle signal , as shown in Figure 3.
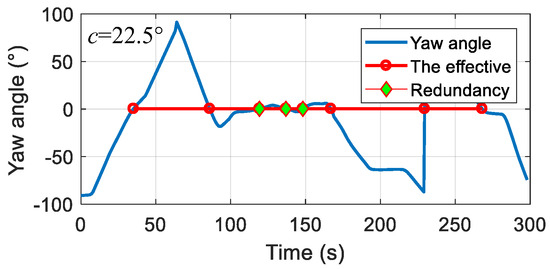
Figure 3.
The redundant median-crossing points.
3.3. Signal Splitting Algorithm
To use PSD to split the yaw angle signal in half, the calculation formula is as follows:
denotes the lower part after the yaw angle signal is decomposed by PSD and denotes the upper part.
PSD decomposes into the upper and lower halves by its median, with the upper retaining the terms with in their amplitudes and filling the others with the median, while the lower half retains terms with and filling the others with the median. As will be seen later in this article, this signal-processing method can be applied to the layer-by-layer counting of S turns.
The functions of PSD are shown in Figure 4.
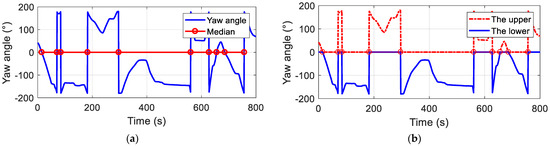
Figure 4.
The functions of PSD: (a) marking the median-crossing points; (b) splitting signal into halves using the median.
4. Statistical Algorithm for Hovers
After understanding the time history of the yaw angle and the PSD algorithm, this section will introduce a statistical algorithm for 360° hovers. Using the median-crossing retrieval and de-redundancy algorithms in Section 3.1 and Section 3.2, we can obtain the zero-crossing mark set that removed the redundant marks of . For the next step, we need to further count the number of hovers with the aid of the sequence .
First, based on the elements in , is segmented into semi-open intervals, where the symbol denotes a downward rounding operator. For , the elements of the yaw angle within the segmental interval are as follows:
Let , and define the set H for 360° hover maneuvers and set S for non-hovering maneuvers. Note that the angle change for a hover is 360°, and a criterion for hover can be expressed based on this characteristic.
Criterion 3: If , then the aircraft does one hovering action ; otherwise, .
In Criterion 3, 360 represents a hovering angle of 360°, and c represents the threshold for deviation of the yaw angle; the purpose of this threshold is to avoid Criterion 3 failure due to sampling errors of the yaw angle recorded in a discrete manner. The meaning of Criterion 3 is that, for the zero-crossing mark , if the amplitude fluctuation of the yaw angles near it is greater than the threshold ()°, it is inferred that the aircraft has hovered once; otherwise, the action taken is not a hover, although the aircraft crosses the median.
As mentioned above, if the length of set H is , then is the number of hovers in a flight profile.
5. Statistical Algorithm for S Turns
From Criterion 3 and the concept of S turns, it can be seen that S is actually a mark set for S turn maneuvers in which the change in yaw angle is less than 360° (or ()° when considering the threshold). Similar to set H, if the number of elements in set S is , , then the aircraft takes S turns times near the median of , where the superscript or subscript “0” represents the S turn number obtained from the original signal .
However, in addition to S turns near , an aircraft also turns in an S shape near other yaw angles, as shown in Figure 1a, where the aircraft performs an S turn near a yaw angle of 50°. Thus, statistical algorithms for the S turns of an aircraft near other angles rather than will be studied in this section. The general thinking is that, with the help of PSD splitting the signal into halves, the original signal is divided into several layers; then, the S turns of each layer can be are cyclically counted, and at the end, statistical algorithms for S turns of an aircraft in a flight profile were developed.
5.1. Layering Algorithm
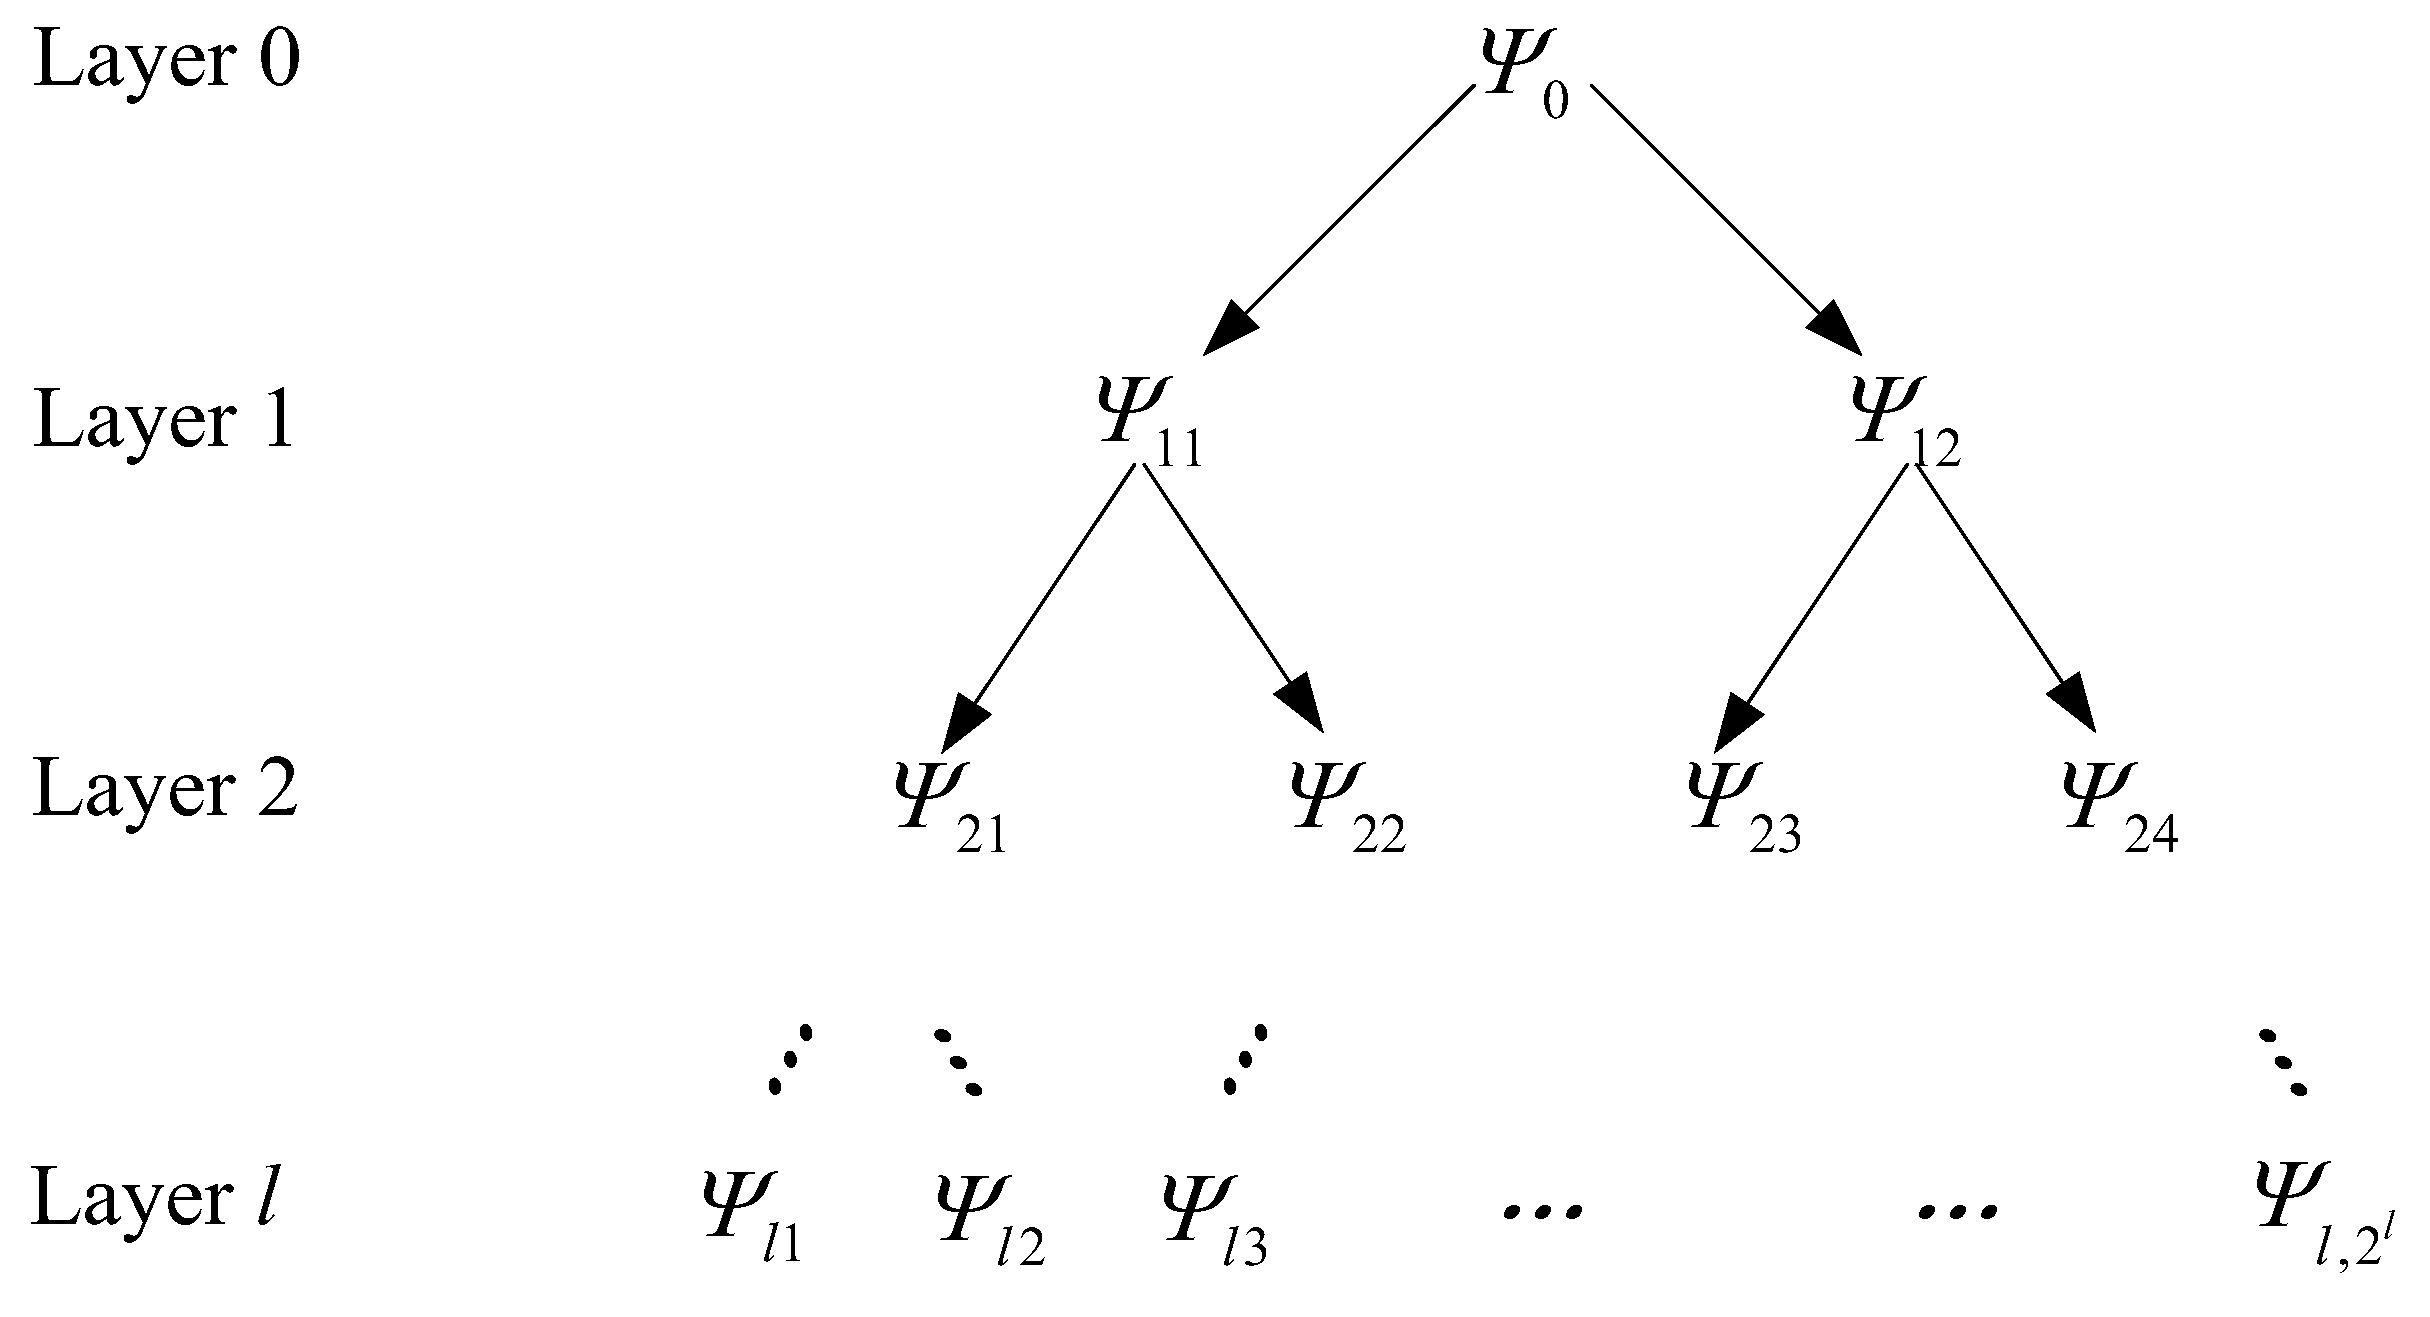
As shown in Figure 5, the signal splitting algorithm in Section 3.3 is used to decompose into triangle sublayers. The first layer of decomposition obtains yaw angle signals, which are annotated as and ; the second layer obtains yaw angle signals, which are annotated as , , , and ; if a total of l layers of decomposition are carried out, the number of yaw angle signals in the last layer is , annotated in sequence as , , ,…, and .

Figure 5.
Layering algorithm.
5.2. Statistical Algorithm
Using the first layer as an example to illustrate the S-turn statistical algorithm for each sublayer signal, for the lower half signal , based on the theory in Section 3.2, solve the set , which is the set of de-redundant median-crossing marks. The subscript or superscript “11” represents the number of the solved sublayer and is the length of . It should be noted that for the lower of , there are hovering and S-turning marks in set which have already been counted by set H and set S. That is to say, even after removing redundant median-crossing points with yaw angle deviations below threshold c for the sublayer sequence, there are still redundant points that have been counted by the previous layers, as shown in Figure 6. Therefore, further redundancy removal algorithms are needed for .

Figure 6.
The redundant median-crossing points in a sublayer.
Before designing the algorithm, we noticed that an S turn has paired rising and falling edges; therefore, one can mark an S turn using only the median-crossing point of its rising edge, as shown in Figure 7.
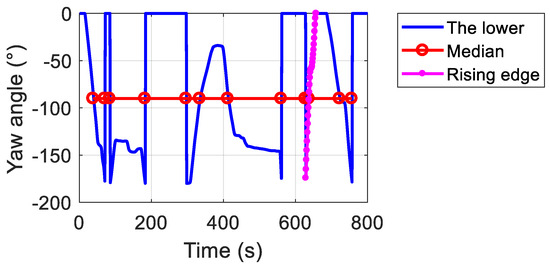
Figure 7.
The rising edge on a sublayer.
For , if the yaw angle at is in the rising edge, needs satisfy the following inequality:
Then, we can determine whether median-crossing mark of the rising edge is a redundant point. From Figure 6, it can be seen that if is a redundant point, then, in the open interval (,), there exists one or more points of which yaw angle equals the median of the previous layer, and because is the lower half signal of the previous layer, for the angle segment , it must satisfy the following:
For example, in Figure 8 will be removed from . Upon removing the redundant elements in set , and retaining only the elements that satisfy Equation (7) but not Equation (8), a set of median-crossing points can be obtained by removing the marks related to the previous layer. The new set is annotated as if the length of is ; then, is the number of S turns in the current sublayer.
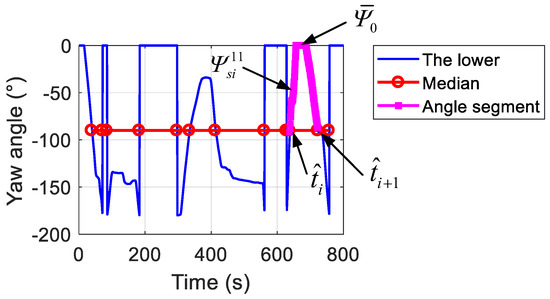
Figure 8.
The introduction for removing redundancy.
For the upper half signal , in order to use the above algorithm of the lower , let ; then, similar to , the number of S turns on can be obtained as well. Because , is the number of S turns in the upper half signal .
After obtaining the number of S turns of the lower and the upper , the total number of S turns in the first layer can be expressed by .
Thus, if is divided into l layers, the number of S turns during a whole takeoff-to-landing profile of an aircraft is the sum of the numbers from the original signal and all sublayers; that is, the total number of S turns on a profile is as follows:
It should be noted that the number of signal layers should not be more than ; otherwise, when the median-crossing de-redundancy algorithm is applied to a layer with a number larger than , 0 points passing through the median position will be found, that is, the length of will be , and thus, the statistical algorithm becomes invalid.
6. Flowchart of Statistical Algorithms
Figure 9 shows the general flowchart for calculating the number of hovers and S turns from the yaw angle time series during a takeoff-to-landing flight profile.
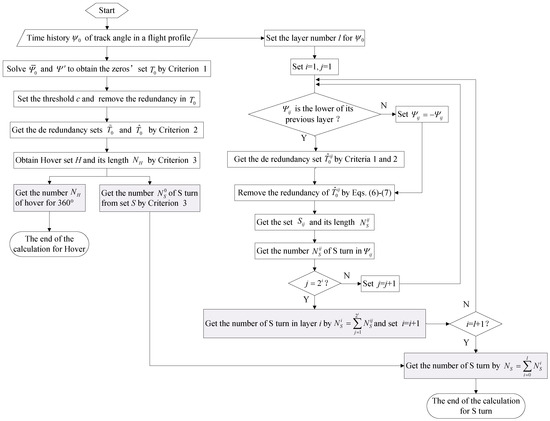
Figure 9.
The general flowchart.
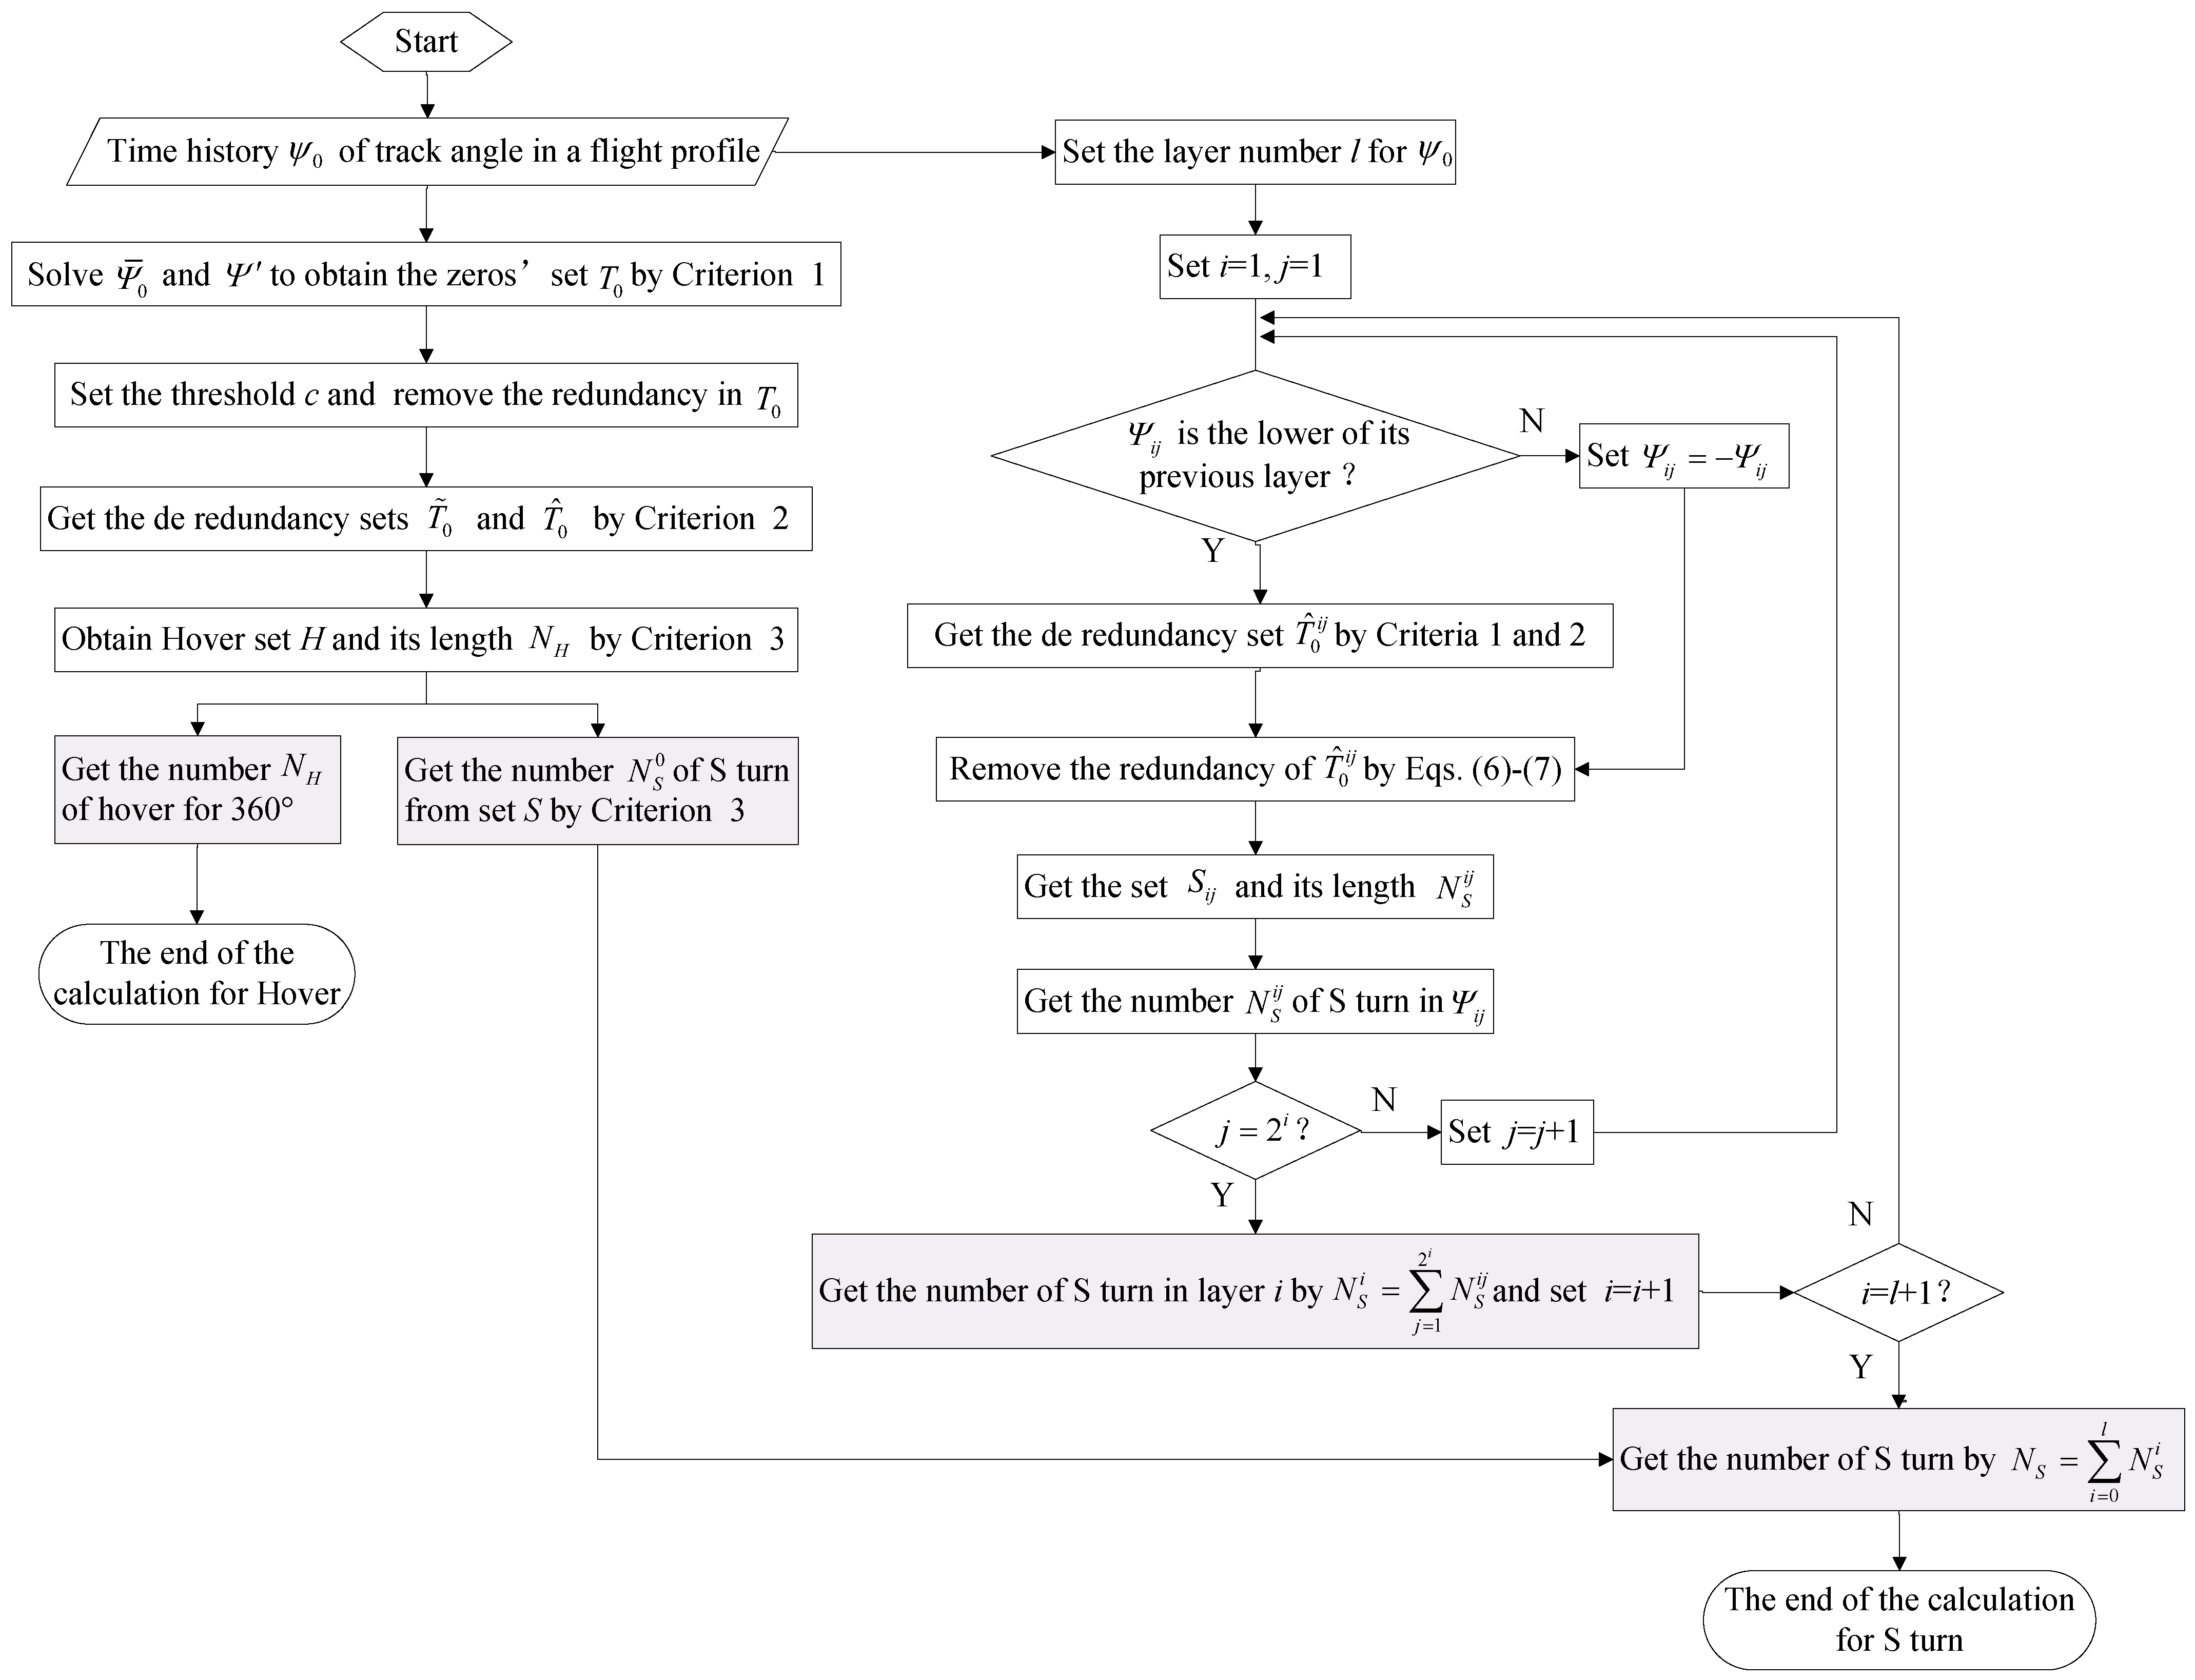
First, count the number of S turns in the original signal . Based on Criterion 1, the sequence that denotes the median of or the zero-crossing sequence of can be obtained. Then, by Criterion 2, the redundant terms in can be found. After the operation that removes the redundant marks, the number of 360° hovers during the takeoff-to-landing profile can be worked out by the deviation threshold of the yaw angle and Criterion 3. At the end of the above operations, the number that denotes the number of S turns near the median of the yaw angle can be obtained.
Next, count the number of S turns in the original signal . We set the number of layers to be l, and use the signal-splitting property of PSD to decompose . Let i = 1 and j = 1; for the lower signal , calculate its de-redundant sequence using Criteria 1 and 2. It should be noted that only the marks with a yaw angle deviation less than the threshold c are removed from , while the marks that have been counted in the previous layer still exist in . Therefore, use Formulas (6) and (7) to further remove redundancy so as to obtain the effective set of marks and the number of S turns of the jth sub-signal in the ith layer. Then, count the number of S turns in the other decomposed signals in the ith layer cyclically; if is the upper half signal in the layer, . When the counting of S turns in each signal in the ith layer is completed, we can obtain the number of the ith layer by . Next, update i = i + 1, and repeat these operations until i > l; then, can be obtained.
Finally, the number of S turns is .
7. Flight Example
Using the yaw angle signal shown in Figure 1a as an example, we determined the number of hovers and S turns. Let the yaw angle deviation threshold c = 22.5° and the number of S-turn decomposed layers l = 2; the results are shown in Figure 10, Figure 11, Figure 12 and Figure 13.

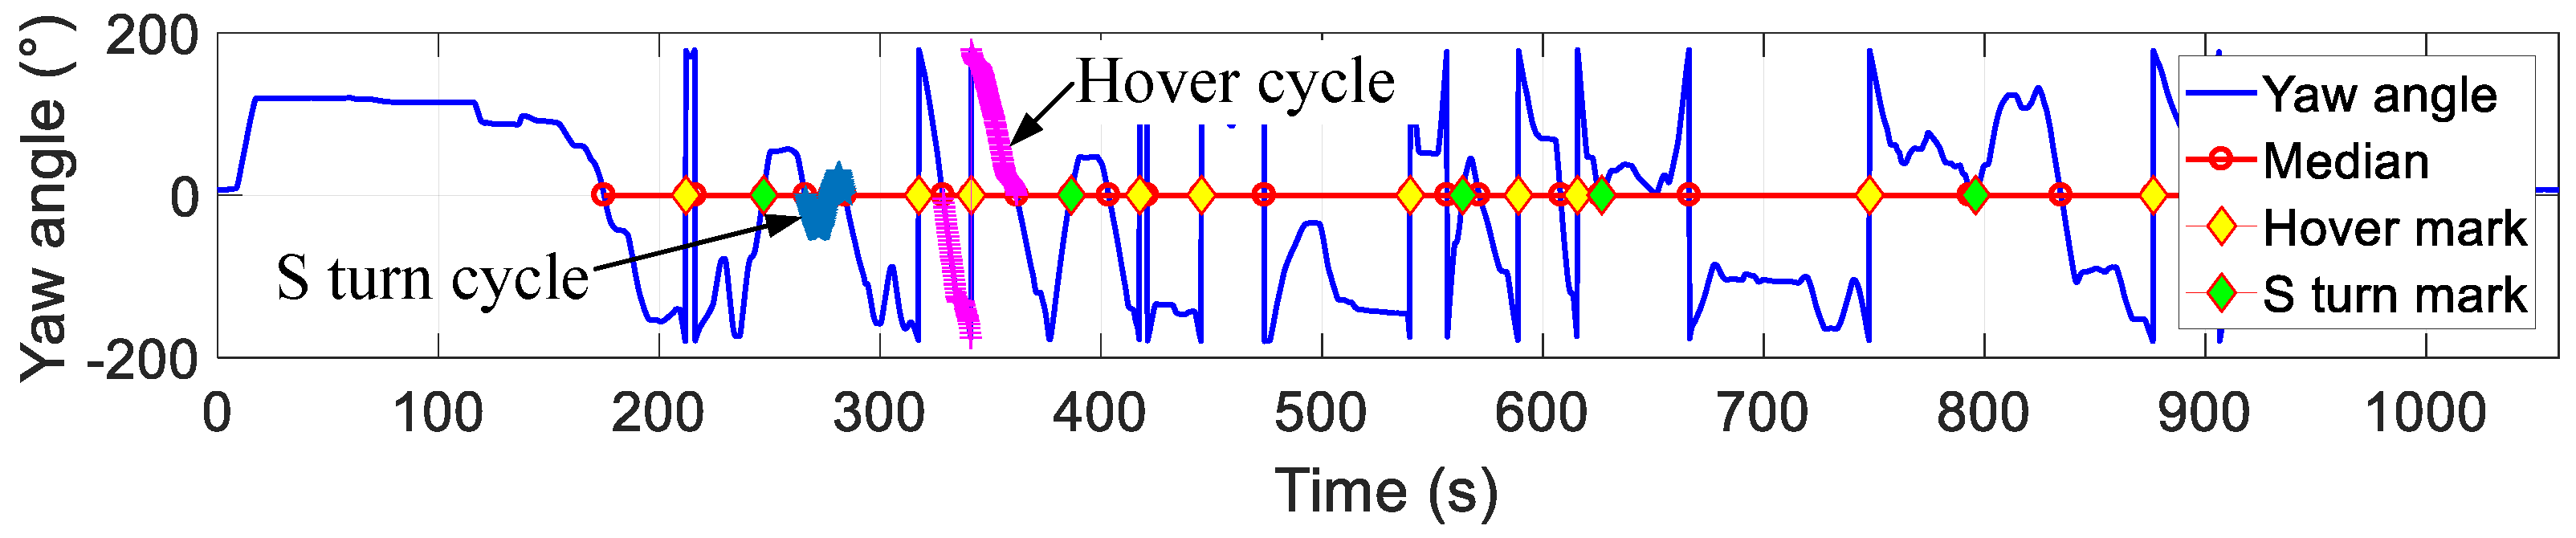
Figure 10.
The number of hovers and S turns from the original signal.
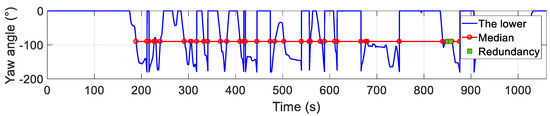
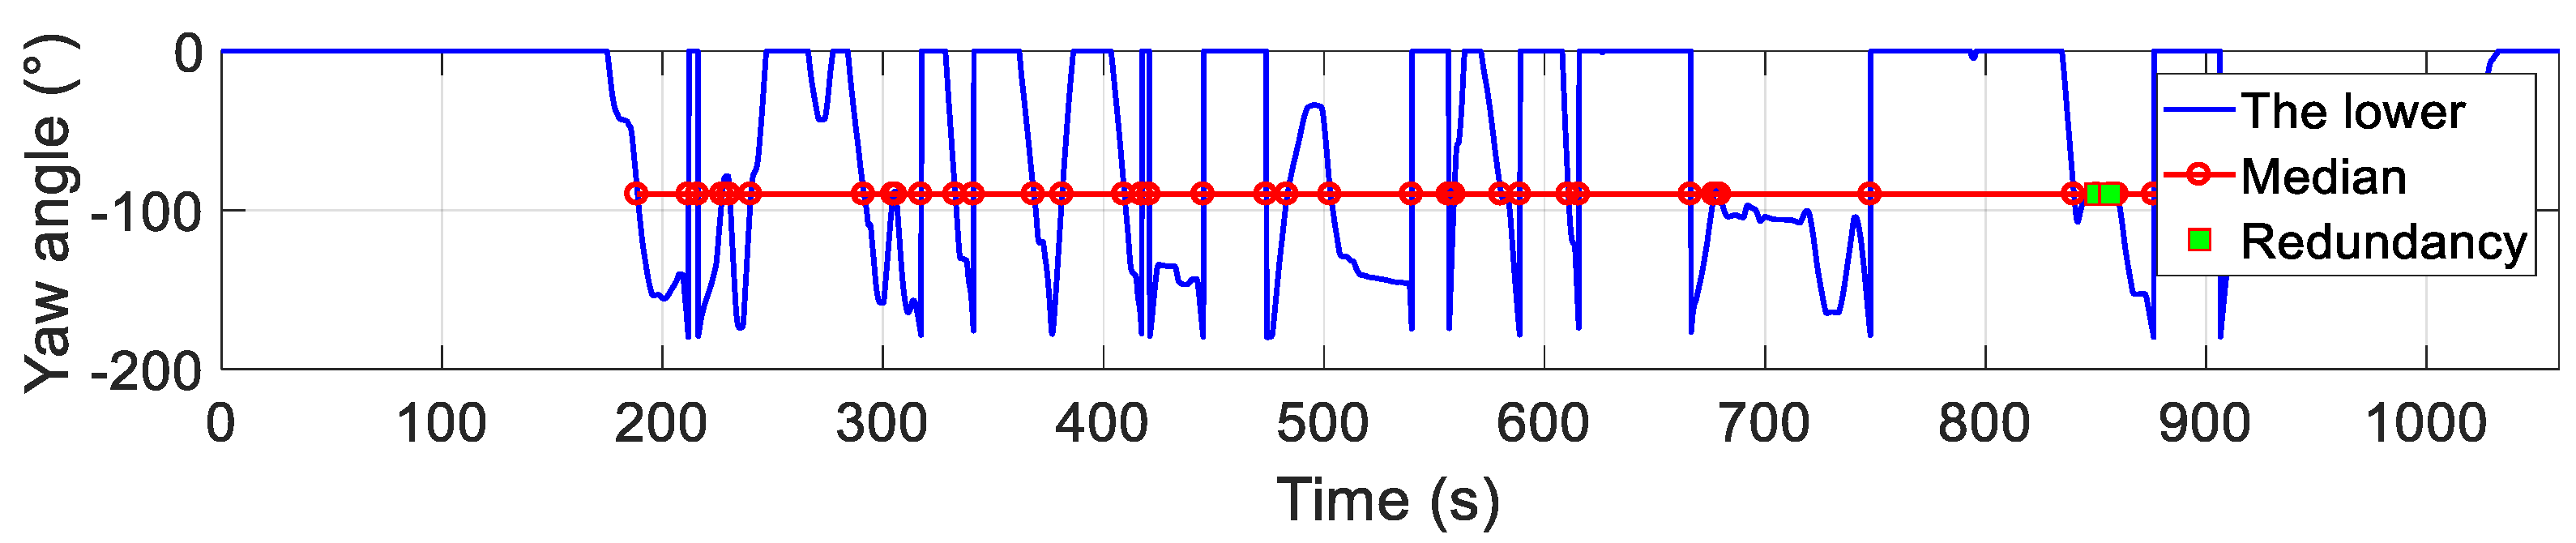
Figure 11.
Median-crossing de-redundancy for sublayer.
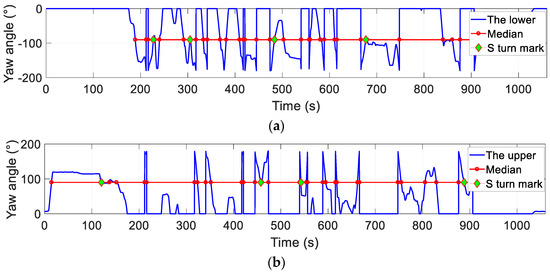
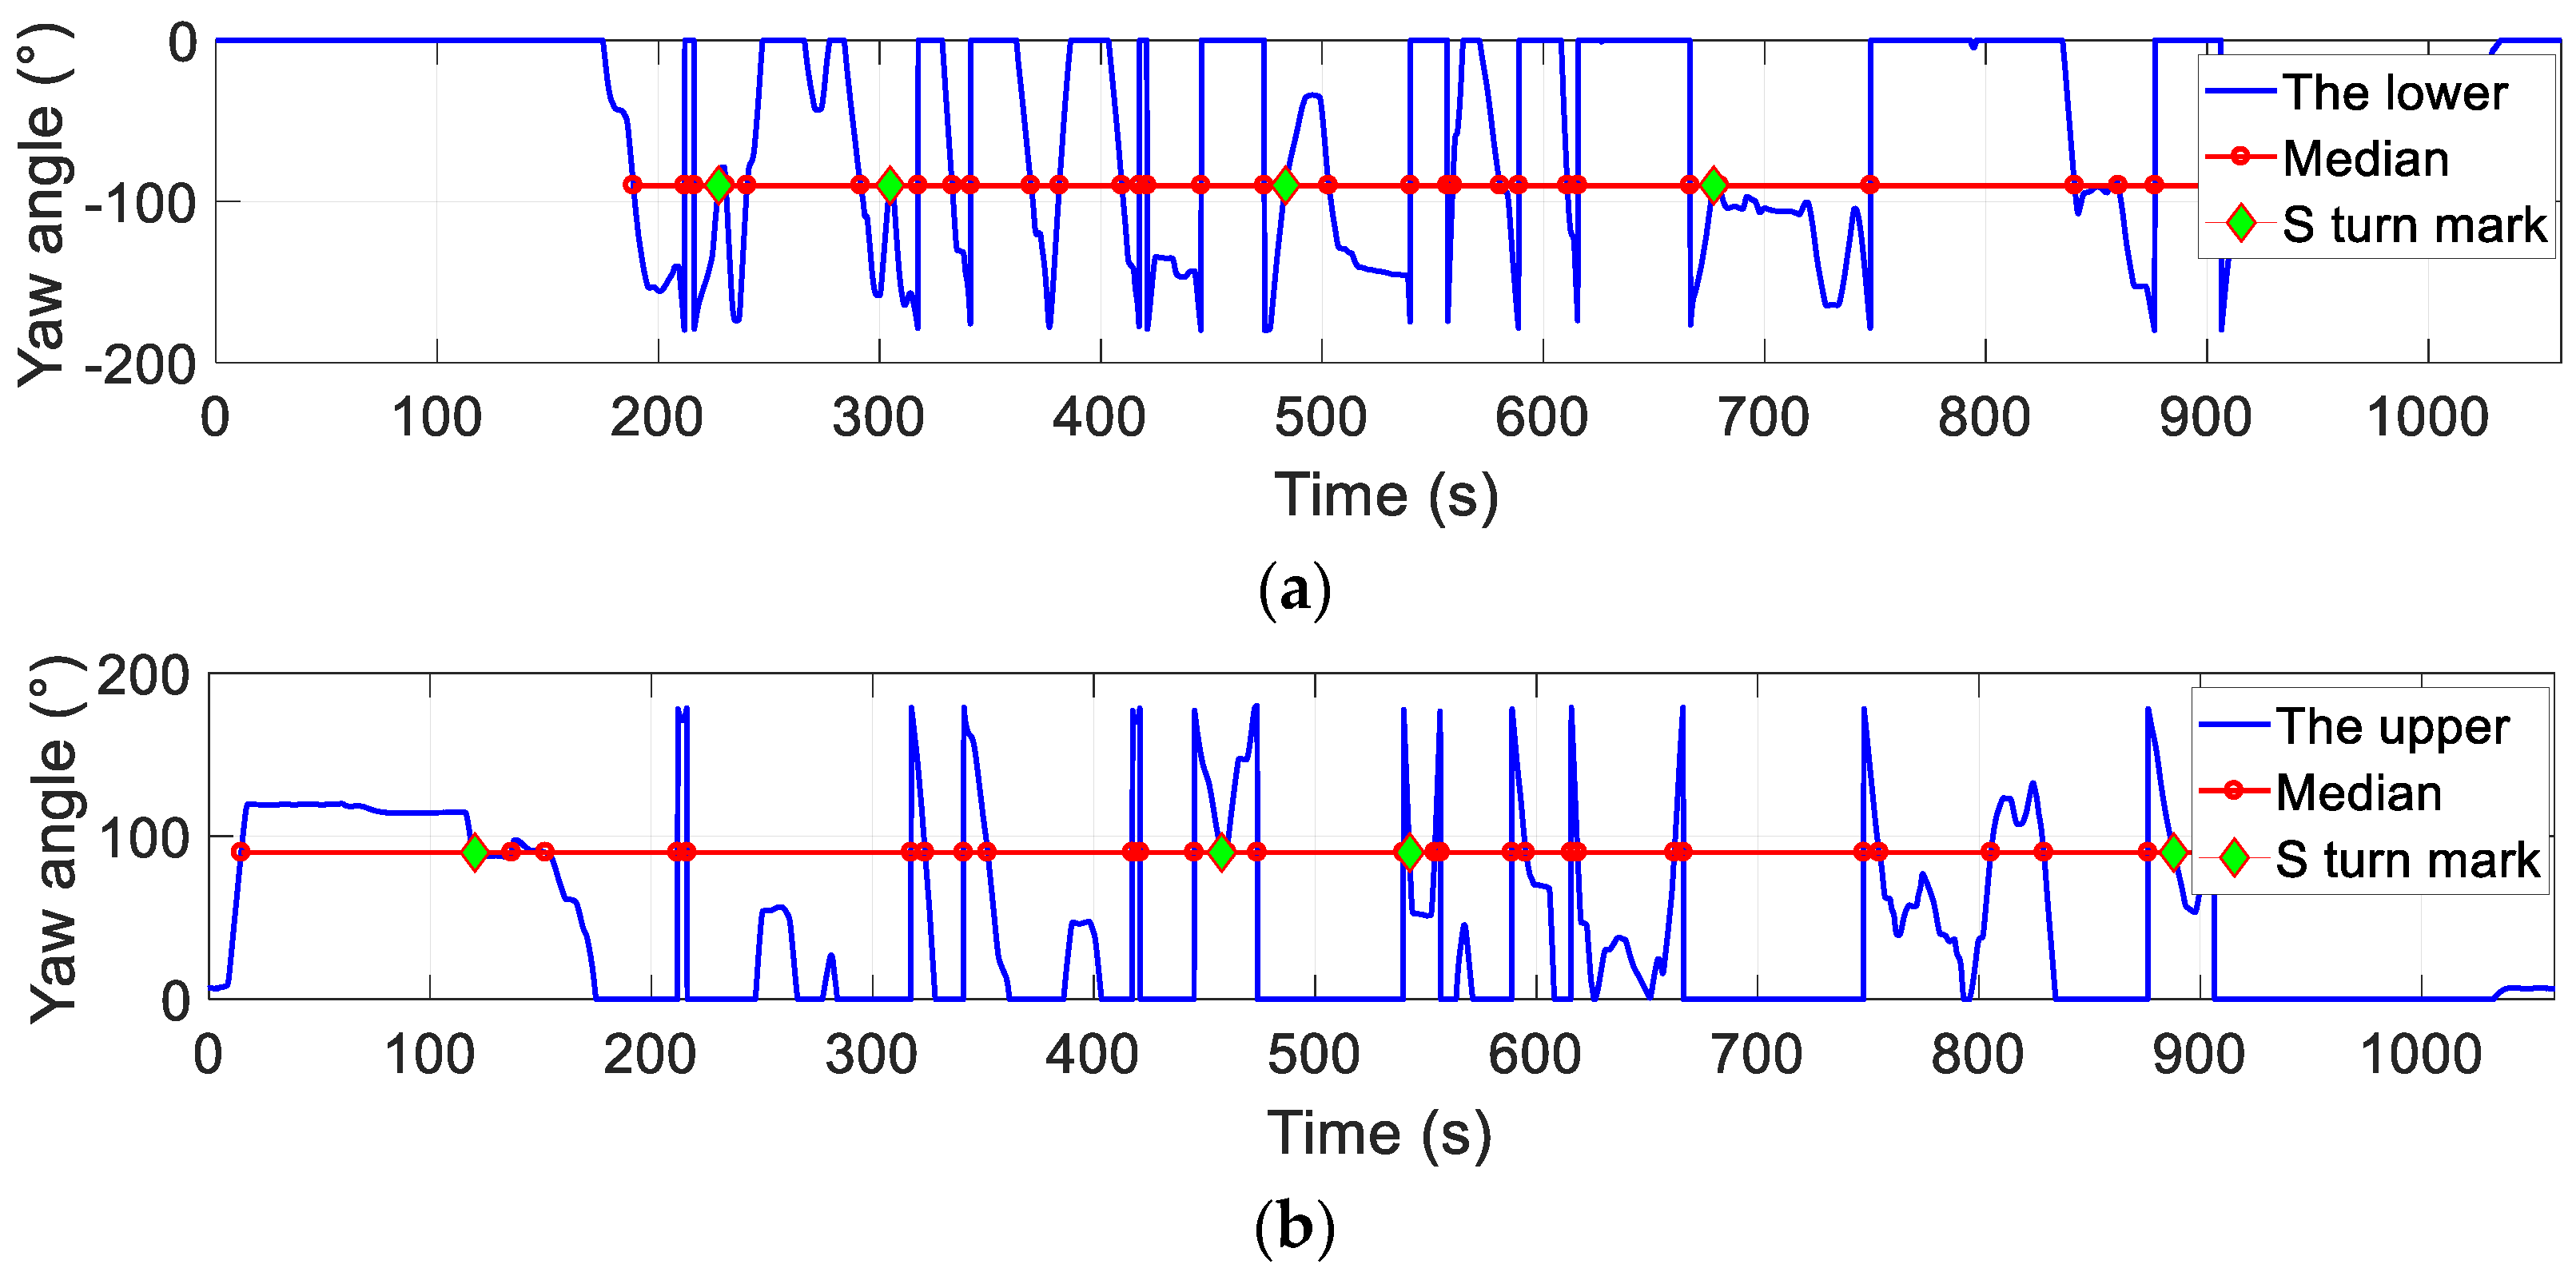
Figure 12.
The first layer of S turns: (a) lower part; (b) upper part.
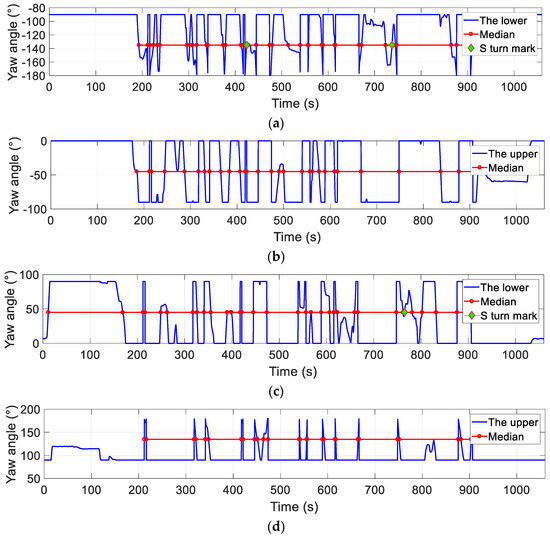
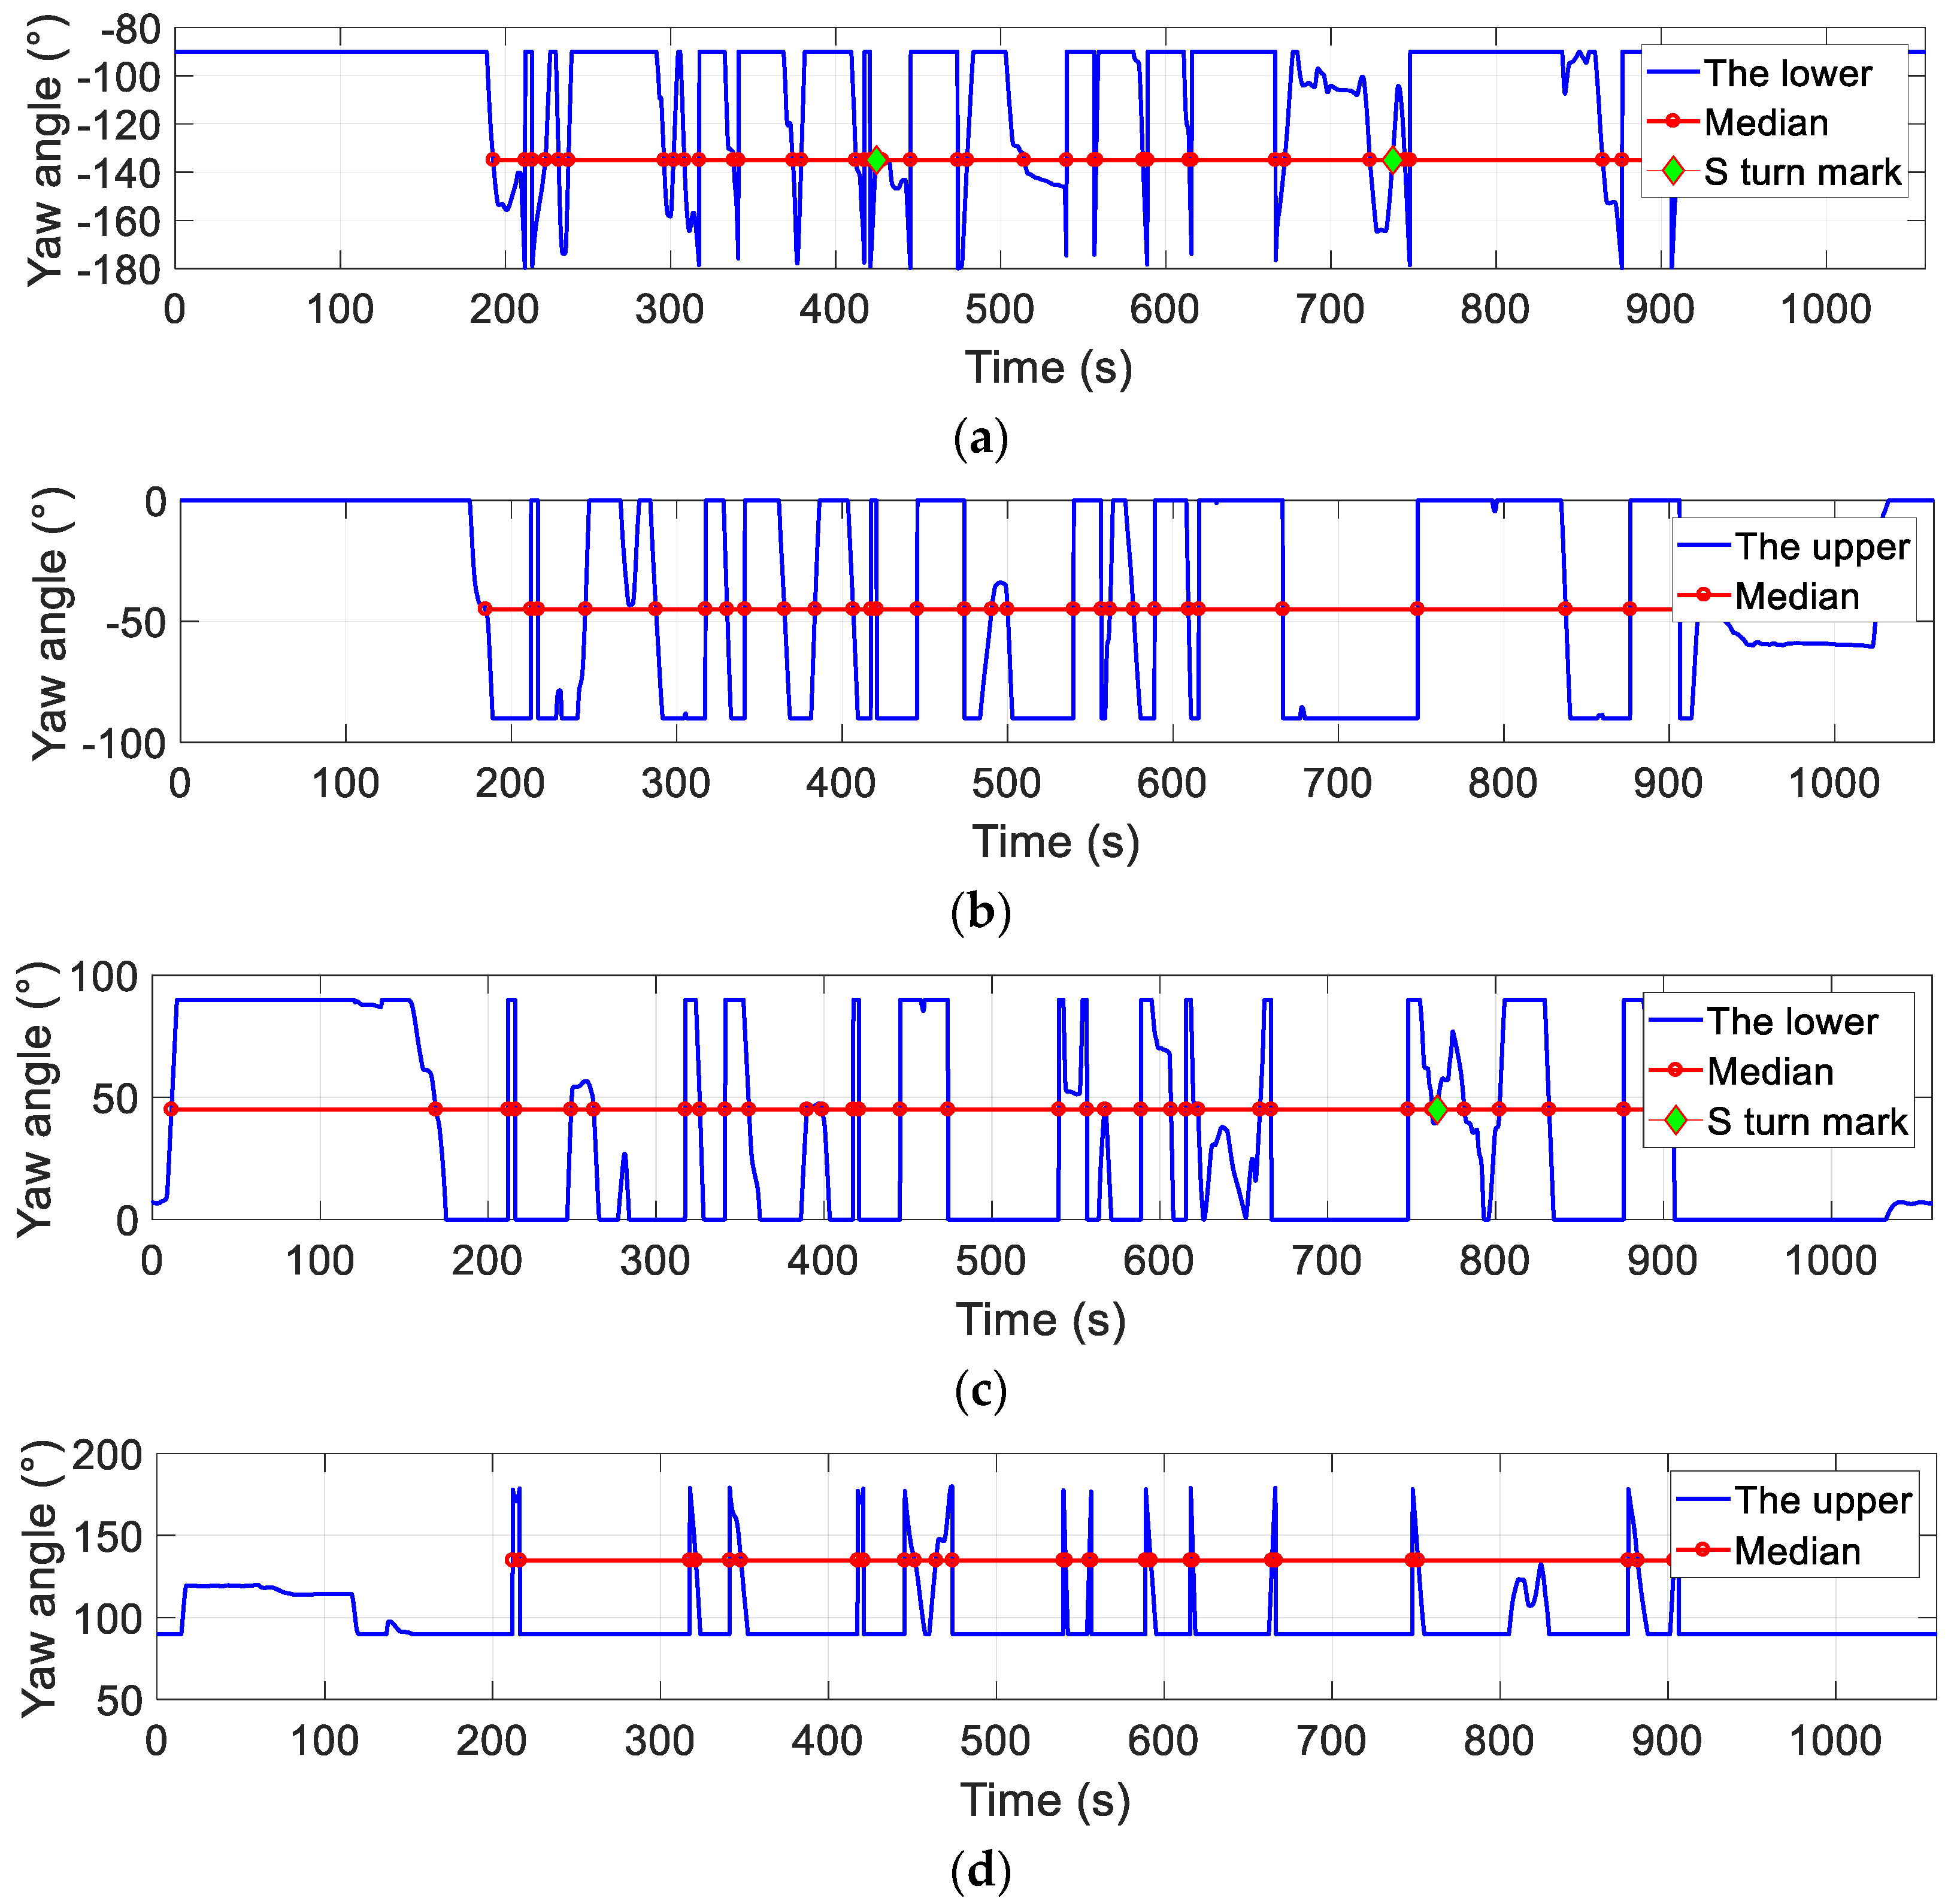
Figure 13.
The second layer of S turns: (a) 1st sublayer; (b) 2nd sublayer; (c) 3rd sublayer; (d) 4th sublayer.
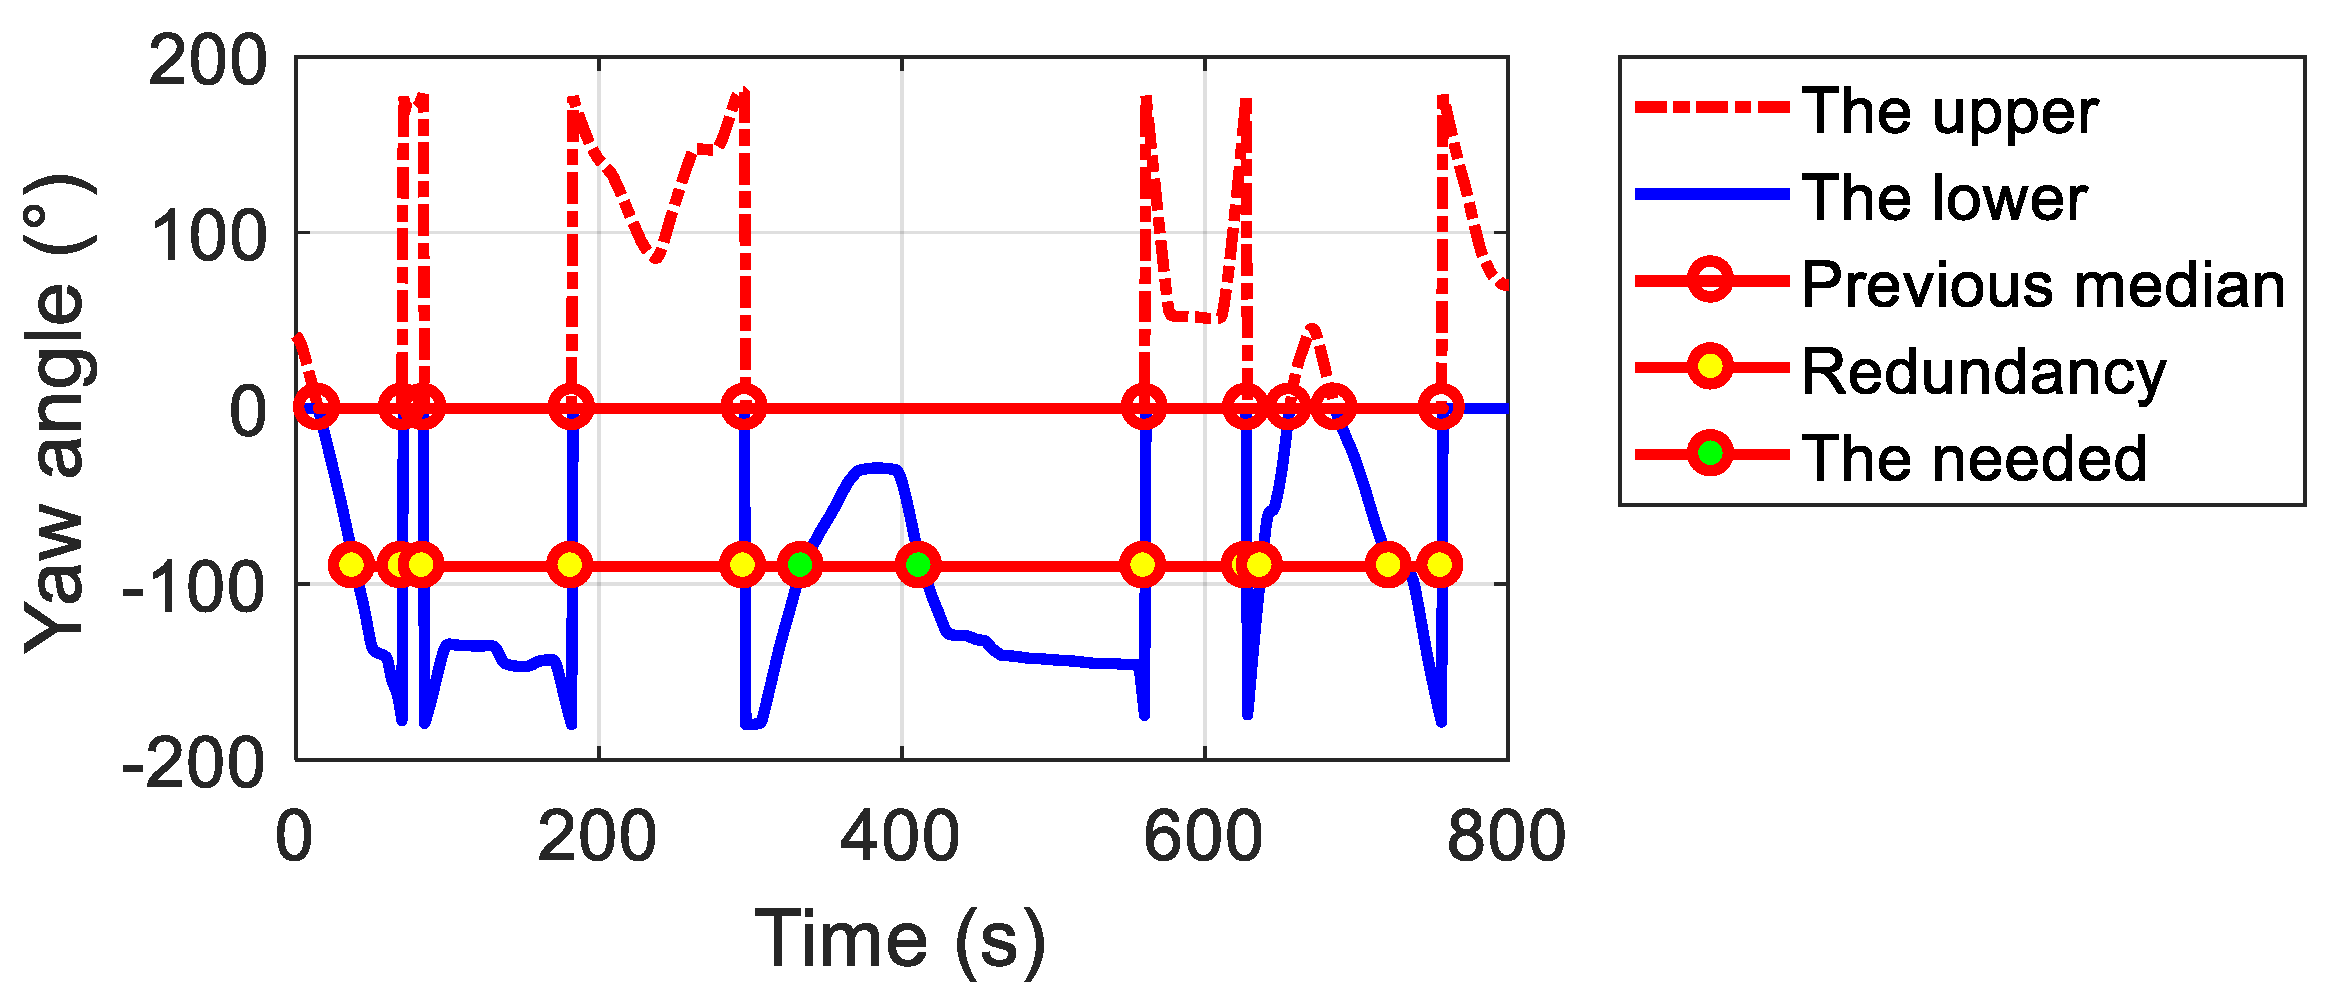
Figure 10 shows the statistical results for the number of hovers and S turns from the original yaw angle signal . Using the statistical algorithm for 360° hovers, the set of the median, the set H of hover marks, and the set S of S turn marks near the median of were counted as shown. The hover marks and S turn marks were counted, and it can be inferred that the number of 360° hovers of the aircraft during this profile was , and the number of S turns in this layer was .
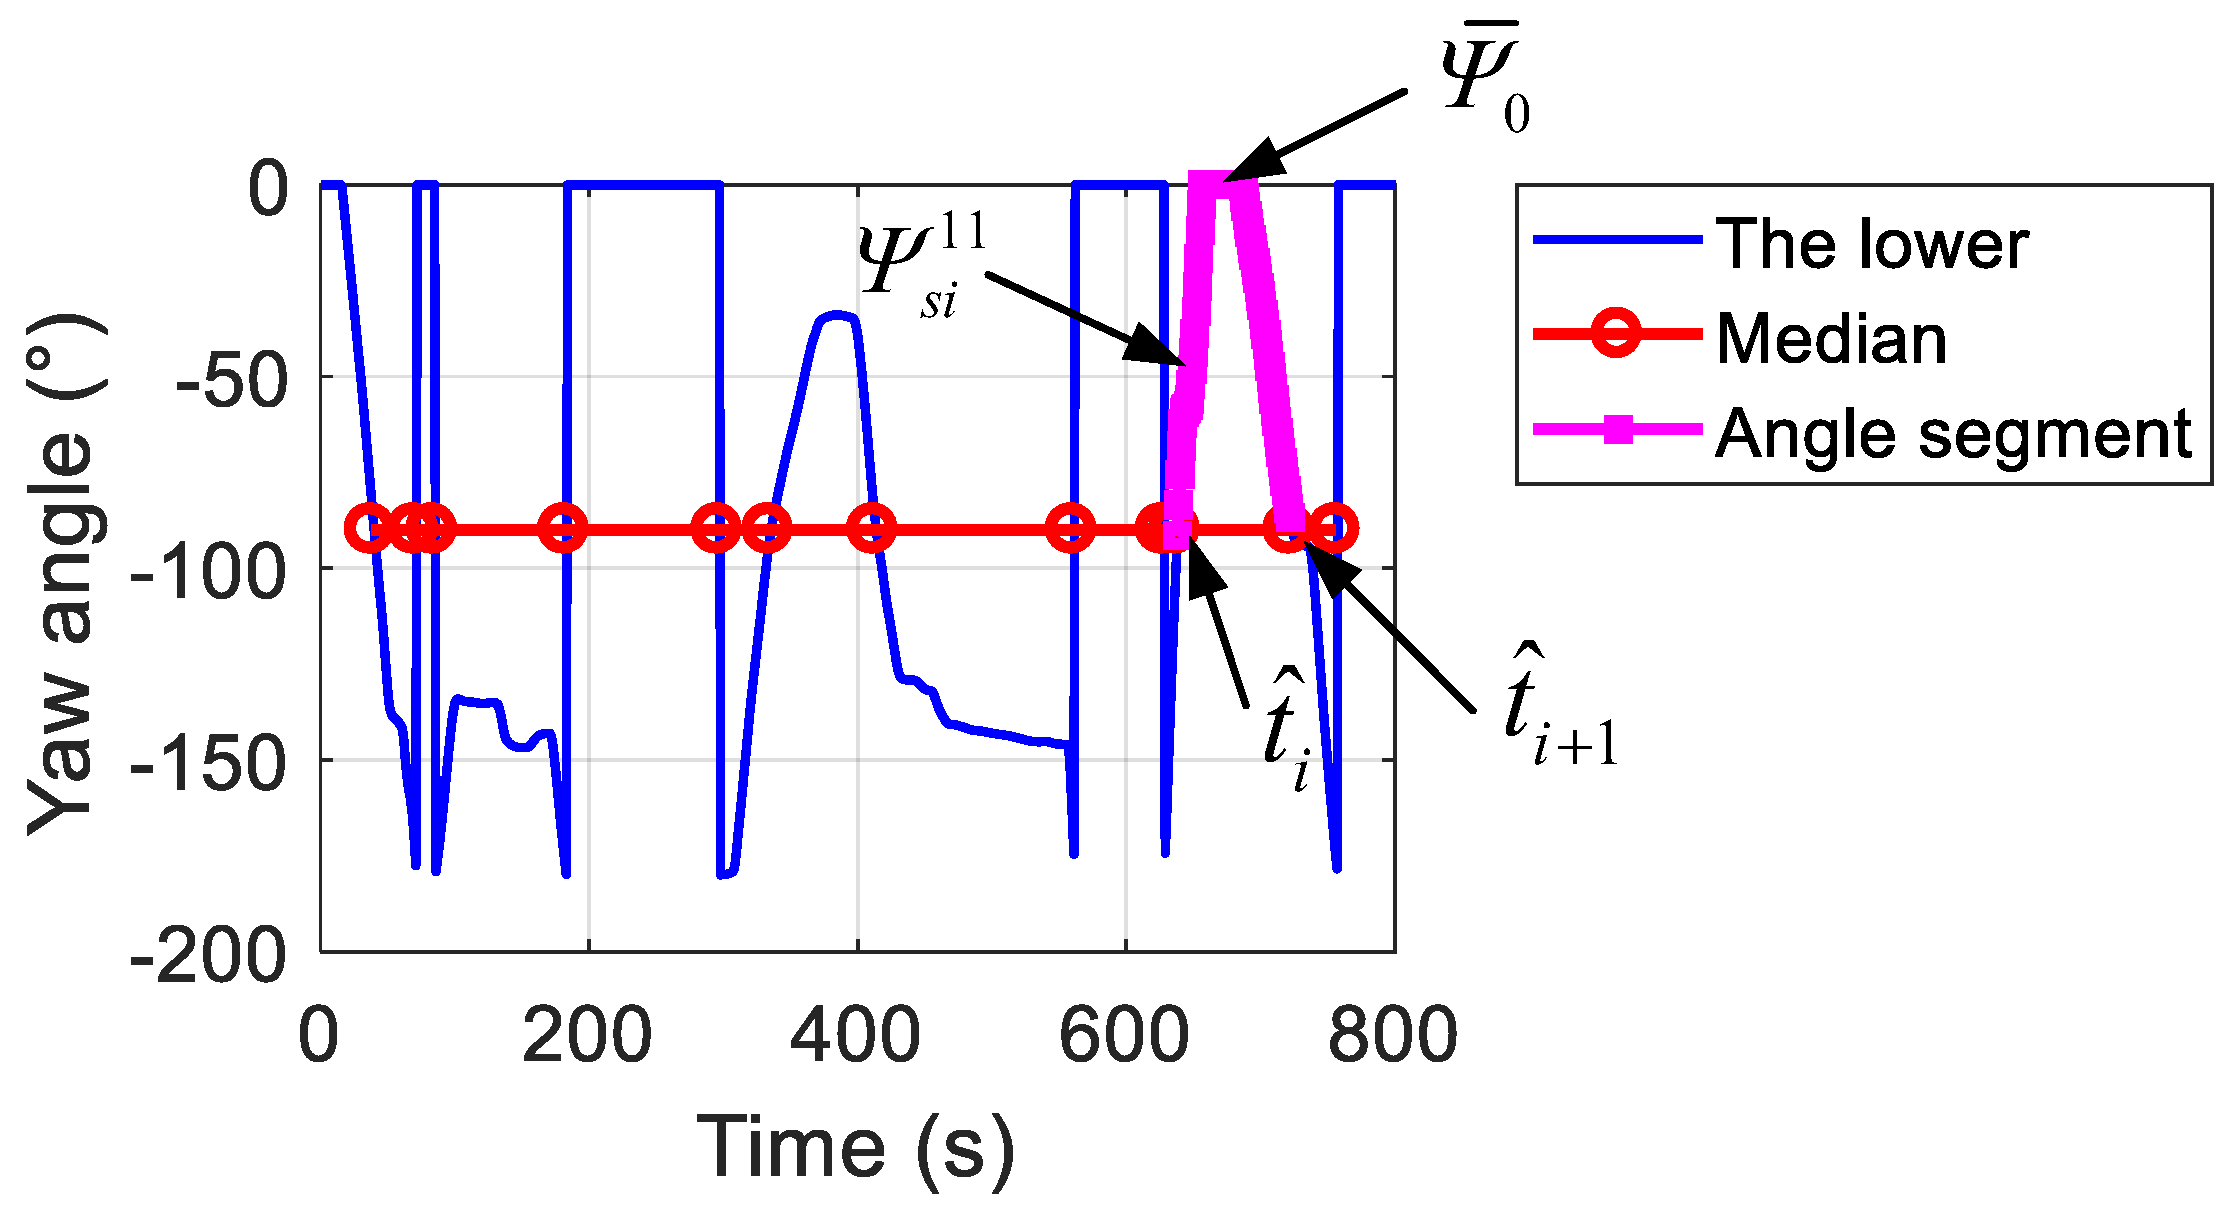
Figure 11 uses the median-crossing de-redundancy algorithm in Section 3.2 to eliminate the redundant marks with a yaw angle deviation less than the threshold c = 22.5° so as to verify the correctness of the algorithm. The signal selected to illustrate the algorithm was the lower part of the original layer , that is . In the figure, the set of the median is shown as circle symbols, and the set of the redundancy algorithm as diamond symbols; then, the de-redundant set can be worked out using .
Figure 12 gives the statistical results of the number of S turns in the two sublayers and of the first layer. Using the de-redundancy algorithms in Section 3.2 and Section 5.2, the sets and of S turn marks were obtained as shown. The number of S turn marks obtained in both the upper and lower halves were , resulting in a total of S-turning maneuvers in this layer. Comparing Figure 12a to Figure 10, we can observe that the statistical algorithm in Section 5.2 is correct.
Figure 13 shows the four sublayers – and the statistical results of the second layer, where Figure 13a,b comes from and the other two from . Although there are still many medians in each sublayer signal compared to the previous layer, there were fewer effective marks for S turns. Using the de-redundancy algorithms in Section 3.2 and Section 5.2, the number of S turns with and are shown in Figure 13a,c, respectively, and there were no S turning marks in Figure 13b,d, indicating that or there were no S turning actions in these two sublayers. Therefore, the number of S turns obtained from Figure 13 was
Summing up the number of S turns in all layers, the total of S turns in this flight profile was
Upon observing the yaw angle history in each sublayer, the number of hovers and S turns were also worked out artificially. The same results for the number of hovers and S turns by both the PSD and artificial methods verified the effectiveness and programmability of the PSD algorithm presented in this article.
8. Conclusions
In order to classify flight missions and compile load spectra for rotors or bearings, which are related to many coupled flight parameters and big flight data profiles, this study developed statistical algorithms to count hovers and S turns so as to introduce a process parameter for flight maneuvering into the current mainstream methods that only consider some maximum state parameters.
Based on the median-crossing de-redundancy and signal-splitting functions of PSD, this article presented algorithms for counting the number of 360° hovers and S turns in a flight profile. Using median-crossing de-redundancy of yaw angle data, the number of hovers in a flight profile is obtained. With the help of the PSD layer-by-layer splitting function, the yaw angle signal is decomposed into triangular forms and sublayers, with the median of each layer acting as the boundary; thus, the number of S turns is calculated. Applying the developed algorithm to an example flight yaw angle profile, the same results for the number of hovers and S turns by both the PSD and artificial methods verified the effectiveness of the statistical algorithms.
Although the number of hovers and S turns can be used as a supplement for maximum Mach number or altitude when decomposing flight missions in big flight data, some more precise details will be ignored by this operation, such as turning radius, action change, etc. In fact, using the algorithms presented in this article, one can also obtain the time length and time of occurrence of hovers and S turns and research more detailed actions of aircraft within big flight data profiles. Additionally, these algorithms can be applied to compiling other load spectra related to flight missions.
Author Contributions
Methodology, M.C.; investigation, M.C. and Z.J.; resources, X.W. and H.W.; writing—original draft preparation, M.C.; writing—review and editing, M.C.; funding acquisition, M.C. All authors have read and agreed to the published version of the manuscript.
Funding
The research is funded by the National Science and Technology Major Project, grant number J2019-IV-004-0071.
Data Availability Statement
The data that support the findings of this study are available on request to the corresponding author.
Conflicts of Interest
The authors declare that there are no conflict of interest regarding the publication of this paper.
References
- Zheng, N.; Chen, M.; Luo, G.; Ye, Z. Dynamic behavior analysis of intermediate bearing-squeeze film dampers-rotor system under constant maneuvering overload. Shock Vib. 2021, 2021, 5512409. [Google Scholar] [CrossRef]
- Zheng, N.; Chen, M.; Luo, G.; Ye, Z. Coupled Lateral and torsional vibration of rub-impact rotor during hovering flight. Shock Vib. 2021, 2021, 4077556. [Google Scholar] [CrossRef]
- Breitkopf, G.E. Basic Approach in the Development of TURBISTAN, a Loading Standard for Fighter Aircraft Engine Disks: 19428-2959; ASTM International: West Conshohocken, PA, USA, 1989. [Google Scholar]
- Jin, Y.; Sun, Z.; Song, Y.; Lin, X.; Niu, X.; Ding, J. Mission segment division of the whole aeroengine loading spectrum based on flight actions. Chin. J. Aeronaut. 2021, 35, 164–174. [Google Scholar] [CrossRef]
- Du, Y. Research on Aeroengine Load Spectrum Clustering Analysis Method and Simulation; Nanjing University of Aeronautics and Astronautics: Nanjing, China, 2018. (In Chinese) [Google Scholar]
- Niu, X.; Lu, Q.; Sun, Z.; Song, Y. A novel compilation method of comprehensive mission spectrum of aero-engine maneuvering load based on use-related mission segment. Chin. J. Aeronaut. 2023, 36, 161–170. [Google Scholar] [CrossRef]
- AirmanTesting Standards Branch. FAA-H-8083-25: Pilot’s Handbook of Aeronautics Knowledge; U.S. Department of Transportation, Federal Aviation Administration: Oklahoma City, OK, USA, 2003. Available online: https://www.faa.gov/pilots (accessed on 15 April 2023).
- JSSG-2006; Joint Service Specification Guide, Aircraft Structures. Department of Defense: Washington, DC, USA, 1998.
- Zhang, J.; Jiang, Z.; Feng, J. Research on Generating Method for Severe Load Spectrum based on Individual Airplane Statistical Analysis. Eng. Test 2018, 58, 25–30. (In Chinese) [Google Scholar] [CrossRef]
- Zhang, J.; Jiang, Z.; Feng, J. Generating methods of severe load spectra for airplanes based on statistic analysis flight subjects. Adv. Aeronaut. Sci. Eng. 2019, 10, 363–370. (In Chinese) [Google Scholar] [CrossRef]
- Marsh, G.; Wignall, C.; Thies, P.R.; Barltrop, N.; Incecik, A.; Venugopal, V.; Johanning, L. Review and application of Rainflow residue processing techniques for accurate fatigue damage estimation. Int. J. Fatigue 2015, 82, 757–765. [Google Scholar] [CrossRef]
- Khyam, O.; Ge, S.S.; Li, X.; Pickering, M.R. Highly Accurate Time-of-Flight Measurement Technique Based on Phase-Correlation for Ultrasonic Ranging. IEEE Sens. J. 2016, 17, 434–443. [Google Scholar] [CrossRef]
- Dai, S.; Nie, Z.; Dai, H.; Chen, Q. Empirical mode decomposition based preprocessing of navigation data from flight data recording system. In Proceedings of the 2018 IEEE CSAA Guidance, Navigation and Control Conference (GNCC), Xiamen, China, 10–12 August 2018. [Google Scholar] [CrossRef]
- Sun, Z.; Xing, G.; Lu, Q.; Song, Y. Simulation of use-related multi-parameter load spectrum based on principal component analysis. Int. J. Turbo Jet Engines 2018, 39, 149–165. [Google Scholar] [CrossRef]
- Allen, M.J.; Dibley, R.P. Modeling Aircraft Wing Loads from Flight Data Using Neural Networks; NASA/TM-2003-212032; NASA Dryden Flight Research Center: Palmdale, CA, USA, 2003.
- Wenchi, L.; Elmoudani, W.; Revoredo, T.C.; Mora-Camino, F. Neural networks modelling for aircraft flight guidance dynamics. J. Aerosp. Technol. Manag. 2012, 4, 169–174. [Google Scholar] [CrossRef]
- Zhen, J.; Yang, L.; Shengdong, W.; Liu, Z. A multi-channel data-based fault diagnosis method integrating deep learning strategy for aircraft sensor system. Meas. Sci. Technol. 2022, 34, 025115. [Google Scholar] [CrossRef]
- Floris, H.; Treve, V.; Richard, C.; Visser, H.G. Evaluation of feasible machine learning techniques for predicting the time to fly and aircraft speed profile on final approach: Predictive dynamic support tool on final approach. In Proceedings of the 7th International Conference on Research in Air Transportation, Philadelphia, PA, USA, 20–24 June 2016. [Google Scholar]


Disclaimer/Publisher’s Note: The statements, opinions and data contained in all publications are solely those of the individual author(s) and contributor(s) and not of MDPI and/or the editor(s). MDPI and/or the editor(s) disclaim responsibility for any injury to people or property resulting from any ideas, methods, instructions or products referred to in the content. |
© 2023 by the authors. Licensee MDPI, Basel, Switzerland. This article is an open access article distributed under the terms and conditions of the Creative Commons Attribution (CC BY) license (https://creativecommons.org/licenses/by/4.0/).