Article

Multi-Objective Optimization of Micro-Milling Parameters—The Trade-Offs between Machining Quality, Efficiency, and Sustainability in the Fabrication of Thin-Walled Microstructures

1
School of Mechanical and Electrical Engineering, Harbin Institute of Technology, Harbin 150001, China
2
Department of Mechanical and Aerospace Engineering, Brunel University London, Uxbridge UB8 3PH, UK
*
Author to whom correspondence should be addressed.
Appl. Sci. 2023, 13(16), 9392; https://doi.org/10.3390/app13169392
Submission received: 28 July 2023 / Revised: 13 August 2023 / Accepted: 16 August 2023 / Published: 18 August 2023
(This article belongs to the Special Issue Advanced Manufacturing Processes)

Abstract

:
Micro-milling has found extensive applications in machining components with thin-walled microstructures, such as terahertz slow-wave structures, microfluidic chips, and micro-molds. Due to the influence of size effects, micro-milling exhibits higher specific energy consumption compared with traditional milling, implying that more energy is consumed to remove a unit volume of material, particularly in challenging-to-machine materials like Ti-6Al-4V. Historically, research on parameter optimization for micro-milling has predominantly focused on enhancing machining quality and efficiency, with limited attention given to energy efficiency. However, in the context of the “double carbon” strategy, energy conservation and emissions reduction have garnered significant attention in the manufacturing industry. Therefore, this paper proposes a micro-milling parameter-based power consumption model. Based on this, a specific energy consumption model can be obtained. Moreover, evolutionary algorithms are utilized for the optimization of micro-milling parameters, which aims to achieve comprehensive enhancements in both machinability and sustainability. The optimization objectives encompass improving surface quality, dimensional accuracy, material removal rate, and specific energy consumption during the micro-milling process for thin-walled micro-structures. Among them, NSGA-III achieves the best optimization results. Under conditions in which cutting energy consumption and processing efficiency are very close, the optimization outcomes based on NSGA-III lead to the best machining quality, including the minimum surface roughness and dimensional errors, and the largest surface fractal dimension. The optimal combination of micro-milling parameters is n = 28,800 rpm, fz = 2.6 μm/t, and ap = 62 μm.

1. Introduction

The optimization of process parameters is regarded as a crucial means to improve machining performance, the results of which are dependent on the optimization objectives and methods. In prior research, optimization objectives have mainly focused on technical requirements and production efficiency, while energy consumption and environmental degradation have often been neglected [1]. Sustainable manufacturing technology presents new challenges for researchers in the context of carbon peaking and carbon neutrality.
As some of the main energy-consuming pieces of equipment in the manufacturing industry, the primary form of energy consumption for machine tools is electricity. There are approximately 8 million units of machine tools in China, indicating significant potential for energy saving. Therefore, balancing machining quality and efficiency while reducing the energy consumption of machine tools has gradually become a prominent research focus in the manufacturing industry [2]. Hu et al. employed the simulated annealing algorithm to optimize the spindle speed and feed rate in the single-point turning process, focusing on machining energy consumption while considering cutting force, cutting power, and surface roughness as constraints. The optimized process parameters resulted in a 19.28% reduction in energy consumption [3]. Feng et al. conducted simultaneous optimization of toolpaths and process parameters during the drilling process using NSGA-II, with energy consumption, machining time, and surface roughness as the optimization objectives. The experimental results demonstrated that this approach reduced the energy consumption and machining time by 57.7% and 66.4%, respectively, while significantly improving the surface quality [4]. In order to achieve a balance between milling sustainability, production efficiency, and machining quality, Yan et al. employed the response surface methodology in combination with the grey relational analysis method to optimize the spindle speed, feed rate, cutting depth, and cutting width in the milling process. The optimized process parameters were found to enhance both the material removal rate and surface quality while reducing energy consumption by 18.1% [5]. Zhang et al. conducted an optimization study on micro-milling process parameters, including spindle speed, feed per tooth, and cutting depth, with the objective of minimizing power consumption, extending tool life, improving surface roughness, and enhancing tool holder strength. The cuckoo search algorithm and grey wolf optimization algorithm were used to enhance global search capabilities. As a result, a 7.89% reduction in energy consumption was achieved [6]. Wang et al. conducted optimizations of the energy consumption and machining time in milling processes. The results indicated that the optimization outcomes based on the improved ant colony algorithm surpassed those obtained with NSGA-II, yielding higher productivity at the same energy consumption level [7]. Rational parameter selection can lead to comprehensive improvements in machinability and sustainability at lower costs. The current research has mostly focused on conventional machine tools, with limited studies on micro-milling.
The established energy consumption model is the basis for analyzing energy characteristics, improving energy efficiency, and minimizing energy consumption in machining. Currently, CNC machine tool energy consumption models can be generally categorized into three types: material-removal-rate-based models, specific process-parameter-based models, and cutting-force-based models [8]. The power consumption model based on material removal rates is simple in form and has clear physical significance. However, research has shown that different combinations of process parameters can yield different energy consumption values at the same material removal rate [9,10,11,12]. The variation in process parameters is a significant factor influencing the energy consumption of machine tools [13]. In addition to regression methods, artificial intelligence is also employed to establish the relationship between process parameters and machine tool power consumption [14]. However, these models lack physical interpretability, and the energy consumption model based on artificial intelligence algorithms relies on extensive testing data [15,16]. Due to factors such as tool wear, tool deflection, and workpiece material properties, accurately modeling cutting forces presents challenges [17]. Consequently, establishing a cutting power model based solely on cutting forces may deviate from actual results [18,19].
Micro-milling is a key technology for manufacturing precision components and finds widespread applications in various fields. Due to the influence of size effects, micro-milling has a higher specific energy consumption, which is particularly pronounced when processing difficult-to-machine materials such as Ti-6Al-4V [20]. Although many researchers have analyzed the power consumption characteristics of cutting processes and established corresponding power consumption models using various methods, most of these models are focused on general-machining machine tools and still have certain limitations, particularly a lack of in-depth explanations of the power consumption mechanisms and unclear physical meanings [21,22,23,24]. Therefore, it is crucial to determine a more generalized process-parameter-based power consumption modeling approach for micro-milling processes.
To reduce the energy consumption in micro-milling processes, this paper carried out power consumption modeling using power flow analysis. Based on the established model, the optimization of process parameters was undertaken with the objective of reducing the specific energy consumption, considering constraints on machining quality and efficiency, thereby achieving comprehensive improvements in machinability and sustainability.

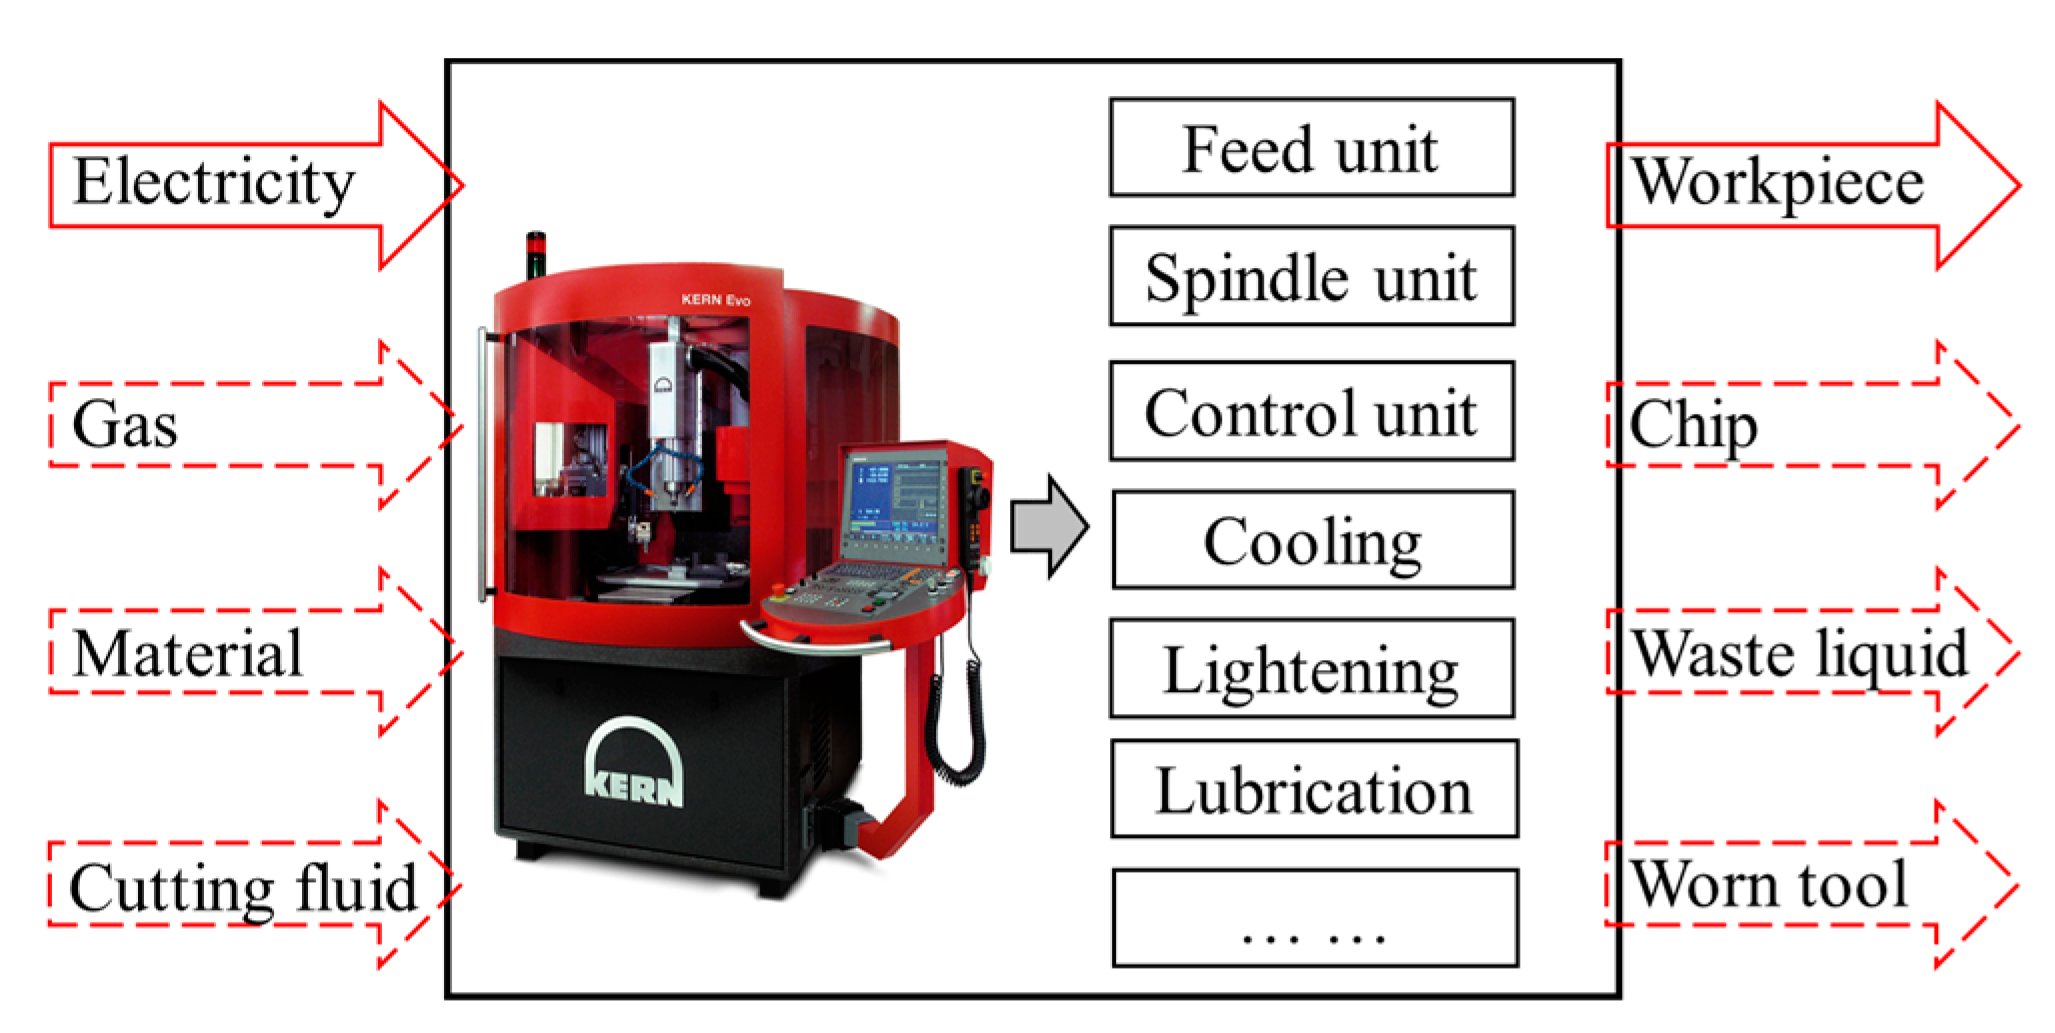
2. Materials and Methods

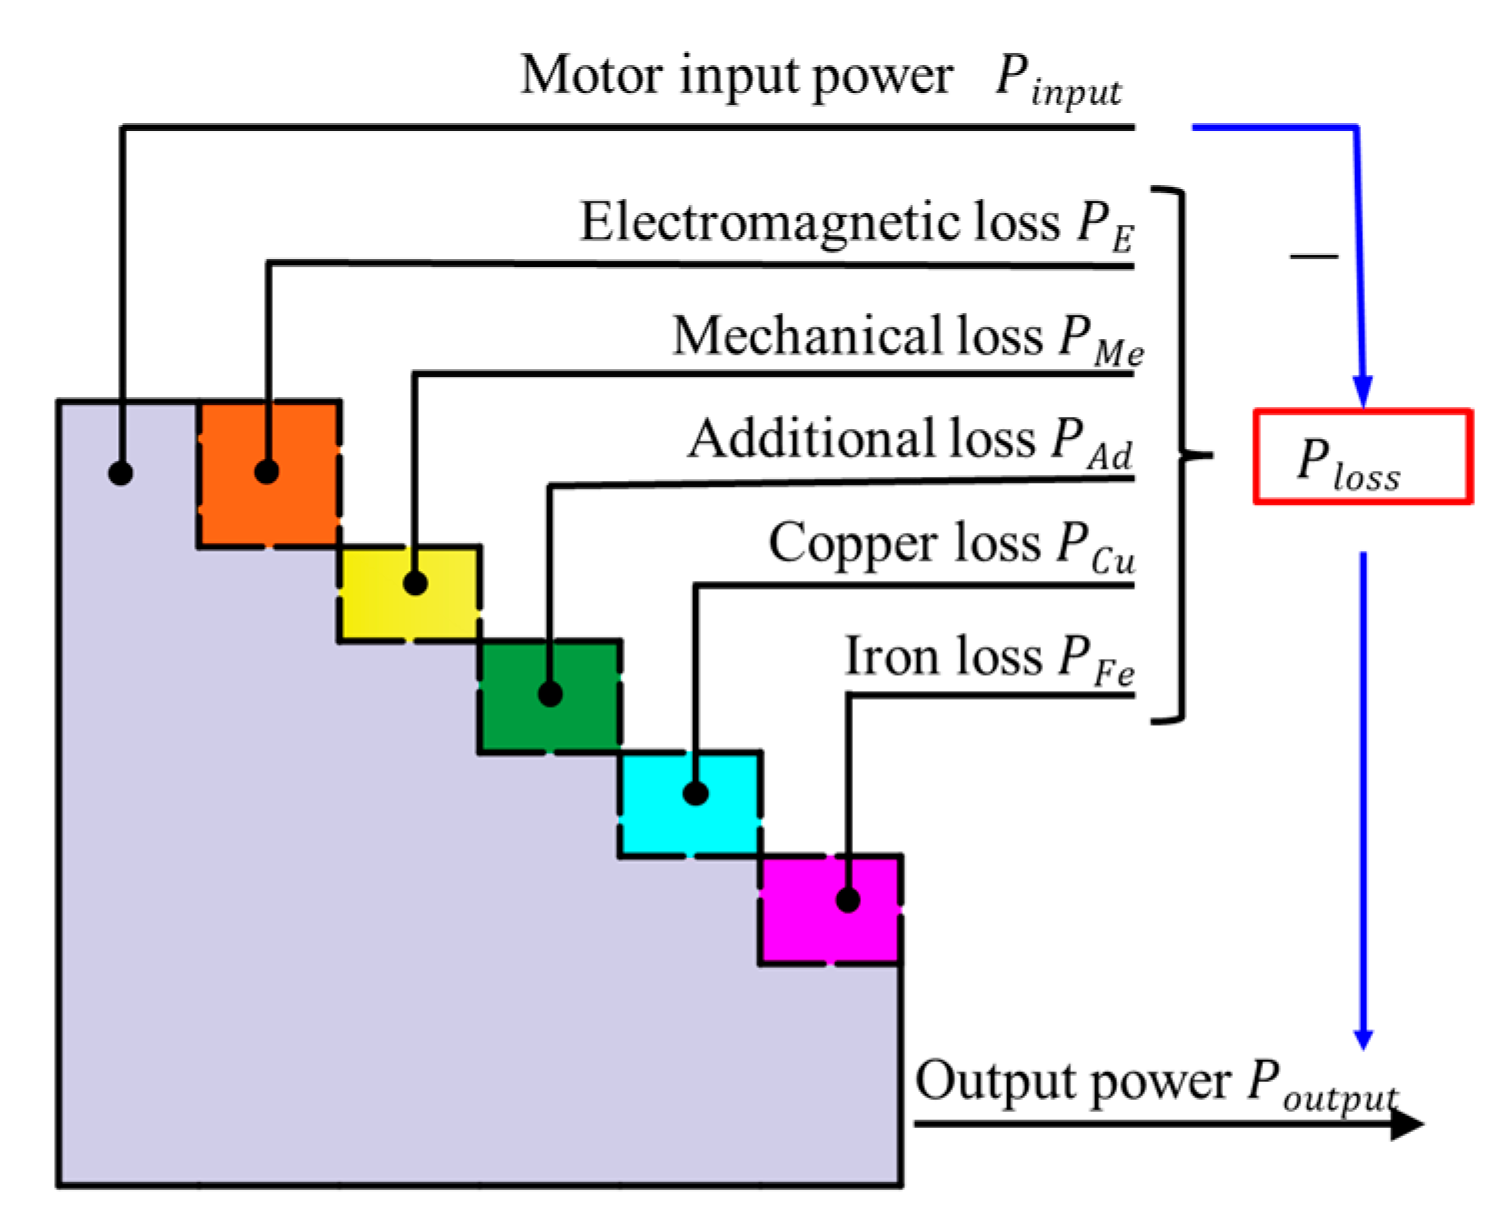
2.1. Power Consumption Modeling

During the machining process, all the various forms of energy generated by machine tools are derived from electrical energy, including mechanical energy, sound energy, and thermal energy. Therefore, in this paper, when measuring the power consumption of various energy-consuming subsystems of machine tools, only the electrical energy consumption was measured.
In this paper, the machine tool power consumption is split into several components, and their sum is the total power consumption of the machining process, which can be illustrated with Equation (1).
P total = i = 1 I P fix i + j = 1 J P var j ( n , f z , a p )
where Ptotal represents the total power consumption of the machine tool; Pfix−i represents the power consumption of the i-th fixed energy consumption subsystem; Pvar−j represents the power consumption of the j-th variable energy consumption subsystem; I represents the number of fixed energy consumption subsystems; J represents the number of variable energy consumption subsystems; n represents the spindle speed; fz represents the feed per tooth; and ap represents the cutting depth.
The power consumed by each fixed energy consumption subsystem can be considered as a constant value that does not vary with machining states. The power consumed by each variable energy consumption subsystem is influenced by process parameters, cutting tools, and workpiece materials. Therefore, this paper focused on analyzing and establishing power consumption models for variable energy consumption subsystems. The Kern EVO micro-milling machining center was the research object, as shown in Figure 1.
On this basis, the total power consumed by the machine tool can be further decomposed as Equation (2).
P total = P i + P m = P b + P a + P s + P f + P m
where Pb represents the basic power of the control systems, lighting, and air pumps; Pi represents idle power consumption; Pa represents the auxiliary power of the cooling, lubrication, chip collection, and tool-changing systems; Ps represents the non-machining spindle power; Pf represents the non-machining feed power; and Pm represents the material removal power.
The machine tool power varies with different machining process stages, as shown in Figure 2. It can be observed that the tool change process has a short duration and low power consumption, which can be neglected if the tool change frequency is not high. Upon activating the cutting lubrication system, there is a significant increase in the machine tool power. Furthermore, it can be seen that different process stages exhibit distinct variations in cutting power, indicating that changes in process parameters lead to different power consumptions.

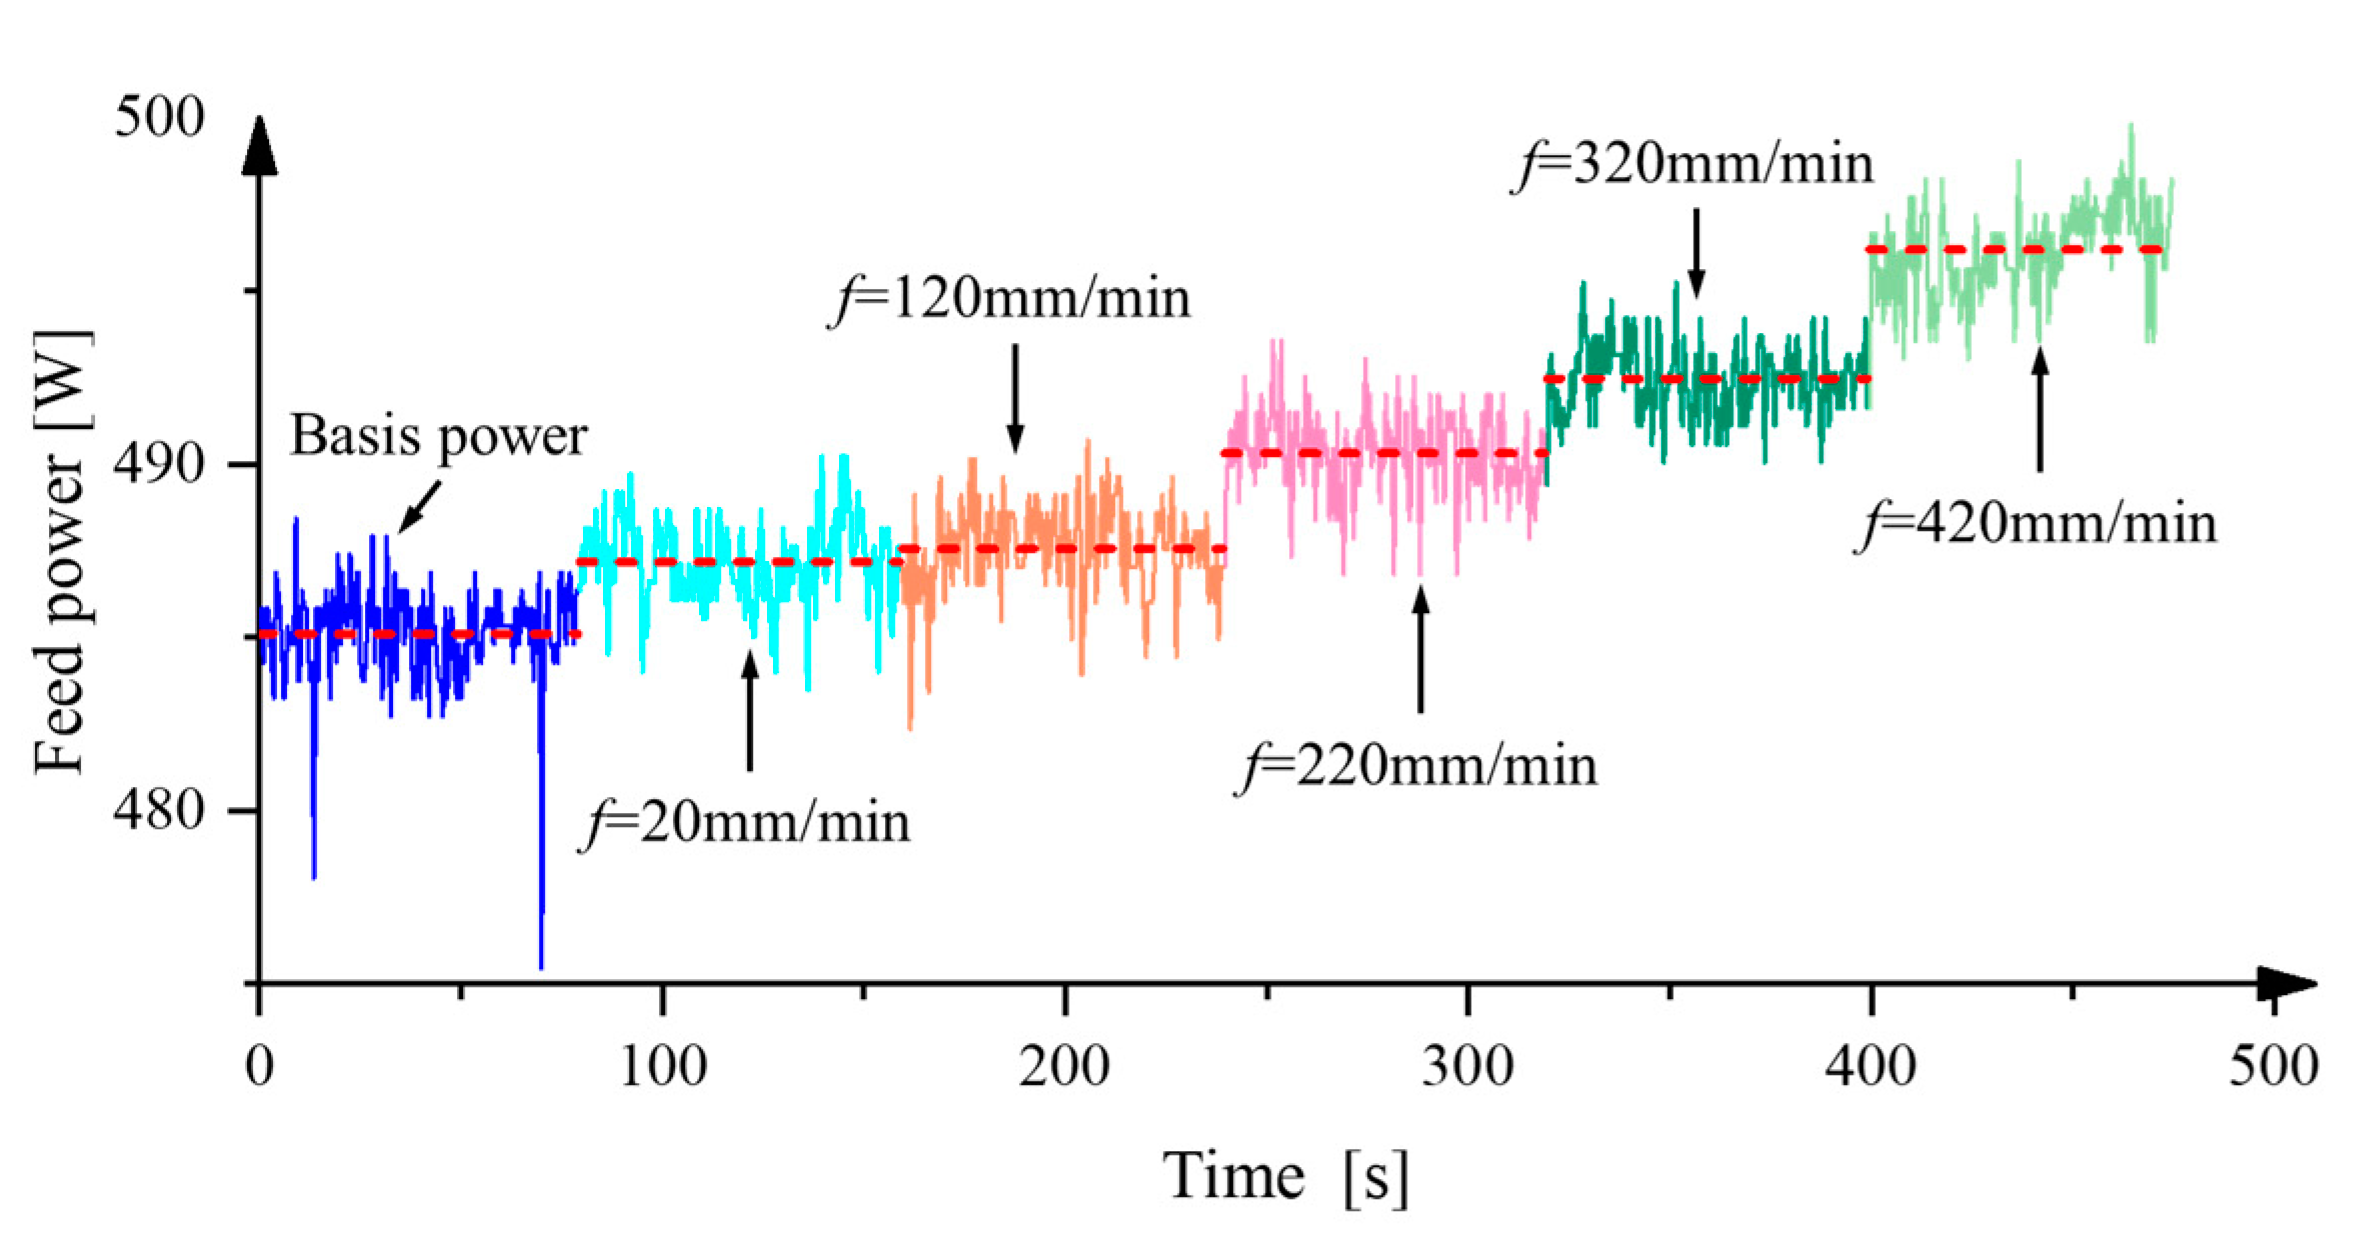
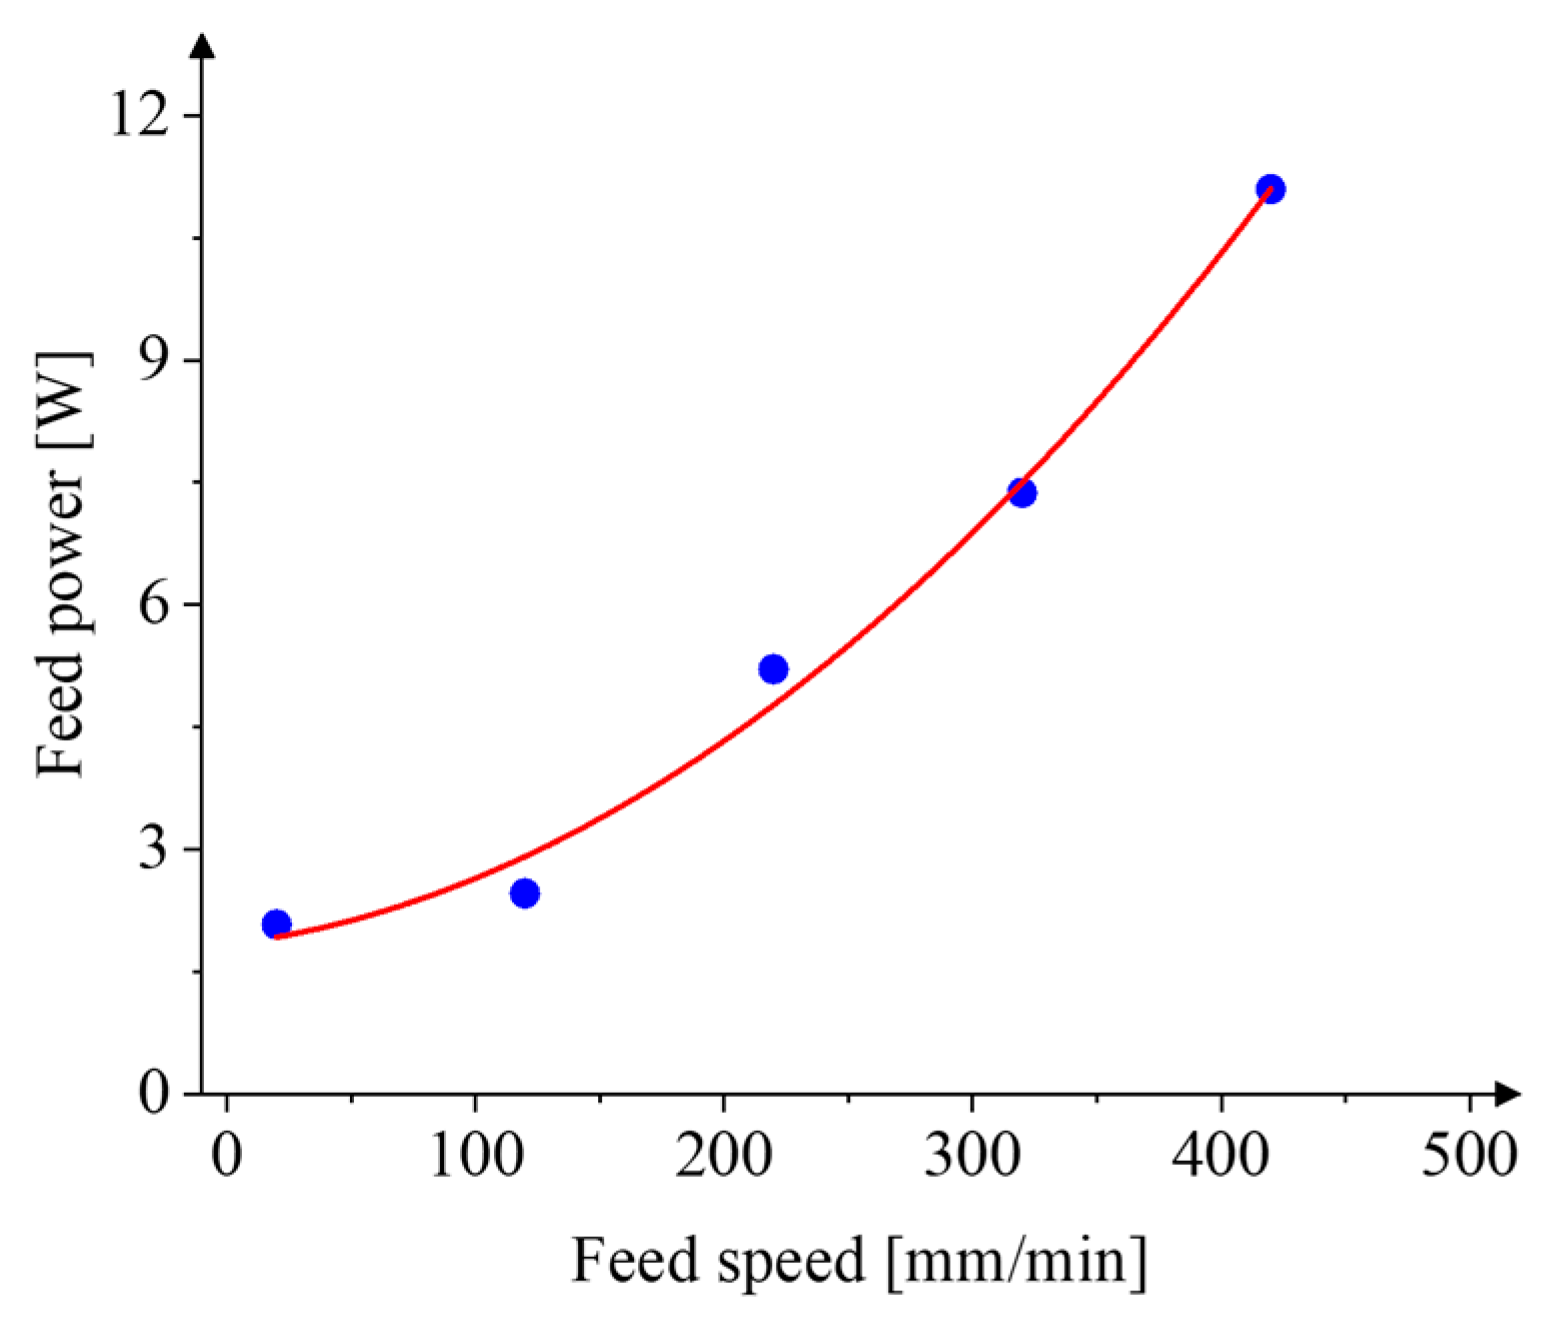
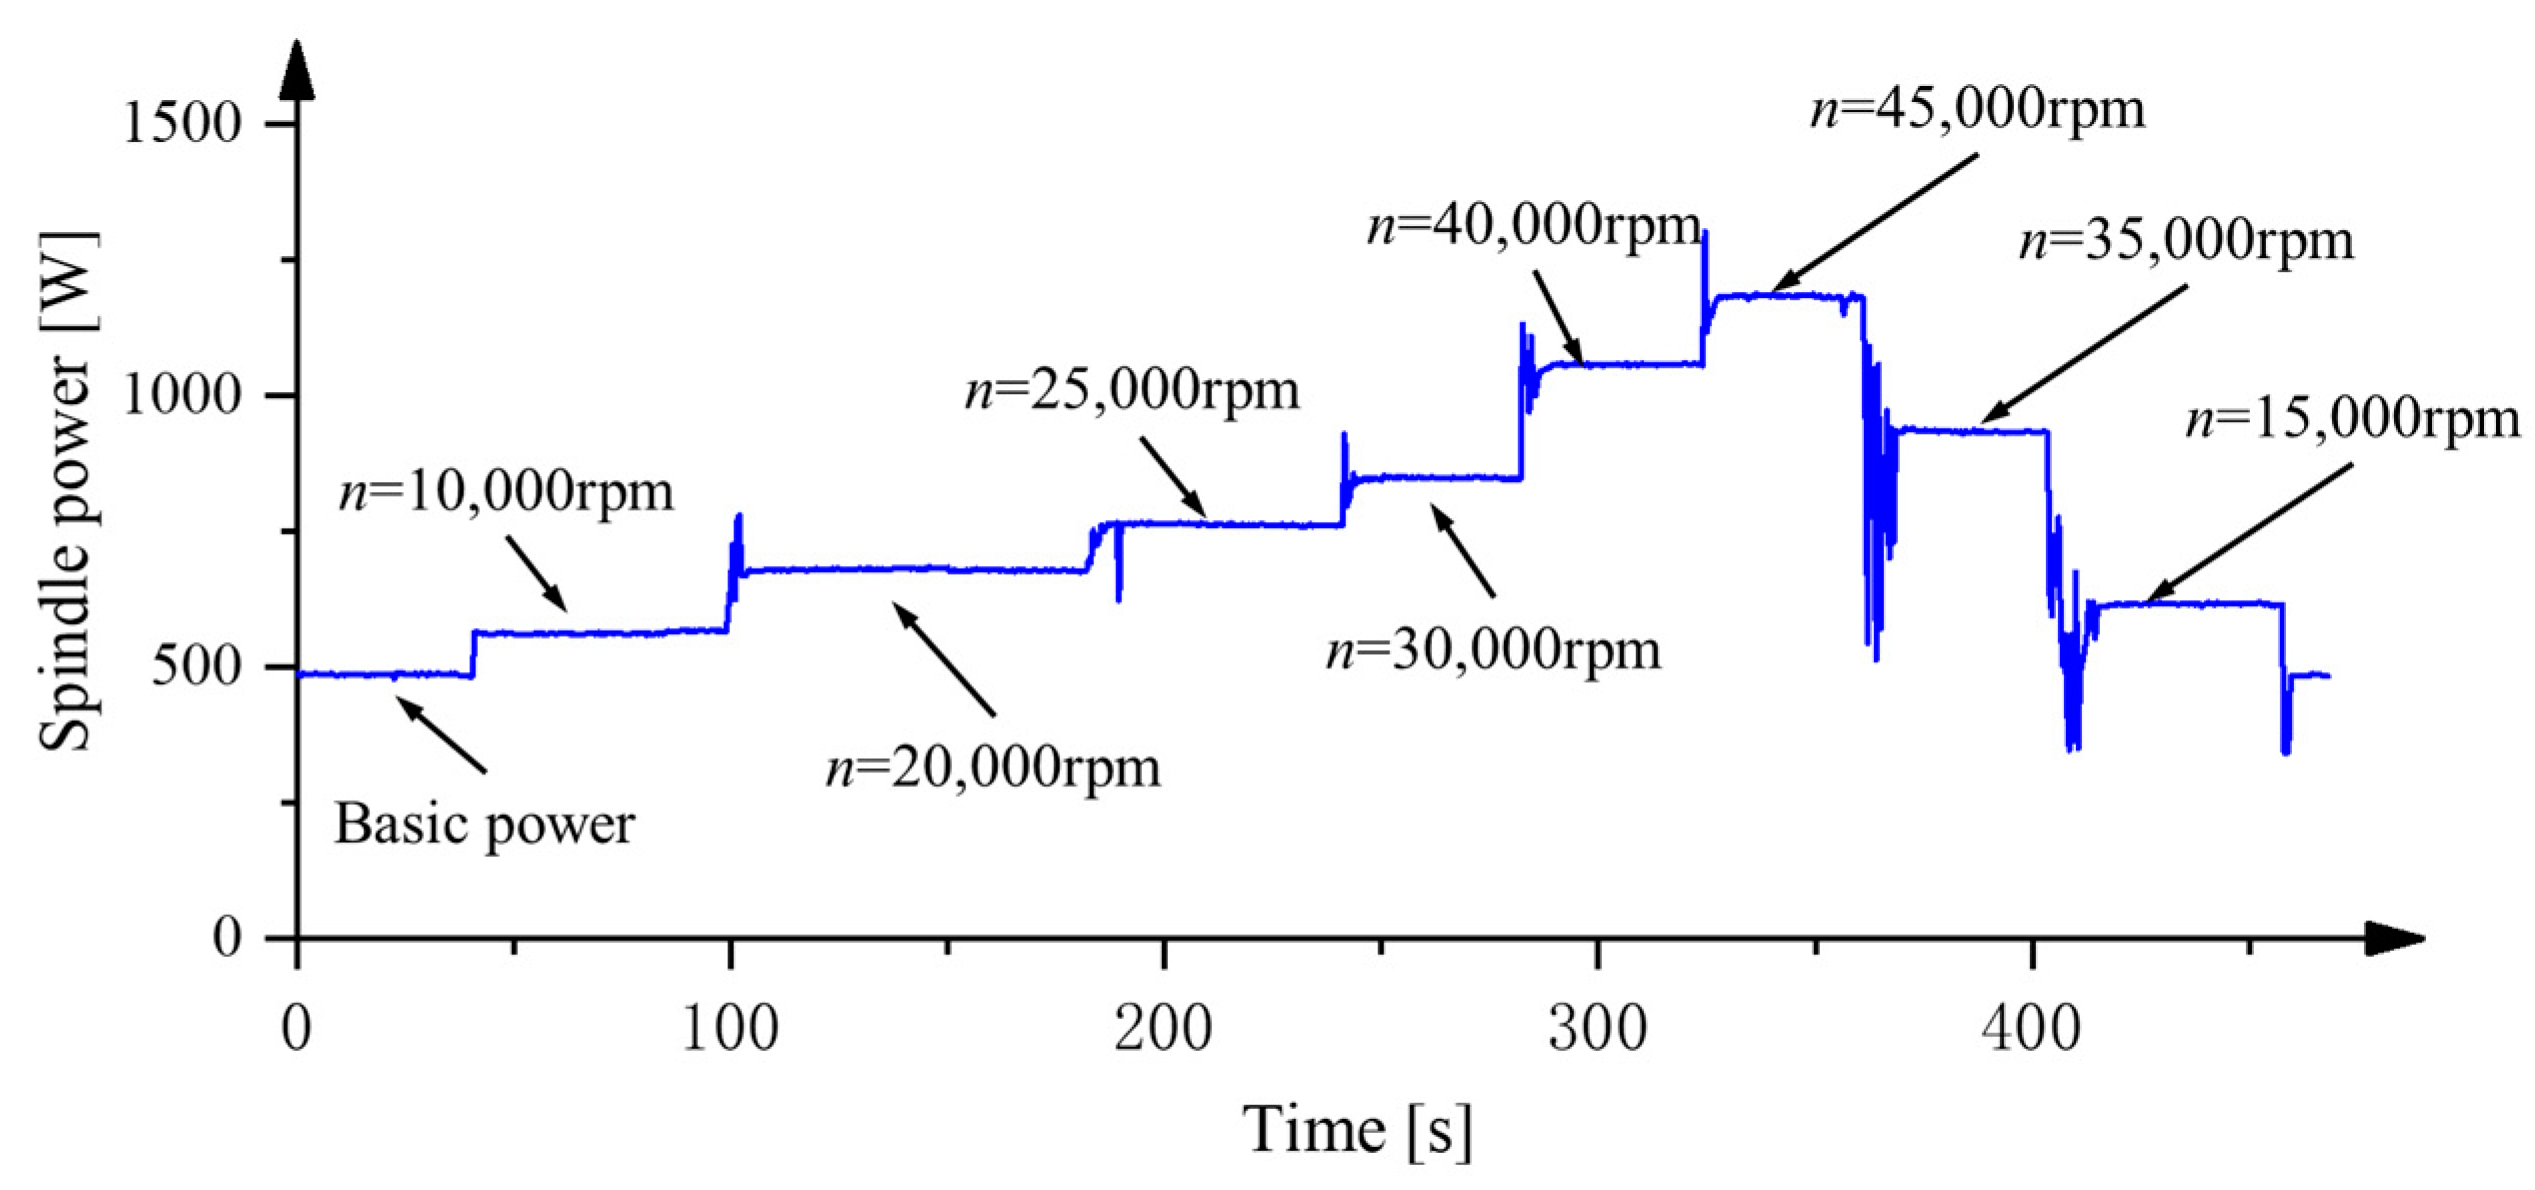
2.1.1. Power Consumption Modeling in Feed and Spindle Subsystems

A schematic diagram of the feed unit motion structure for micro-milling machining equipment is illustrated in Figure 3. The power source for the feed system is synchronous permanent magnet motors, which transmit driving force (torque) to the worktable through couplings, bearings, and ball screws. For the horizontal feed drive unit, the load refers to the friction of the ball screw pair, and for the vertical feed drive unit, the effect of gravity should also be considered. It should be noted that the cutting force load is not included. Similarly, the load of the spindle system does not consider the influence of the cutting force torque.Synchronous permanent magnet motors convert input electrical energy into mechanical energy, and the motor’s output power can be obtained via force analysis. The relationship between the motor’s output torque and the forces on the ball screw, bearings, and couplings can be described using Equations (3)–(5).
T m = J m d ω m d t + C m ω m + T c
T c = J c d ω c d t + C c ω c + T bs + 2 T b
T bs = J bs d ω bs d t + C bs ω bs + T t
where T, J, C, and ω represent the output torque, moment of inertia, viscous damping, and angular velocity, and subscripts m, c, bs, b, and t represent the motor, coupling, ball screw, bearing, and worktable.Under the assumption of a negligible angular velocity difference, the relationship between the motor output torque and the workbench output torque can be expressed as Equation (6).
T m = J d ω d t + C ω + T
where T, J, and C represent the output torque, moment of inertia, viscous damping, and angular velocity of the feed system, which can be expressed as Equation (7).
{ J = J m + J c + J bs C = C m + C c + C bs T = T t + 2 T b
After obtaining the motor’s output torque, the power output of the driving motor can be represented as Equation (8).
P output = T m ω = J d ω d t ω + C ω 2 + T ω
Apart from the motor output power, permanent magnet synchronous motors also have internal energy losses, which can generally be classified into the following categories: copper loss, iron loss, mechanical loss, additional loss, and electromagnetic loss, as shown in Figure 4.Prior research has indicated that the power loss of a motor can be represented as a quadratic function of the motor’s rotational speed, as shown in Equation (9) [25].
P loss = k ω 2 + b ω + P c
where k and b are coefficients determined by the motor itself, and Pc represents the fixed power loss.Therefore, the expression for the power consumption of the feed system can be obtained by combining Equations (8) and (9).
P feed = P output + P loss = F 0 α ω + F 1 ω 2 + F 2 ω + F 3
where α represents the angular acceleration, and the coefficients can be expressed as Equation (11).
{ F 0 = J F 1 = C + k F 2 = T + b F 3 = P c
In the stable machining process, the feed speed is constant (i.e., the angular acceleration is 0); thus, the power consumption can be expressed as:
P feed s = F 1 ω 2 + F 2 ω + F 3
Through a similar force analysis process as that for the feed unit, the power consumption of the electric spindle can be expressed as follows:
P spindle s = S 1 n 2 + S 2 n + S 3
where S1 represents the viscous damping of the electric main spindle; S2 represents the output torque of the electric main spindle; and S3 represents the power loss of the electric main spindle.

2.1.2. Material Removal Power Modeling

Material removal power refers to the power consumed in the interaction between cutting tools and workpiece materials to achieve specific shapes and meet certain technical requirements. There are several factors that influence material removal power, making accurate modeling challenging. The power consumption in the cutting process is directly influenced by process parameters. Therefore, establishing the material removal power based on specific process parameters offers the advantages of simplicity, directness, and accuracy, facilitating the further optimization of process parameters. In this paper, both exponential and polynomial models are used to fit and analyze cutting power, as shown in Equations (14) and (15), respectively, and a comparison of their merits is presented.
P m = a n c 1 f z c 2 a p c 3
P m = p 0 + p 1 n + p 2 a p + p 3 f z + p 4 n a p + p 5 n f z + p 6 a p f z
where n, fz, and ap represent the spindle speed, feed per tooth, and depth of cut, respectively, and a, c1, c2, c3, p0, p1, p2, p3, p4, p5, and p6 are coefficients that are closely related to the cutting tools, materials, and process conditions.

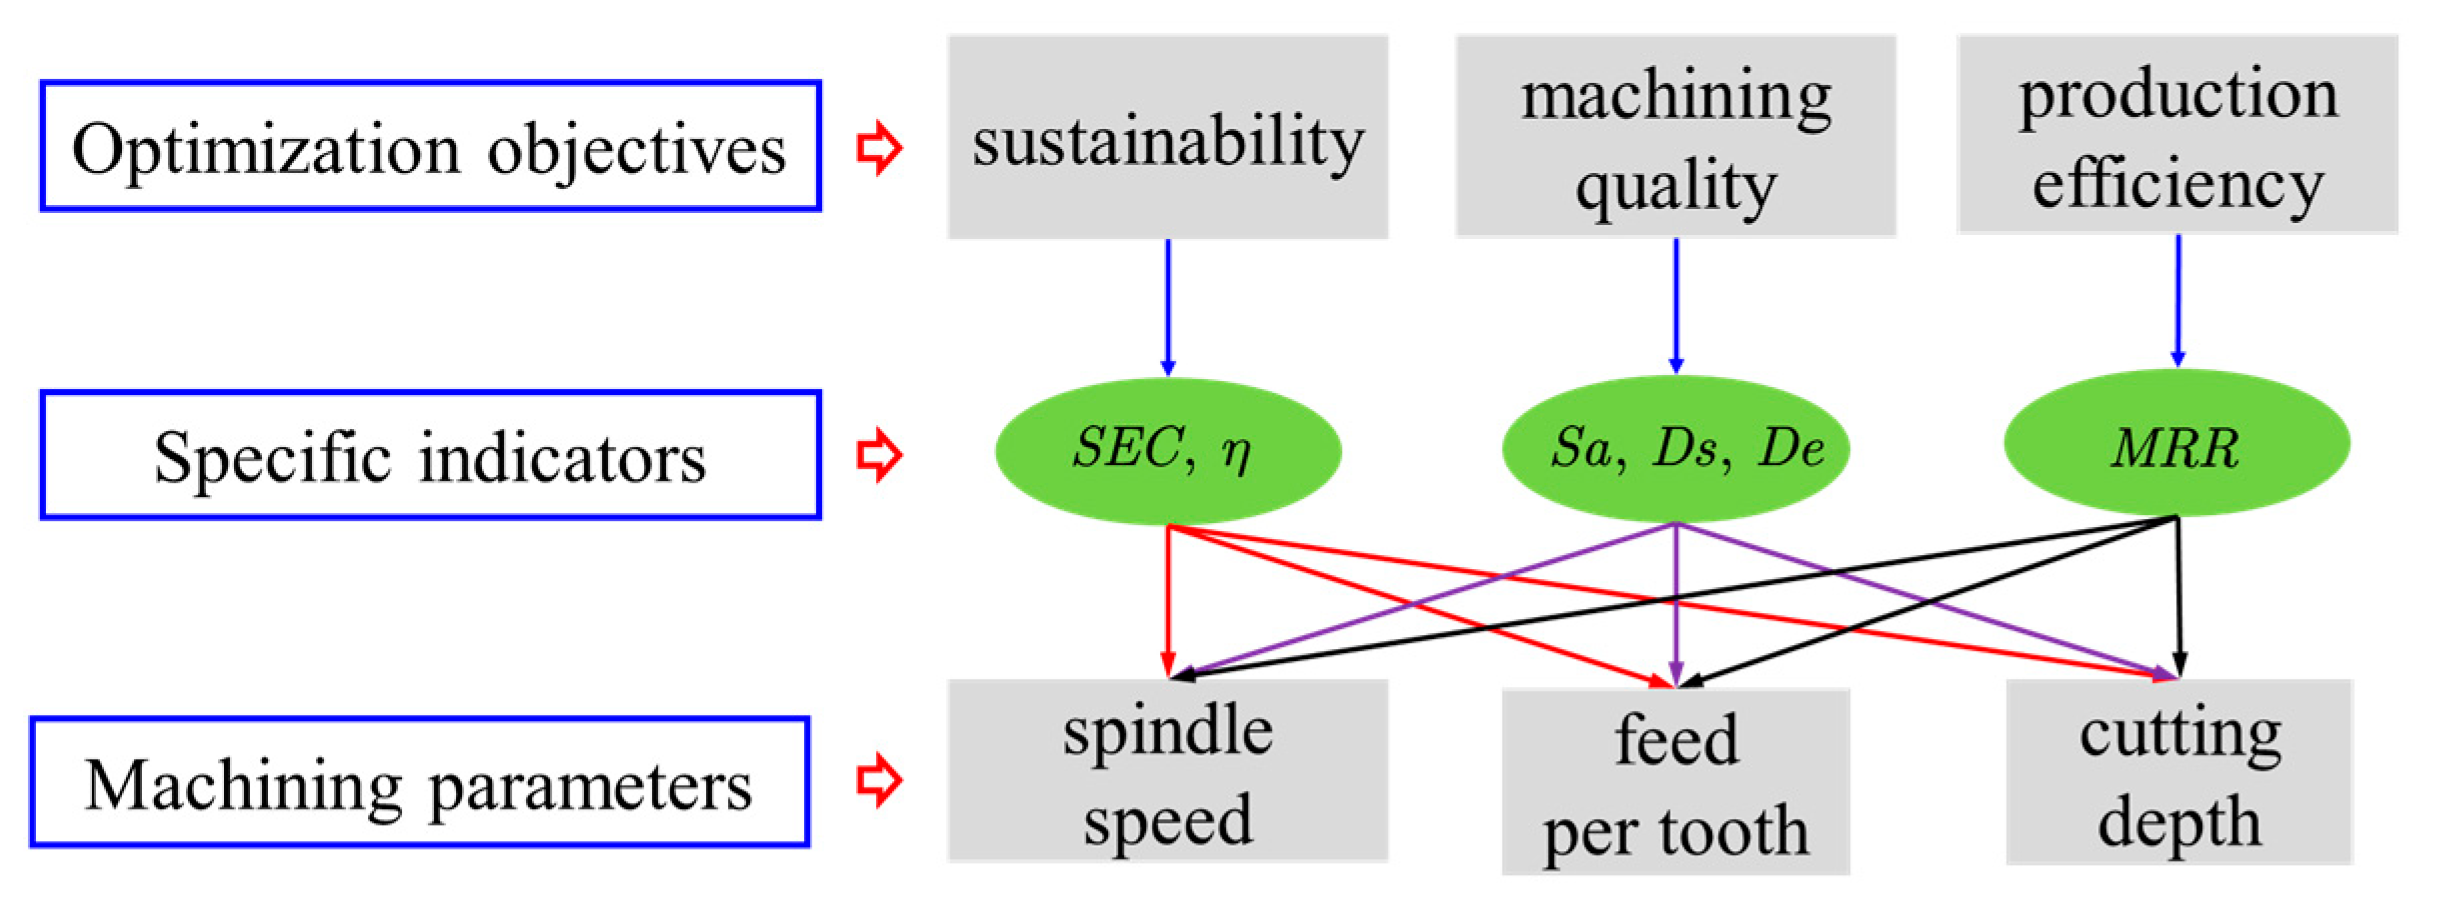
2.2. Description of the Multi-Objective Optimization Problem

In the material removal process, improving a specific technical index by adjusting the process parameters may lead to the deterioration of performance in other areas. Therefore, the objective of this study was to balance the relationship between sustainability, machining quality, and efficiency in micro-milling processes, which is illustrated in Figure 5.
In this study, the optimization objectives included surface roughness (Sa), surface fractal dimension (Ds), and size error (De) as measures of machining quality; the material removal rate (MRR) considered for evaluating machining efficiency; and the specific cutting energy consumption (SCE) employed for energy efficiency assessment. Their definitions are shown in Equations (16)–(20).
S a = S | Φ ( x , y ) ξ ( x , y ) | d x d y / S
where Φ(x,y) denotes the height information of the surface, and ξ(x,y) corresponds to the reference plane of the surface.
D s = ln N ( ε ) ln ( ε 1 )
where ε represents the side length of the box, and N(ε) represents the number of boxes. The value of the surface fractal dimension represents the richness of details on the surface, reflecting the complexity and finesse of the surface contour in space, as well as its ability to fill space. In comparison with parameters of surface roughness, the surface fractal dimension is more sensitive to the absence of surface microstructures. Therefore, selecting the surface fractal dimension to characterize surface quality holds a certain significance [26,27].
D e = | D a D i |
where De is the actual dimension, Da is the actual dimension, and Di is the design dimension. The dimensional errors (De) were measured using pixel analysis of the SEM-measured picture. In comparison with image scales, three positions on the thin-walled microstructure were selected for averaging; thus, the actual dimensions were determined, followed by subtracting the design dimensions to obtain the dimensional errors.
M R R = a p a e f
where ap, ae, and f are the cutting depth, cutting width, and feed speed, respectively.
S C E = E total V material = P T M R R T = P M R R
where SCE, Etotal, Vmaterial, T, and P are the specific cutting energy, cutting energy, volume of removal material, machining time, and machining power, respectively.
The three process parameters to be optimized are the spindle speed n, feed per tooth fz, and cutting depth ap. Considering the main technical requirements of thin-walled microstructures, the optimal combination of process parameters can be obtained with the constraints shown in Equations (21) and (22).
{ n min n n max f z min f z f z max a p min a p a p max
{ min S a ( n , f z , a p ) max D s ( n , f z , a p ) min D e ( n , f z , a p ) max M R R ( n , f z , a p ) min S E C ( n , f z , a p )
To eliminate the negative impacts caused by the improper selection of process parameters, it is essential to adopt appropriate optimization methods, which generally fall into two categories: traditional methods and intelligent methods. Traditional methods typically rely on experimental design and gradient-based search, the limitation of which lies in the fact that the convergence can be greatly influenced by the nonlinearity of the objective function and initial value settings and the global optimality is hard to ensure. Therefore, in recent years, intelligent optimization algorithms have been widely applied to parameter optimization in machining, with evolutionary algorithms being the most extensively used. The high dimensionality of the optimization objective space poses challenges in the optimization process. Therefore, in this paper, various process parameter optimization methods were utilized, and their results were compared, including NSGA-II (non-dominated genetic sorting algorithm-II), MOPSO (multi-objective particle swarm optimization), and NSGA-III (non-dominated genetic sorting algorithm-III) [28,29].

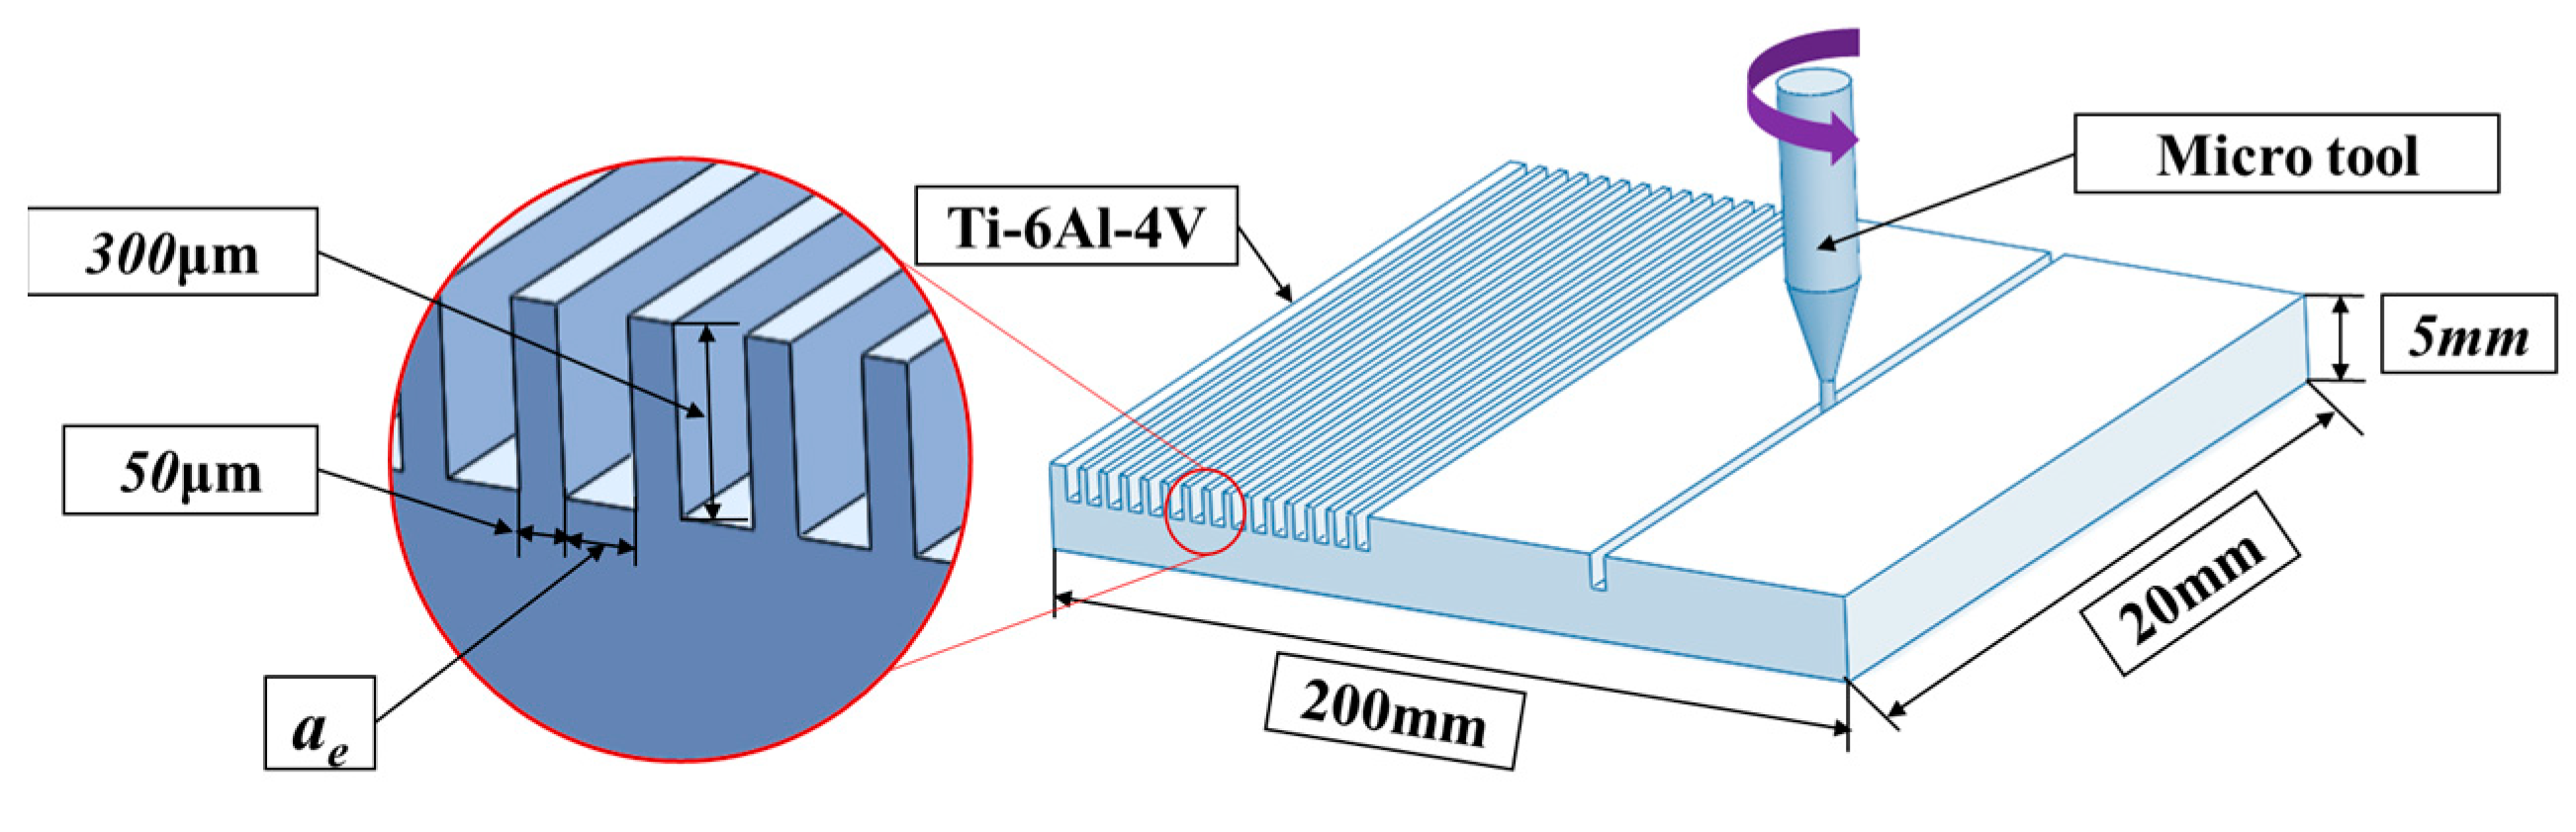
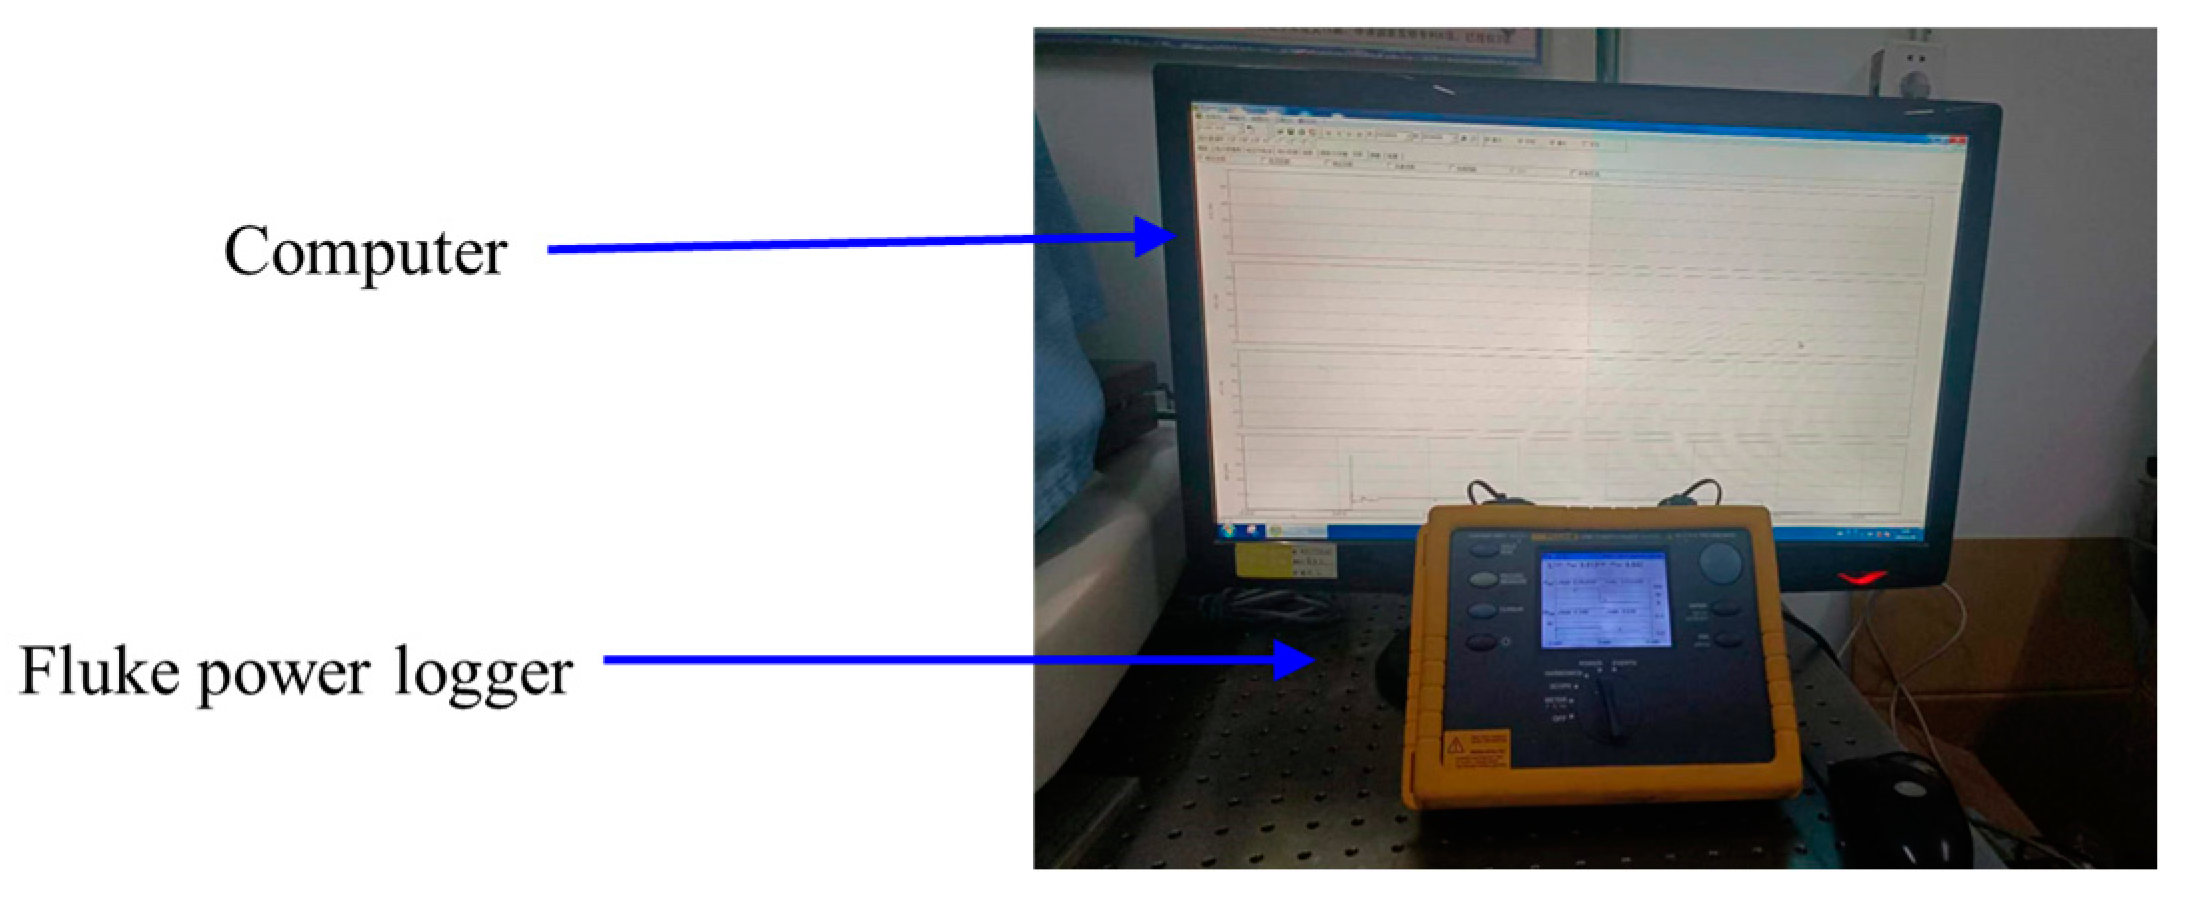
2.3. Experimental Design

The micro-milling experiments were conducted in the Kern Evo five-axis vertical machining center. The cutting tools had a diameter of 800 μm and a helix angle of 60 degrees. The workpiece material was a Ti-6Al-4V alloy, the main dimensions of which are shown in Figure 6. In order to analyze and validate the power consumption model proposed above, the Fluke 1735 three-phase power logger was employed to record the power characteristics during the machining process, as shown in Figure 7.
Due to the feed and spindle power consumption only being influenced by single factors in the non-machining stage, an experiment was designed to validate the proposed power consumption models, and the corresponding parameters are shown in Table 1.
The material removal power is influenced by the combination of process parameters. In order to analyze the effects of the process parameters on the machining quality, production efficiency, and energy efficiency, an orthogonal experiment was designed, and the corresponding levels are shown in Table 2. Ignoring the interactions between process parameters, the experimental design was conducted based on the L16 Taguchi experimental table [30], as shown in Table 3.

3. Results and Discussions

For the non-machining experiments, the power results corresponding to different feed rates are shown in Figure 8. It can be observed that the power values exhibit an increasing trend with the increasing feed rate.
To determine the model coefficients, a quadratic fitting was performed, and the trend of the power variation with the feed rate was obtained, as depicted in Figure 9.
The result of the quadratic fitting is shown in Equation (23).
P feed s = 4.4 × 10 5 f 2 + 0.0038 f + 1.83
The variance (R2), adjusted variance (R2-adj), and prediction variance (R2-pre) of the proposed model all exceeded 90%, as shown in Table 4, which indicates that the modeling method presented in this study demonstrates high prediction accuracy.
The variation trend of the spindle power at different speeds is shown in Figure 10. It can be observed that, compared with the feed motion, the spindle rotational motion consumes higher power. Therefore, in the process of energy consumption optimization, special attention should be given to the spindle power.
The power consumption of the spindle demonstrates a well-fitted quadratic relationship with the rotational speed, as depicted in Figure 11. The fitting result is presented in Equation (24). The variance (R2), adjusted variance (R2-adj), and prediction variance (R2-pre) of the proposed fitting model all exceeded 98%, as shown in Table 4, which indicates that the proposed modeling method demonstrates good prediction accuracy.
P spindle s = 2.37 × 10 7 n 2 + 0.00461 n + 1.3
To facilitate the fitting of the relationships between the process parameters and material removal power, Equation (14) was further manipulated into Equation (25). A linear regression approach can be employed to obtain the coefficients for each term.
ln P mr = ln a + c 1 ln n + c 2 ln f z + c 3 ln a p
Under each set of process parameters, the total power Ptatal can be measured when performing each experiment; the machine base power Pb can be measured when the machine tool is powered on but without performing any movement or processing, as shown in Figure 2; the spindle power Ps and feed power Pf can be calculated using Equations (23) and (24), respectively; and after determining the power component values above, the material removal power can be calculated using Equation (26). The corresponding values are presented in Table 5.
P m = P total ( P b + P a + P s + P f )
To achieve the best predictive accuracy, a comparison between the exponential fitting and polynomial fitting models was performed. The results of the exponential and polynomial fittings are shown in Equation (27) and Equation (28), respectively.
P mr = 14.92 n 0.0613 f z 0.1214 a p 0.0708
P mr = 10.18 + 6 × 10 5 n + 0.153 a p + 1.98 f z + 1 × 10 6 n a p 1.9 × 10 5 n f z 0.0034 a p f z
To compare the goodness of fit and predictive accuracy of the two fitting models, the variance (R2), adjusted variance (R2-adj), predictive variance (R2-pre), Akaike information criterion (AIC), and Bayesian information criterion (BIC) values were obtained, as shown in Table 6.
It is evident that selecting different criteria as the goodness-of-fit measures leads to different conclusions. In comparison with the exponential model, the polynomial fitting model exhibits higher values for R2 and R2-adj but a lower value for R2-pre. However, the differences are not very significant. To better explain the selection rationale, the AIC and BIC values of both models were also compared. The AIC and BIC values of the exponential fitting model are both smaller than the polynomial fitting model, indicating that the exponential model is superior from both predictive and fitting perspectives.
After obtaining models for the spindle power, feed power, and material removal power, the variable power could be obtained using Equation (29).
P var = P s + P f + P m
From the range analysis, it can be observed that the order of the process parameters’ influences on the variable power is as follows: spindle speed, feed per tooth, and cutting depth. The range value of the spindle speed is significantly larger than the range values of the feed per tooth and cutting depth, which indicates that during micro-milling processes, the cutting energy consumed by the spindle unit is the highest, as shown in Table 7. The main effects of the process parameters on the variable power also support this result, as shown in Figure 12.
The surface topographies are shown in Figure 13, which were measured with a white-light interferometer. The measurement range was 396 μm by 396 μm. The indicators characterizing the micro-milling quality, including Sa, Ds, and De, are presented in Table 3. The corresponding regression models are shown in Equation (30), and the respective goodness-of-fit indices are listed in Table 8.
{ S a = 1.8221 × n 0.0830 × f z 0.3404 × a p 0.6230 D s = 2.1839 × n 0.0059 × f z 0.0125 × a p 0.0181 D e = 0.0247 × n 0.3490 × f z 0.3076 × a p 0.2630
The main effects of the process parameters on the surface roughness, fractal dimension, and dimension error are shown in Figure 14, Figure 15 and Figure 16. It can be observed that the surface roughness and fractal dimension exhibit distinct opposite trends because the fractal dimension characterizes the richness of details on the surface. The larger the fractal dimension, the more complex and intricate the structures are. Conversely, the smaller the fractal dimension, the fewer irregular structures there are, and the rougher the structure becomes.
The dimensional error shows an overall increasing trend with the enlargement of the process parameters. This is due to the fact that with the increase in the feed per tooth and cutting depth, the cutting forces exhibit an increasing trend. This leads to greater deformation of thin-walled micro-structures in the vertical feed direction, ultimately resulting in an increase in dimensional error. Conversely, as the spindle speed increases, the heat generated during cutting also increases, making the workpiece material prone to thermal deformation. Consequently, this leads to an augmentation in dimensional error. The reasons for small deformation errors are as follows: The micro-milling force is relatively small, and previous studies have shown that the average cutting force for the micro-milling of titanium alloys is within 5 N [31]; the positioning accuracy of the KERN EVO machining center is 1 μm, with a repeatability accuracy of ± 0.5 μm, exhibiting excellent machining precision; and Ti-6Al-4V possesses high strength, and under the influence of relatively small cutting forces, noticeable deformation errors are not likely to occur.
The main effects of the process parameters on the SCE are shown in Figure 17. It can be observed that the SCE significantly decreases with the increase in feed per tooth and cutting depth because their impacts on the material removal rate do not significantly affect power consumption. However, the multiplication of the spindle speed leads to a rapid increase in power consumption.
The relationship between the SCE and MRR is illustrated in Figure 18, with a Pearson correlation coefficient of −0.793, which exceeds 0.7, indicating a significant negative correlation. This implies that enhancing the machining efficiency can reduce specific energy consumption.
In order to overcome the problem of intelligent optimization algorithms easily getting trapped in local optima, this paper investigated and compared the optimal combination of process parameters using three evolutionary algorithms. Since NSGA-II and MOPSO perform poorly when dealing with four or more optimization objectives, the optimization objectives were first compressed. To retain and interpret the original variable information as much as possible, principal component analysis (PCA) was applied to the three indicators representing the machining quality. First, the standardization of Sa, Ds, and De was performed according to Equation (31).
X mn = ( X mn X ¯ m ) / σ m X ¯ m = n = 1 p X mn / p σ m = n = 1 p ( X mn X ¯ m ) 2 / p
where X mn represents the n-th sampled value of the m-th objective function after normalization; X mn represents the n-th sampled value of the m-th objective function; p represents the total number of samples; and X ¯ m and σ m represent the mean and standard deviation, respectively.
The surface roughness, fractal dimension, and dimensional error correlation coefficients are shown in Table 9. It can be observed that the surface quality indices, Sa and Ds, exhibit a strong negative correlation, while the correlation between surface quality and dimensional error is relatively weak.
Bartlett’s sphericity test and the Kaiser–Meyer–Olkin (KMO) sampling adequacy test were conducted to assess the suitability of PCA, as shown in Table 10. The results indicate that Bartlett’s sphericity test was significant (p = 0.000 < 0.05), and the KMO value was 0.681, which falls between 0.6 and 0.7. Therefore, PCA was appropriate.
Table 11 presents the common factor variance matrix, revealing that the Sa and Ds indicators for surface quality exhibit sufficient information extraction, and the information extraction content of De is relatively small.
Higher eigenvalues indicate greater potential energy and are more crucial for the analysis. In Figure 19, only the first eigenvalue is greater than one, which indicates only one factor is needed to extract from the original features.
The explained total variance is shown in Table 12. The variance contribution of the first component is 78.851%, allowing for the extraction of original features with minimal information loss.
The factor loading matrix is shown in Table 13, which illustrates the contributions of the principal components to each variable. According to the principal component matrix, the linear combinations of machining quality variables can be obtained as Equation (32). This principal component can be interpreted as the machining quality.
P 1 = 0.386 ( S a ) 0.394 ( D s ) + 0.345 ( D e )
Therefore, the objective function optimized with NSGA-II and MOPSO can be expressed as Equation (33), and the objective function optimized with NSGA-III can be expressed as Equation (34).
min f 1 i ( X ) = { f 1 ( X ) = P 1 f 2 ( X ) = M R R 1 f 3 ( X ) = S E C
min f 2 i ( X ) = { f 1 ( X ) = S a f 2 ( X ) = D s 1 f 3 ( X ) = D e f 4 ( X ) = M R R 1 f 5 ( X ) = S E C
The decision variables can be represented as X = [n, fz, ap] T. The ranges of the process parameters are as follows: 50 μm ≤ ap ≤ 150 μm, 15,000 rpm ≤ n ≤ 45,000 rpm, and 0.5 mm/t ≤ fz ≤ 3.5 mm/t. The initial population size and number of iterations for each optimization algorithm were set as 500 and 1500, respectively. A membership function was used to select results from the Pareto solution set, as shown in Equation (35).
p i = f i max f i f i max f i min
where fimax and fimin represent the maximum and minimum values of the i-th objective function, respectively, and fi denotes the value of the i-th objective function.
The optimal solution is selected by maximizing the average p-value, as shown in Equation (36).
P = 1 N i = 1 N p i
The optimization results of process parameters with different methods are listed in Table 14, and the corresponding experimental validations were performed, which can be observed in Figure 20 and Figure 21, respectively. The results obtained using NSGA-III demonstrate a better trade-off between machinability and sustainability compared with the results using NSGA-II and MOPSO. It can be observed that the specific energy consumption and processing efficiency of the three optimization algorithms are very close. However, optimization results based on NSGA-III can achieve better machining quality, including lower surface roughness, larger surface fractal dimensions, and smaller dimensional errors.

4. Conclusions

An optimization strategy for micro-milling process parameters based on multi-objective evolutionary algorithms was proposed. The optimization objectives including machining quality, machining efficiency, and specific cutting energy were trade-offs. The obtained process parameters were validated using micro-milling experiments. The specific conclusions are as follows:
(1)
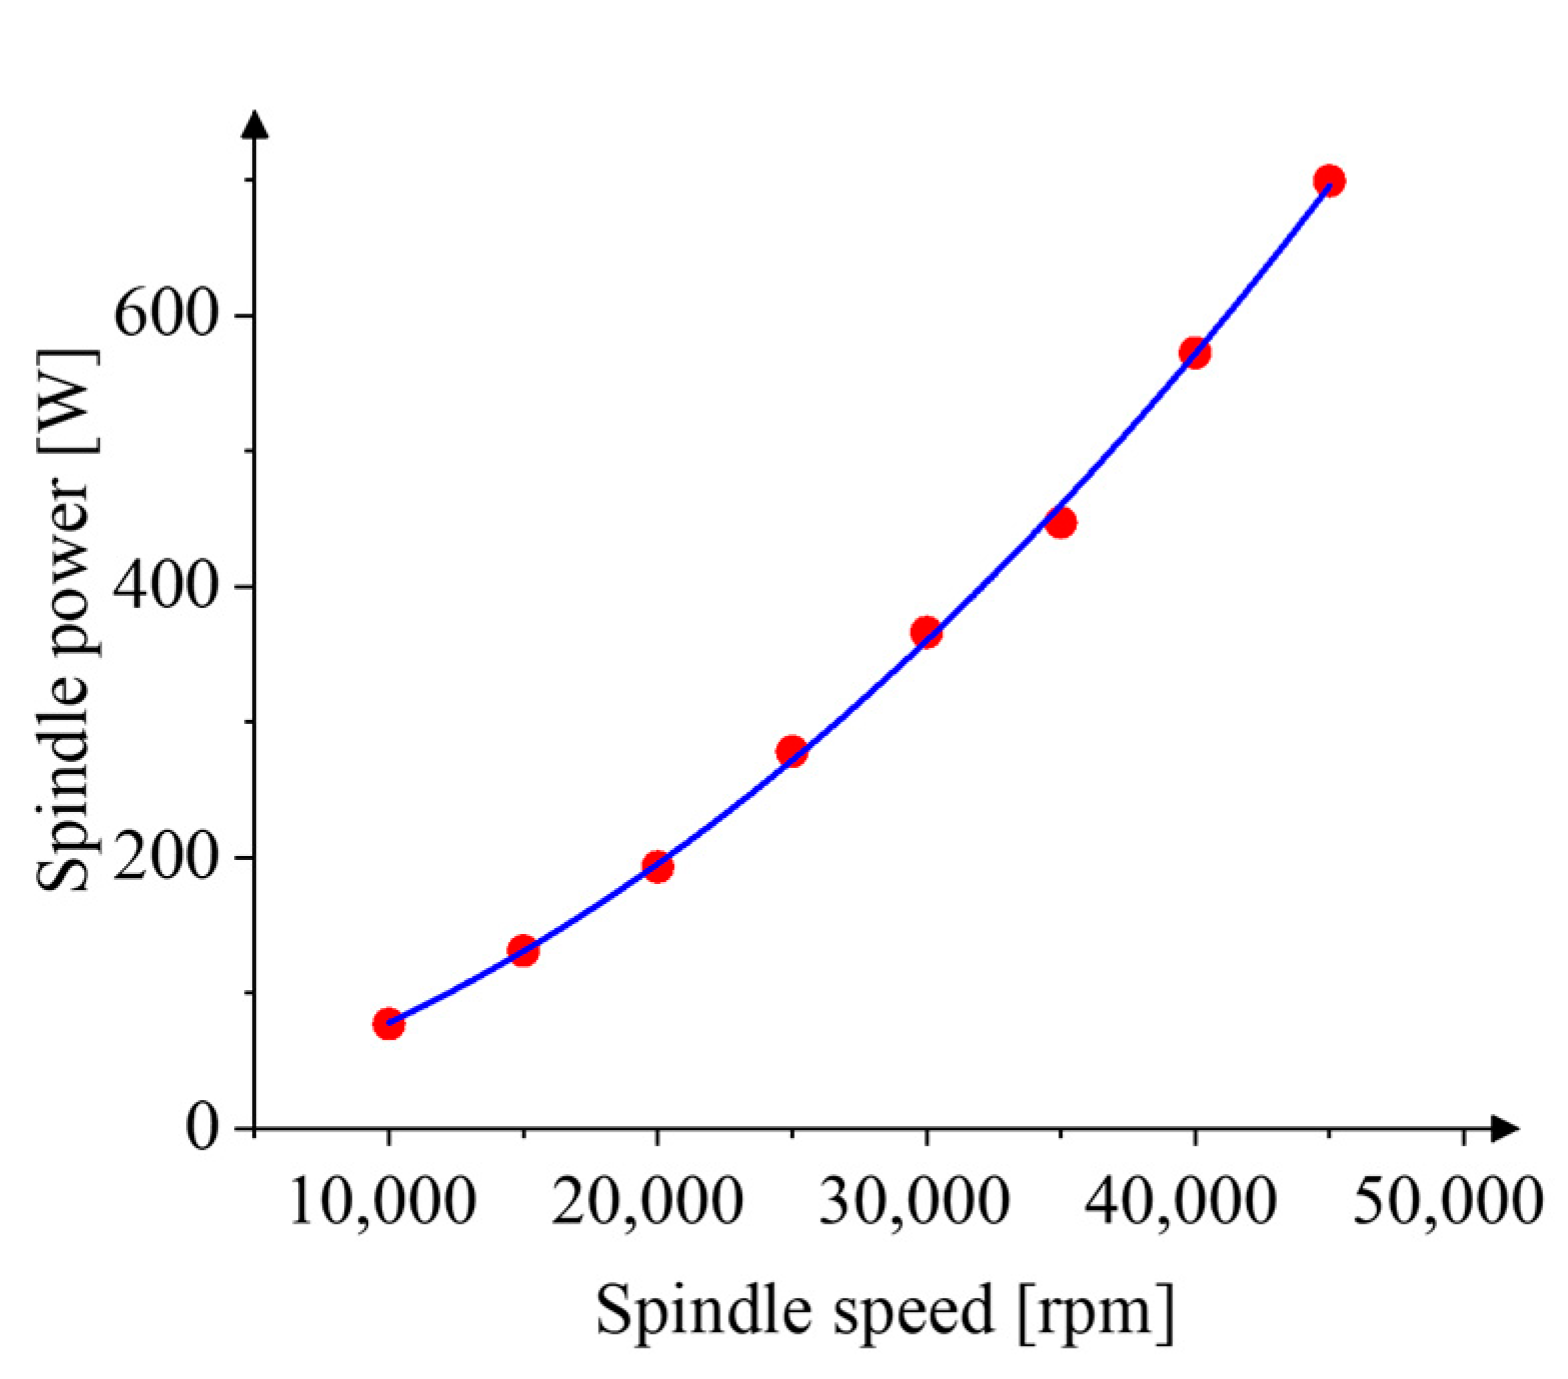
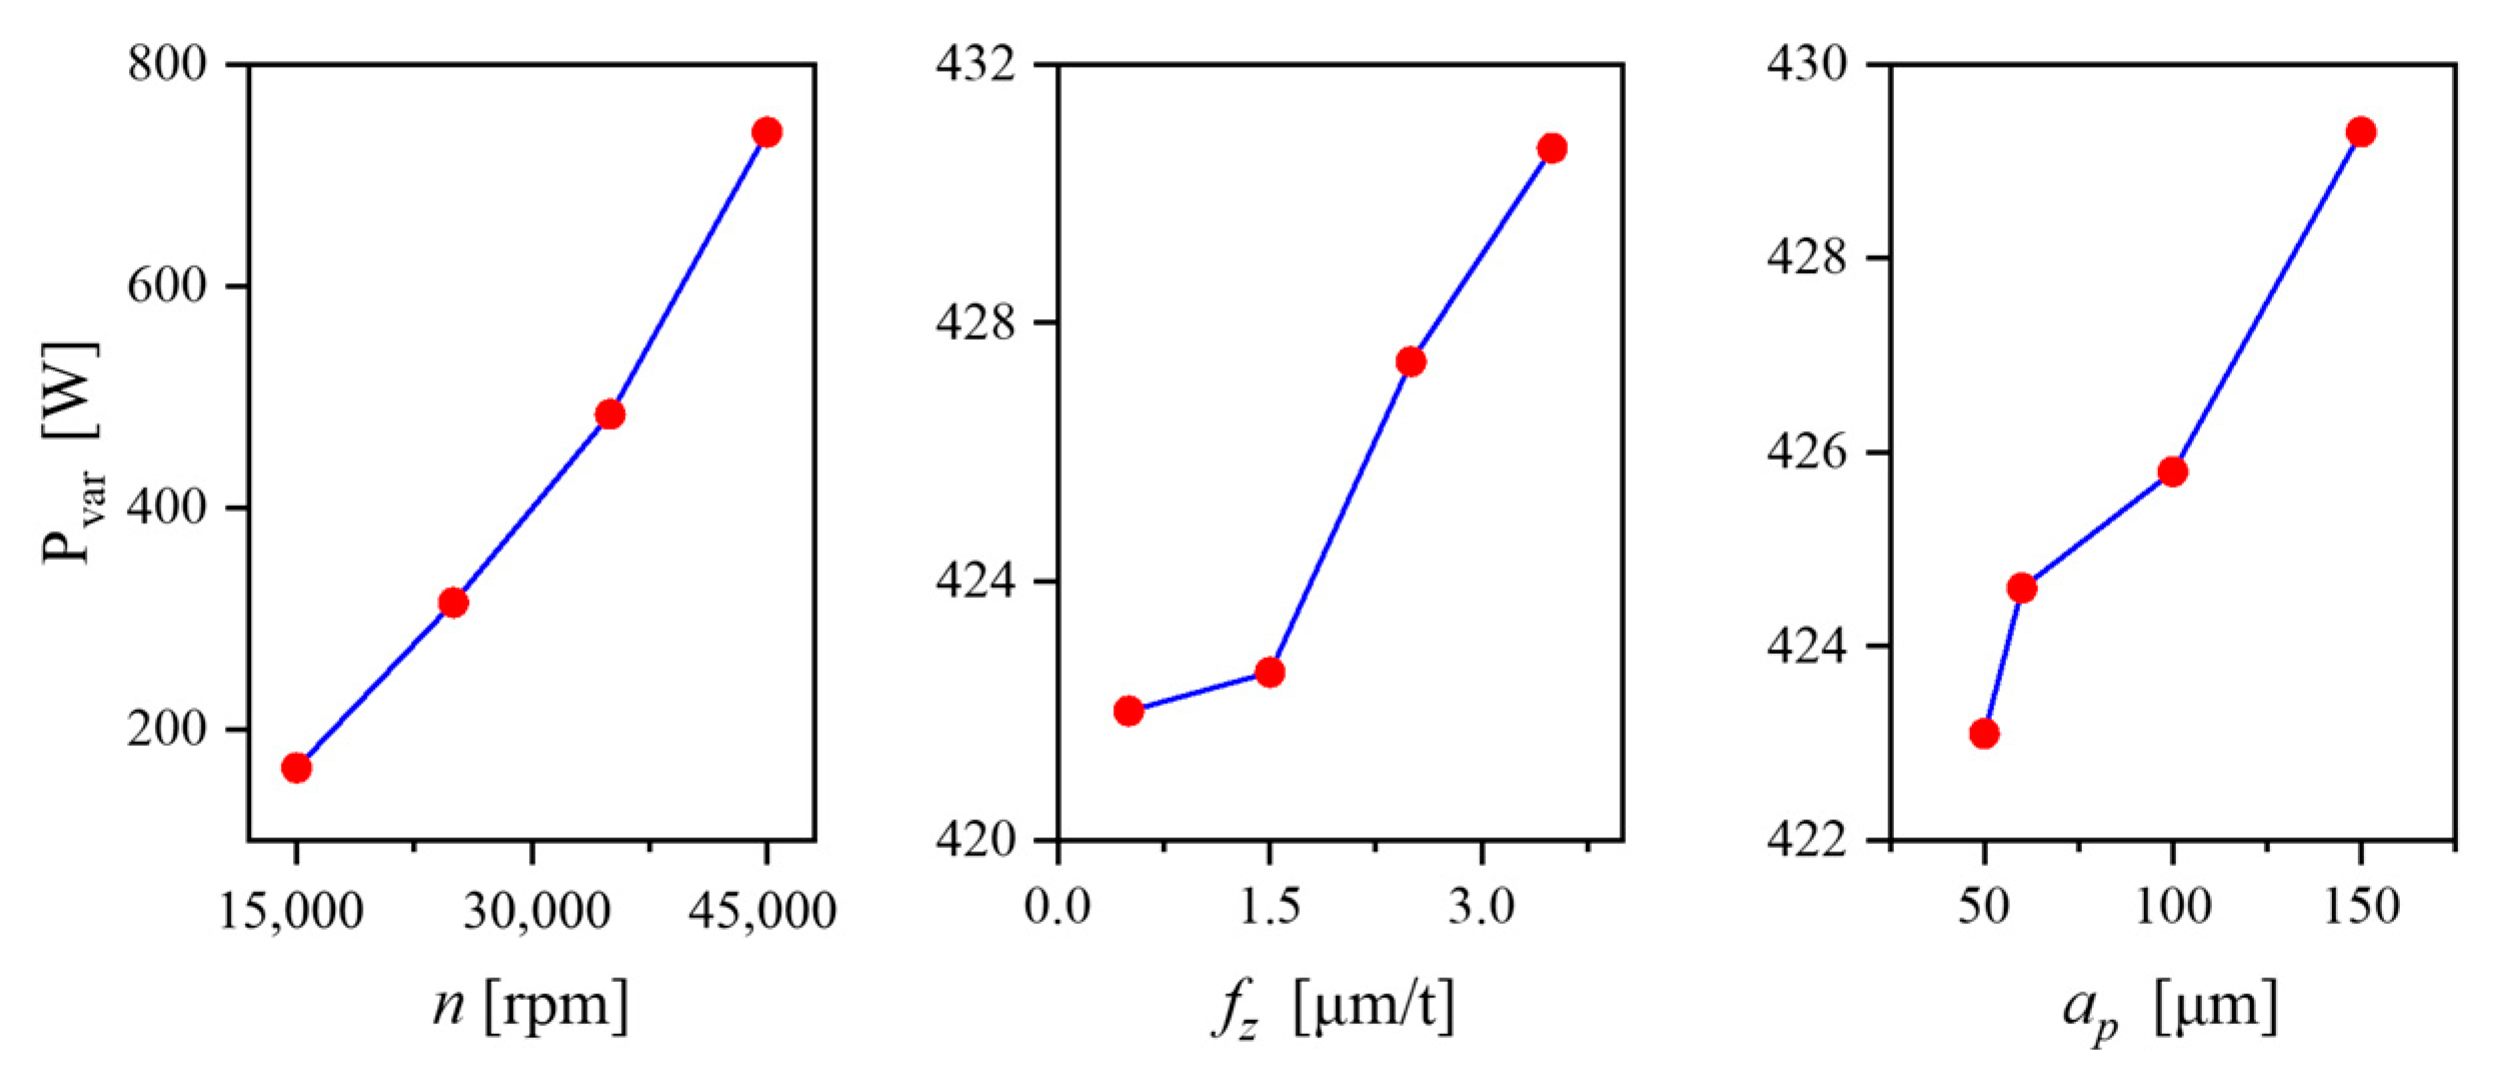
The power consumption characteristics of the micro-milling process were analyzed, and a process-parameter-based power consumption model was established. The analysis revealed that the power consumption of non-machining feed motion exhibits a quadratic relationship with the feed rate, while the non-machining spindle power consumption shows a quadratic relationship with the spindle speed. The spindle speed exerts the greatest influence on the variable power consumption.
(2)
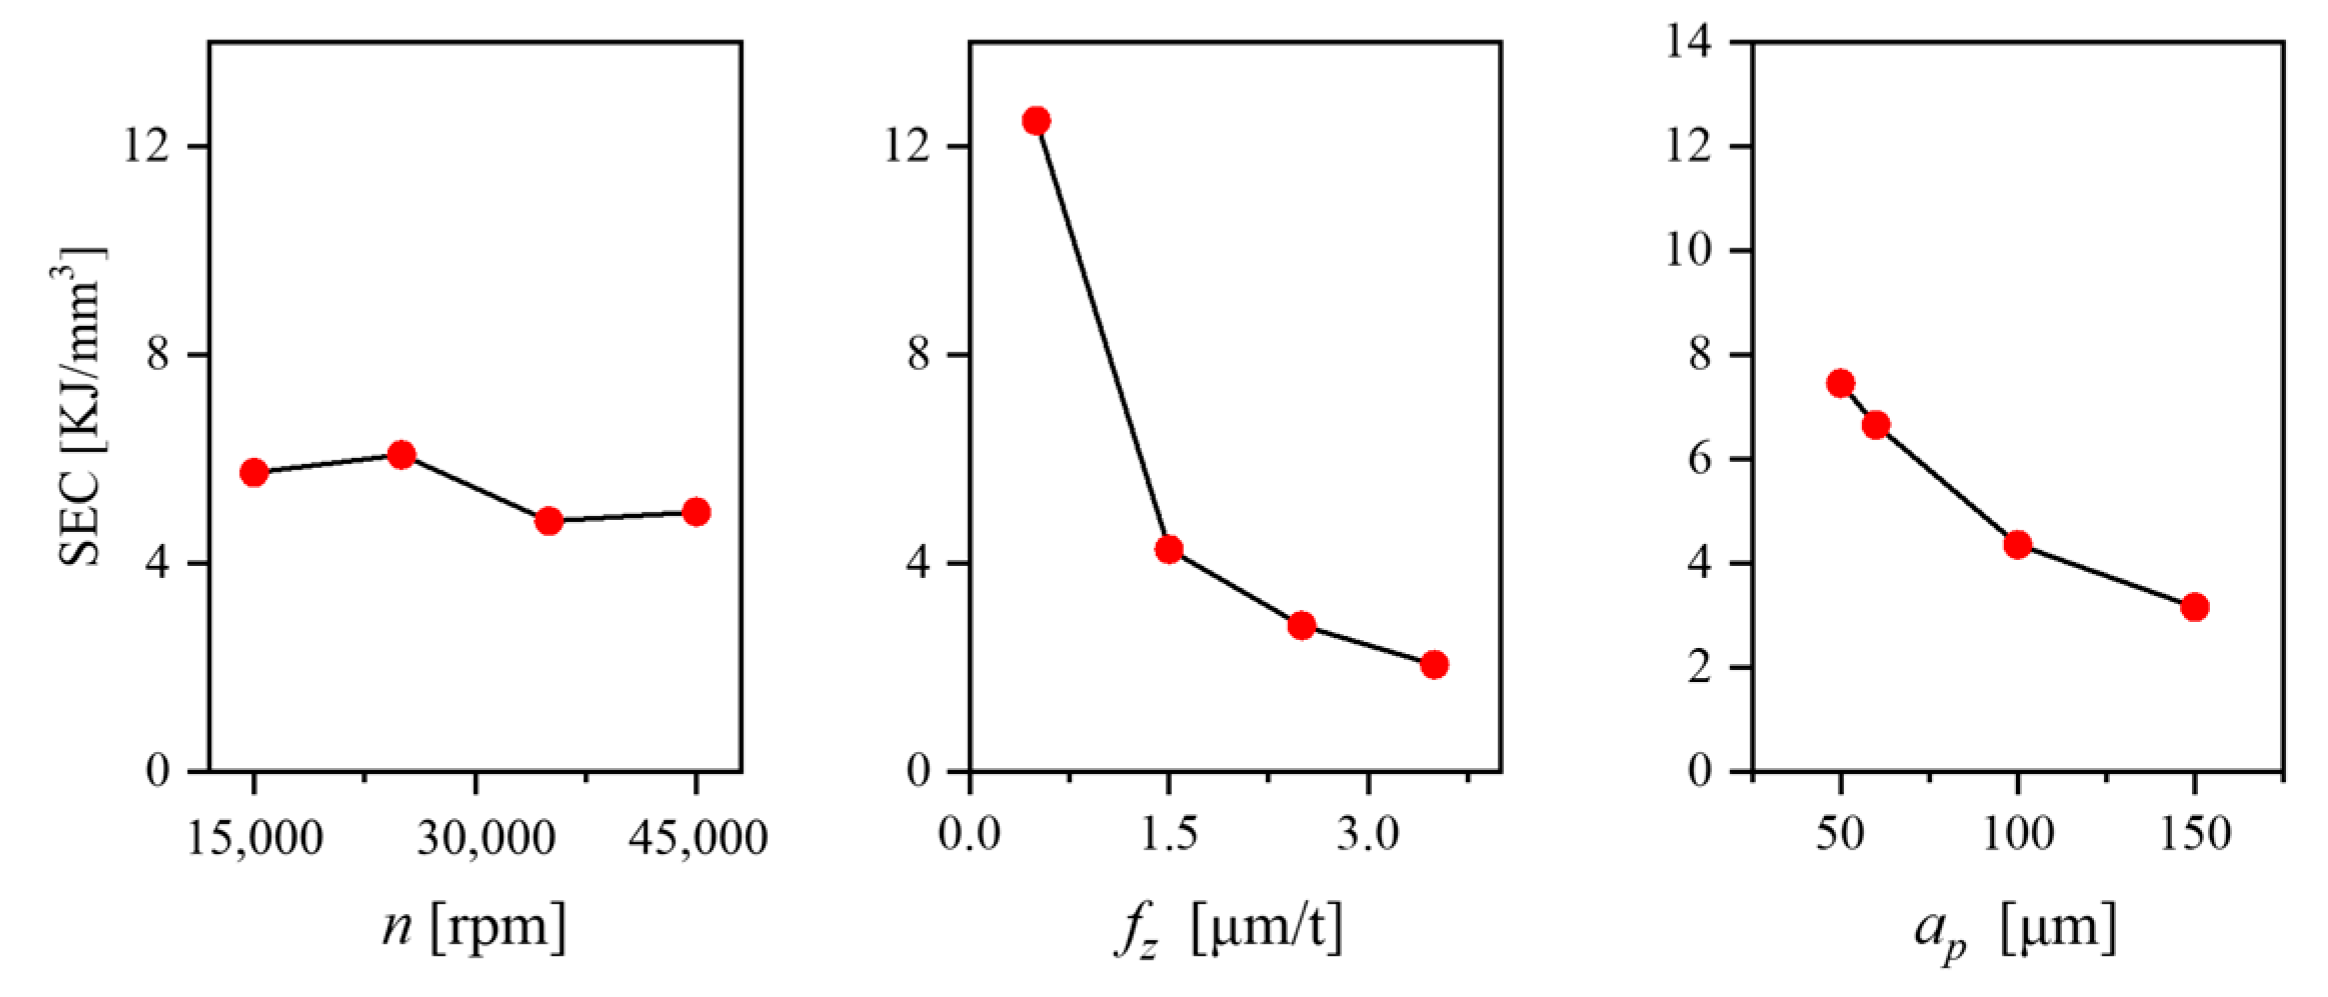
The coefficient between SCE and MRR was −0.793, which indicates that enhancing machining efficiency can simultaneously improve machining sustainability.
(3)
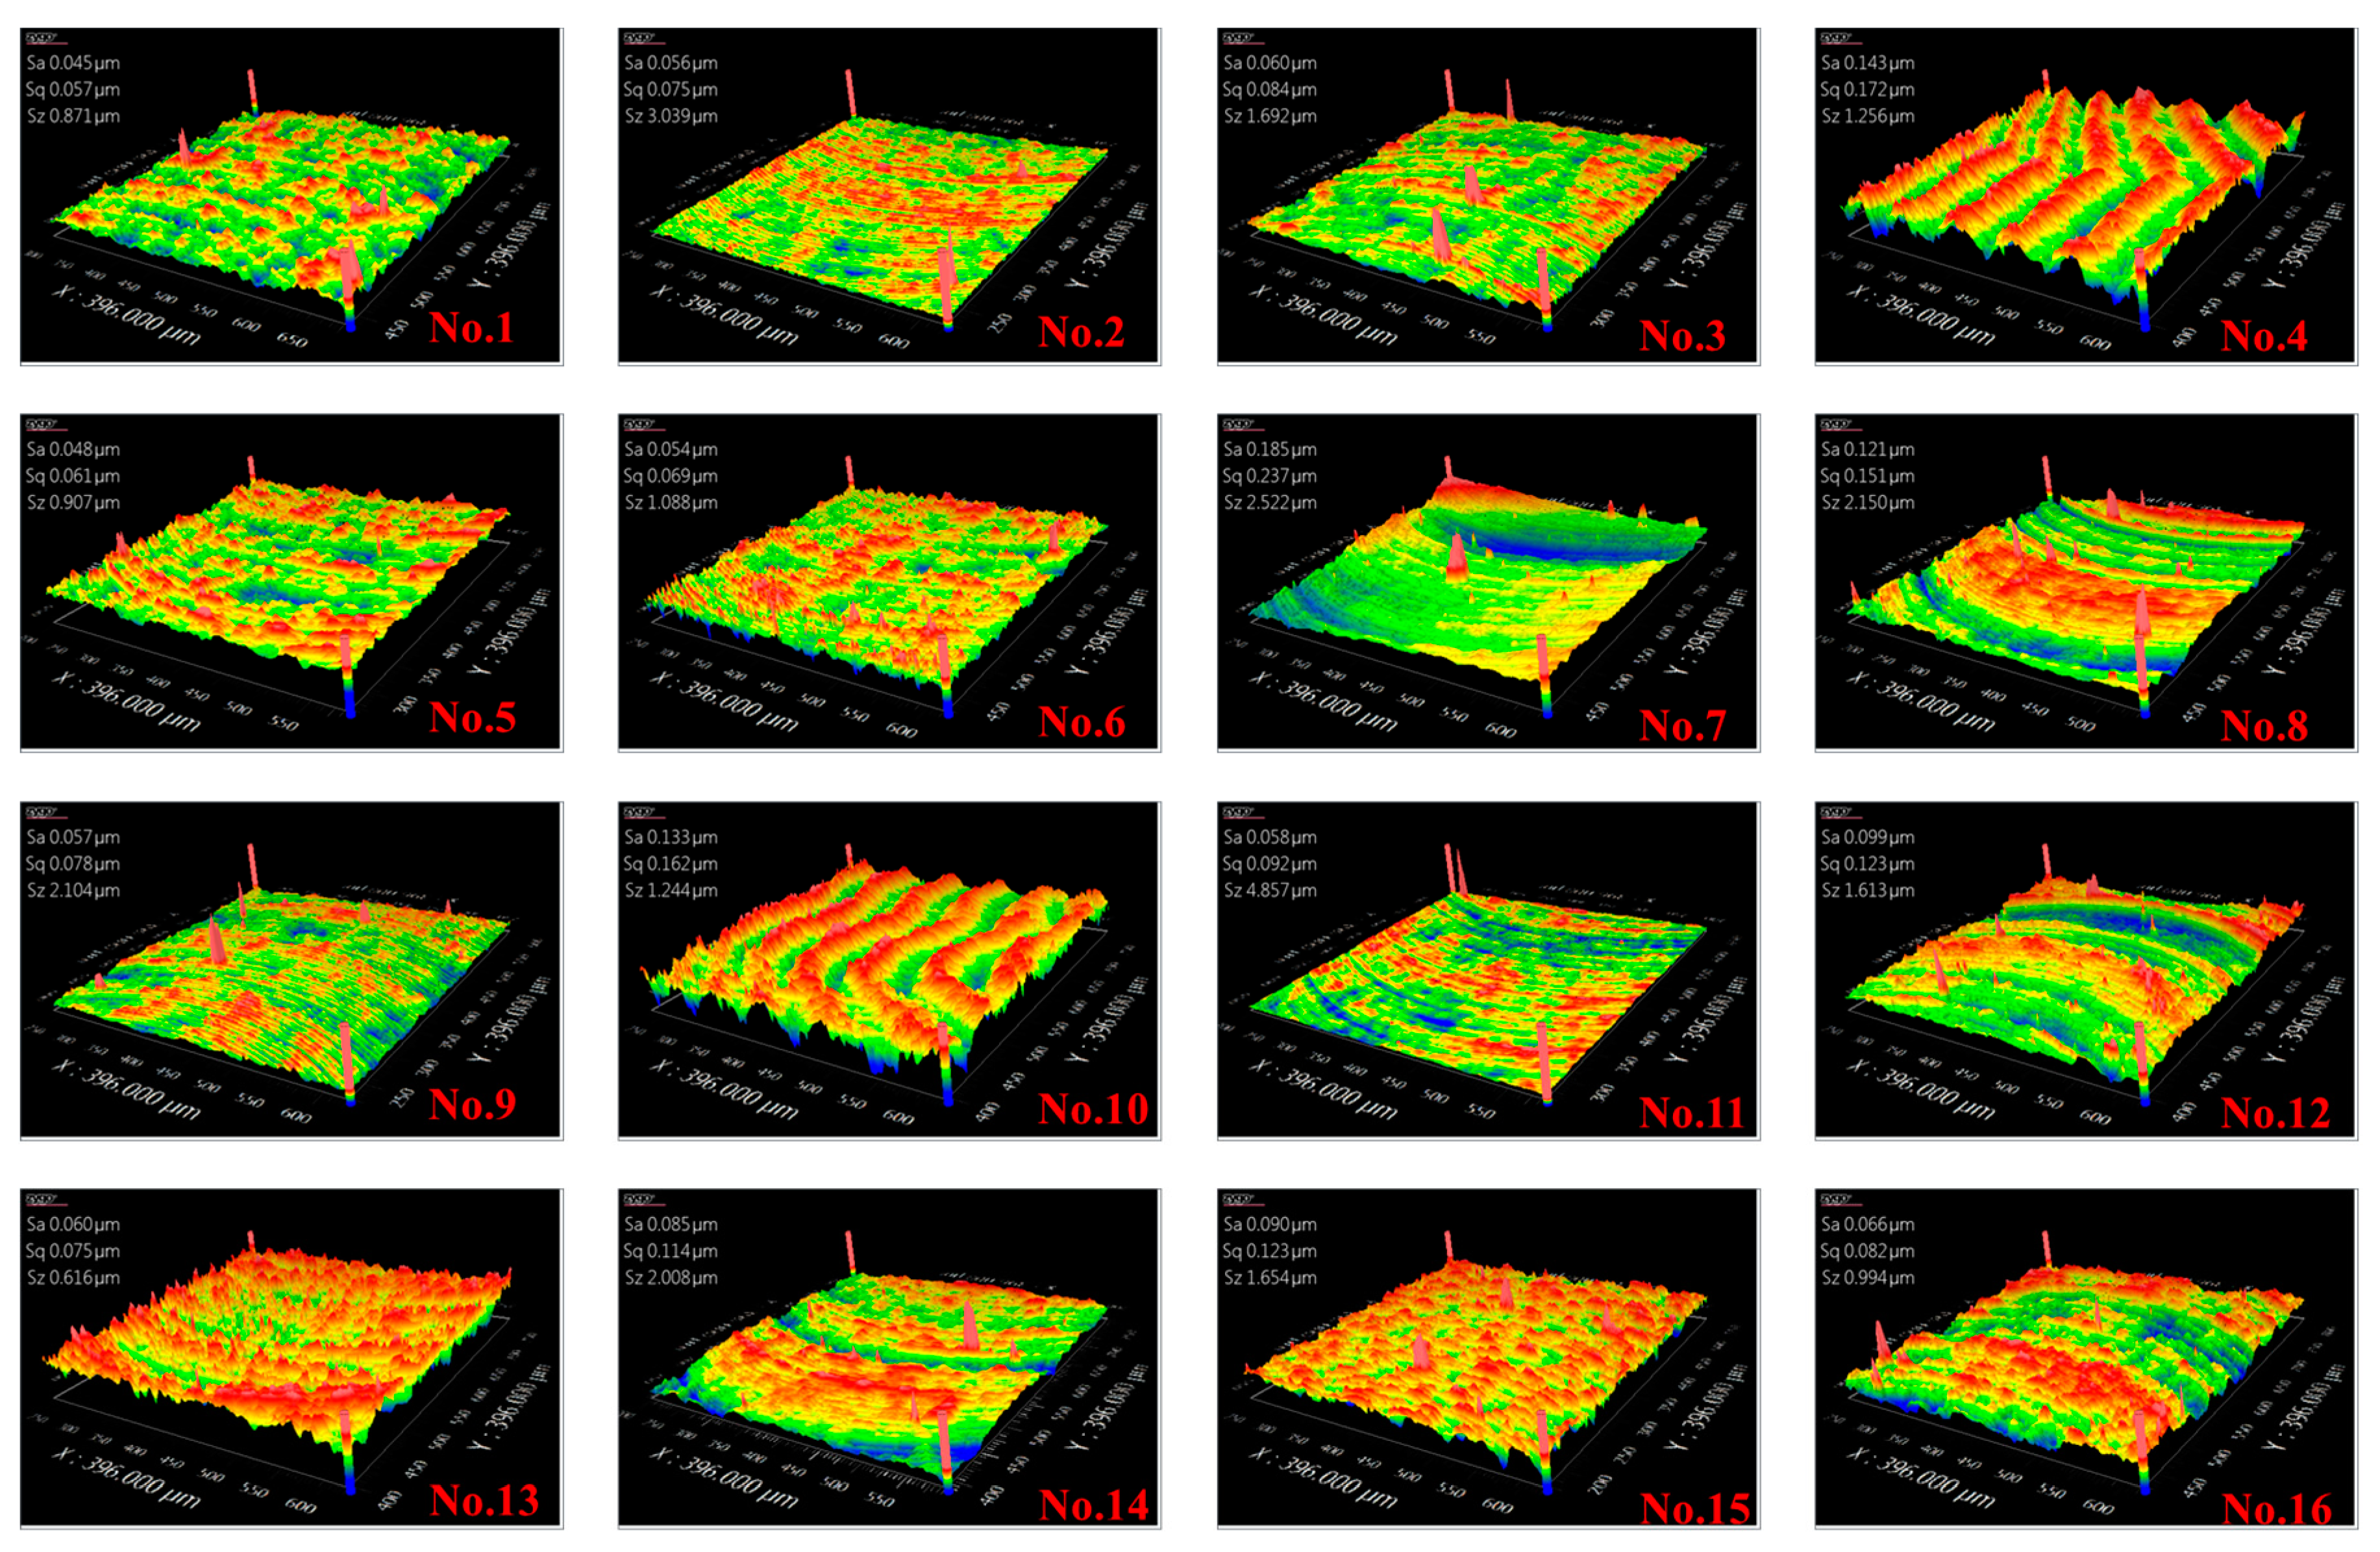
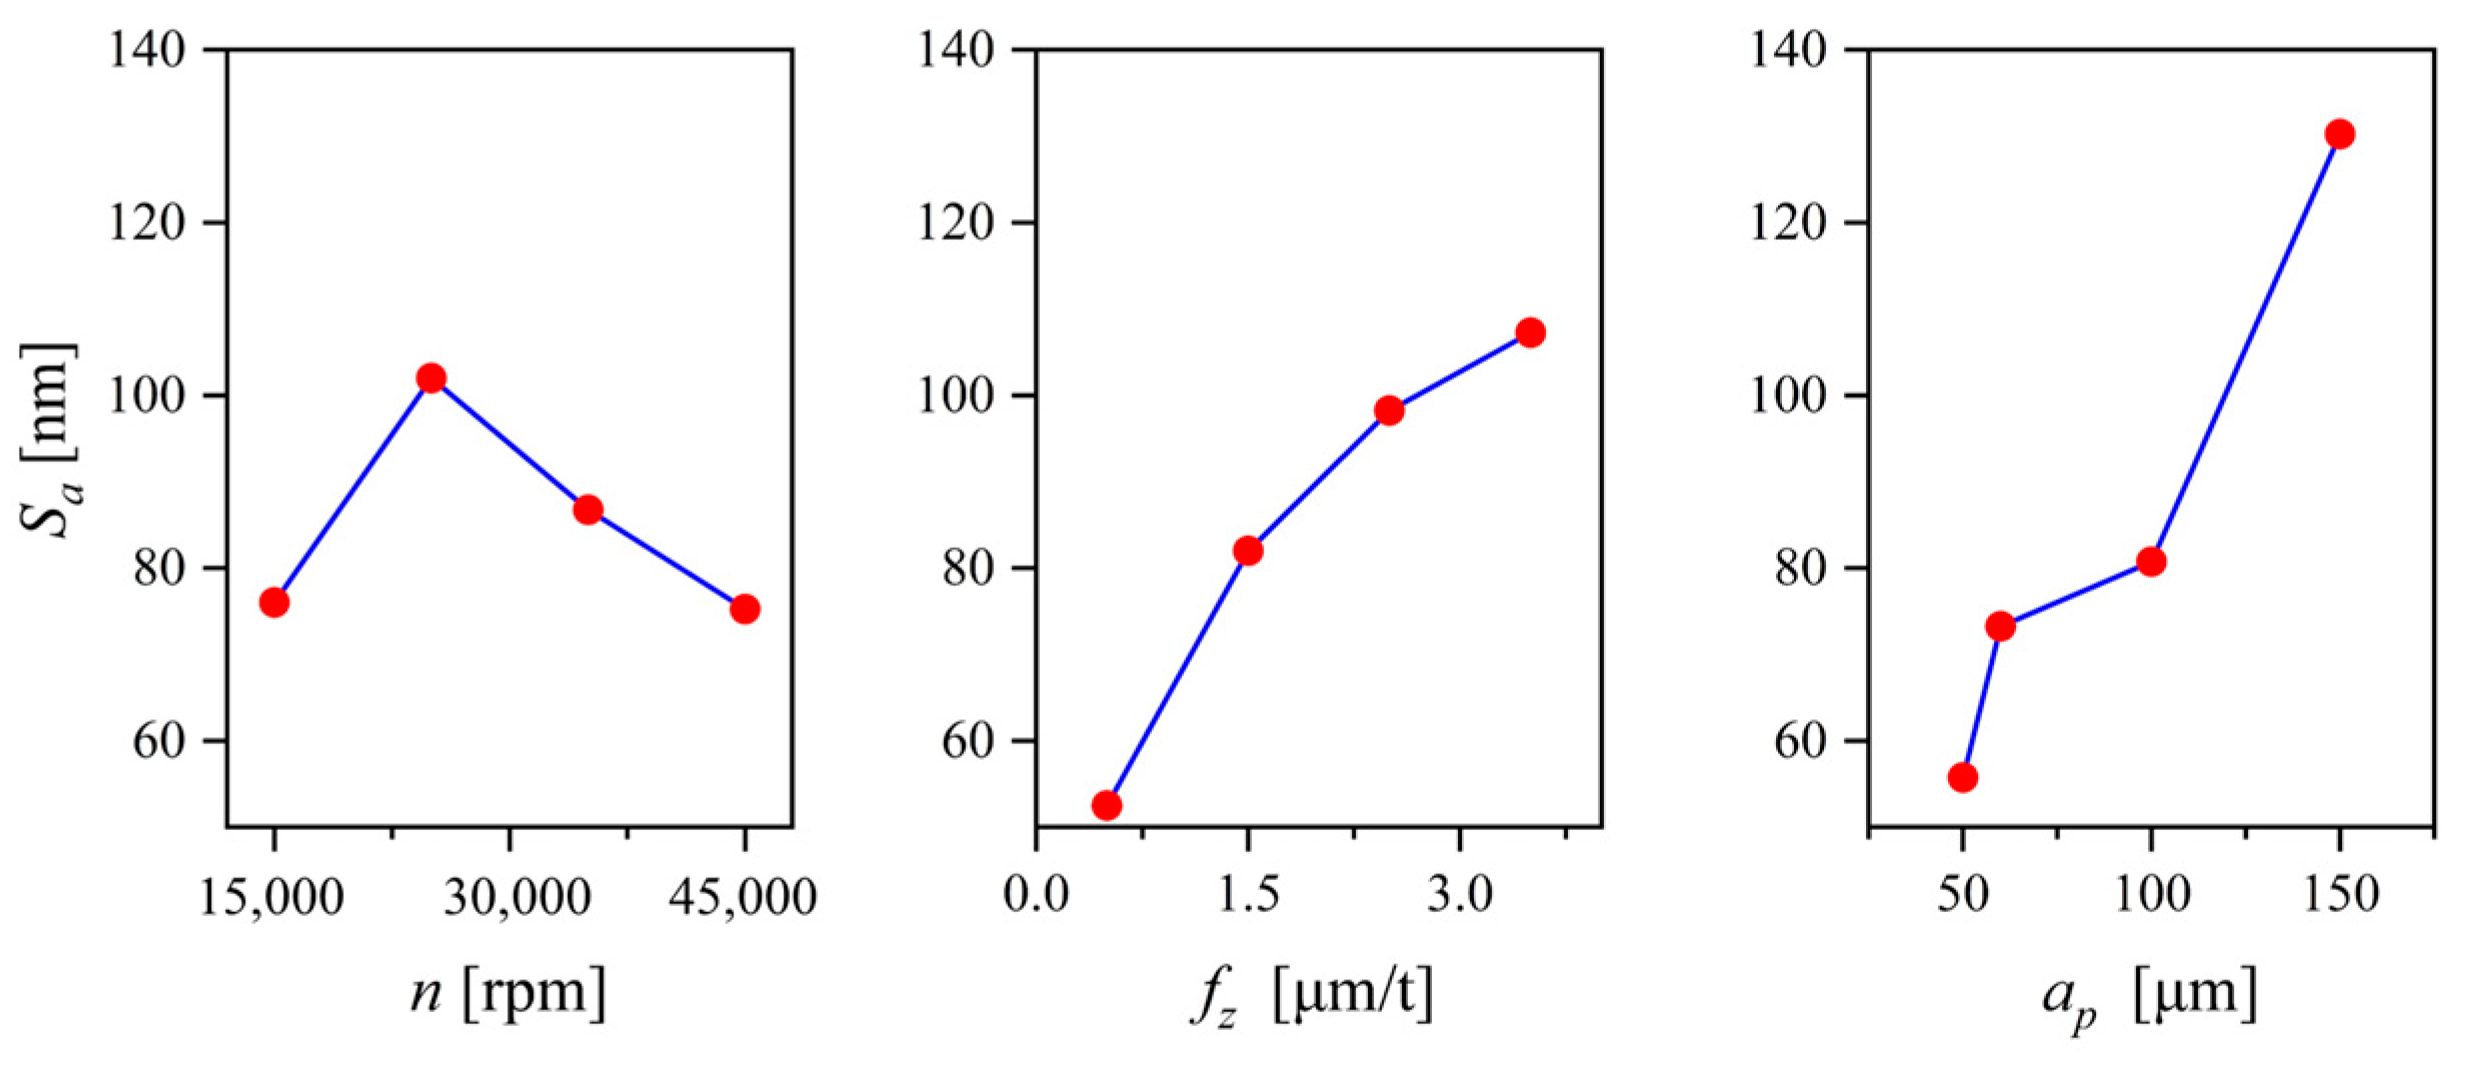
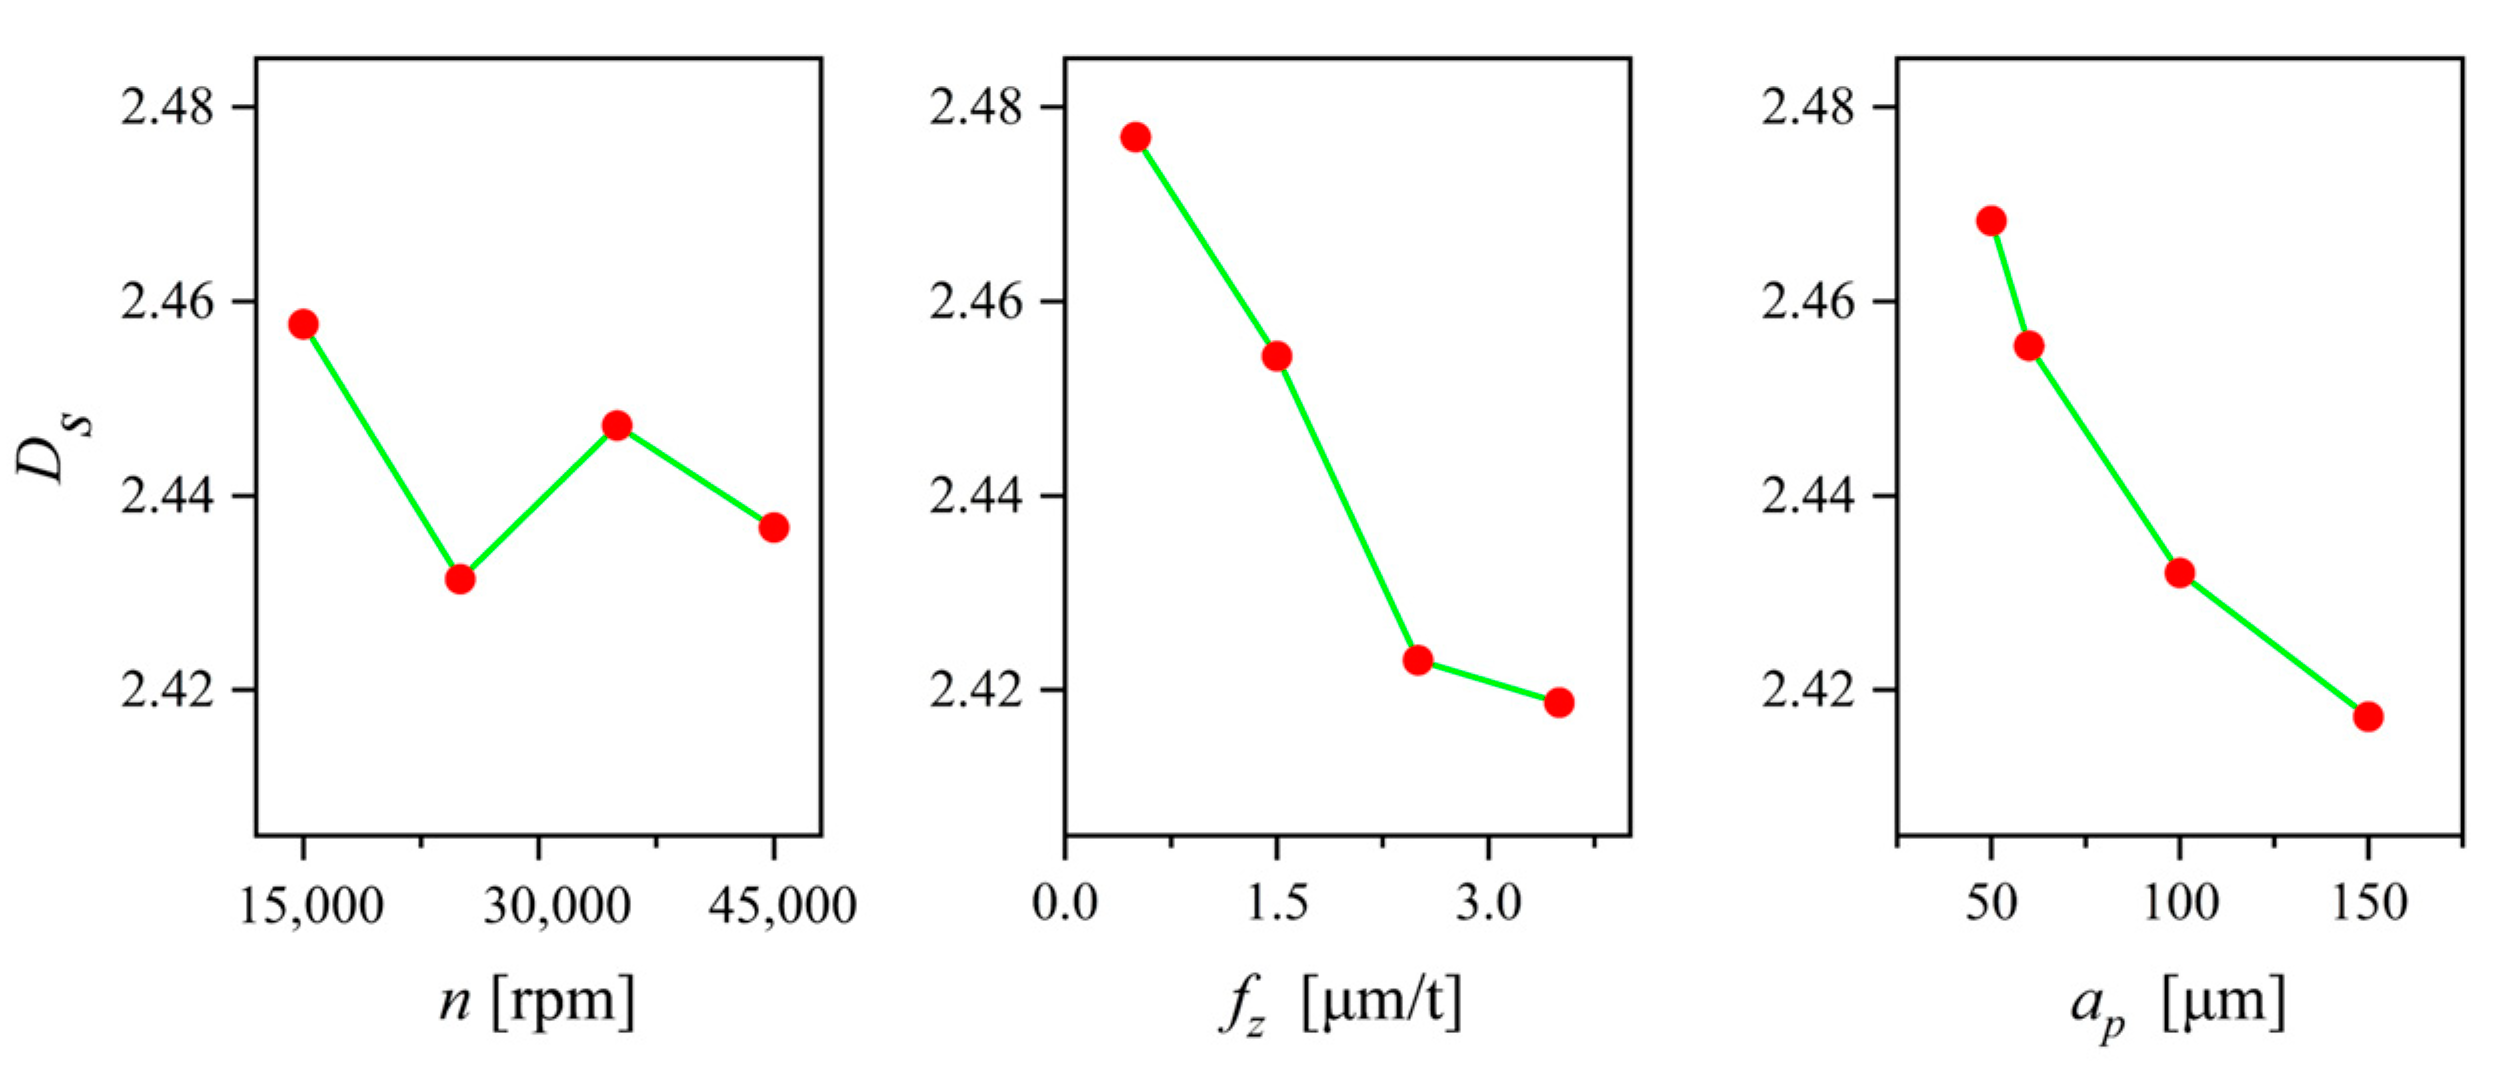
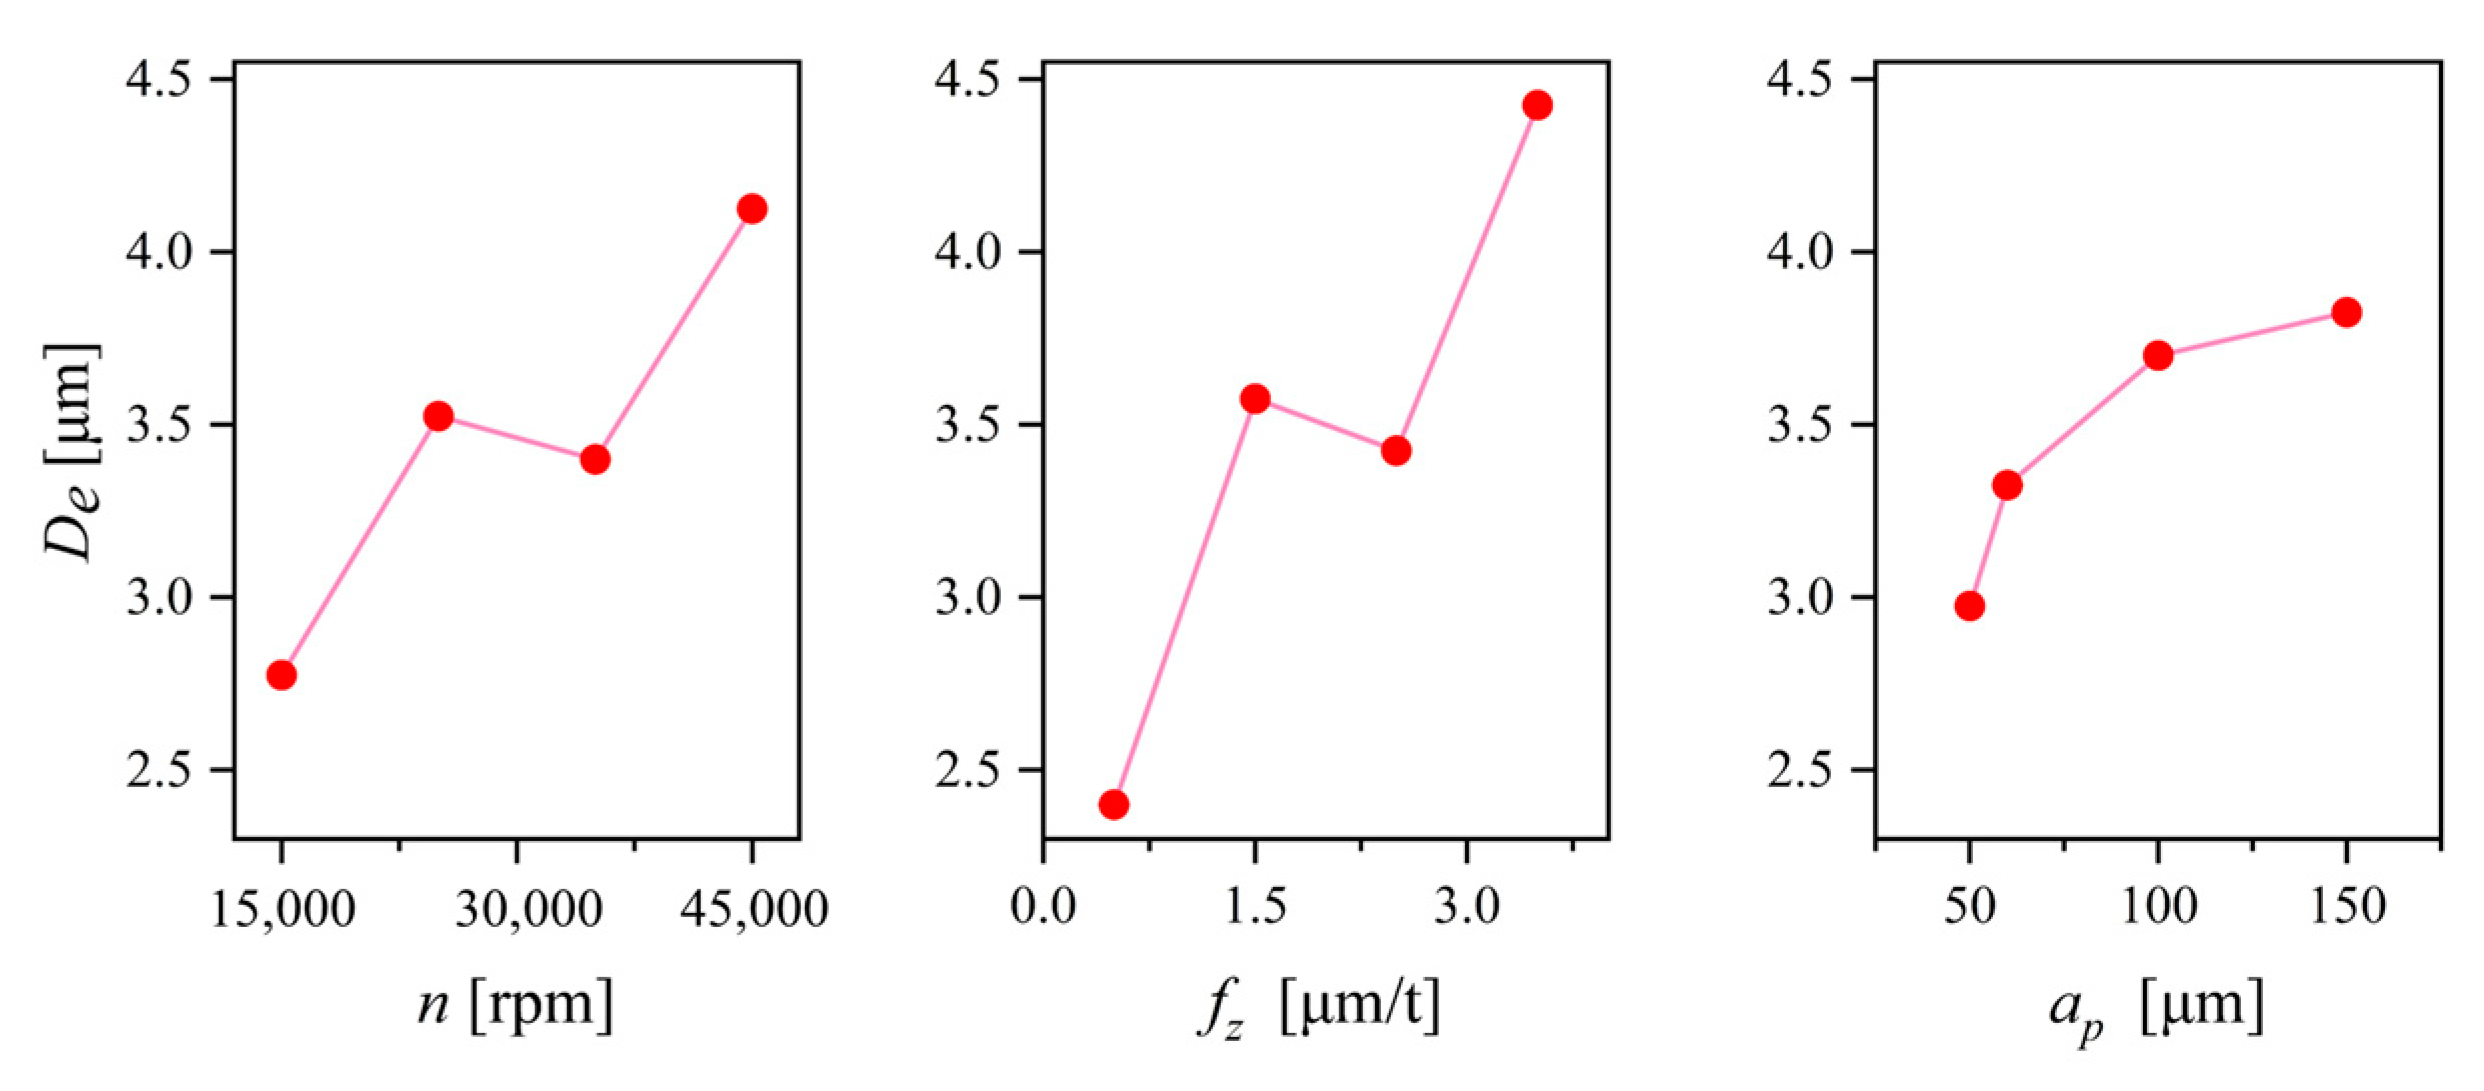
Among the three indicators characterizing machining quality, surface roughness and surface fractal dimension exhibited a significant negative correlation (with a correlation coefficient of −0.832). However, their correlations with dimensional error were relatively small, being 0.57 and −0.628, respectively. After performing PCA, the variance extraction percentages for Sa, Ds, and De all exceeded 50%, indicating a good level of information condensation.
(4)
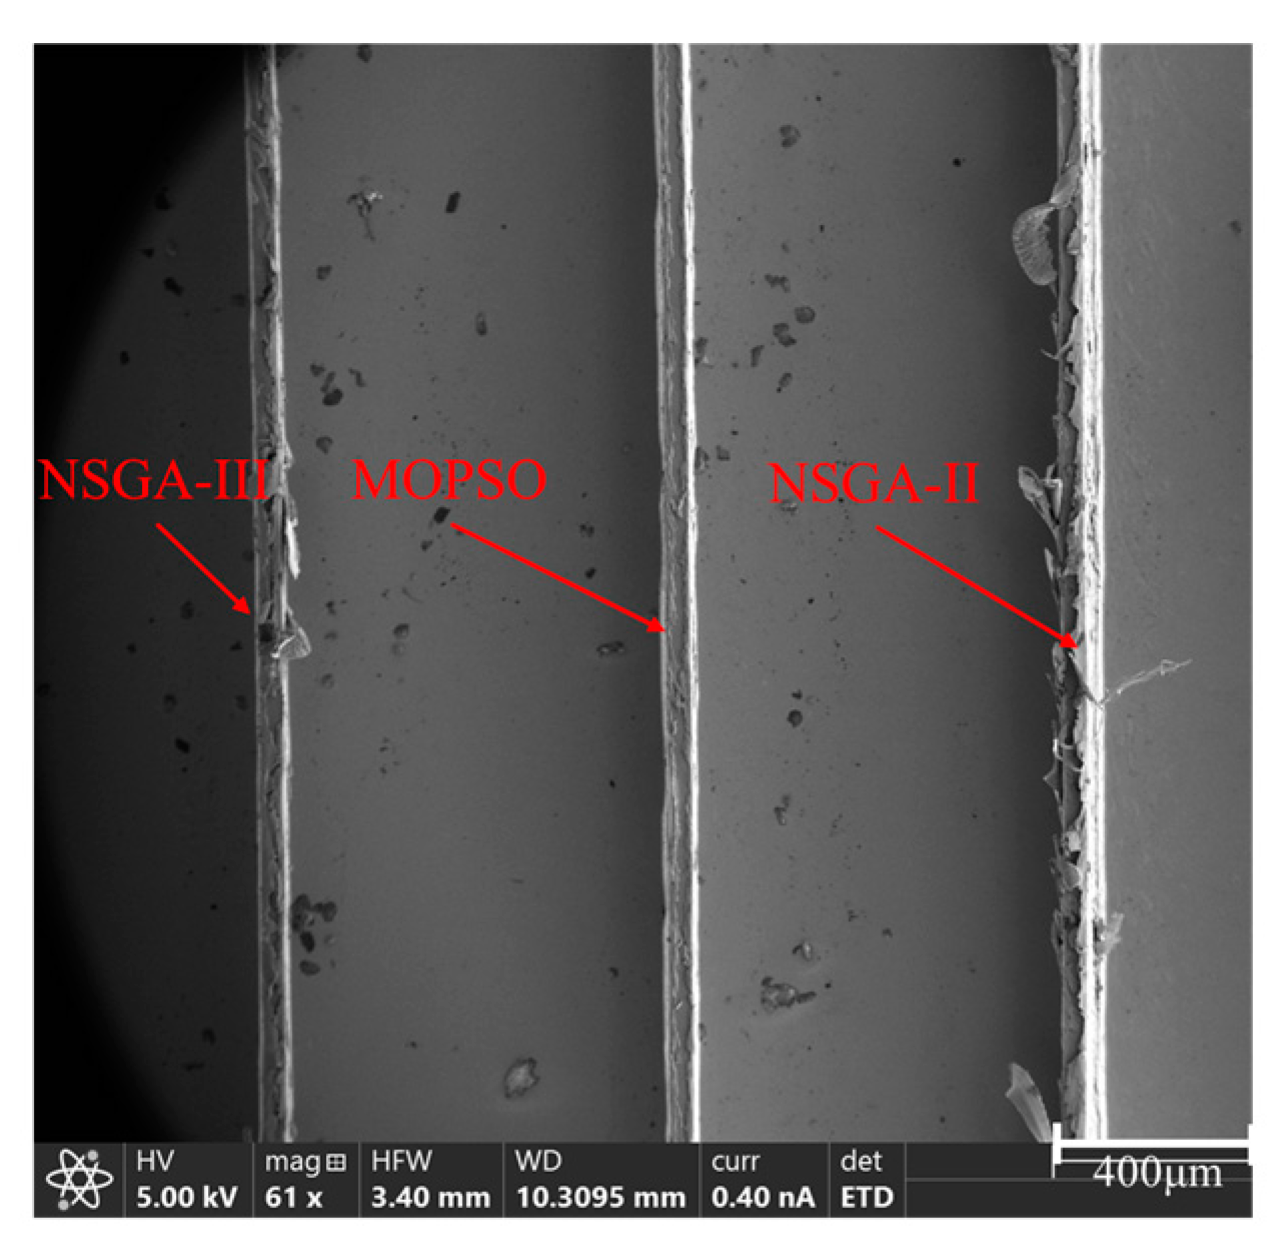
The optimization results of the process parameters demonstrate that the NSGA-III-based optimization method yields a better trade-off between machinability and sustainability, indicating that NSGA-III exhibits superior performance in handling multi-objective optimization problems and can obtain globally optimal parameters. The optimal combination of micro-milling parameters was n = 28,800 rpm, fz = 2.6 μm/t, and ap = 62 μm.

Author Contributions

Conceptualization, P.W. and Q.B.; methodology, P.W.; software, P.W.; validation, Q.B., K.C., L.Z. and Y.Z.; formal analysis, P.W.; investigation, P.W.; resources, Q.B.; data acquisition, P.W.; writing—original draft preparation, P.W.; writing—review and editing, Q.B. and K.C.; visualization, P.W.; supervision, Q.B. and K.C.; project administration, Q.B.; funding acquisition, Q.B. All authors have read and agreed to the published version of the manuscript.

Funding

This research work was supported by the National Natural Science Foundation of China (grant no. 52075129).

Institutional Review Board Statement

Not applicable.

Informed Consent Statement

Not applicable.

Data Availability Statement

The datasets used or analyzed during the current study are available from the corresponding author upon reasonable request.

Conflicts of Interest

The authors declare no conflict of interest.

References

  1. Shang, Z.; Gao, D.; Jiang, Z.; Lu, Y. Towards less energy intensive heavy-duty machine tools: Power consumption characteristics and energy-saving strategies. Energy 2019, 178, 263–274. [Google Scholar] [CrossRef]
  2. Li, C.; Li, L.; Tang, Y.; Zhu, Y.; Li, L. A comprehensive approach to parameters optimization of energy-aware CNC milling. J. Intell. Manuf. 2019, 30, 123–138. [Google Scholar] [CrossRef]
  3. Hu, L.; Tang, R.; Cai, W.; Feng, Y.; Ma, X. Optimisation of cutting parameters for improving energy efficiency in machining process. Robot. Comp. Int. Manuf. 2019, 59, 406–416. [Google Scholar] [CrossRef]
  4. Feng, C.; Chen, X.; Zhang, J.; Huang, Y.; Qu, Z. Minimizing the energy consumption of hole machining integrating the optimization of tool path and cutting parameters on CNC machines. Int. J. Adv. Manuf. Technol. 2022, 121, 215–228. [Google Scholar] [CrossRef]
  5. Yan, J.; Li, L. Multi-objective optimization of milling parameters—The trade-offs between energy, production rate and cutting quality. J. Clean. Prod. 2013, 52, 462–471. [Google Scholar] [CrossRef]
  6. Zhang, X.; Yu, T.; Dai, Y.; Qu, S.; Zhao, J. Energy consumption considering tool wear and optimization of cutting parameters in micro milling process. Int. J Mech. Sci. 2020, 178, 105628. [Google Scholar] [CrossRef]
  7. Wang, W.; Tian, G.; Chen, M.; Tao, F.; Zhang, C.; AI-Ahmari, A.; Li, Z.; Jiang, Z. Dual-objective program and improved artificial bee colony for the optimization of energy-conscious milling parameters subject to multiple constraints. J. Clean. Prod. 2020, 245, 118714. [Google Scholar] [CrossRef]
  8. Zhong, Q.; Tang, R.; Peng, T. Decision rules for energy consumption minimization during material removal process in turning. J. Clean. Prod. 2017, 140, 1819–1827. [Google Scholar] [CrossRef]
  9. Li, L.; Yan, J.; Xing, Z. Energy requirements evaluation of milling machines based on thermal equilibrium and empirical modelling. J. Clean. Prod. 2013, 52, 113–121. [Google Scholar] [CrossRef]
  10. Velchev, S.; Kolev, I.; Ivanov, K.; Gechevski, S. Empirical models for specific energy consumption and optimization of cutting parameters for minimizing energy consumption during turning. J. Clean. Prod. 2014, 80, 139–149. [Google Scholar] [CrossRef]
  11. Gutowski, T.G.; Branham, M.S.; Dahmus, J.B.; Jones, A.J.; Thiriez, A. Thermodynamic analysis of resources used in manufacturing processes. Environ. Sci. Technol. 2009, 43, 1584–1590. [Google Scholar] [CrossRef] [PubMed]
  12. Jiang, Z.; Gao, D.; Lu, Y.; Liu, X. Optimization of Cutting Parameters for Trade-off Among Carbon Emissions, Surface Roughness, and Processing Time. Chin. J. Mech. Eng 2019, 32, 94. [Google Scholar] [CrossRef]
  13. Liu, Z.Y.; Sealy, M.P.; Guo, Y.B.; Liu, Z.Q. Energy Consumption Characteristics in Finish Hard Milling of Tool Steels. Procedia Manuf. 2015, 1, 477–486. [Google Scholar] [CrossRef]
  14. Deng, Z.; Zhang, H.; Fu, Y.; Wan, L.; Liu, W. Optimization of process parameters for minimum energy consumption based on cutting specific energy consumption. J. Clean. Prod. 2017, 166, 1407–1414. [Google Scholar] [CrossRef]
  15. Lv, J.; Tang, R.; Jia, S.; Liu, Y. Experimental study on energy consumption of computer numerical control machine tools. J. Clean. Prod. 2016, 122, 3864–3874. [Google Scholar] [CrossRef]
  16. Lv, L.; Deng, Z.; Yan, C.; Liu, T.; Wan, L.; Gu, Q. Modelling and analysis for processing energy consumption of mechanism and data integrated machine tool. Int. J. Prod. Res. 2020, 58, 7078–7093. [Google Scholar] [CrossRef]
  17. de Carvalho, H.M.B.; de Gomes Oliveira, J.; Schmidt, M.A.; Brandão, V.L.C. Vibration Analysis and Energy Efficiency in Interrupted Face Milling Processes. Procedia CIRP 2015, 29, 245–250. [Google Scholar] [CrossRef]
  18. Pervaiz, S.; Deiab, I.; Rashid, A.; Nicolescu, M. Prediction of energy consumption and environmental implications for turning operation using finite element analysis. Proc. Inst. Mech. Eng. Part B J. Eng. Manuf. 2015, 229, 1925–1932. [Google Scholar] [CrossRef]
  19. Shi, K.N.; Zhang, D.H.; Liu, N.; Wang, S.B.; Ren, J.X.; Wang, S.L. A novel energy consumption model for milling process considering tool wear progression. J. Clean. Prod. 2018, 184, 152–159. [Google Scholar] [CrossRef]
  20. Li, C.; Tang, Y.; Cui, L.; Li, P. A quantitative approach to analyze carbon emissions of CNC-based machining systems. J. Intell. Manuf. 2015, 26, 911–922. [Google Scholar] [CrossRef]
  21. Tian, C.; Zhou, G.; Lu, F.; Chen, Z.; Zou, L. An integrated multi-objective optimization approach to determine the optimal feature processing sequence and cutting parameters for carbon emissions savings of CNC machining. Int. J. Comput. Integr. Manuf. 2020, 33, 609–625. [Google Scholar] [CrossRef]
  22. Zhou, L.; Li, J.; Li, F.; Meng, Q.; Li, J.; Xu, X. Energy consumption model and energy efficiency of machine tools: A comprehensive literature review. J. Clean. Prod. 2016, 112, 3721–3734. [Google Scholar] [CrossRef]
  23. Jamil, M.; Zhao, W.; He, N.; Gupta, M.K.; Sarikaya, M.; Khan, A.M.; Sanjay, M.R.; Siengchin, S.; Pimenov, Y.D. Sustainable milling of Ti–6Al–4V: A trade-off between energy efficiency, carbon emissions and machining characteristics under MQL and cryogenic environment. J. Clean. Prod. 2021, 281, 125374. [Google Scholar] [CrossRef]
  24. Singh, R.; Dureja, J.S.; Dogra, M.; Gupta, M.K.; Jamil, M.; Mia, M. Evaluating the sustainability pillars of energy and environment considering carbon emissions under machining ofTi-3Al-2.5 V. Sustain. Energy Technol. Assess. 2020, 42, 100806. [Google Scholar] [CrossRef]
  25. Turhan, M.H.; Tseng, G.W.G.; Erkorkmaz, K.; Fidan, B. Dynamic model identification for CNC machine tool feed drives from in-process signals for virtual process planning. Mechatronics 2020, 72, 102445. [Google Scholar] [CrossRef]
  26. Zheng, W.; Zhou, M.; Zhou, L. Influence of process parameters on surface topography in ultrasonic vibration- assisted end grinding of SiCp/Al composites. Int. J. Adv. Manuf. Technol. 2017, 91, 2347–2358. [Google Scholar] [CrossRef]
  27. Liu, J. Research on Material Removal and Parameter Optimization in Micro Milling SICp/AL Composites. Ph.D. Thesis, Harbin Institute of Technology, Harbin, China, 2018; pp. 75–77. (In Chinese). [Google Scholar]
  28. Chaudhari, P.; Thakur, K.A.; Kumar, R.; Banerjee, N.; Kumar, A. Comparison of NSGA-III with NSGA-II for multi objective optimization of adiabatic styrene reactor. Mater. Today Proc. 2022, 57, 1509–1514. [Google Scholar] [CrossRef]
  29. Tavana, M.; Li, Z.; Mobin, M.; Komaki, M.; Teymourian, E. Multi-objective control chart design optimization using NSGA-III and MOPSO enhanced with DEA and TOPSIS. Expert Syst. Appl. 2016, 50, 17–39. [Google Scholar] [CrossRef]
  30. Selvakumar, S.; Arulshri, K.P.; Padmanaban, K.P.; Sasikumar, K.S.K. Design and optimization of machining fixture layout using ANN and DOE. Int. J. Adv. Manuf. Technol. 2013, 65, 1573–1586. [Google Scholar] [CrossRef]
  31. Wang, P.; Bai, Q.; Cheng, K.; Zhao, L.; Ding, H.; Zhang, Y. Machinability analysis of micro-milling thin-walled Ti-6Al-4V micro parts under dry, lubrication, and chatter mitigation conditions. Proc. Inst. Mech. Eng. Part B J. Eng. Manuf. 2023, 1–12. [Google Scholar] [CrossRef]
Figure 1. Energy consumption boundary of Kern Evo micro-milling machine tool.
Applsci 13 09392 g001
Figure 2. Power spectrum of different machining states.
Applsci 13 09392 g002
Figure 3. Structural diagram of feed system.
Applsci 13 09392 g003
Figure 4. The power loss of drive motor.
Applsci 13 09392 g004
Figure 5. The multi-objective optimization problem description.
Applsci 13 09392 g005
Figure 6. Main dimensions of workpiece.
Applsci 13 09392 g006
Figure 7. Measurement of power consumption.
Applsci 13 09392 g007
Figure 8. Non-machining power at different feed speeds.
Applsci 13 09392 g008
Figure 9. Variation in non-machining power with feed speed.
Applsci 13 09392 g009
Figure 10. Non-machining power at different spindle speeds.
Applsci 13 09392 g010
Figure 11. Variation in non-machining power with spindle speed.
Applsci 13 09392 g011
Figure 12. Main effects of process parameters on variable power.
Applsci 13 09392 g012
Figure 13. Surface topographies of the machined surface.
Applsci 13 09392 g013
Figure 14. Main effects of process parameters on Sa.
Applsci 13 09392 g014
Figure 15. Main effects of process parameters on Ds.
Applsci 13 09392 g015
Figure 16. Main effects of process parameters on De.
Applsci 13 09392 g016
Figure 17. Main effects of process parameters on SCE.
Applsci 13 09392 g017
Figure 18. Correlation between MRR and SCE.
Applsci 13 09392 g018
Figure 19. Scree plot of PCA results.
Applsci 13 09392 g019
Figure 20. Dimensions of the thin-walled micro parts.
Applsci 13 09392 g020
Figure 21. Surface topographies of the thin-walled micro parts: (a) NSGA-II; (b) MOPSO; and (c) NSGA-III.
Applsci 13 09392 g021
Table 1. Process parameters for non-machining power measurement.
f (mm/min)n (rpm)ap (μm)
20, 120, 220, 320, and 42000
010,000, 15,000, 20,000, 25,000, 30,000, 35,000, 40,000, and 45,0000
Table 2. Machining parameters used in orthogonal experiments.
SymbolProcess ParametersUnitsLevel
1234
ASpindle speed (n)r/min15,00025,00035,00045,000
BAxial depth of cut (ap)μm5060100150
CFeed per tooth (fz)μm/tooth0.51.52.53.5
Table 3. Machining parameters and machining responses of the orthogonal experiments.
No.SymbolSa
(nm)
De
(μm)
DsSCE
(kJ/mm3)
MRR
(mm3/min)
Level
ABC
1A1B1C1451.32.511015.940.6015,000500.5
2A1B2C2562.82.46204.502.1615,000601.5
3A1B3C3602.92.44681.676.0015,0001002.5
4A1B4C41434.12.41080.8212.6015,0001503.5
5A2B1C2483.22.496015.501.2020,000600.5
6A2B2C1542.22.47306.153.0020,000501.5
7A2B3C41854.32.36631.2815.0020,0001502.5
8A2B4C31214.42.39031.3814.0020,0001003.5
9A3B1C3572.82.456510.272.8025,0001000.5
10A3B2C41334.62.44782.3112.6025,0001501.5
11A3B3C1582.72.45004.157.0025,000502.5
12A3B4C2993.52.43462.4911.7625,000603.5
13A4B1C4602.32.44418.225.4030,0001500.5
14A4B2C3854.72.43464.0910.8030,0001001.5
15A4B3C2903.82.42914.1010.8030,000602.5
16A4B4C1665.72.43913.5212.6030,000503.5
Table 4. Non-machining power model prediction accuracy.
Feed UnitSpindle Unit
R2R2-preR2-adjR2R2-preR2-adj
99.21%94.42%98.43%99.92%99.82%98.89%
Table 5. Values of different power components in orthogonal experiments.
No.Ptatal (W)Pb (W)Ps (W)Pf (W)Pm (W)
(Measured)(Measured)(Calculated)(Calculated)(Calculated)
1645.44861271.933.5
2648.1 2.136.0
3653.3 2.440.9
4659.3 2.746.6
5793.92712.436.5
6795.7 2.034.7
7802.5 3.844.7
8806.9 3.046.9
9965.24403.835.4
10969.0 5.439.6
11970.7 2.142.6
12976.2 2.745.5
131221.46927.440.0
141202.3 4. 938.7
151224.0 3.142.9
161228.5 2.146.4
Table 6. The goodness of fit of Pm.
R2R2-adjR2-preAICBIC
Exponential model0.85890.82360.7300−34.32−36.46
Polynomial model0.91850.86410.675589.5375.14
Table 7. Range analysis of Pvar.
n (rpm)fz (μm/t)ap (μm)
Rj572.98.76.2
Ranking123
Table 8. Goodness-of-fit of machining quality indices.
SaDsDe
R2R2-adjR2R2-adjR2R2-adj
77.71%72.14%81.27%76.59%67.47%59.33%
Table 9. Correlations between the optimization objectives.
SaDsDe
Sa1−0.8320.579
Ds−0.8321−0.628
De0.579−0.6281
Table 10. KMO and Bartlett’s tests.
Sampling Adequacy KMO Measure0.681
Bartlett’s test of sphericityApproximate chi-square22.351
df3
Sig.0.000
Table 11. Common factor variance.
Initial VarianceExtracted Variance
Sa1.0000.834
Ds1.0000.867
De1.0000.665
Table 12. Explained total variance.
No.Initial EigenvalueExtract Loading Sum of Squares
EigenvalueInitial
Variance %
Cumulative
Variance %
EigenvalueInitial
Variance %
Cumulative
Variance %
12.36678.85178.8512.36678.85178.851
20.47015.65494.505
30.1655.495100.000
Table 13. Factor loading matrix.
SaDsDe
0.386−0.3940.345
Table 14. Optimization results.
nfzapSaDsDe MRR SCE
NSGA-II17,7603.398652.48603.59.370.960
MOPSO21,0003.288592.49803.69.461.110
NSGA-III28,8002.662502.50102.09.361.126
Disclaimer/Publisher’s Note: The statements, opinions and data contained in all publications are solely those of the individual author(s) and contributor(s) and not of MDPI and/or the editor(s). MDPI and/or the editor(s) disclaim responsibility for any injury to people or property resulting from any ideas, methods, instructions or products referred to in the content.

