

Corrosion Damage Detection in Headrace Tunnel Using YOLOv7 with Continuous Wall Images


Abstract
:1. Introduction
2. Literature Review
3. Research Purpose
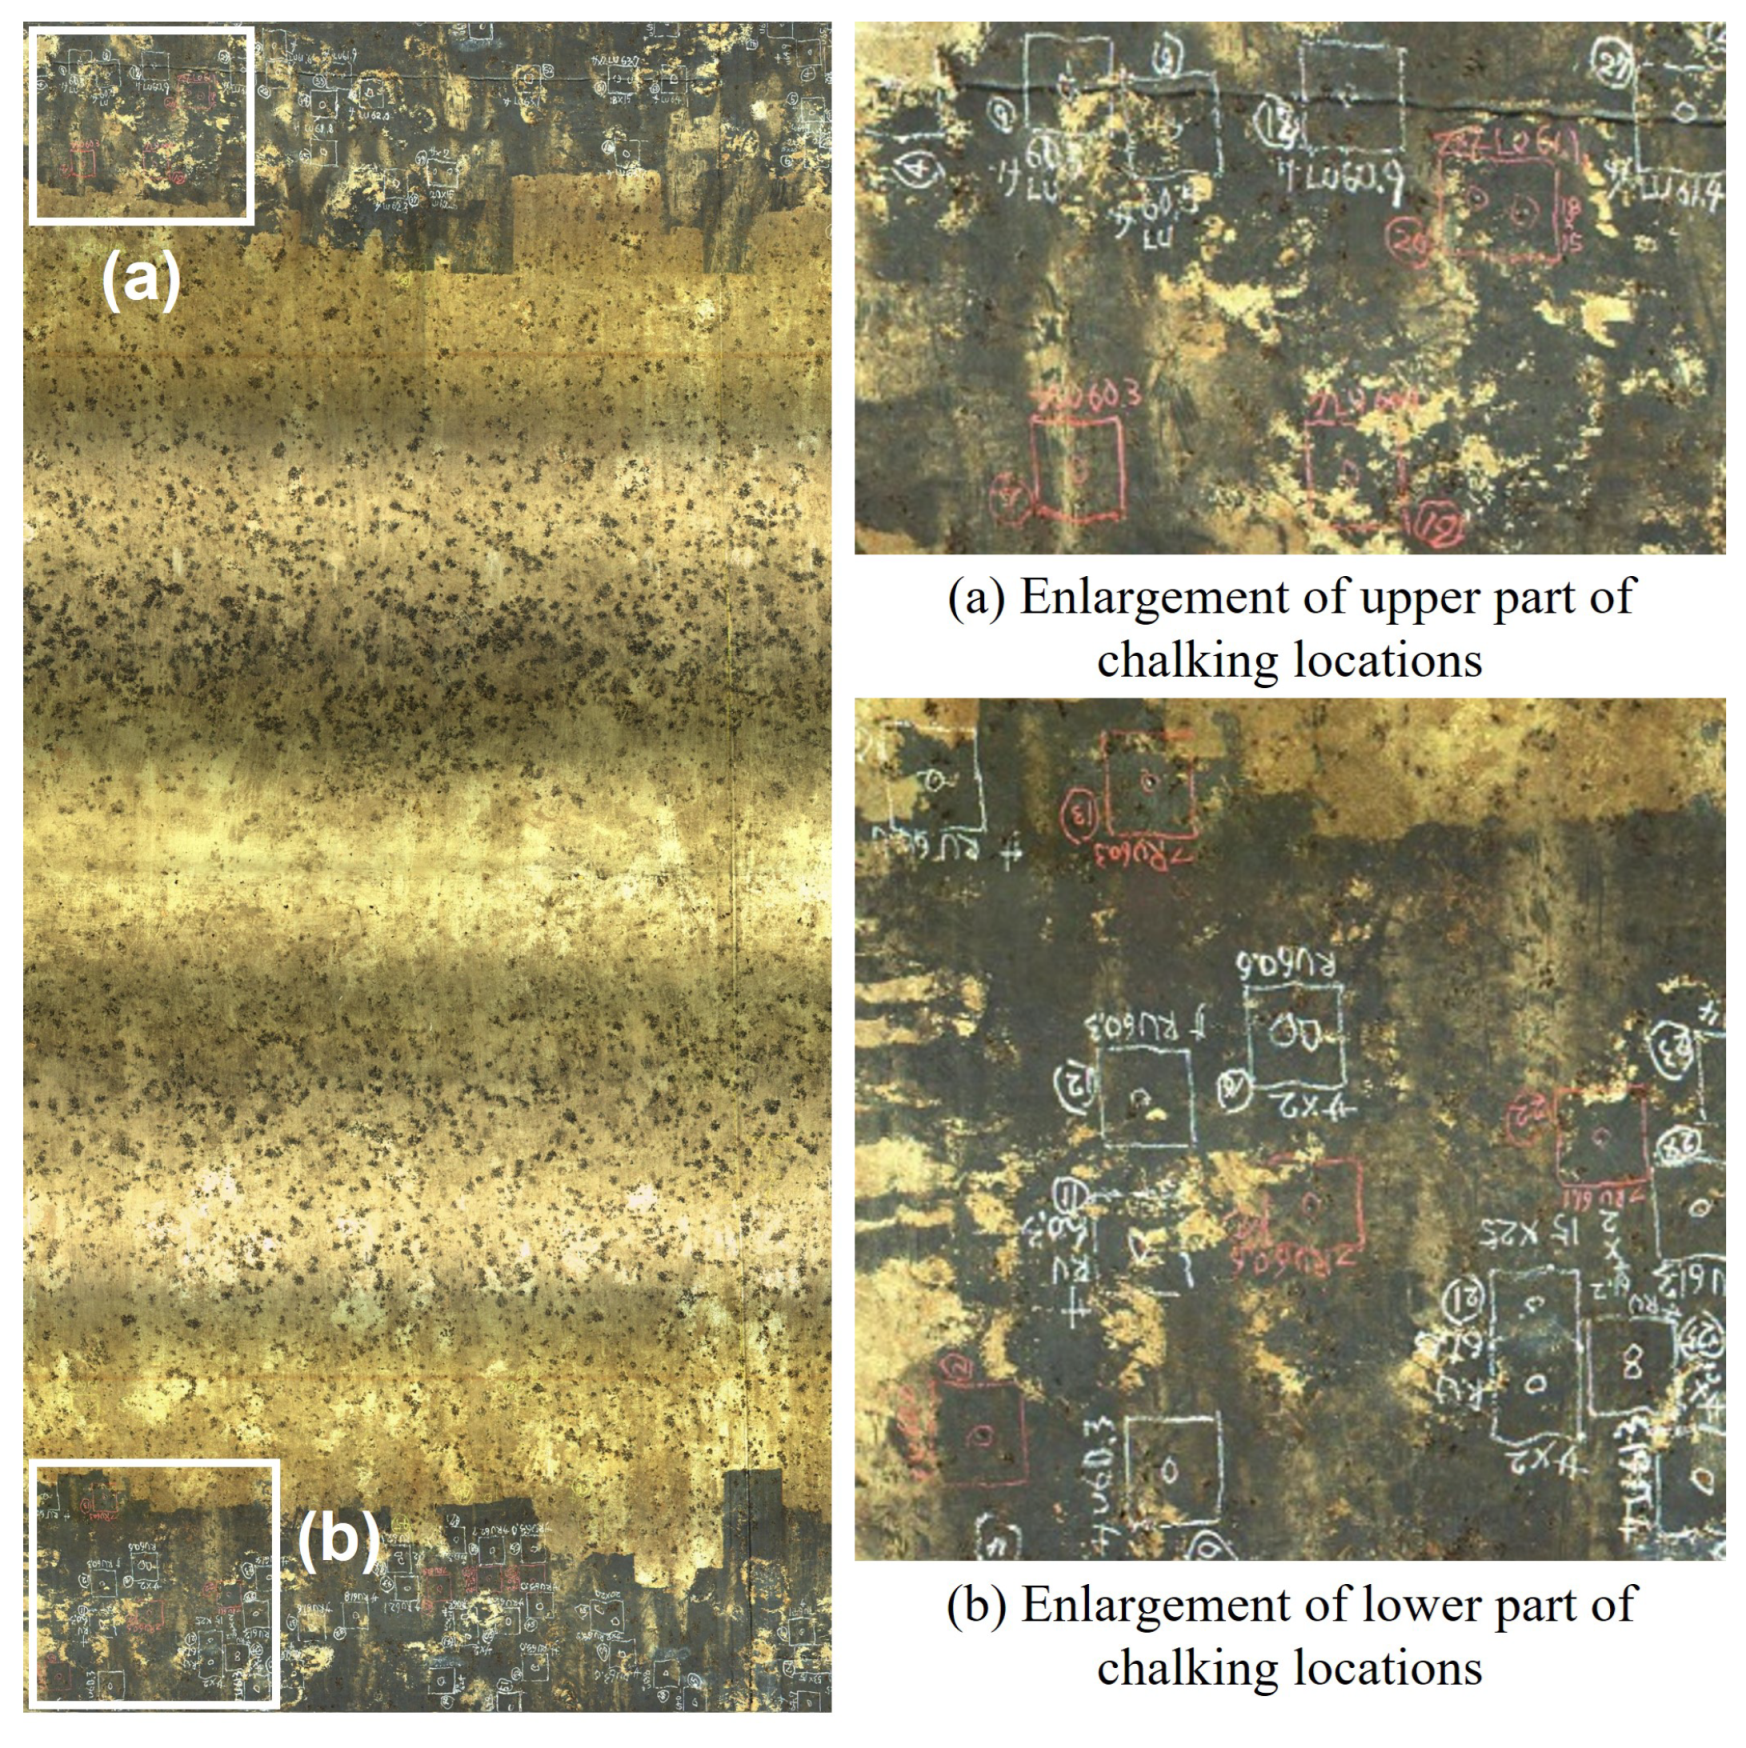
4. Detecting Chalking Position by Photographing and Analyzing Wall Surfaces
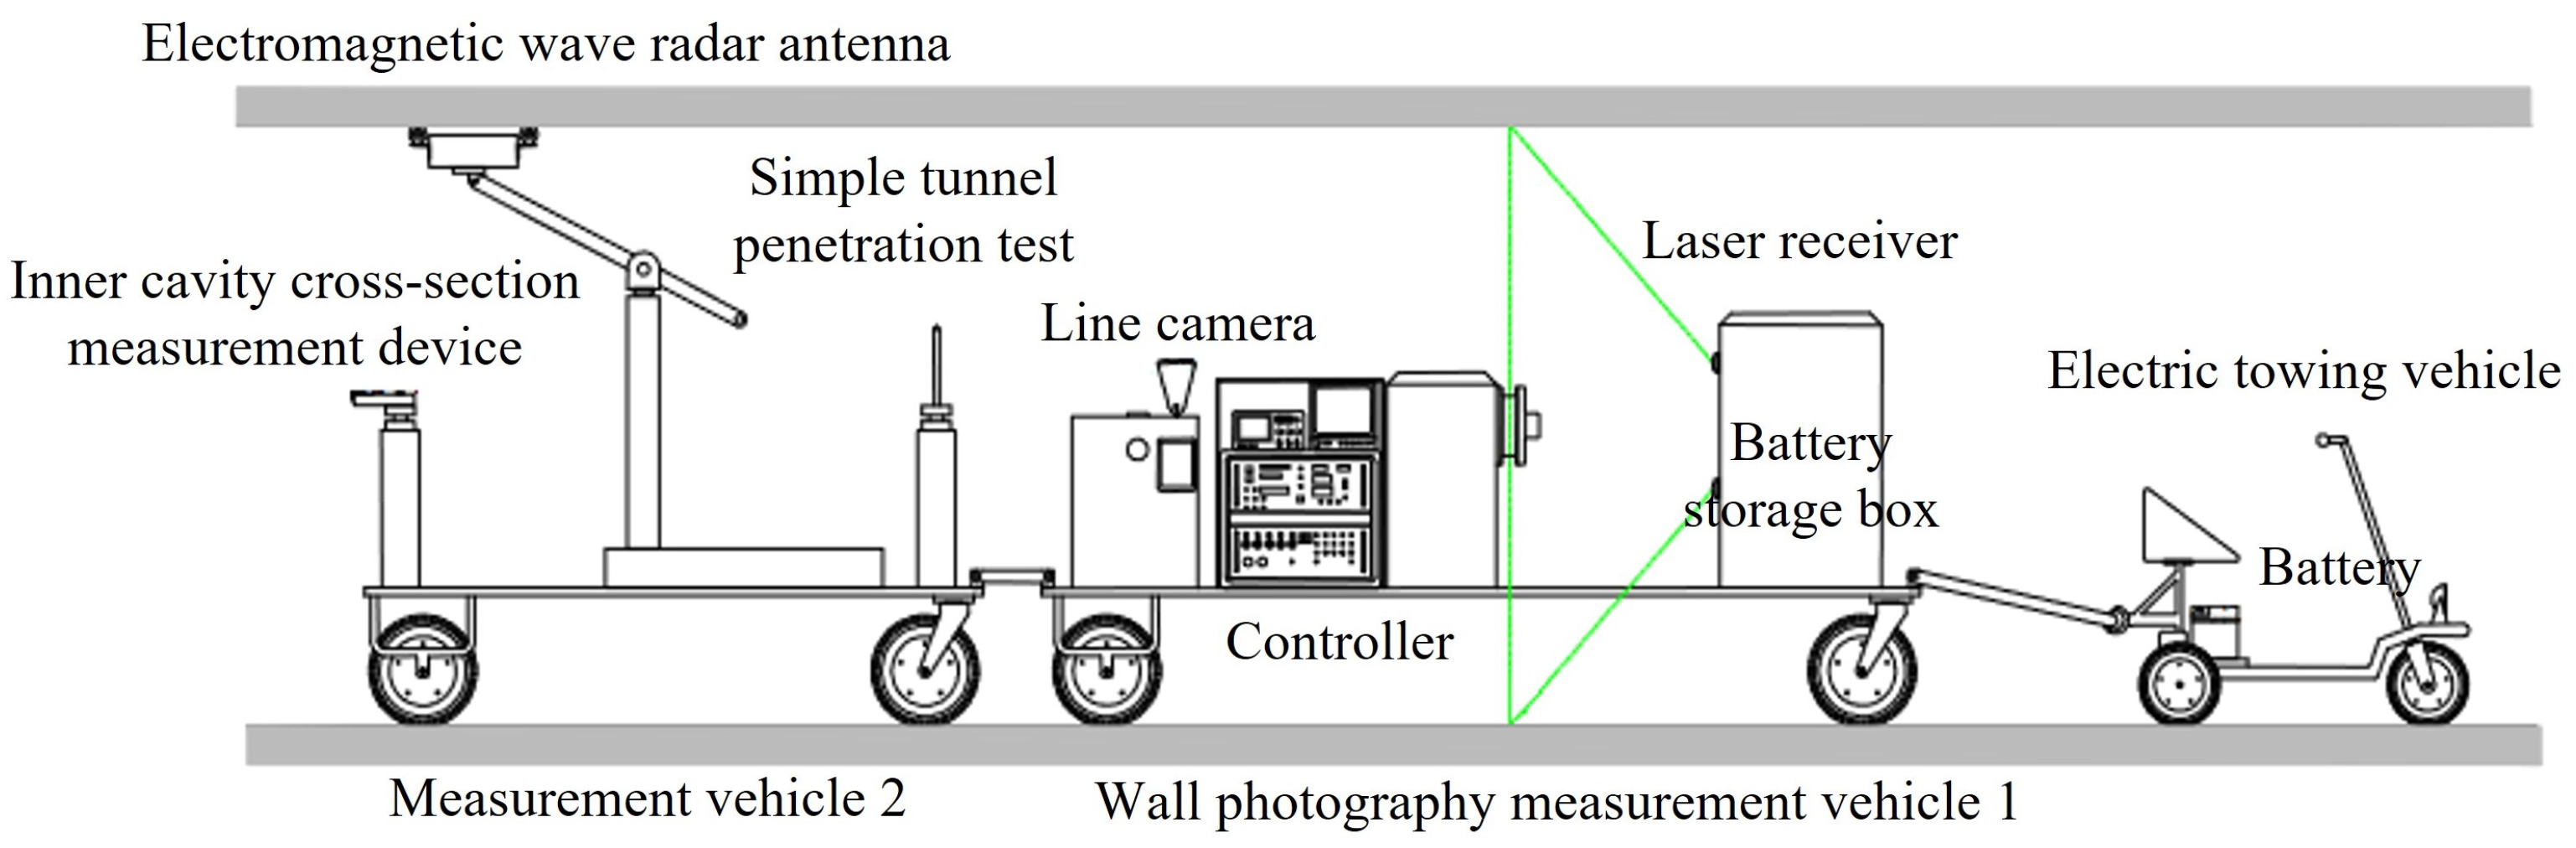
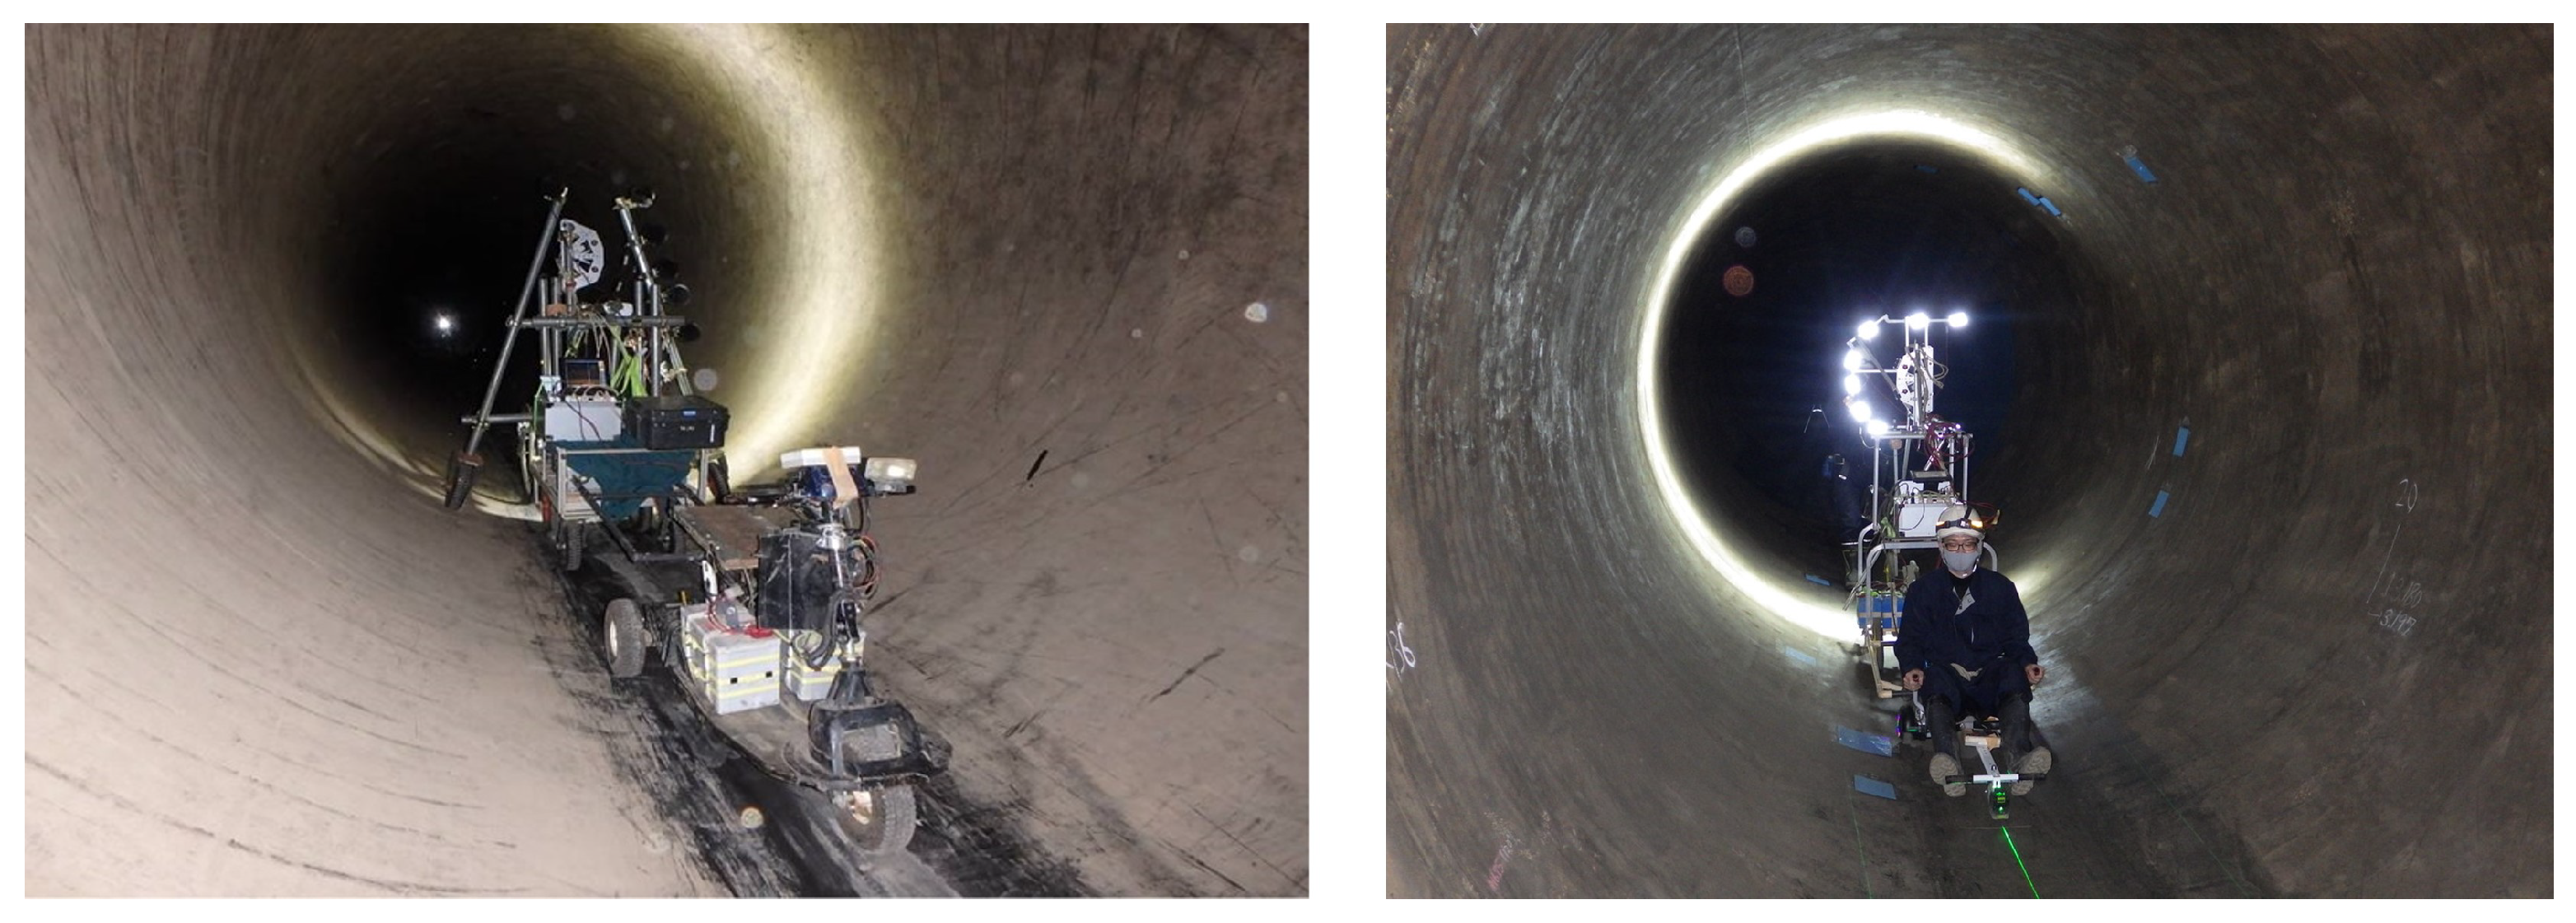
4.1. Development of Nondestructive Survey System Using CCD Line Camera for Capturing Continuous Wall Images
4.2. Chalking-Position Detection Model
4.2.1. Object Detection Using Deep Learning
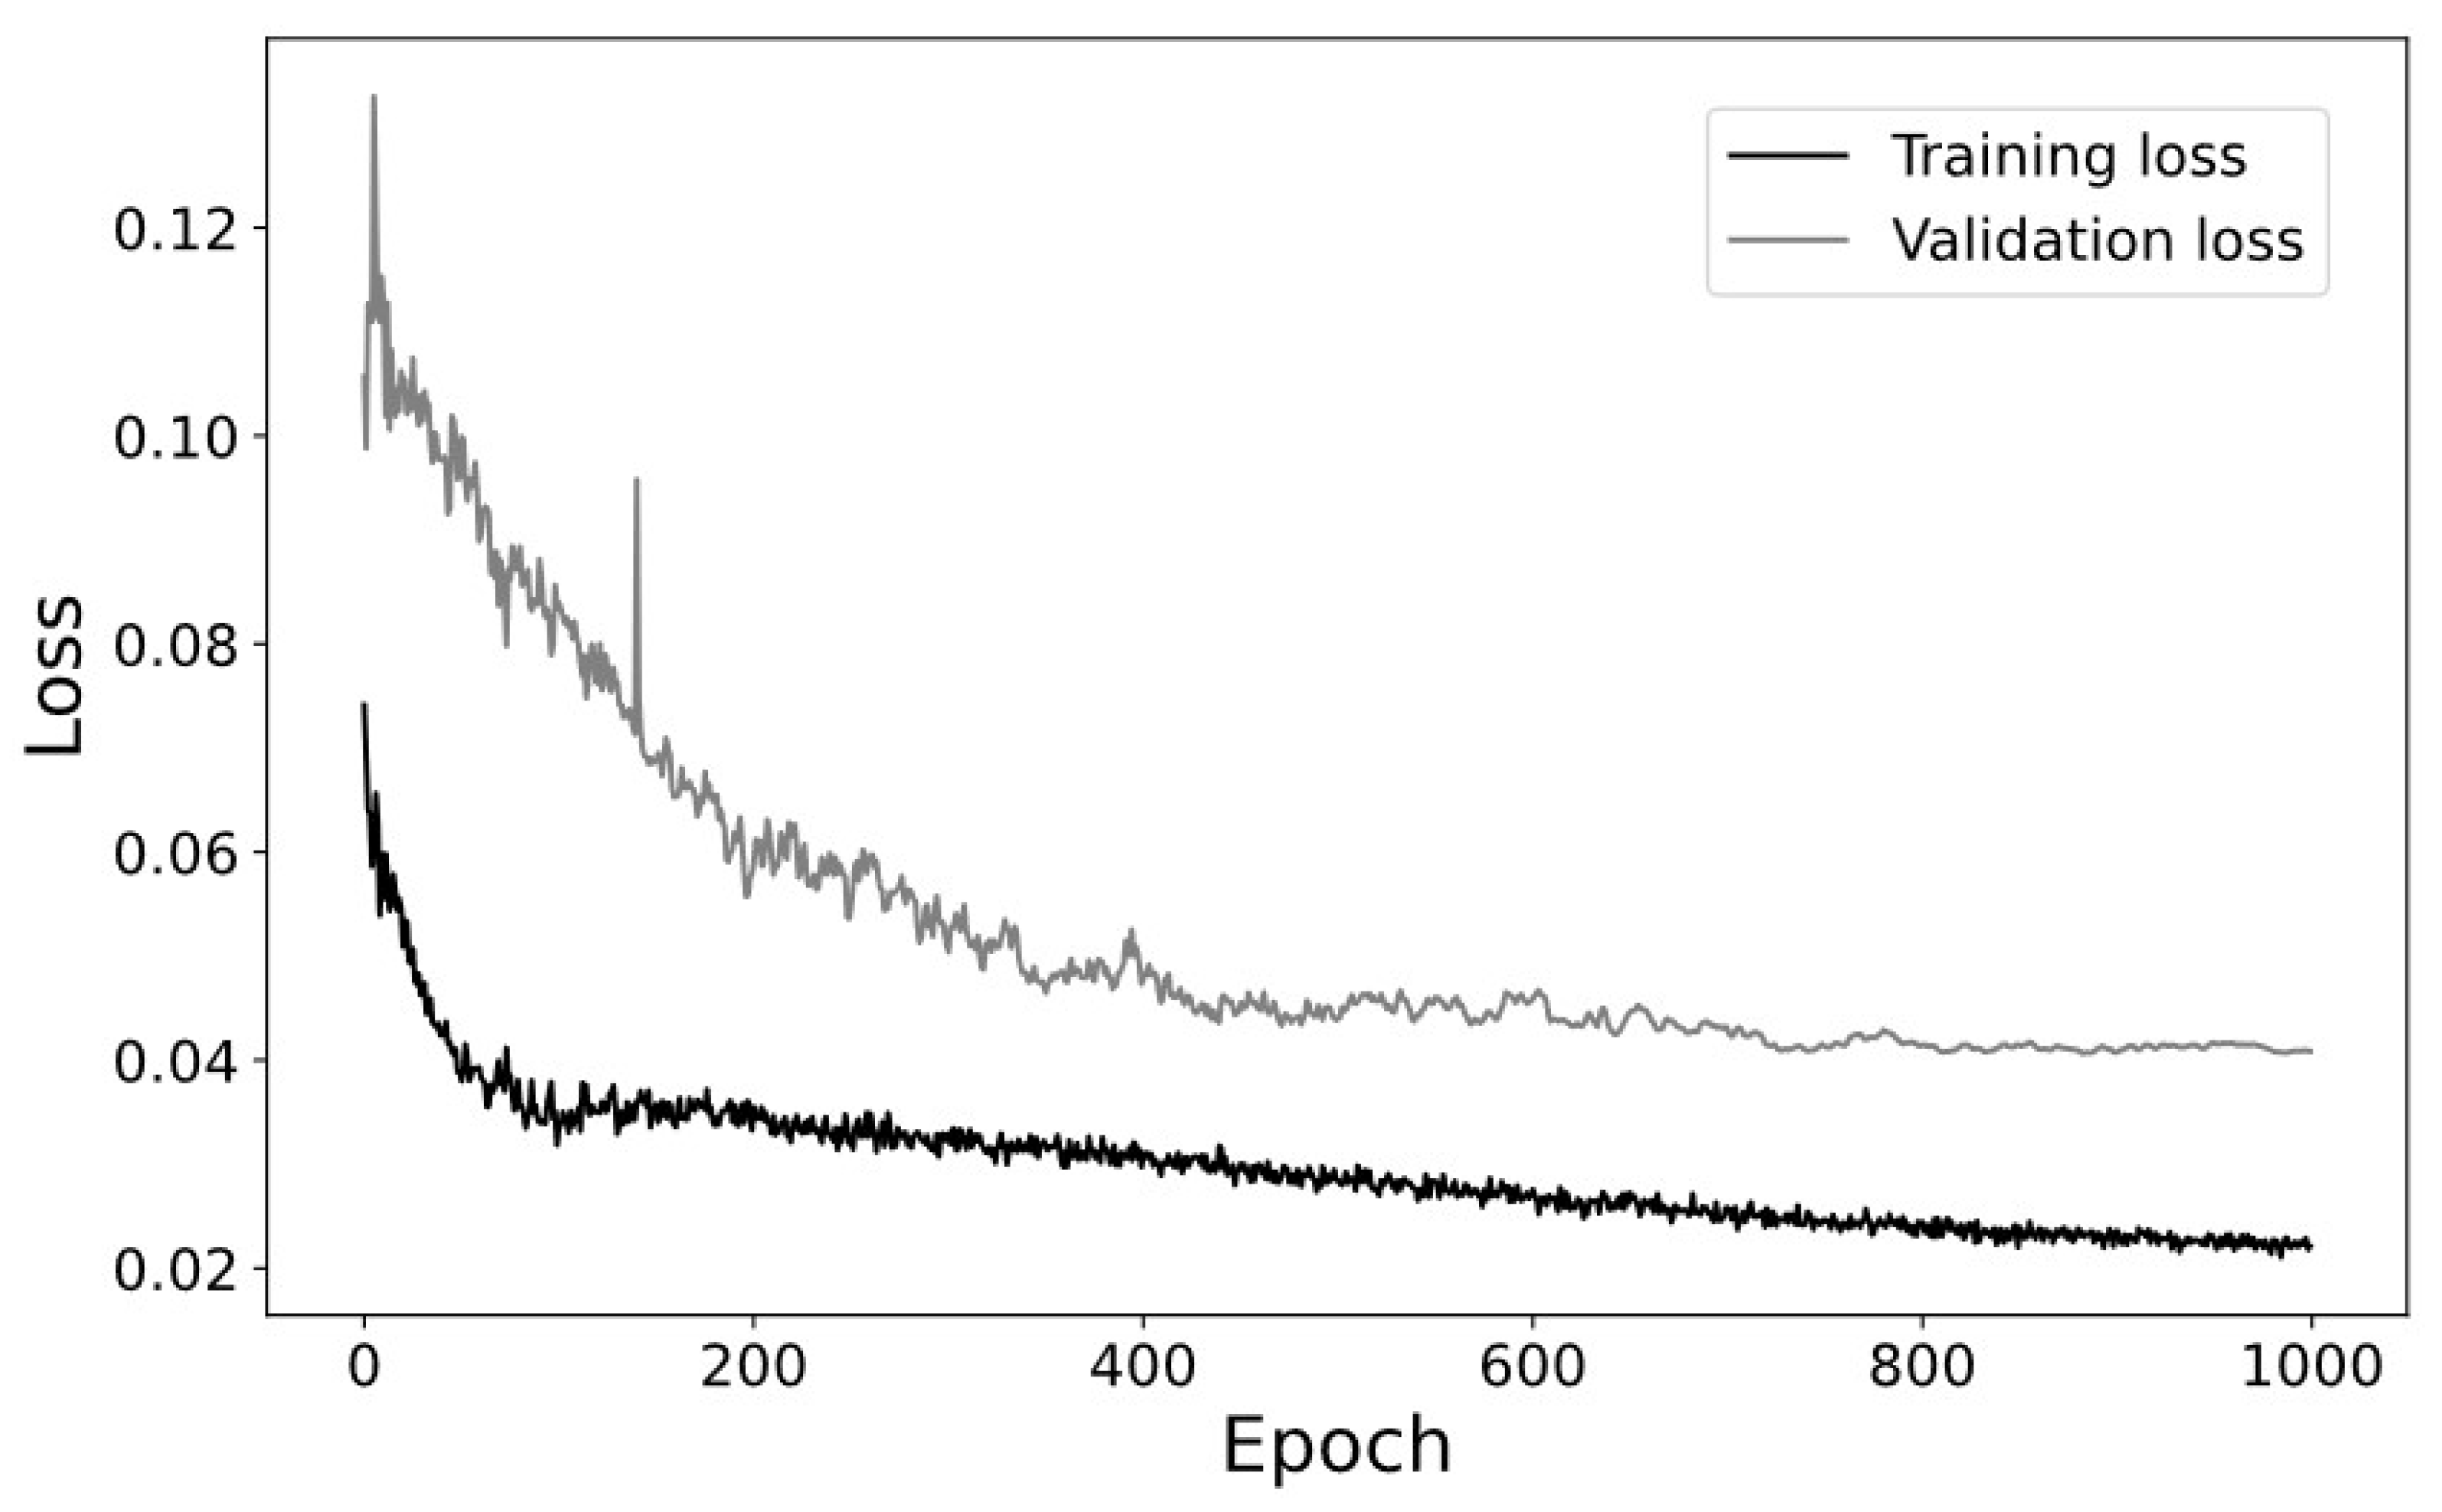
4.2.2. Training
4.2.3. Novelty and Effectiveness of Method
5. Demonstration Experiment and Position Identification in Actual Headrace Tunnel
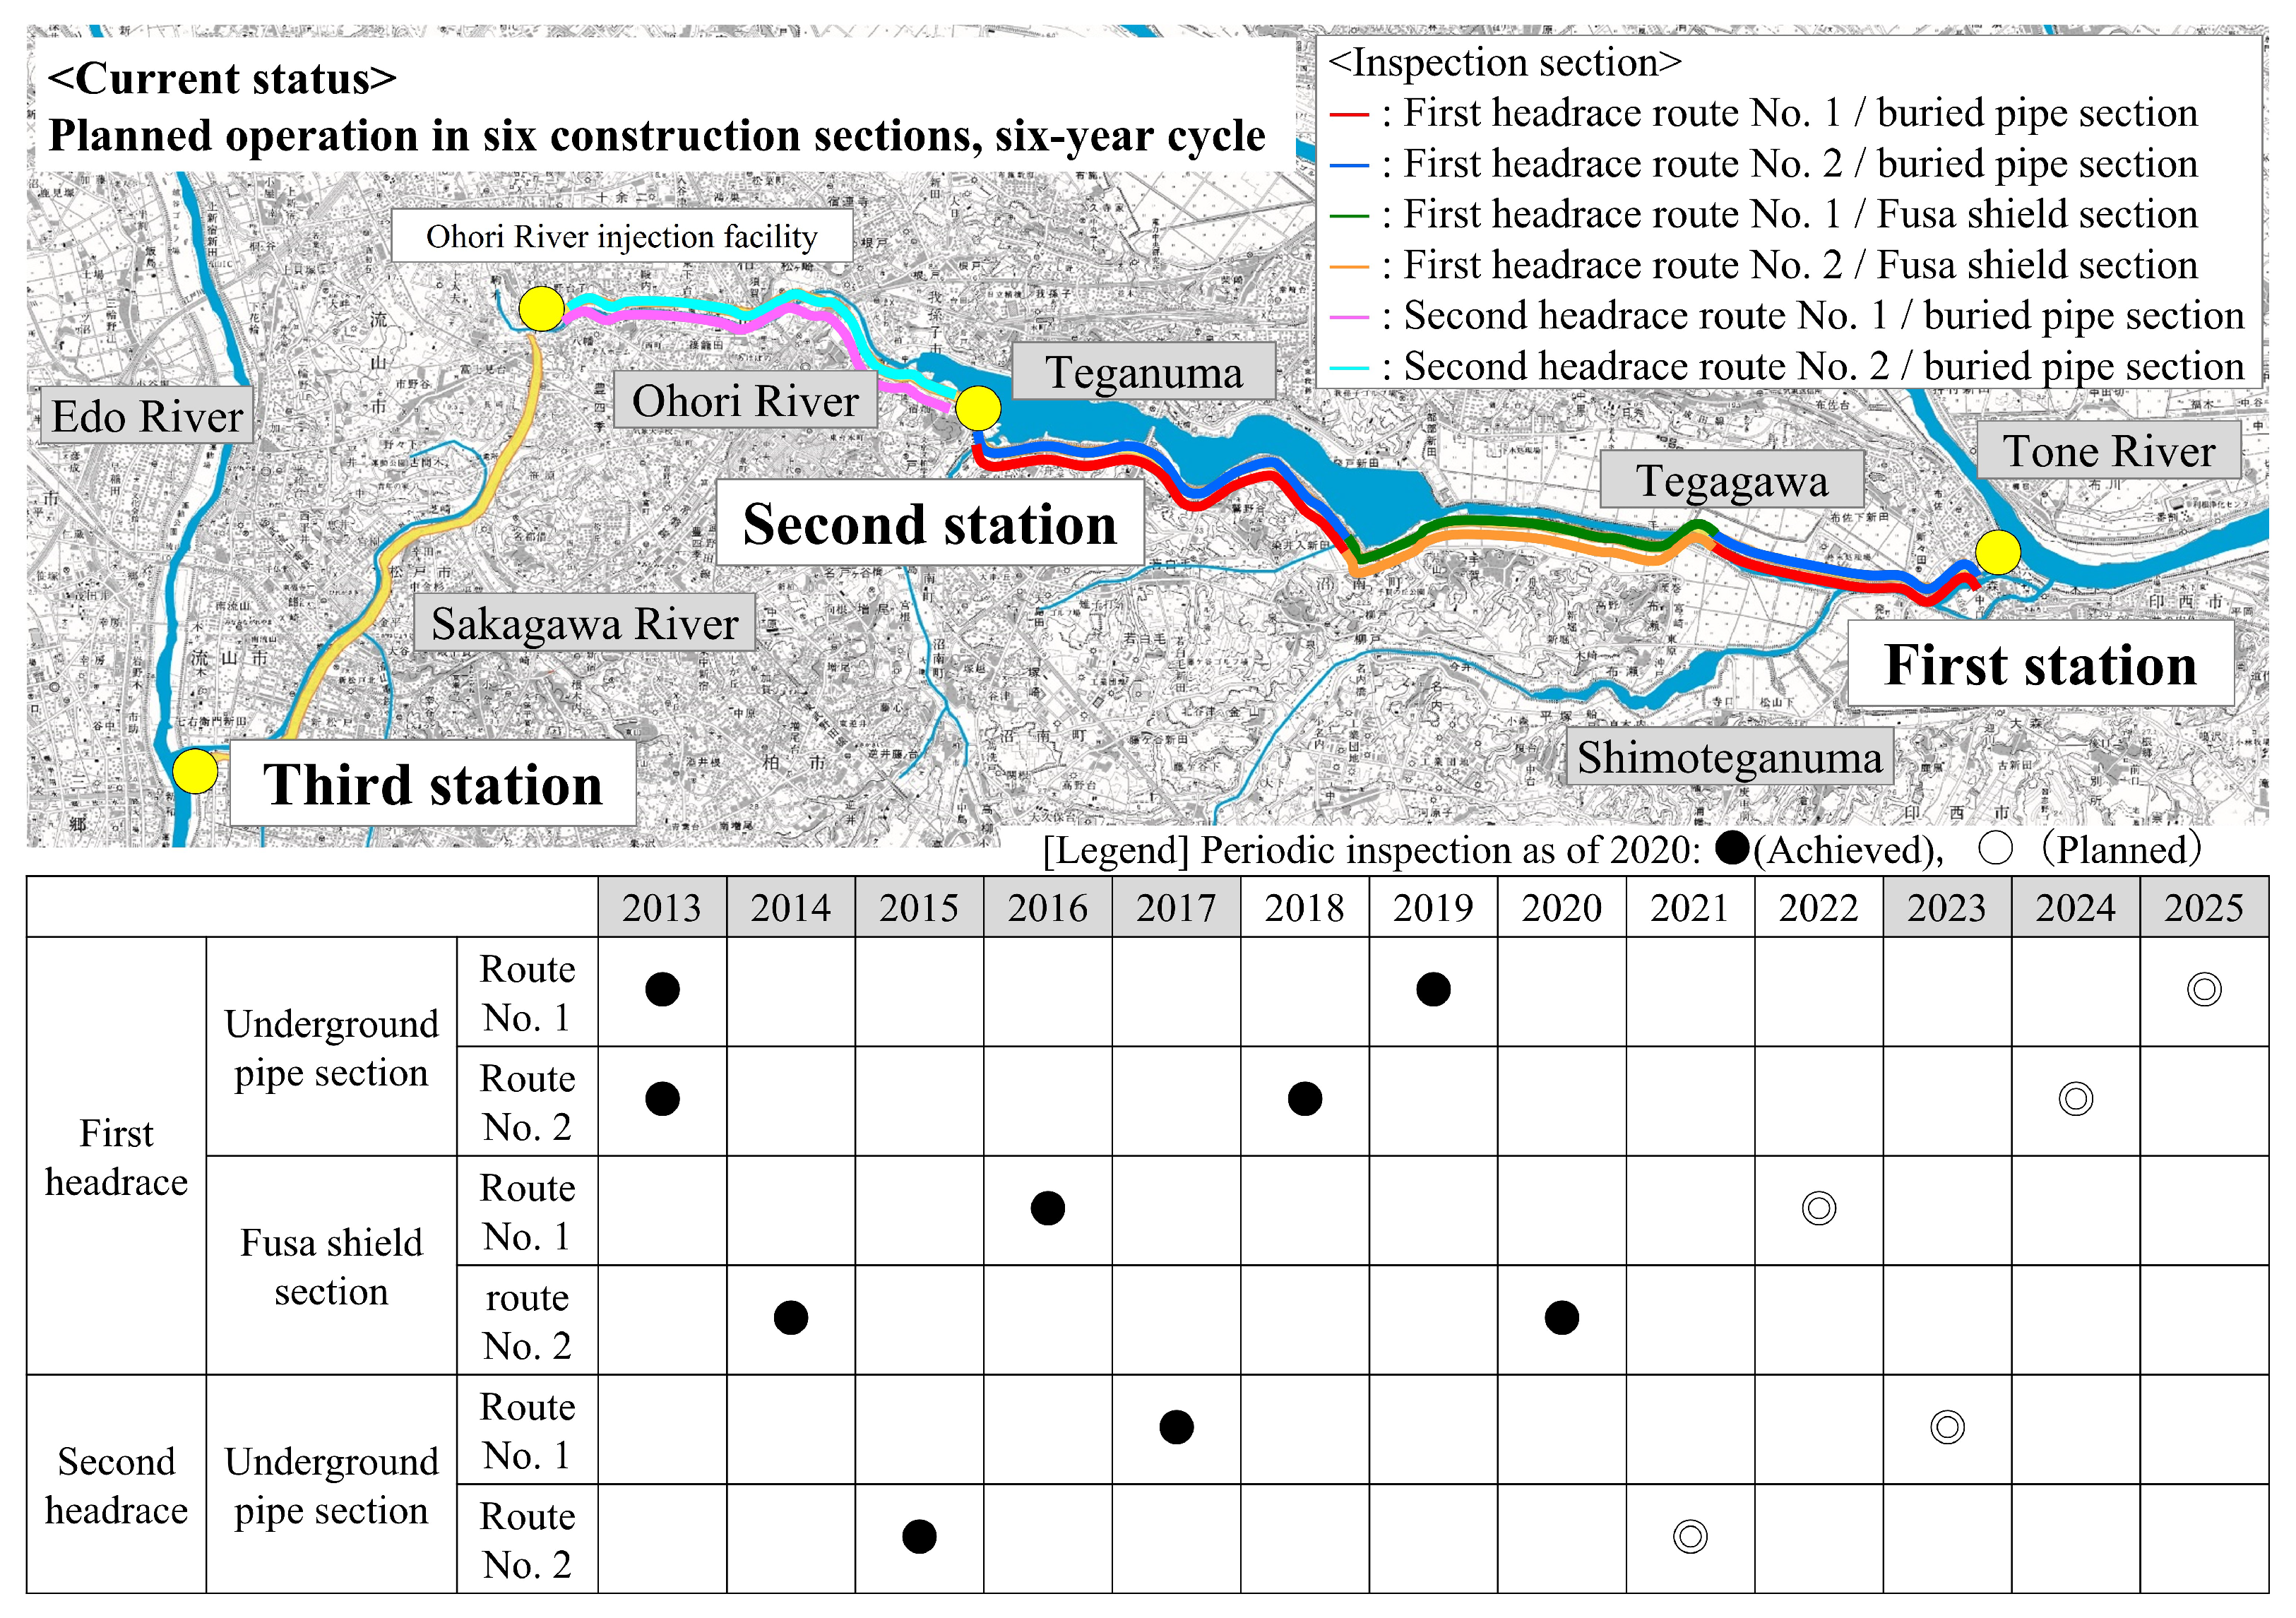
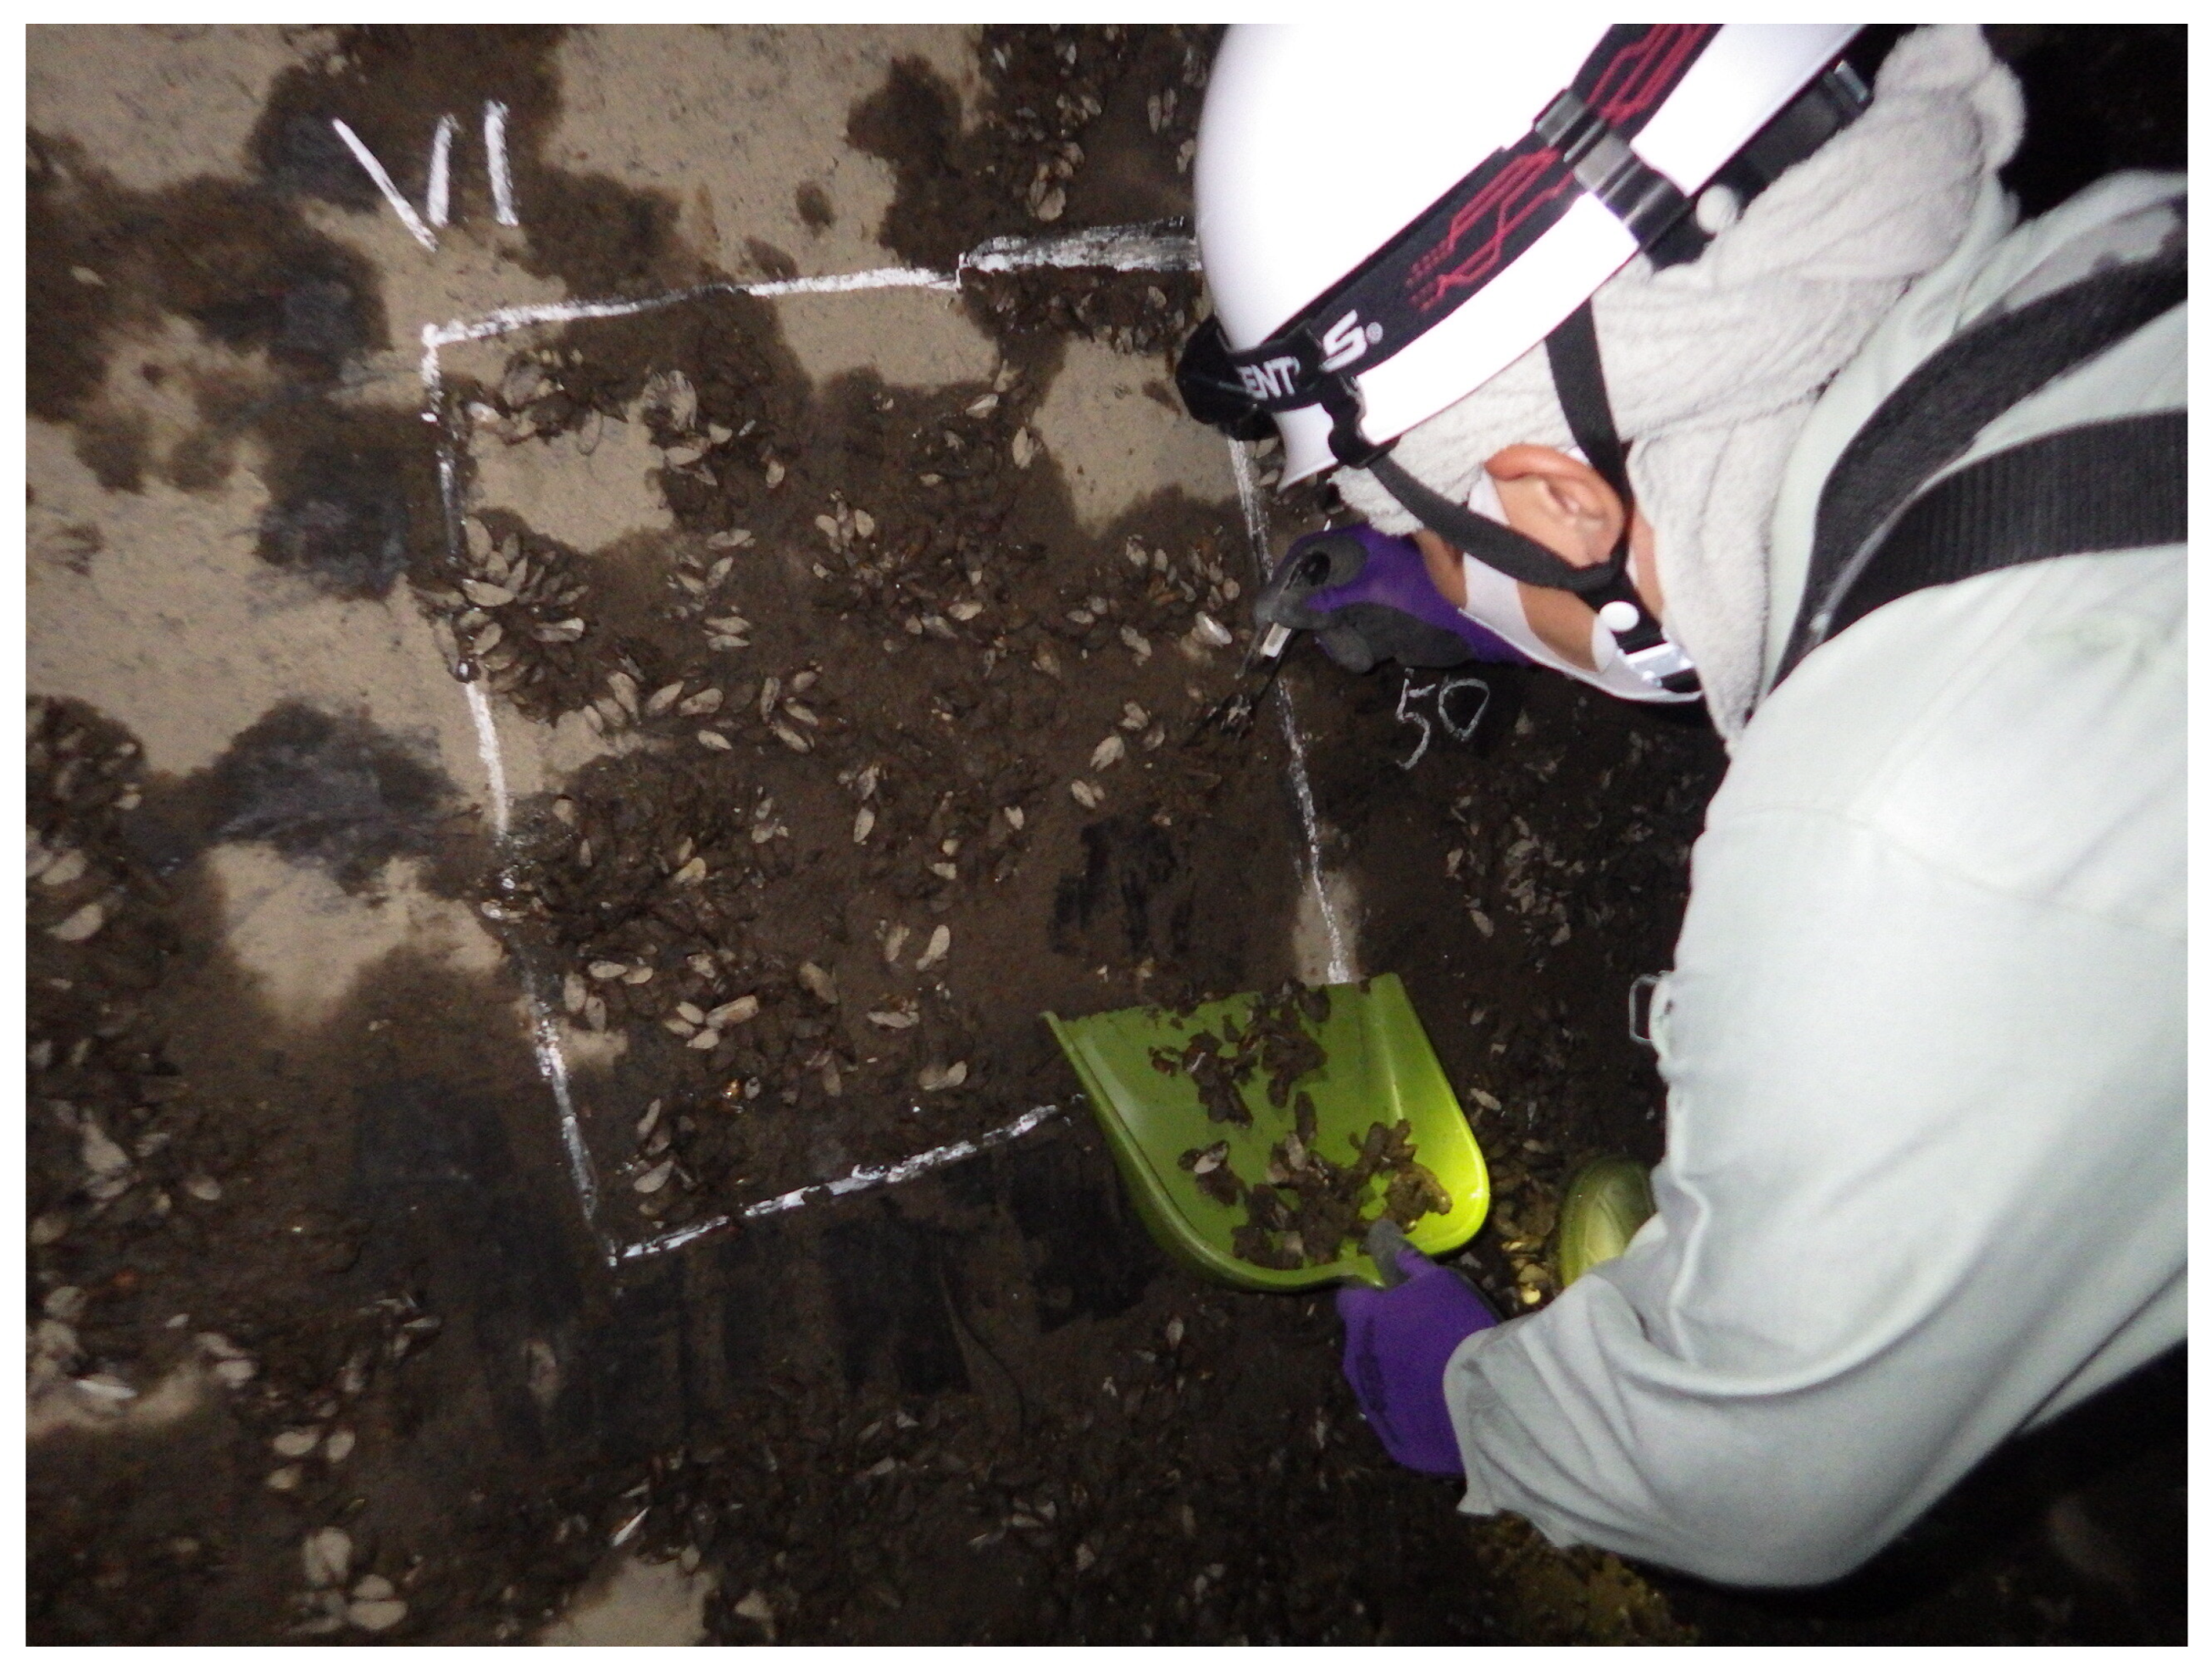
5.1. North Chiba Headrace
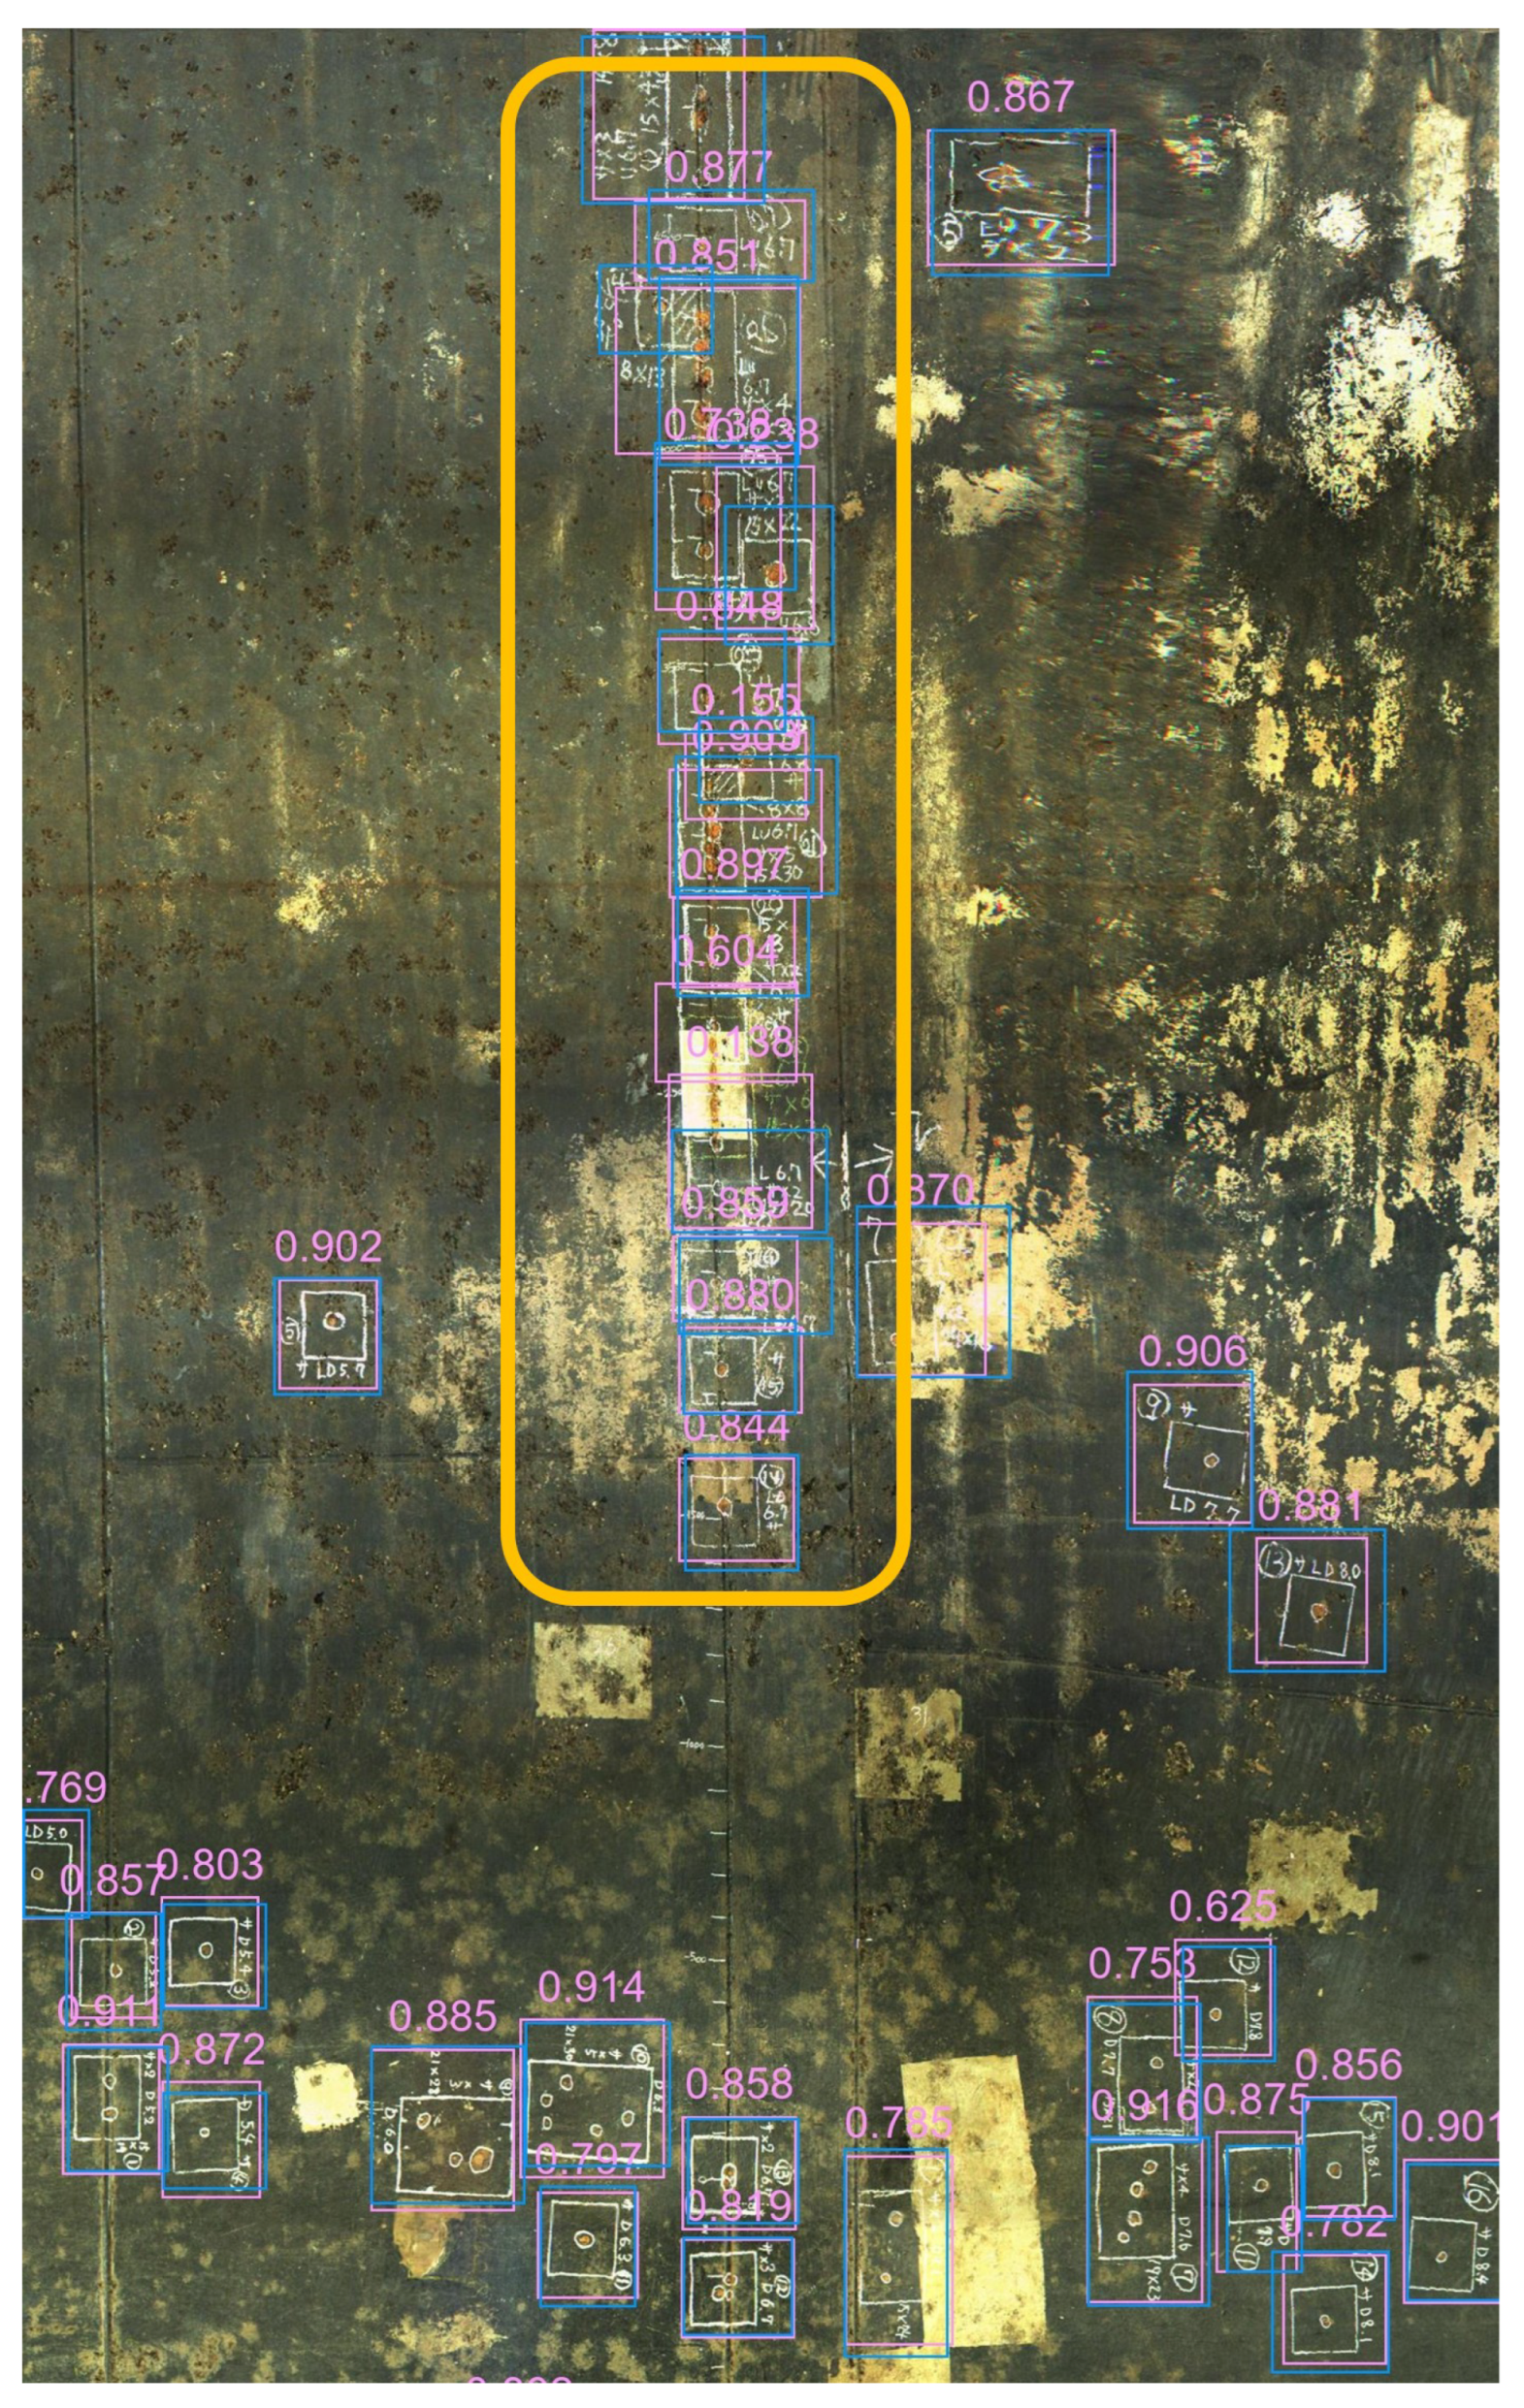
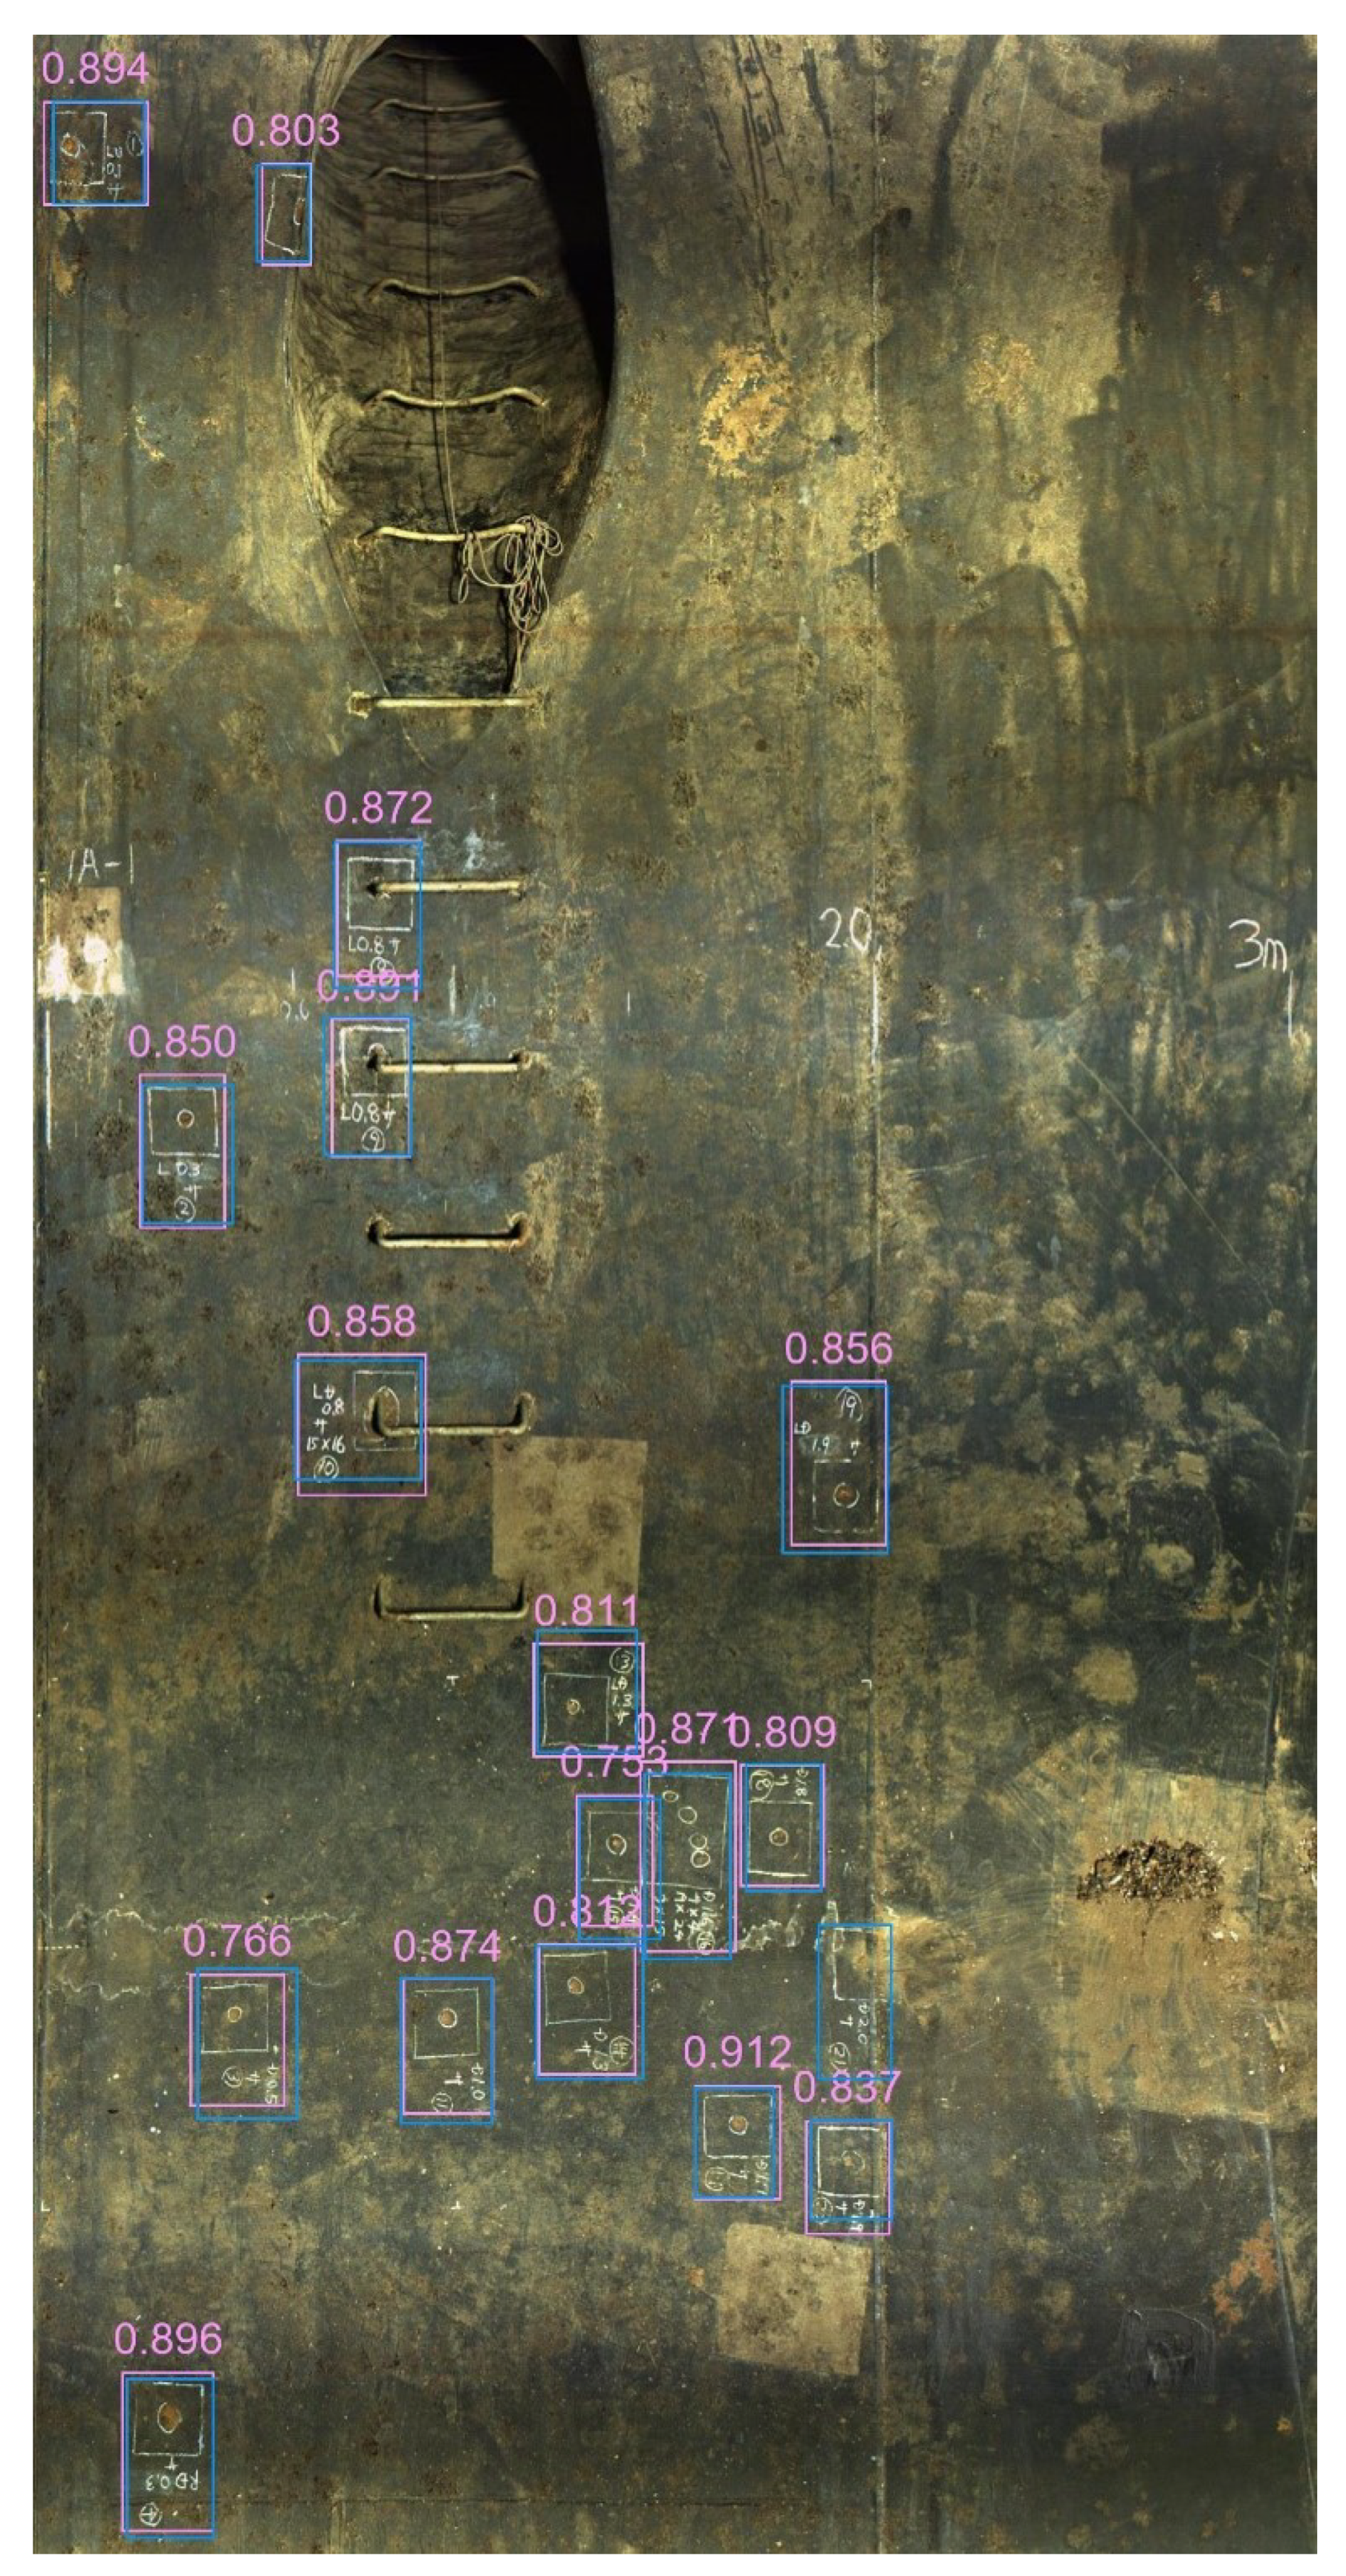
5.2. Analysis Results
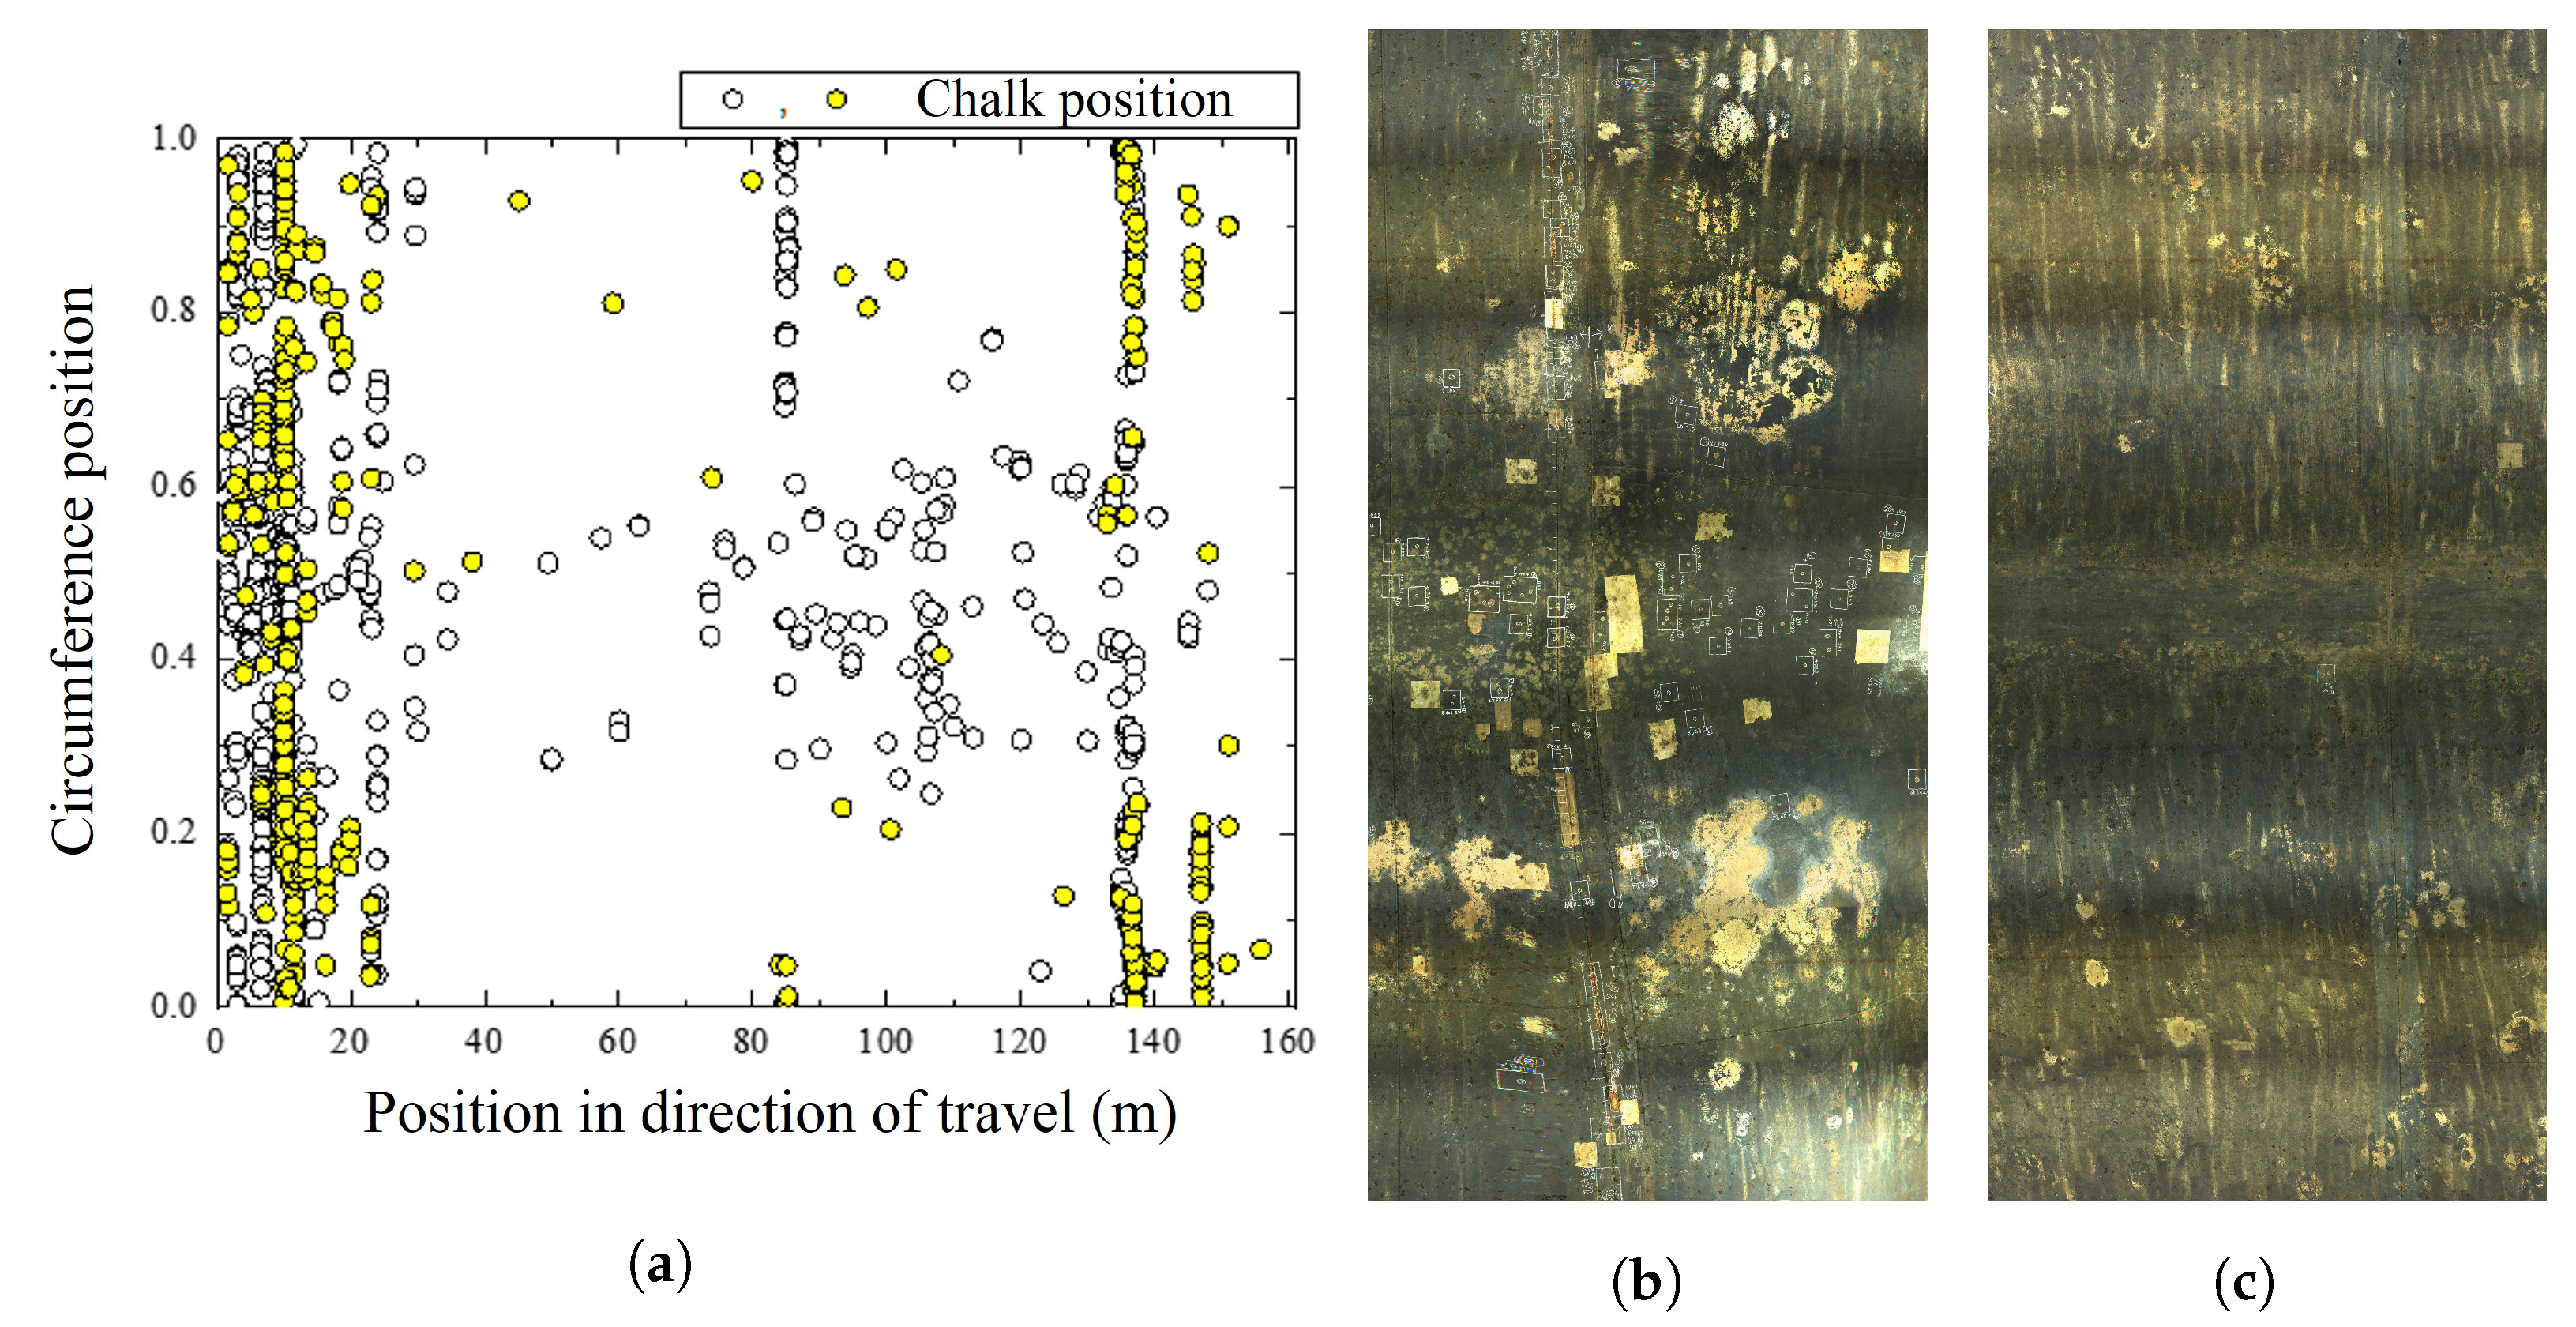
5.3. Plot of Chalking Positions in Headrace Tunnel
6. Discussion
7. Conclusions
- The model developed in this study allowed us to determine the location of deterioration with an accuracy as high as 99.02%.
- Chalking detection from continuous wall images allows quantitative and qualitative evaluation of the total number and distribution of deteriorated areas, facilitating the identification of changes over time and the factors that cause deterioration phenomena.
- The cost and time associated with investigation and diagnosis are reduced by approximately JPY 13.74 million/year and one-fifth, respectively, by using the developed continuous nondestructive survey system.
- Effective maintenance and management can be achieved through the acquisition of data that can be easily stored in a database and the development of a series of systems to monitor the deterioration status.
- The continuous wall surface images and the chalking locations detected using the images are recorded, plotted, and stored in a database, leading to an advanced asset-management system for headrace tunnels.
Author Contributions
Funding
Institutional Review Board Statement
Informed Consent Statement
Data Availability Statement
Conflicts of Interest
References
- Ministry of Land, Infrastructure, Transport and Tourism; Roads Bureau. Bridge Periodic Inspection Guidelines. Available online: https://www.mlit.\go.jp/road/sisaku/yobohozen/tenken/yobo4_1.pdf (accessed on 1 August 2023).
- Kubo, S.; Yamane, T.; Chun, P.J. Study on Accuracy Improvement of Slope Failure Region Detection Using Mask R-CNN with Augmentation Method. Sensors 2022, 22, 6412. [Google Scholar] [CrossRef] [PubMed]
- Chun, P.J.; Suzuki, M.; Kato, Y. Iterative application of generative adversarial networks for improved buried pipe detection from images obtained by ground-penetrating radar. Comput. Civ. Infrastruct. Eng. 2023. early view. [Google Scholar] [CrossRef]
- Yamane, T.; Chun, P.J.; Dang, J.; Honda, R. Recording of bridge damage areas by 3D integration of multiple images and reduction of the variability in detected results. Comput. Civ. Infrastruct. Eng. 2023. early view. [Google Scholar] [CrossRef]
- Yamane, T.; Chun, P.J.; Honda, R. Detecting and localising damage based on image recognition and structure from motion, and reflecting it in a 3D bridge model. Struct. Infrastruct. Eng. 2022. [Google Scholar] [CrossRef]
- Xu, H.; Su, X.; Wang, Y.; Cai, H.; Cui, K.; Chen, X. Automatic Bridge Crack Detection Using a Convolutional Neural Network. Appl. Sci. 2019, 9, 2867. [Google Scholar] [CrossRef]
- Chun, P.; Izumi, S.; Yamane, T. Automatic detection method of cracks from concrete surface imagery using two-step light gradient boosting machine. Comput. Civ. Infrastruct. Eng. 2020, 36, 61–72. [Google Scholar] [CrossRef]
- Chun, P.; Yamane, T.; Tsuzuki, Y. Automatic Detection of Cracks in Asphalt Pavement Using Deep Learning to Overcome Weaknesses in Images and GIS Visualization. Appl. Sci. 2021, 11, 892. [Google Scholar] [CrossRef]
- He, K.; Zhang, X.; Ren, S.; Sun, J. Deep Residual Learning for Image Recognition. In Proceedings of the 2016 IEEE Conference on Computer Vision and Pattern Recognition (CVPR), Las Vegas, NV, USA, 26 June–1 July 2016; pp. 770–778. Available online: https://arxiv.org/abs/1512.03385 (accessed on 18 August 2023).
- Koch, C.; Georgieva, K.; Kasireddy, V.; Akinci, B.; Fieguth, P. A review on computer vision based defect detection and condition assessment of concrete and asphalt civil infrastructure. Adv. Eng. Inform. 2015, 29, 196–210. [Google Scholar] [CrossRef]
- Pu, R.; Ren, G.; Li, H.; Jiang, W.; Zhang, J.; Qin, H. Autonomous Concrete Crack Semantic Segmentation Using Deep Fully Convolutional Encoder-Decoder Network in Concrete Structures Inspection. Buildings 2022, 12, 2019. [Google Scholar] [CrossRef]
- Barri, Q.K.; Babanajad, S.K.; Alavi, A.H. Real-Time Detection of Cracks on Concrete Bridge Decks Using Deep Learning in the Frequency Domain. Engineering 2021, 7, 1786–1796. [Google Scholar] [CrossRef]
- Mohan, A.; Poobal, S. Crack detection using image processing A critical review and analysis. Alex. Eng. J. 2018, 57, 787–798. [Google Scholar] [CrossRef]
- Cha, Y.J.; Choi, W.; Büyüköztürk, O. Deep Learning-Based Crack Damage Detection Using Convolutional Neural Networks. Comput.-Aided Civ. Infrastruct. Eng. 2017, 32, 361–378. [Google Scholar] [CrossRef]
- Zhang, G.; Wang, B.; Yan, Z.; Li, Y.; Yang, H. Rust Detection of Steel Structure via One-Class Classification and L2 Sparse Representation with Decision Fusion. IEICE Trans. Inf. Syst. 2019, 103, 450–453. [Google Scholar] [CrossRef]
- Petricca, L.; Moss, T.; Figueroa, G.; Broen, S. Corrosion Detection Using A.I.: Comparison of Standard Computer Vision Techniques And Deep Learning Model. In Proceedings of the Sixth International Conference on Computer Science, Engineering and Information Technology, Vienna, Austria, 21–22 May 2016; Volume 6, pp. 91–99. [Google Scholar] [CrossRef]
- Forkana, A.R.M.; Kangb, Y.B.; Jayaramana, P.P.; Liaoa, K.; Kaula, R.; Morgand, G.; Ranjand, R.; Sinhae, S. CorrDetector A Framework for Structural Corrosion Detection from Drone Images using Ensemble Deep Learning. Expert Syst. Appl. 2022, 193, 116461. [Google Scholar] [CrossRef]
- Hoang, N.D.; Duc, T.V. Image Processing-Based Detection of Pipe Corrosion Using Texture Analysis and Metaheuristic-Optimized Machine Learning Approach. Comput. Intell. Neurosci. 2019, 2019, 8097213. [Google Scholar] [CrossRef] [PubMed]
- Shi, J.; Dang, J.; Zuo, R. Bridge damage cropping-and-stitching segmentation using fully convolutional network based on images from UAVs. In Bridge Maintenance, Safety, Management, Life-Cycle Sustainability and Innovations; CRC Press: Boca Raton, FL, USA, 2021; pp. 264–270. [Google Scholar] [CrossRef]
- Wang, H.; Wu, X.; Chen, Y.; Liu, Z. Diversion Tunnel Structural Inspection and Assessment Using a Robotic System. In Proceedings of the 38th IAHR World Congress, Panama City, PA, USA, 1–6 September 2019; Volume 9. 14p. [Google Scholar] [CrossRef]
- Otsu, S. Survey and Inspection Methods for Waterway Tunnels Using MR Devices and Efficiency Improvement of Maintenance and Management. J. JCMA 2021, 73, 64–68. [Google Scholar]
- Mori, M.; Mori, T.; Tokashiki, M.; Nakaya, T.; Fujiwara, T.; Saito, Y. Development of Diagnosis System of Irrigation Tunnel under Water Servicing. Trans. Jpn. Soc. Irrig. Drain. Rural. Eng. 2012, 80, 87–95. [Google Scholar] [CrossRef]
- Mori, M.; Saito, Y.; Takaiwa, T.; Inagaki, M. Application of Ground Penetrating Radar for Diagnosis of Agricultural Irrigation and Drainage Tunnels. Water Land Environ. Eng. 2008, 76, 809–812.a2. [Google Scholar] [CrossRef]
- Chen, Y.; Chen, J.; Wang, H.; Gong, Y.; Feng, Y.; Liu, Z.; Qi, N.; Liu, M.; Li, Y.; Xie, H. Key technology of underwater inspection robot system for large diameter and long headrace tunnel. J. Tsinghua Univ. (Sci. Technol.) 2023, 63, 1015–1031. [Google Scholar]
- Girshick, R.; Donahue, J.; Darrell, T.; Malik, J. Rich feature hierarchies for accurate object detection and semantic segmentation. In Proceedings of the IEEE Conference on Computer Vision and Pattern Recognition, Columbus, OH, USA, 24–27 June 2014; pp. 580–587. [Google Scholar]
- Uijlings, J.R.; Van De Sande, K.E.; Gevers, T.; Smeulders, A.W. Selective Search for Object Recognition Selective Search for Object Recognition. Int. J. Comput. Vis. 2013, 104, 154–171. [Google Scholar] [CrossRef]
- Krizhevsky, A.; Sutskever, I.; Hinton, G.E. Imagenet classification with deep convolutional neural networks. Commun. ACM 2017, 60, 84–90. [Google Scholar] [CrossRef]
- Girshick, R. Fast R-CNN. In Proceedings of the Computer Vision and Pattern Recognition, Santiago, Chile, 7–13 December 2015; pp. 1440–1448. Available online: https://arxiv.org/abs/1504.08083 (accessed on 18 August 2023).
- Ren, S.; He, K.; Girshick, R.; Sun, J. Faster r-cnn: Towards real-time object detection with region proposal networks. In Proceedings of the Advances in Neural Information Processing Systems, Montreal, QC, Canada, 7–12 December 2015; Curran Associates, Inc.: Red Hook, NY, USA, 2015. 14p. Available online: https://arxiv.org/abs/1506.01497 (accessed on 18 August 2023).
- Redmon, J.; Divvala, S.; Girshick, R.; Farhadi, A. You only look once: Unified, real-time object detection. In Proceedings of the IEEE Conference on Computer Vision and Pattern Recognition, Las Vegas, NV, USA, 26 June–1 July 2016; pp. 779–788. Available online: https://arxiv.org/abs/1506.02640 (accessed on 18 August 2023).
- Redmon, J.; Farhadi, A. YOLO9000: Better, faster, stronger. In Proceedings of the IEEE Conference on Computer Vision and Pattern Recognition, Honolulu, HI, USA, 21–26 July 2017; pp. 7263–7271. Available online: https://arxiv.org/abs/1612.08242 (accessed on 18 August 2023).
- Redmon, J.; Farhadi, A. YOLOv3: An Incremental Improvement. In Proceedings of the Computer Vision and Pattern Recognition, Salt Lake City, UT, USA, 18–22 June 2018; 6p. Available online: https://arxiv.org/abs/1804.02767 (accessed on 18 August 2023).
- Terven, J.; Esparza, D.C. A Comprehensive Review of YOLO: From YOLOv1 to YOLOv8 and Beyond. In Proceedings of the Computer Vision and Pattern Recognition, Oxford, UK, 15–17 September 2023. [Google Scholar] [CrossRef]
- Ren, S.; He, K.; Girshick, R.; Zhang, X.; Sun, J. Object Detection Networks on Convolutional Feature Maps. In Proceedings of the Computer Vision and Pattern Recognition, Las Vegas, NV, USA, 26 June–1 July 2016; 8p. Available online: https://arxiv.org/abs/1504.06066 (accessed on 18 August 2023).


| Class | Number of Data | Example Images for Class | |
|---|---|---|---|
| Training Data | Validation Data | ||
| White chalking position | 2479 | 614 |  |
| (Pitting corrosion: <3 mm) | 415 images | 145 images | |
| True Class | |||
|---|---|---|---|
| Positive | Negative | ||
| Predicted Class | Positive | TP (True Positive) | FP (False Positive) |
| Negative | FN (False Negative) | TN (True Negative) | |
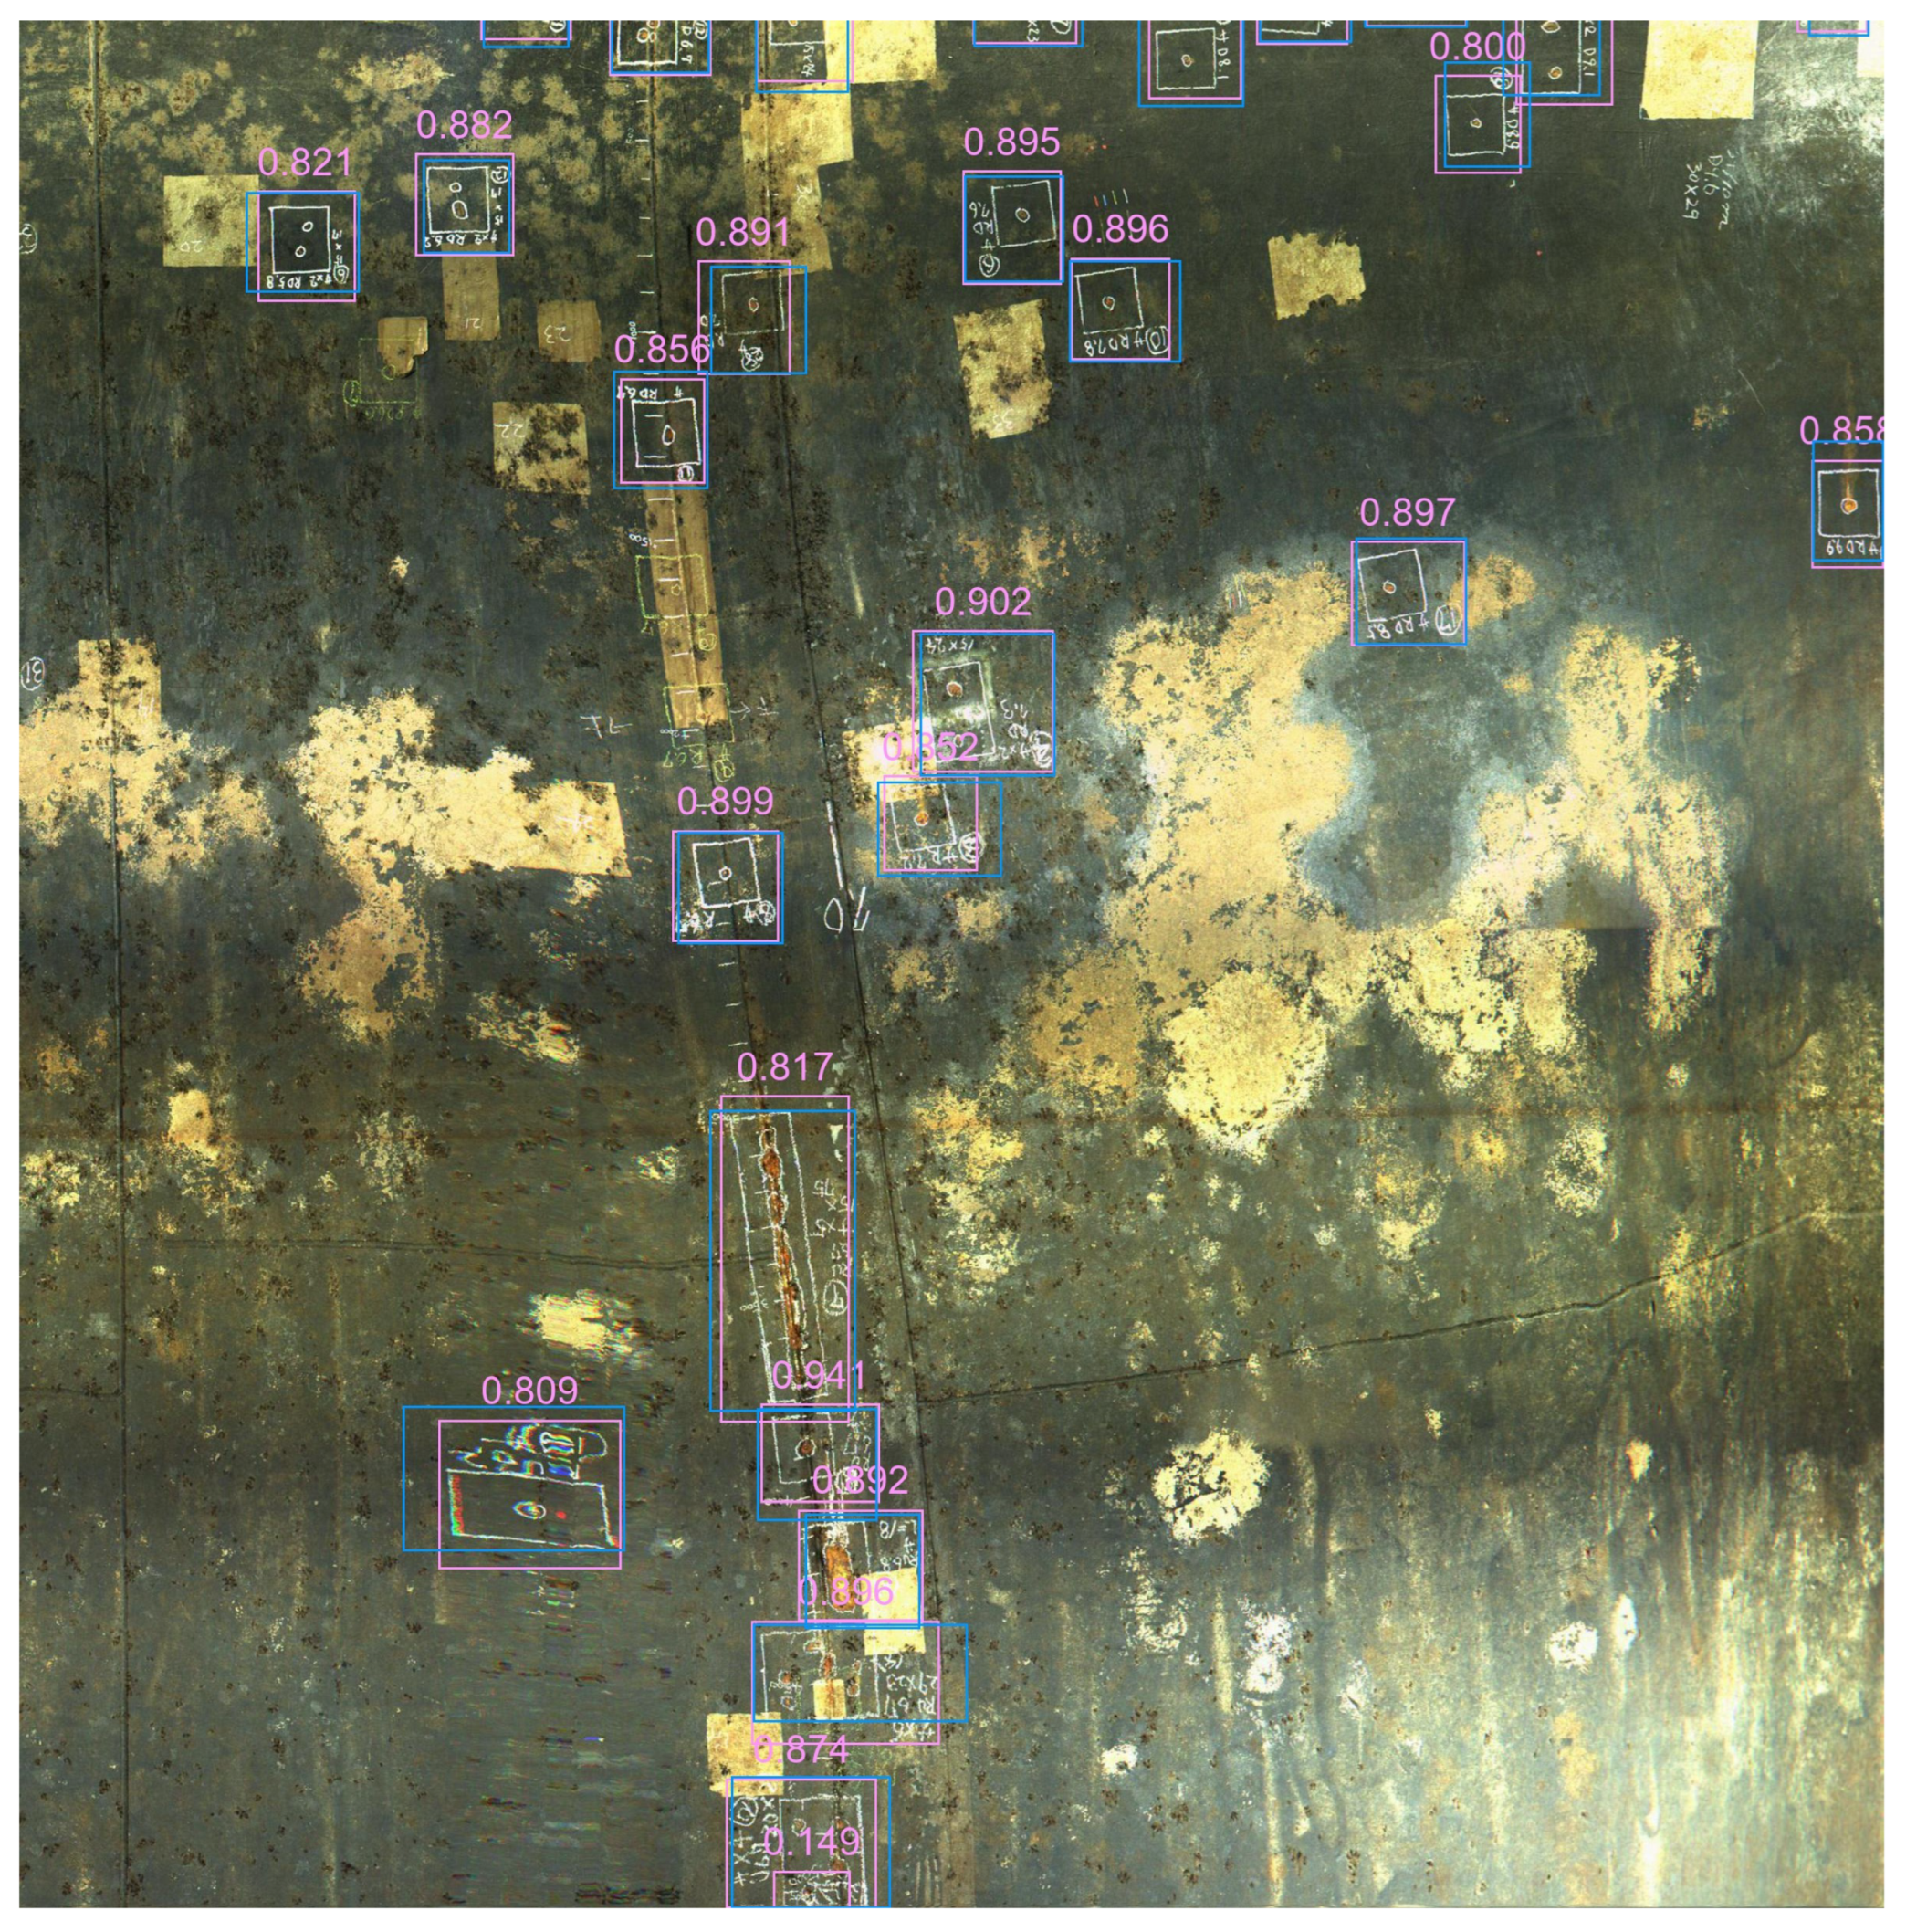
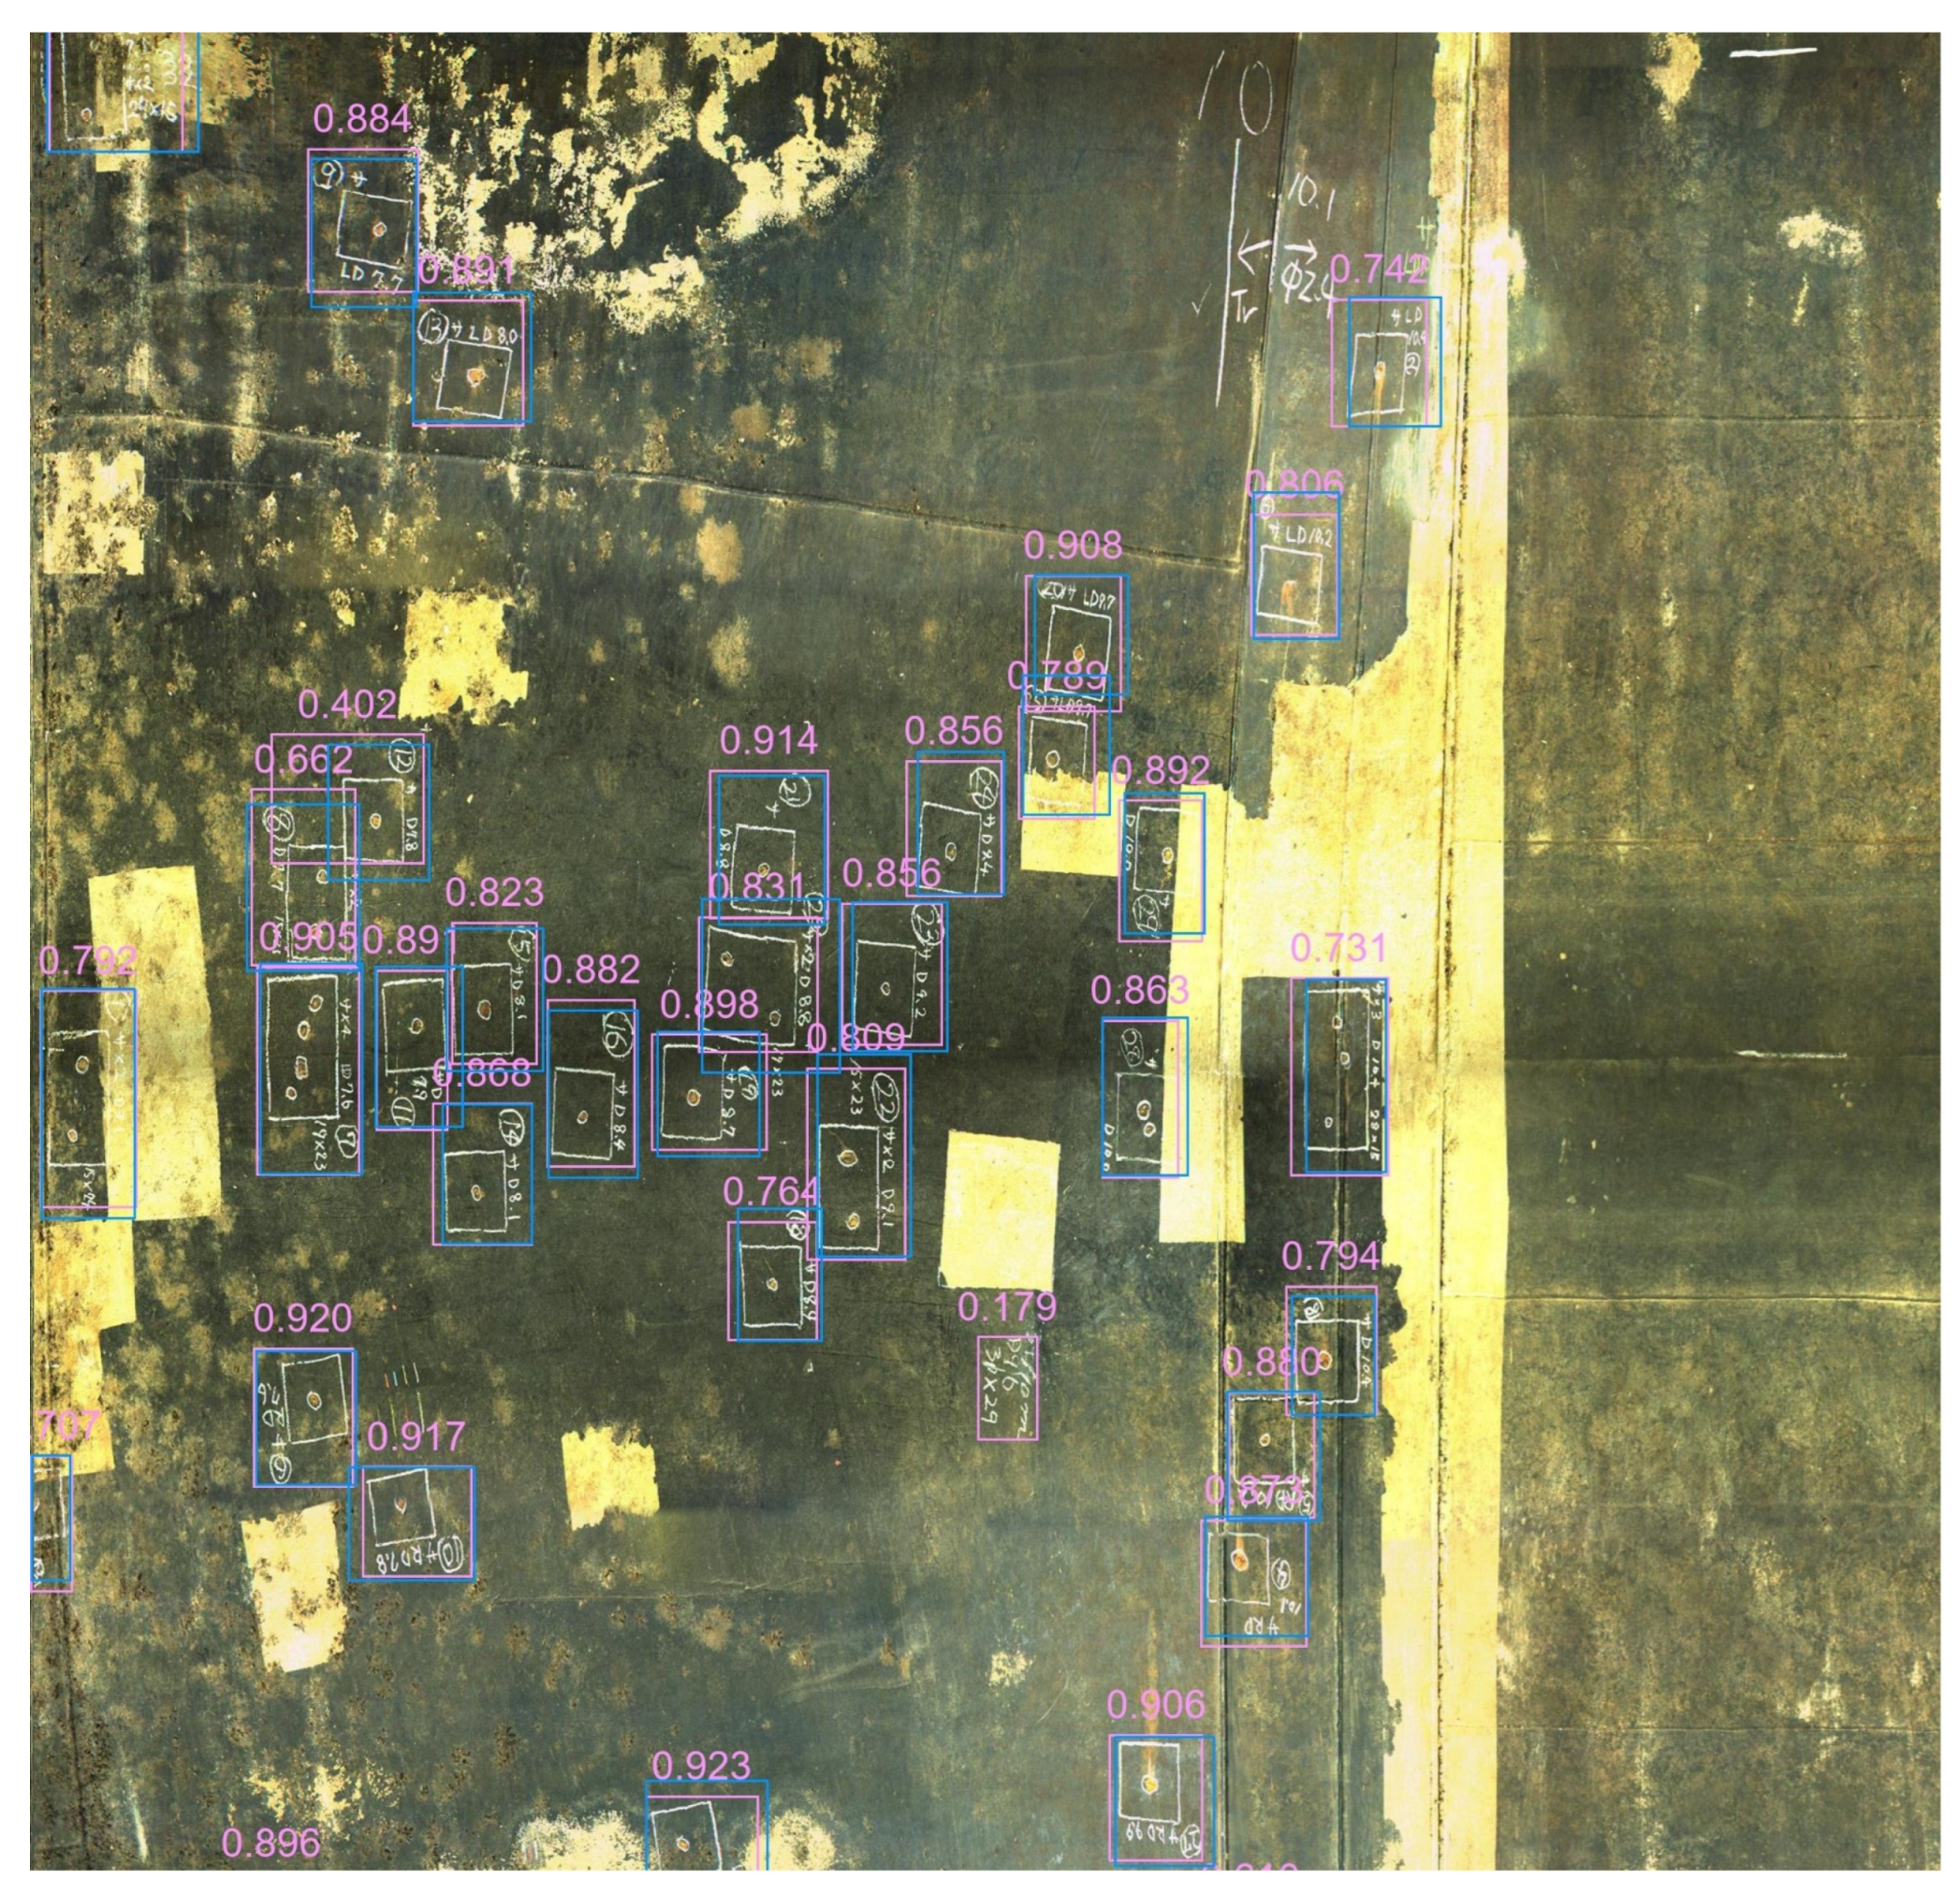
| Total number of chalking locations | 614 |
| Total number of detections | 754 |
| Correctly detected (TP) | 608 (99.02% of all chalking locations) |
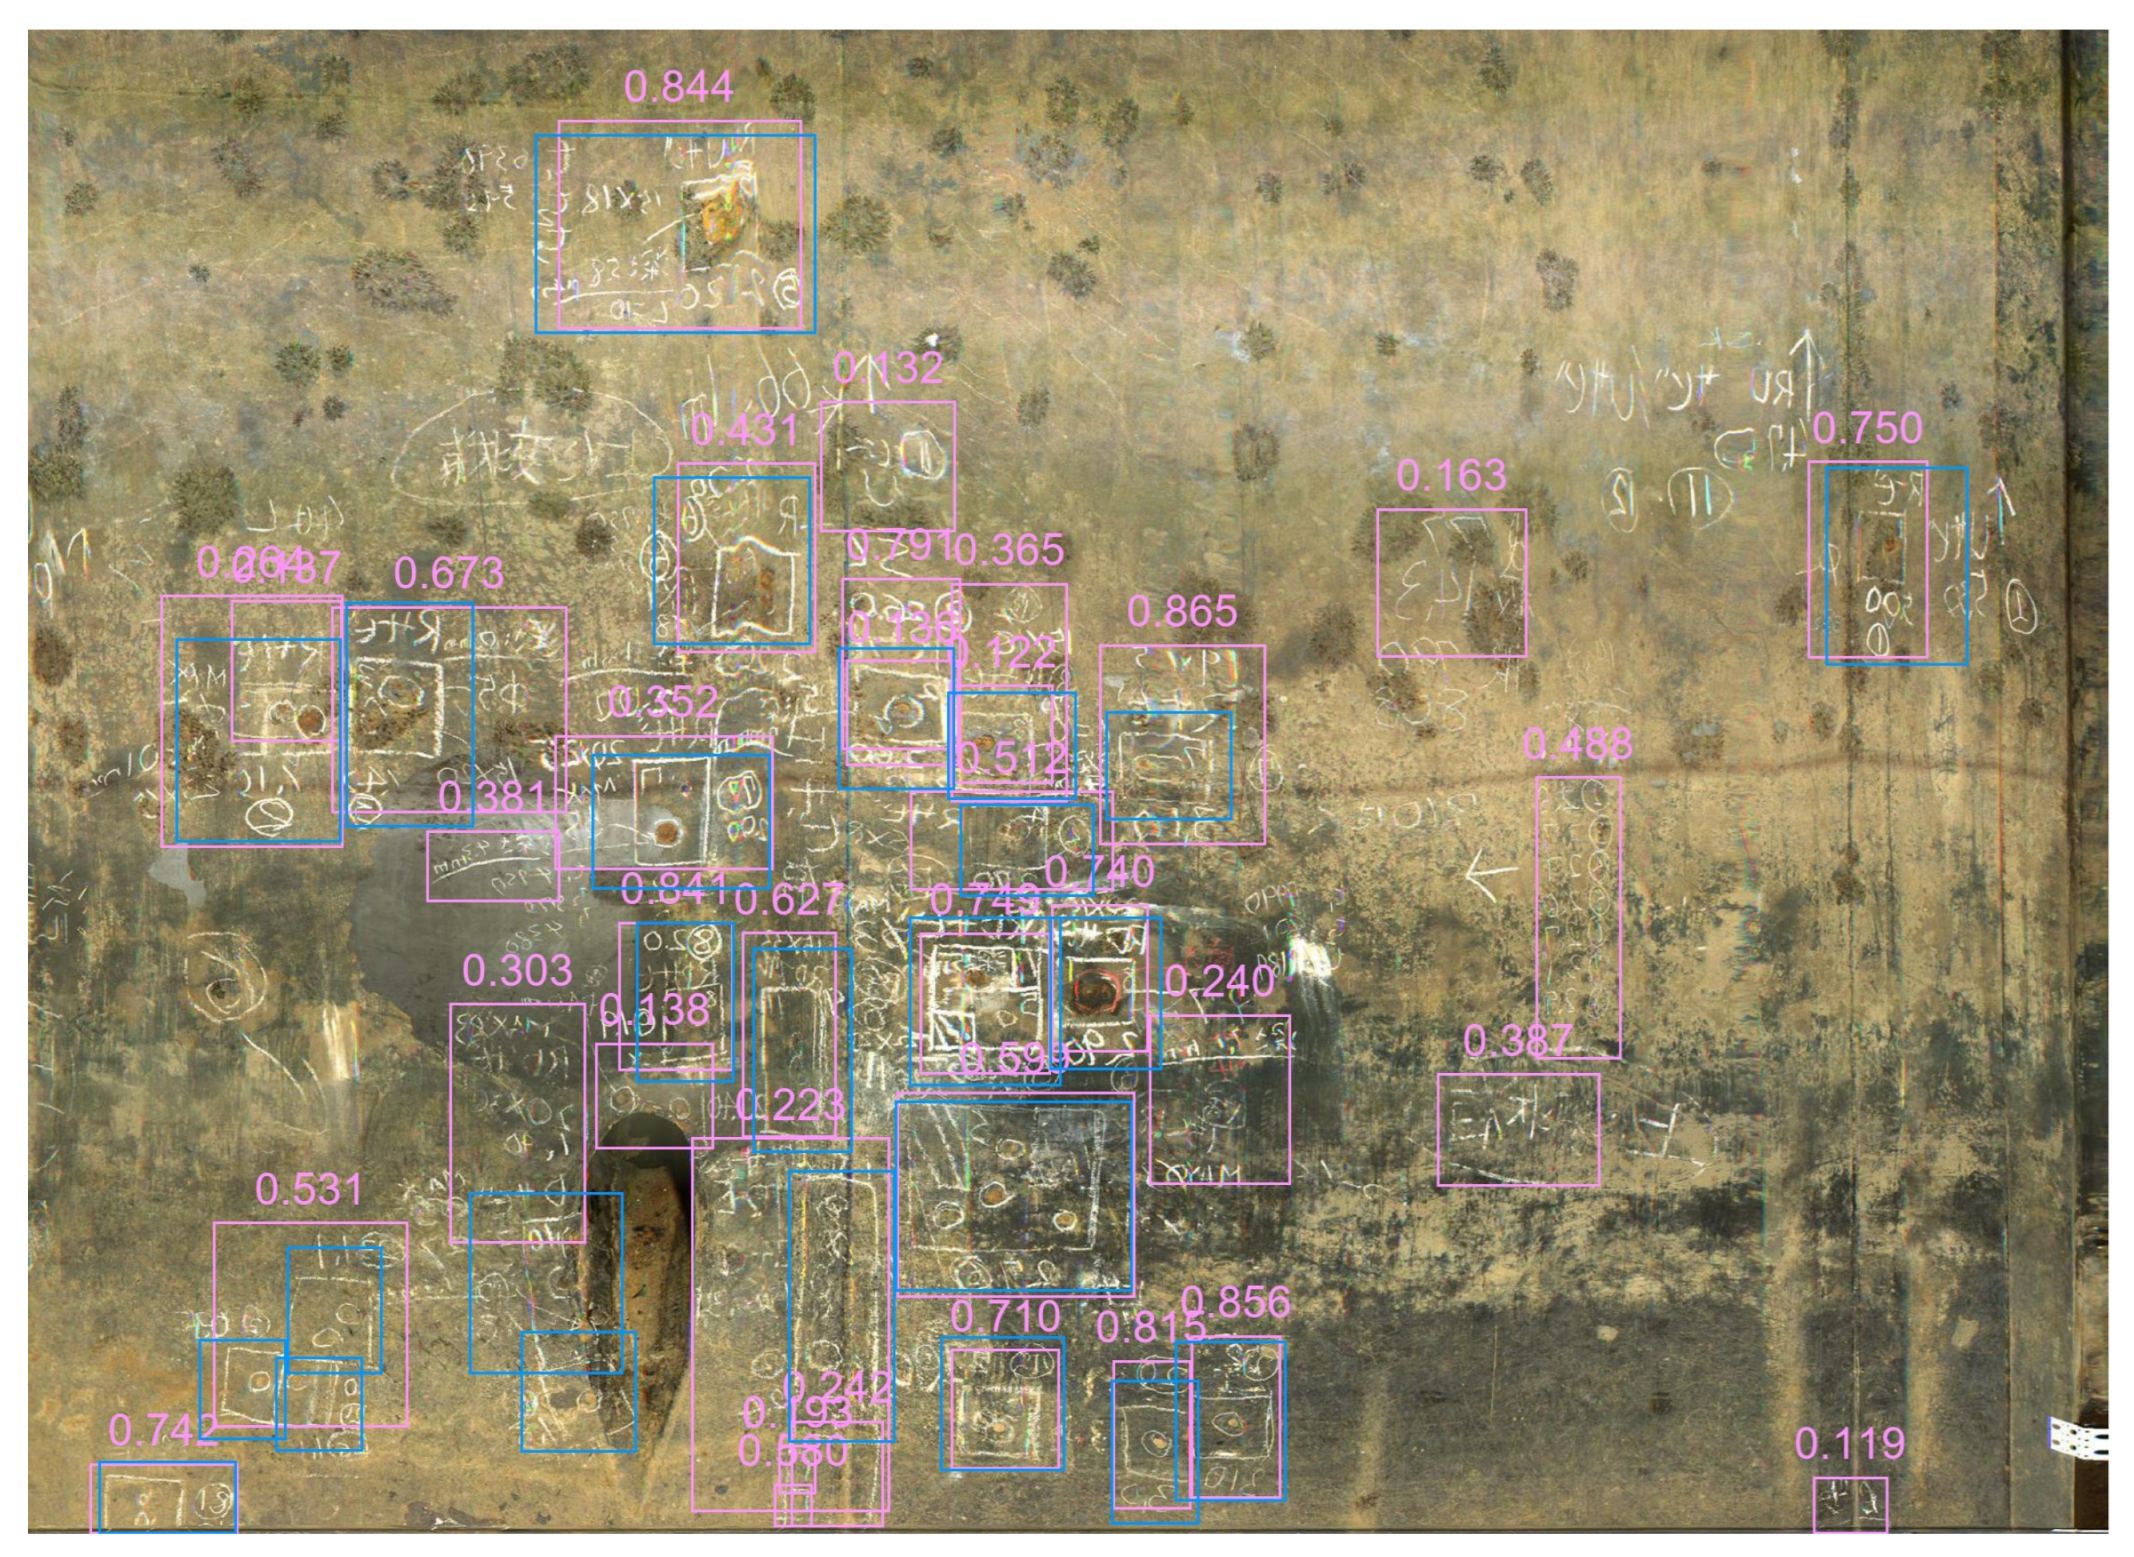
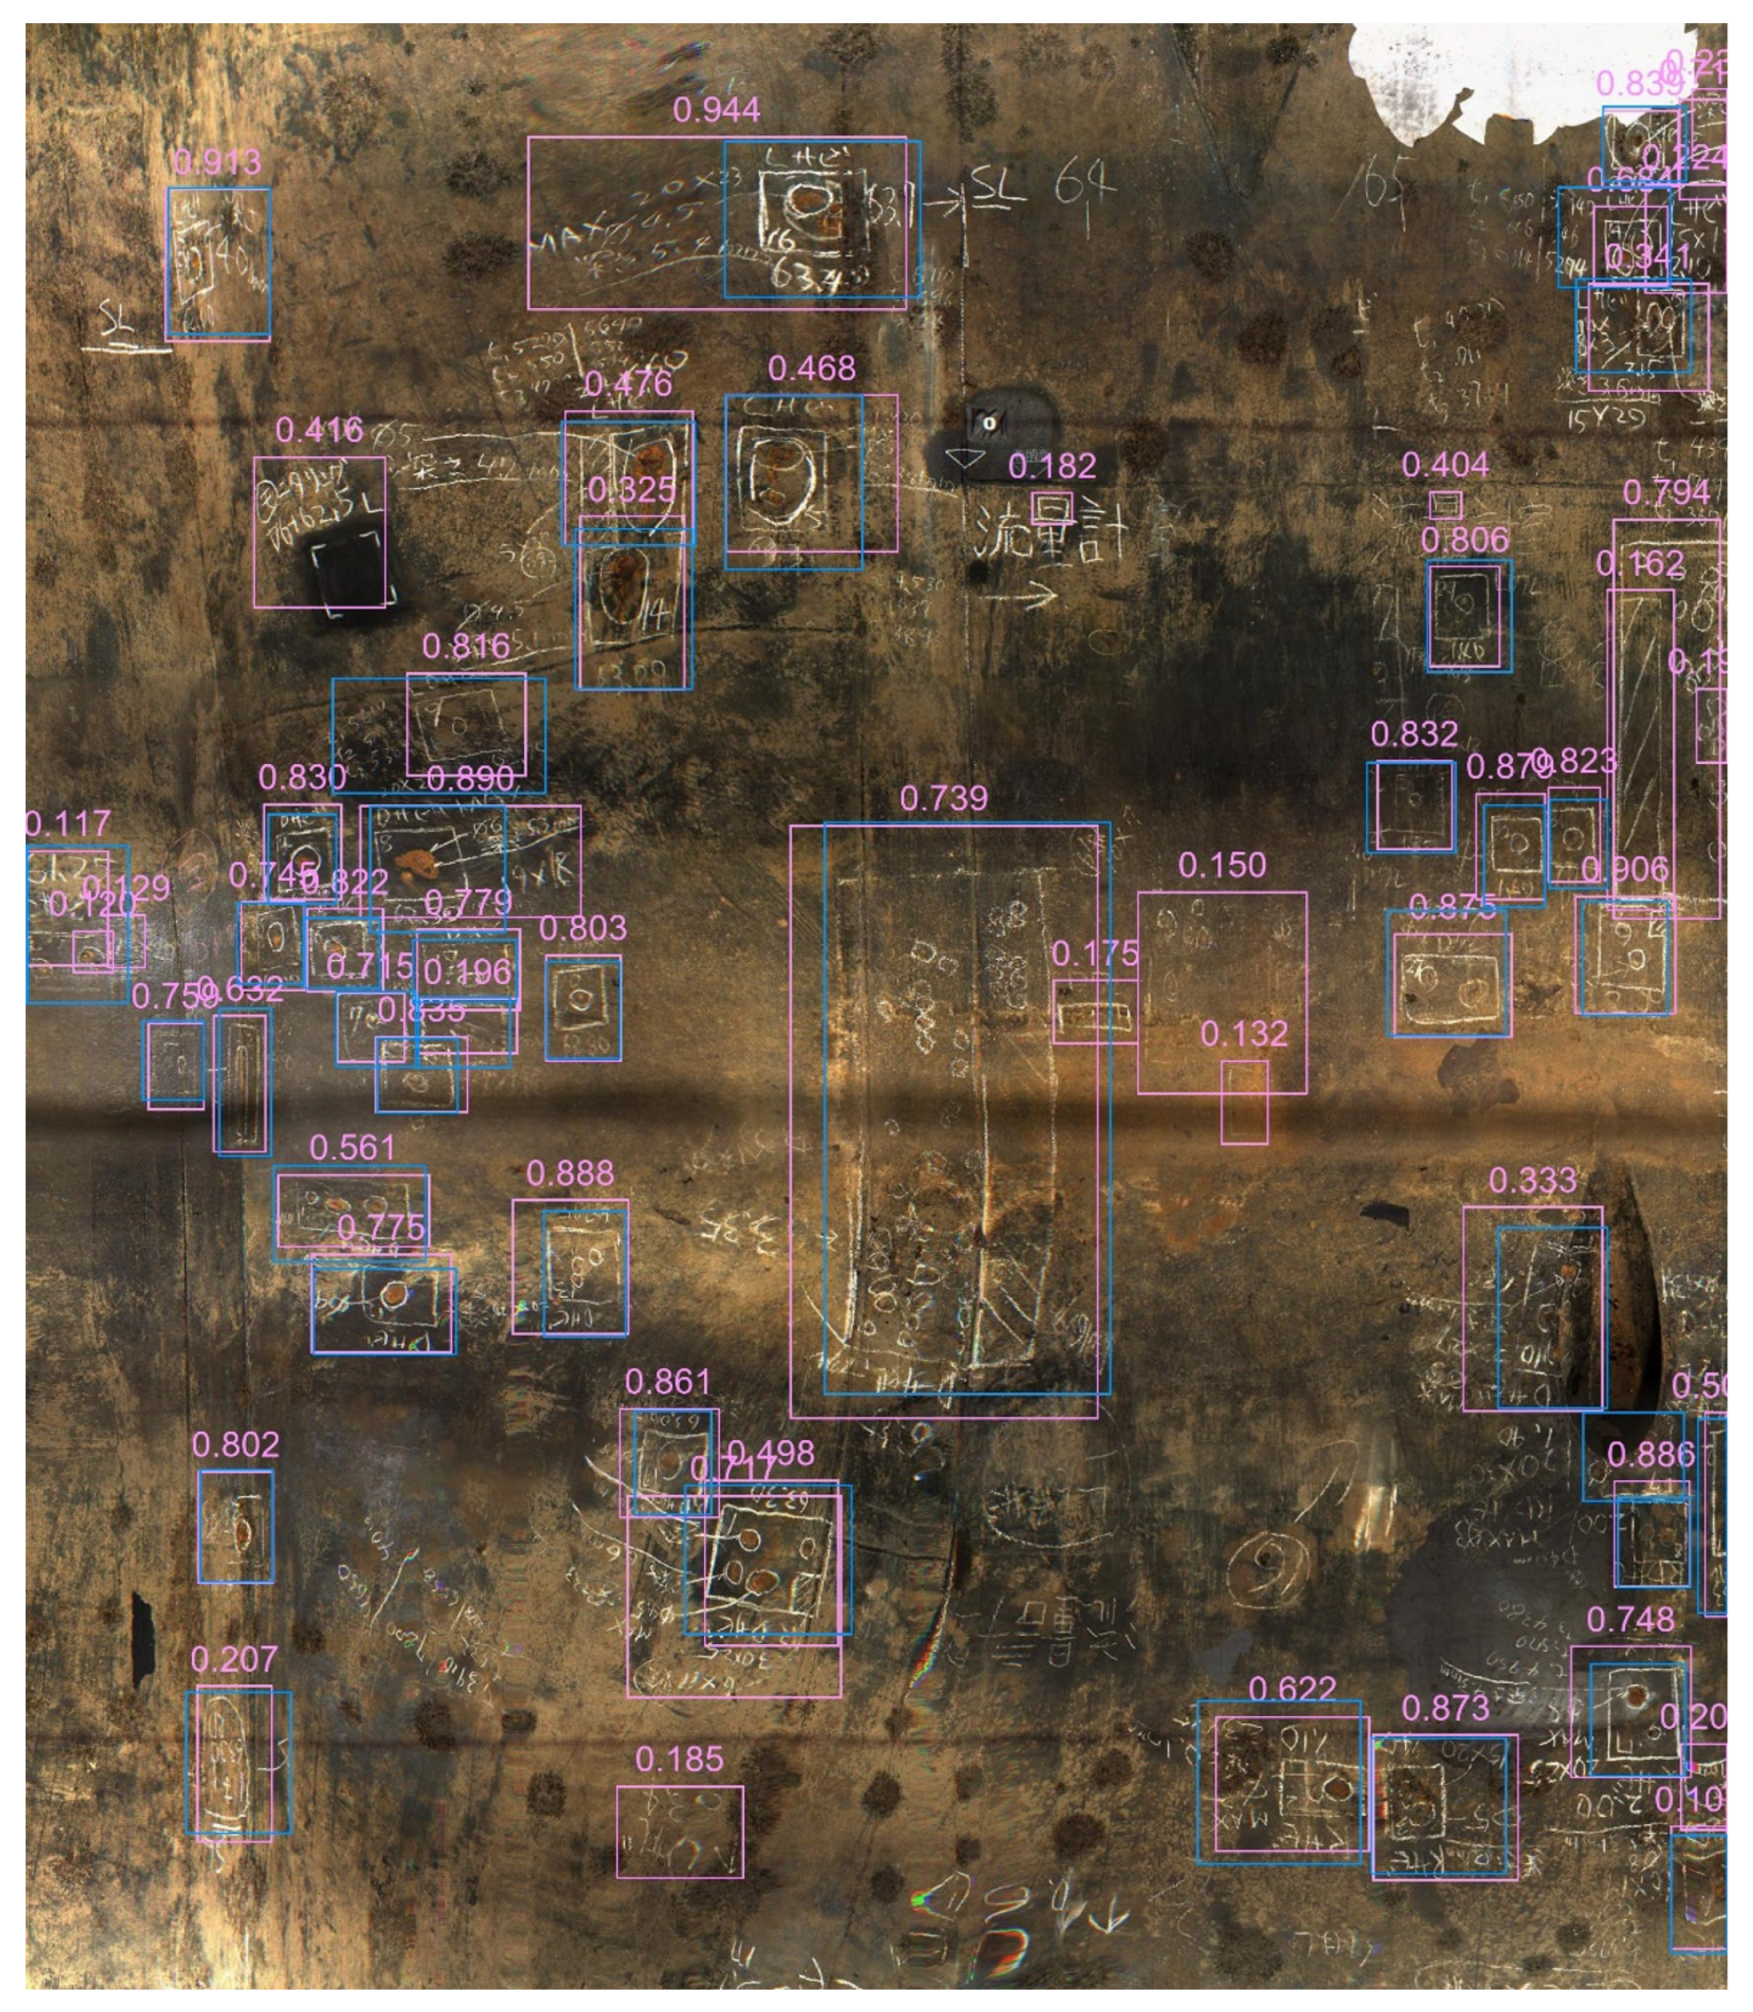
| False detections (FP) | 146 |
| A part or multiple parts of white chalk area | 126 (86.30% of false detections) |
| (e.g., number and symbols) | |
| Background | 14 (9.59% of false detections) |
| Other colors | 6 (4.11% of false detections) |
| (Bright yellow, white and yellow, etc.) | |
| Repair sheet | 0 (0% of false detections) |
| No detection (FN) | 6 (0.98% of all chalking locations) |
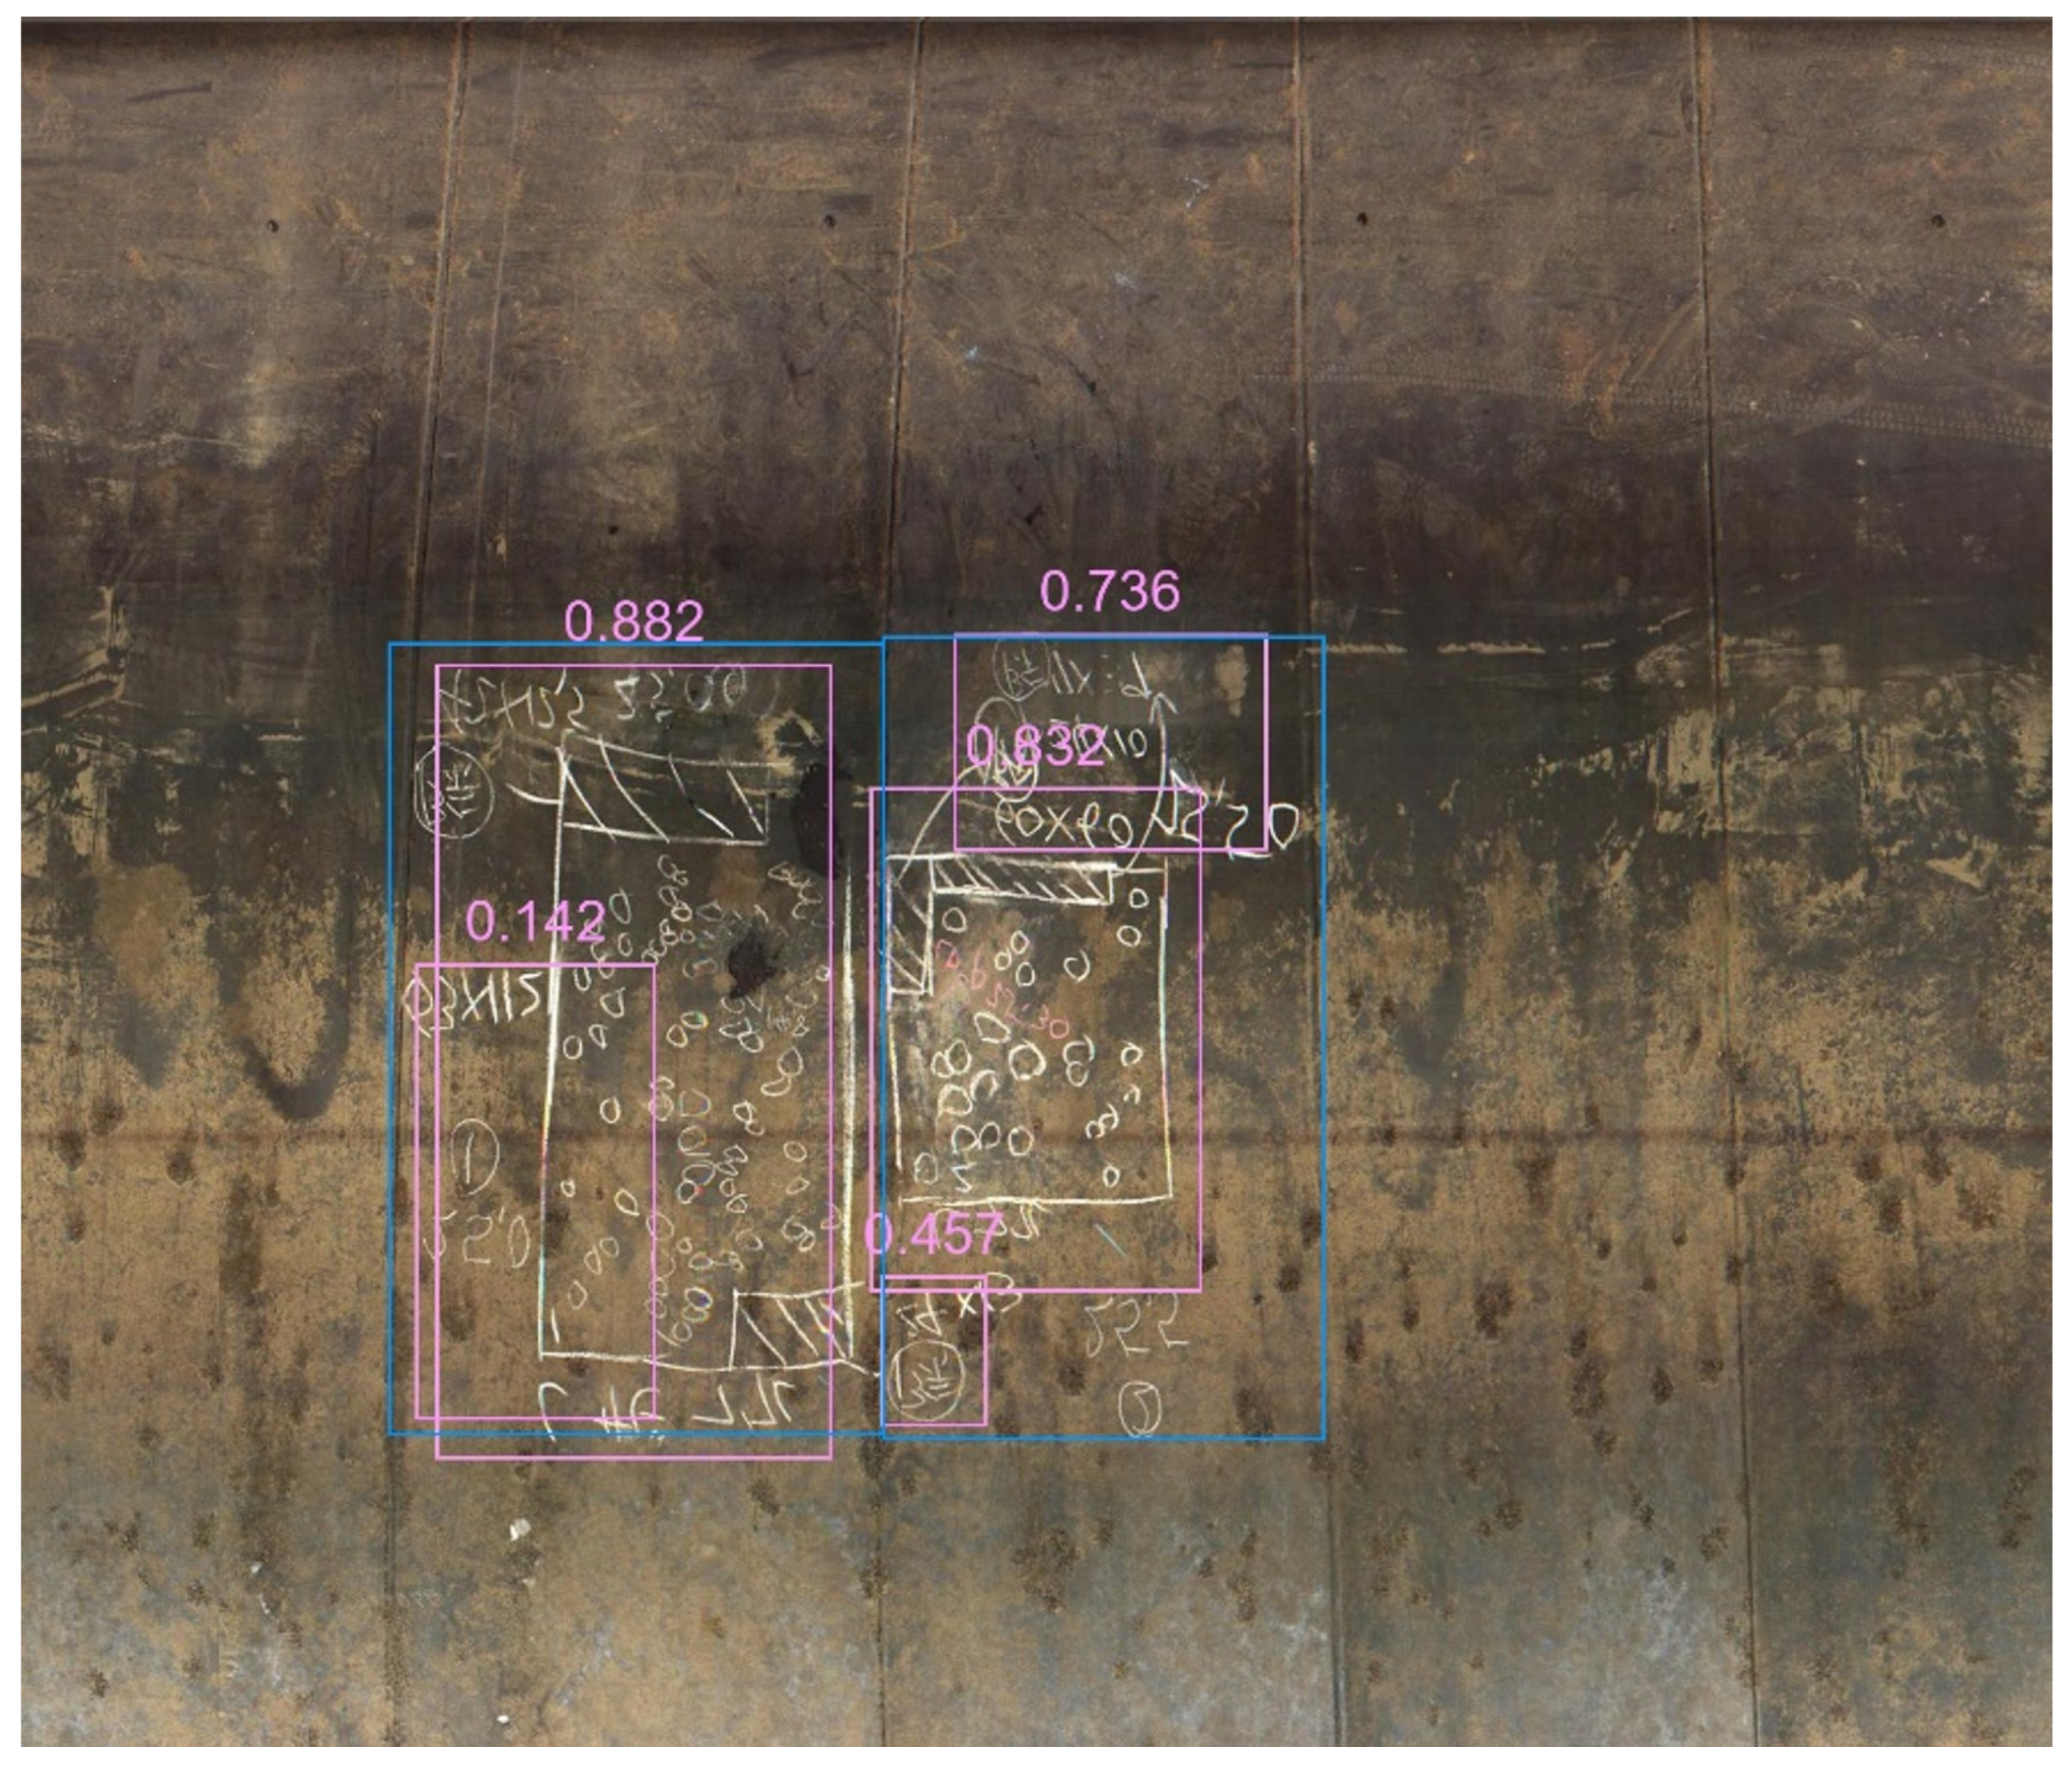
| Examples of Detectable/Not Detectable | |
|---|---|
| True Positive (TP) |  |
| False Negative (FN) |  |
| False Positive (FP) |  |
Disclaimer/Publisher’s Note: The statements, opinions and data contained in all publications are solely those of the individual author(s) and contributor(s) and not of MDPI and/or the editor(s). MDPI and/or the editor(s) disclaim responsibility for any injury to people or property resulting from any ideas, methods, instructions or products referred to in the content. |
© 2023 by the authors. Licensee MDPI, Basel, Switzerland. This article is an open access article distributed under the terms and conditions of the Creative Commons Attribution (CC BY) license (https://creativecommons.org/licenses/by/4.0/).
Share and Cite
Kubo, S.; Nakayama, N.; Matsuda, S.; Chun, P.-j. Corrosion Damage Detection in Headrace Tunnel Using YOLOv7 with Continuous Wall Images. Appl. Sci. 2023, 13, 9388. https://doi.org/10.3390/app13169388
Kubo S, Nakayama N, Matsuda S, Chun P-j. Corrosion Damage Detection in Headrace Tunnel Using YOLOv7 with Continuous Wall Images. Applied Sciences. 2023; 13(16):9388. https://doi.org/10.3390/app13169388
Chicago/Turabian StyleKubo, Shiori, Nobuhiro Nakayama, Sadanori Matsuda, and Pang-jo Chun. 2023. "Corrosion Damage Detection in Headrace Tunnel Using YOLOv7 with Continuous Wall Images" Applied Sciences 13, no. 16: 9388. https://doi.org/10.3390/app13169388
APA StyleKubo, S., Nakayama, N., Matsuda, S., & Chun, P.-j. (2023). Corrosion Damage Detection in Headrace Tunnel Using YOLOv7 with Continuous Wall Images. Applied Sciences, 13(16), 9388. https://doi.org/10.3390/app13169388