Abstract
In modern times, patients are not only seeking oral health but also aiming for a flawless smile. Despite the progress made in aesthetic dentistry, there are instances where insufficient teeth whitening results contrast with the considerable cost of professional treatments. Patient discomfort and the potential for tooth damage further compound these challenges. In this study, we conducted a comparative split-mouth ex vivo investigation to evaluate the innovative BlancOne ULTRA+ (IDS SpA) in comparison with established professional products: Opalescence Extraboost (ULTRADENT), Zoom WhiteSpeed (Philips Research Eindhoven High Tech), and Pola Office (SDI Limited). Our initial focus was on the whitening effectiveness of each product, which was measured using a spectrophotometer. Subsequently, we assessed any structural changes in enamel post-treatment using an atomic force microscope (AFM) and a nanoindentation procedure. All tested bleaching agents demonstrated teeth-brightening effects. BlancOne ULTRA+, Zoom WhiteSpeed, and Pola Office caused minor alterations in the texture of the enamel surface within nanometric limits. However, Opalescence Extraboost exhibited notably more pronounced changes, indicating significant modifications in surface roughness and potential reductions in material hardness due to consequential shifts in mechanical properties. BlancOne ULTRA+ appears to offer the most favourable cost–benefit outcome.
1. Introduction
Aesthetics has played a significant role in human society and civilization. Nowadays, maintaining a pleasing appearance is essential, and the whiteness of teeth, in particular, can influence the quality of life before and after whitening treatment [1]. While intrinsic stains are a result of pathological processes, common habits like consuming wine, coffee, and tea; smoking; consuming coloured foods; and misusing antibiotics can also cause stains. Tannins, furfurals, carotenoids, artificial colours, and tetracyclines can impact the dentin or enamel structure, leading to tooth discolouration [2]. However, teeth whitening can lead to tooth sensitivity and gum irritation due to improper treatment, negatively affecting people’s lives [3]. Whitening agents can also possess antibacterial effects, potentially causing imbalances in the oral microbiome. Therefore, the positive impact of white teeth on quality of life and the negative impact of tooth sensitivity are interconnected [3,4]. Teeth whitening can be done by patients themselves or by professionals in dental clinics using products containing hydrogen peroxide or carbamide peroxide [2]. Nonetheless, a tooth is a highly complex organic–inorganic biocomposite [5], and aggressive whitening with hydrogen peroxide might harm the organic tooth matrix. Moreover, alterations and damage to the tooth’s surface structure [6], along with microscopic pores and flaws on its surface, can result in issues such as reversible pulpitis and related conditions [7].
A review of the effect of vital teeth bleaching on the mechanical properties of tooth enamel highlighted potential variations in tooth hardness related to the bleaching treatment, probably arising from the degradation or denaturation of enamel matrix proteins through peroxide oxidation [8]. However, a recent meta-analysis aiming to determine scientific evidence of the effects of home vital bleaching with a 10% carbamide peroxide gel on the microhardness of human dental enamel concluded that there were no significant changes in enamel microhardness when using the 10% carbamide peroxide bleaching gel over periods of 7, 14, and 21 days [9].
Furthermore, in a review, the authors raised questions in the conclusions regarding the release of hydrogen peroxide into the oral cavity and its ingestion, drawing attention to its toxicity and potential carcinogenicity [10].
To mitigate some of these secondary post-treatment problems, the global market is beginning to offer products containing nanomaterials like nano-hydroxyapatite, capable of preventing hypersensitivity phenomena and further preserving the delicate mineral structure of the tooth [11].
In this study, we conducted numerous comparative analyses on four whitening products selected among the most marketed globally: BlancOne ULTRA+ (IDS SpA), Opalescence Extraboost (ULTRADENT), Zoom WhiteSpeed (Philips Research Eindhoven High Tech), and Pola Office (SDI Limited). As a preliminary approach, we chose to work ex vivo on a bovine animal model, which was more considerate towards patients. Additionally, the selected animal material and considered conditions allow a high level of reliability and translatability, as also indicated by the literature [12,13].
The predictor variable was the patented innovative formulation of photosensitive colourants combined with photons and special energy catalysts in the BlancOne ULTRA+ treatment using a solution containing 35% hydrogen peroxide (HP), as detailed on the website www.blancone.eu accessed on 14 October 2022. The primary focus of the study was to evaluate the effectiveness of teeth whitening achieved through both bleaching and photobleaching products and to explore the potential enhancement of whitening outcomes associated specifically with BlancOne ULTRA+. The secondary endpoint of the study involved investigating any negative effects that the bleaching and photobleaching processes could have on enamel.
We initially analysed the whitening effectiveness of each product using a spectrophotometer before and after treatment, highlighting the statistical differences between them. The use of a spectrophotometer capable of measuring brightness, which is the amount of light reflected from the tooth surface, enabled us to obtain completely objective values without influences stemming from human perception of colour changes. Furthermore, this instrument provides brightness changes in numerical values that allow reliable and immediate statistical calculations [14].
Secondly, we conducted thorough engineering studies on potential structural damage to enamel following the treatments. Using an atomic force microscope (AFM), we examined and compared the same treated surfaces before and after bleaching to quantify treatment effects in terms of nanoscale topography and surface roughness. Finally, through a nanoindentation process, we verified whether there could also be changes in the mechanical properties of the dental enamel structure and consequently in the tissue’s resistance.
2. Materials and Methods
2.1. The Bleaching Agents
The bleaching agents used in our comparative study were four classical market products intended for professional use, namely (Table 1):

Table 1.
Brief description of bleaching (a) and photobleaching (b) products, mode of use, and number and time of applications.
Opalescence Extraboost with 40% HP (ULTRADENT 505 West Ultradent Drive, South Jordan, UT 84095, USA);
Zoom WhiteSpeed with 25% HP (Philips Research Eindhoven High Tech, Campus 34, 5656 AE, Eindhoven, The Netherlands), which requires photoactivation using a Philips Led blue-white speed lamp 400–505 nm (Philips Research Eindhoven High Tech);
Pola Office with 35% HP (SDI Limited, 3-15 Brunsdon Street, Bayswater, Victoria 3153, Australia);
BlancOne ULTRA+ with 35% HP (IDS SpA, Via Valletta San Cristoforo, 28/10, 17100 Savona, Italy), which requires photoactivation using a BlancOne Led Arcus lamp (430–490 nm) (IDS SpA).
2.2. Evaluation of pH of Bleaching Agents
For the selected bleaching products mentioned above, we assessed the dynamic pH by comparing the pH value at the beginning of treatment (time zero) with the pH value at the end of the treatment time shown in Table 2. We used the Five Easy Plus pH Meter FP20-Std-Kit (Mettler Toledo, Columbus, OH, USA) to measure pH.
Table 2.
Dynamic pH of bleaching agents.
2.3. Specimens’ Collection and Preparation
For our analysis, we selected bovine teeth specimens as they provide reliable samples and represent a good ex vivo model for human teeth, as demonstrated by Kury et al. [12] and Soares et al. [13]. We obtained 18 bovine mandibles, with 6 mandibles used for each comparative experiment, resulting in a total of 144 treated incisors [15]. These specimens were obtained from the slaughterhouse Azienda Agricola BIOBIO, Vobarno, Brescia, Italy, and were from 18-month-old animals bred for human consumption following the directives of the Italian Ministry of Agricultural, Food and Forestry Policies. As the animals were not bred or sacrificed at the University of Genoa, ethical committee approval was not required. To minimize potential differences between the teeth, we selected specimens born, raised, and reared on the same organic farm, fed with the same fodder, and never subjected to antibiotic treatments until killing.
The specimens were collected immediately after slaughter and processed following all safety regulations. The incisors were not extracted from the mandibles but were preserved with all the skeletal portions. For each portion of the mandible, eight incisors (four on the left side and four on the right side) were used and cleaned using traditional dental prophylaxis procedures with AirFlow prophylaxis master and 14 µm erythritol powder (E.M.S. Electro Medical Systems S.A., Chem. de la Vuarpillière 31, 1260 Nyon, Switzerland) (refer to Figure 1G) [16].
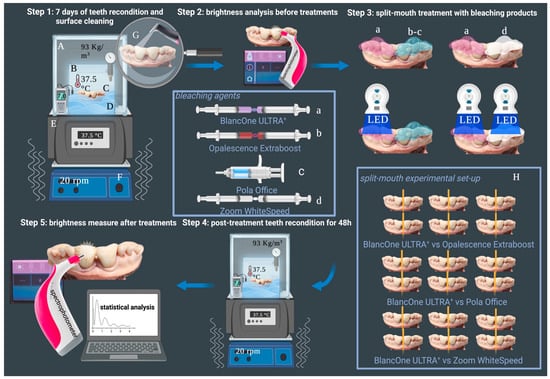
Figure 1.
Experimental design. Bovine mandibles were pre-incubated in the bioreactor for 7 days prior to the experiments (Step 1). The brightness was analysed using a specialized spectrophotometer before treatment (Step 2). The teeth were then bleached using (A) BlancOne ULTRA+ with 35% HP, photoactivated using a BlancOne Led Arcus lamp (430–490 nm), (B) Opalescence Extraboost with 40% HP, (C) Pola Office with 35% HP, or (D) Zoom WhiteSpeed with 25% HP, photoactivated through a Philips Led blue-white speed lamp 400–505 nm (Step 3). Tests were performed using a split-mouth experimental setup, in which 18 mandibles were analysed, 6 mandibles for each comparative experiment (H). The bovine mandibles were then incubated inside the bioreactor for 48 h (Step 4). The brightness was measured using the spectrophotometer 48 h after treatment (Step 5), and statistical analysis was conducted.
2.4. Bioreactor Mimicking Oral Conditions
To simulate oral conditions in humans, we utilized a custom-built bioreactor capable of replicating interactions between salivary fluid and the tooth surface through precise fluidic control. The design and capabilities of the bioreactor have been previously described in Pasquale et al. [17]. In brief, the oral cavity was mimicked using a specialized blend of artificial saliva with a neutral pH, monitored by the Five Easy Plus pH Meter FP20-Std-Kit (Mettler Toledo, Columbus, OH, USA), and a model thermostatic bath (Grant model ST 12; Grant Instruments Cambridge, SG8 6GB, Cambridgeshire, UK) (refer to Figure 1E) to maintain temperature and humidity levels similar to those found in the human oral cavity. To maintain a constant temperature of 37.5 °C, a thermostatic tank temperature was set and continuously monitored with a K-type thermocouple, HI 935002 digital thermometer (HANNA INSTRUMENTS Italia srl, Viale Delle Industrie, 11, 35010 Ronchi di Villafranca Padovana, Italy). The humidity index was maintained at 93 Kg/m3 and measured with a digital thermo-hygrometer HI9564 (HANNA INSTRUMENTS Italia srl), as described in Dabbagh et al. [18].
Lastly, the whole setup was supported by an orbital oscillator (SLA-OS-200. Scitech LabApp Ltd., Micklefield, Leeds, LS25 9BP, UK) (refer to Figure 1F)., which oscillated at 20 rpm to replicate the wetting of the tooth surface by saliva in the human oral cavity [17], as described in Pasquale et al.
2.5. Treatment of Specimens to Evaluate the Efficacy of Bleaching Agents
The mandibles supporting the teeth were kept inside the bioreactor for one week prior to the bleaching treatment to ensure that the teeth were properly conditioned. Subsequently, a split-mouth setup was used to administer the bleaching products according to the instructions provided by the manufacturers (refer to Table 1). To meet the comparative experimental purpose and minimize the influence of possible experimental sample heterogeneity on the effects of the treatments, one side was treated with BlancOne ULTRA+ at 35% HP while the other side was treated with a classic product available on the market, as shown in Figure 1. The number of treatments, time, and photoactivation method for each bleaching agent were recorded in Table 1. Additionally, the design of the bioreactor, which—as previously shown—mimics the oral cavity [17], and the use of a spectrophotometer to measure the bleaching effect, support the reliability of our data.
The brightness was analysed using the spectrophotometer, VITA easy-shade (VITA Zahnfabrik (VITA Zahnfabrik H. Rauter GmbH & Co. KG Postfach 1338 D-79704, Bad Säckingen, Germany)), before and 48 h after the bleaching treatment. The values were expressed as optical density (OD) [19]. The measurements were taken 48 h after treatment, as per the literature, to confirm the final result and treatment stability [20].
The tests were conducted by working on one mandible side at a time.
2.6. Treatment of the Specimens for Structural and Mechanical Analyses
To conduct structural and mechanical analyses, we chose sections (8 mm × 8 mm) of enamel from the lower central incisors of the bovine mandibles above described. These were attached to the bottom of a plastic petri dish using adhesive and stored for a week in the bioreactor before further measurements were taken.
To enable a comparative structural analysis at the nanometre scale and to account for surface structure heterogeneity observed in different regions of the same sample, we elected to compare the same 20 × 20 µm2 areas before and after bleaching treatment.
To achieve this, we manually inscribed four small markers on each sample using a dental drill, which could be identified through optical inspection, to facilitate the repositioning of the atomic force microscope probe on the same scanning area.
This allowed us to capture images from different regions, subject the sample to the bleaching procedure within the bioreactor, reposition the sample under the atomic force microscope, and capture new images of the same areas. The experimental design is shown in Figure 2.
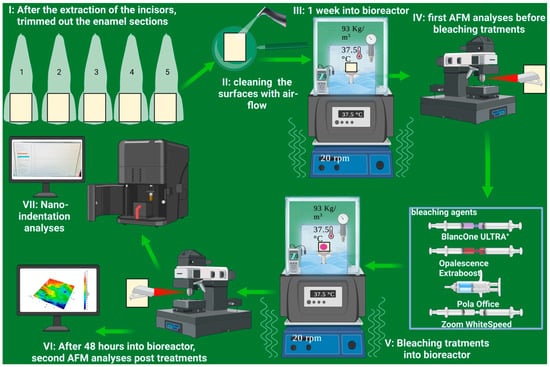
Figure 2.
Experimental design: I: Following the extraction of 5 lower central incisors, enamel portions measuring 8 × 8 mm, compatible with the analysis chamber of the atomic force microscope, are excised. One section is reserved solely as a control sample for nanoindentation and the others intended for treatment with bleachin agents. II: Surface cleaning is carried out using air flow and 14 µm erythritol powder (EMS). III: The samples are placed in the bioreactor, where they are re-conditioned in the oral environment for 1 week. IV: Prior to the bleaching treatments, the surfaces are analysed with atomic force microscopy (AFM). V: Enamel surfaces undergo bleaching treatments, following the times and protocols prescribed by the manufacturers and outlined in Table 1. VI: The second step of AFM analysis is performed on the same points previously analysed, and the results are compared to obtain the measurements necessary for a reference statistic on any surface changes. VII: Finally, the same samples are subjected to nanoindentation to evaluate any mechanical changes in the enamel material before and after the bleaching treatment.
2.7. Atomic Force Microscopy (AFM) Measurements
To obtain true height measurements of enamel surface topography before and after bleaching treatment, we used correlative optical–atomic force microscopy with a commercial AFM (NanoWizard 4 XP BioScience, Bruker, Billerica, MA, USA) equipped with a motorized stage for precise sample repositioning (HybridStageTM, Bruker), and coupled with an upright optical microscope (AxioZomm v.16, Zeiss, Jena, Germany).
We obtained topography images using the “contact mode” in deionized water over 20 × 20 µm2 scanning areas. To ensure consistent results, we used the same probe (HQ:CSC17/Hard/Al BS, MikroMasch, Tallinn, Estonia) with a wear-resistant coating to maintain a consistent tip geometry/size over multiple measurements, resulting in comparable topographic features.
AFM data were processed using the Mountains® software from Digital Surf, Besançon, France. To numerically express and compare changes in surface roughness, we calculated the “Developed Interfacial Area Ratio” (Sdr) parameter according to ISO 25178-2:2012 standard. The Sdr parameter expresses the percentage of the additional surface area contributed by surface topography compared to an ideal plane the size of the scanned region. For a flat surface, Sdr is 0%, and it increases with the complexity of the surface topography [21].
2.8. Nanoindentation
To evaluate changes in the mechanical properties of enamel resulting from bleaching treatment, we performed nanoindentation measurements on a nanoindenter from Anton Paar Italia srl Rivoli 10098 Italy, with a UNHT head, equipped with a diamond Berkovich tip. The maximum load was set to 5 mN, the loading and unloading rate to 10 mN/min, and the dwell time at maximum load to 10 s. At least 16 measurements were taken in each sample and results are presented as mean ± standard deviation.
Specifically, we calculated the Young’s modulus E (1), which describes material elasticity or stiffness, and hardness H (2), which describes resistance to plastic deformation, using the widely accepted Oliver and Pharr method [22,23].
where is the maximum load, is the unloading stiffness, β = 1.034 is a geometrical coefficient, and is the contact area, calculated from geometrical consideration, from the contact depth, which is defined as:
where ε = 0.75 is a function of the indenter.
2.9. Statistical Analyses
The statistical analysis was conducted using MATLAB software (The Math-Works, Inc. MathWorks 1 Apple Hill Drive, Natick, MA 01760, USA). Means ± standard deviation or the differences in means (mean before − mean after treatment) ± standard deviation of each test were compared, with experiments being conducted at least in triplicate. According to Rosner, the sample size was calculated to establish the minimum required number of subjects for achieving sufficient study power using the ClinCalc Sample Size Calculator [24]. Taking into account the preliminary data on the primary endpoint, and considering an efficacy mean of ΔOD (difference between the spectrophotometer measures after and before the treatment) 7.1 with a standard deviation of 30% in group 1 (BlancOne ULTRA+), along with a difference of 15% compared to group 2 (standard commercial products), a sample size ranging from 118 to 194 is adequate to achieve a power ranging from 0.8 to 0.95, with an alpha level of 0.5 and a beta level of 0.2. Statistical power was calculated using an allocation ratio of 1 and an alpha of 5% through the Simple Interactive Statistical Analysis online program (https://www.quantitativeskills.com/sisa/index.htm) accessed on 20 January 2023.
3. Results
3.1. pH of Bleaching Agents
As shown in Table 2, the dynamic pH values of the analysed substances are different from each other. By nature, high-volume hydrogen peroxide has an acidic pH of around 4 and has the potential to be more chemically stable. To be able to optimize these substances in order to make them compatible with dental tissues, buffer substances are added [25]. However, it is important to consider that the problems that a slightly acidic pH can cause on the dental surface are always directly proportional to the gel–tooth contact times [26].
3.2. Spectrophotometer Measurements and Bleaching Data Analysis for Each Treatment
In this study, we utilized a spectrophotometer to evaluate the brightness of teeth before and after various treatments. The brightness measurements were expressed in terms of optical density (OD) and statistically analysed using a Student’s t-test. The results are presented graphically in Figure 3.
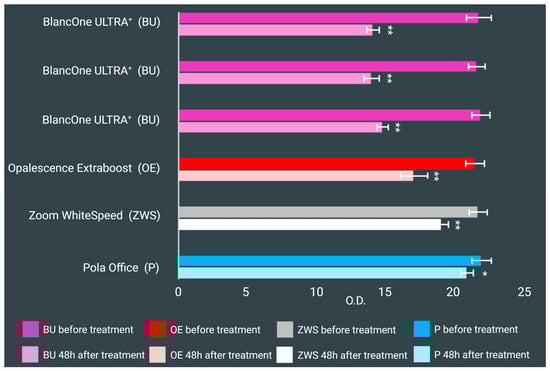
Figure 3.
Effect of professional bleaching treatments. Histograms show the means ± standard deviations of the spectrophotometric brightness measure (O.D.) carried out before and 48 h after the treatment. * and ** symbols indicate a significant and an extremely statistically significant difference (Student’s t-test), respectively, comparing the teeth brightness before and 48 h after bleaching treatment.
The data showed that BlancOne ULTRA+ significantly improved tooth brightness in all three experiments, which consisted of six mandibles each, with a statistically extremely significant difference (p < 0.0001) observed before and after the treatment. The mean ± standard deviation values before and after the treatment were 21.75 ± 0.91 and 14.08 ± 0.46, 21.61 ± 0.60 and 13.99 ± 0.56, and 21.91 ± 0.65 and 14.79 ± 0.40, respectively.
Similarly, Opalescence Extraboost (21.46 ± 0.68 before and 17.06 ± 0.99 after treatment) and Zoom WhiteSpeed (21.69 ± 0.66 before and 19.07 ± 0.49 after treatment) were found to have a positive effect on tooth brightness, with a statistically extremely significant difference (p < 0.0001) observed in both cases.
However, the difference before (21.95 ± 0.69) and after (20.91 ± 0.54) Pola Office treatment was found to be the least evident, despite there being significant statistical evidence with a p-value of less than 0.05.
3.3. Bleaching Data Analysis across Experiments and Treatments
In order to identify any significant differences between the experiments and treatments, an analysis of variance (ANOVA) test was conducted, followed by the Tukey HSD test. The comparison was made using the difference in means (mean before treatment minus mean after treatment) ± standard deviation of each test. The results are displayed in Figure 4.
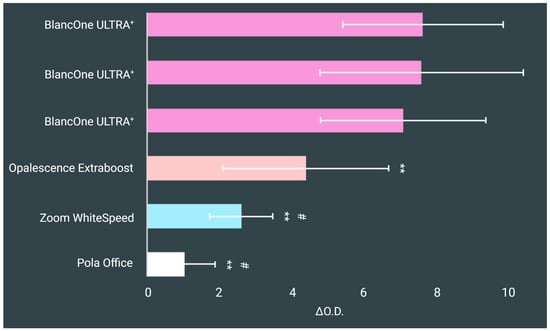
Figure 4.
Effect of professional bleaching treatments. Histograms show the means ± standard deviations of the spectrophotometric brightness measure (O.D.) carried out before and 48 h after the treatment. ** symbol indicates an extremely statistically significant difference (one-way ANOVA test followed by the Tukey HSD test), comparing the effects on teeth brightness with respect to BlancOne ULTRA+ product. # symbol indicates a statistically significant difference (one-way ANOVA test followed by the Tukey HSD test), comparing the effects on teeth brightness with respect to the Opalescence Extraboost product.
It should be noted that the means ± standard deviations of the brightness measurements taken before treatments did not show any statistically significant difference (p = 0.1531).
Comparison of the difference in means ± standard deviation for each treatment revealed that the difference between the BlancOne ULTRA+ effect and traditional market products designed for professional use was extremely statistically significant (p < 0.0001).
Additionally, an extremely statistically significant difference was observed between Opalescence Extraboost and Pola Office (p < 0.0001), as well as a significant difference when comparing Opalescence Extraboost and Zoom WhiteSpeed. However, there was no statistically significant difference between the effects of Pola Office and Zoom WhiteSpeed (p = 0.1060).
3.4. AFM Results
AFM images of high-resolution topography reveal the heterogeneity of the enamel surface across various areas and samples. To assess the impact of different bleaching treatments on surface topography, the same area was scanned before and after treatment, as depicted in Figure 5.
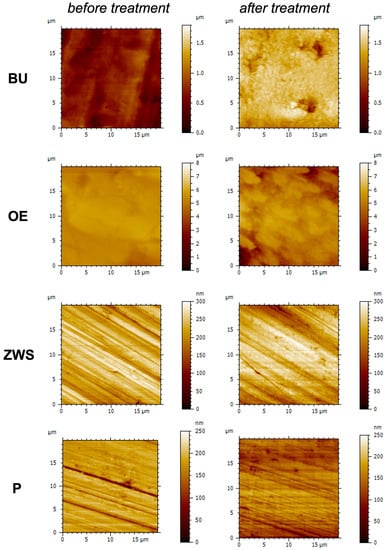
Figure 5.
High-resolution topography AFM images obtained in contact mode in deionized water before and after each treatment: BU = BlancOne Ultra+; OE = Opalescence Extraboost; ZWS = Zoom WhiteSpeed; P = Pola Office.
Table 3 presents the values (average ± standard error) for the “developed surface area ratio” (Sdr), which serves as a reliable parameter for characterizing surface roughness when dealing with a complex and variable surface texture.
Table 3.
Developed surface area (Sdr) calculated on AFM topography images scanned on different 20 × 20 µm2 areas scanned before and after the different bleaching treatments. The last column reports the difference, i.e., the change in surface roughness and texture caused by the bleaching. ** symbol indicates a statistically significant difference value (one-way ANOVA test followed by the Tukey HSD test).
Table 3 reports values (average ± standard error) for the “developed surface area ratio” (Sdr) as a robust parameter representative of surface roughness when a complex and variable surface texture is present. Results from Table 3 highlight that there is no statistically significant difference in the roughness of the sample treated with ZWS (p = 0.554), while the highest difference can be noticed in sample treated with OE.
3.5. Nanoindentation Results
Figure 6 illustrates the total penetration depth at the maximum loading force. Samples treated with Zoom and Boost exhibit a three-fold increase in penetration depth, under the same applied load of 5 mN, compared to the untreated sample (control) and the other treatments. This suggests a softening of the enamel layer, as evidenced by the lower elasticity and hardness values reported in Figure 7. The conducted ANOVA test, followed by the Tukey HSD test, highlighted a statistically significant difference (p < 0.01) in Zoom (ZWS)-, Boost (OE)-, and Pola (P)-treated samples’ Young’s modulus, where ZWS treatment led to the highest change, while the sample treated with ULTRA+ (BU) did not show any statistically significant difference (p = 0.899).
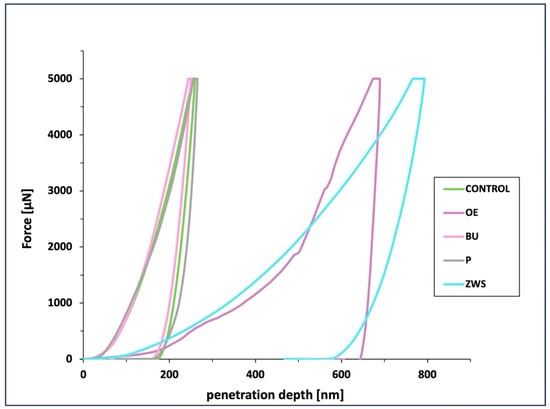
Figure 6.
Typical indentation curves for each of the bleaching treatments tested.
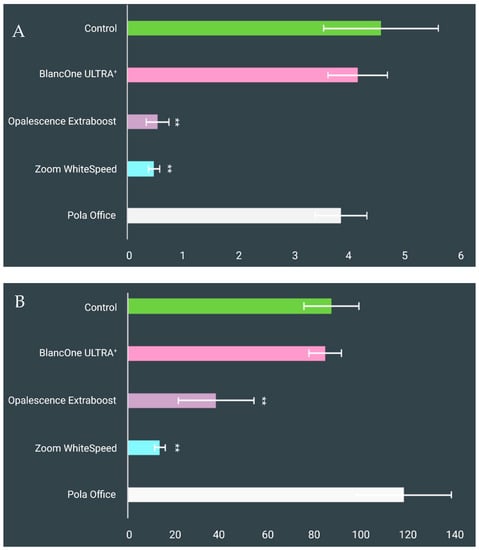
Figure 7.
Hardness changes (A) and Young’s modulus (B) after each bleaching treatment, compared to the untreated control. ** symbol indicates an extremely statistically significant difference (one-way ANOVA test followed by the Tukey HSD test) respect to Control; Blancone Ultra+ and Pola Office.
Additionally, a statistically significant difference (p < 0.01) was observed for ZWS- and OE-treated samples’ hardness, compared to the control. On the contrary, there was no statistically significant difference between the effects of P (p = 0.02) and BU treatments (p = 0.436).
4. Discussion
Dental staining emerges as a frequent concern presented by individuals seeking aesthetic enhancements. Alterations in tooth hue emerge from a blend of internal and external influences, encompassing factors as diverse as the assimilation of substances to the consumption of pigmented edibles, thus leading to discolouration [27]. The market offers a wide range of products that can be used directly by patients or through in-office treatments, and all claim to achieve the endpoint of a whiter, more attractive smile [28]. The final result’s accomplishment is the human perception of smile brightness after the treatment. However, this personal visual scale is not easy to replicate and “translated” into an actual numerical value. The optical density spectrophotometric analysis before and after bleaching treatment has been described as a supportive method to obtain a reliable value of the bleaching treatment effectiveness [29]. Saluja et al. [30] showed spectrophotometric analysis is more accurate and reproducible than human assessment. Gomez-Polo et al. [31] demonstrated that colourimeters are significantly less reliable than spectrophotometers and digital cameras. Indeed, Horn et al. [32] concluded that spectrophotometers achieved 80% reproducibility of the tooth shade than the human eye, which showed only 65% reproducibility. In our work, the spectrophotometrically evaluated data describe statistically significant differences for each bleaching treatment analysed. The treatments, therefore, appear effective in improving the brightness of the teeth, although there are differences in the quality and intensity of the final result. In fact, the comparison of each bleaching agent with BlancOne’s ULTRA+ highlights the higher performance of this product. Statistical analysis suggests a ranking of product efficacy with Opalescence Extraboost after BlancOne’s ULTRA+, and Pola Office and Zoom WhiteSpeed as the least reliable. Basically, the bleaching efficacy ranking is BlancOne’s ULTRA+ > Opalescence Extraboost > Zoom WhiteSpeed = Pola Office.
Noteworthy is BlancOne’s ULTRA+ product, which allows the best results with a lower percentage of HP than Opalescence Extraboost, and with HP similar to Pola Office. Furthermore, BlancOne’s ULTRA+ requires the shortest application times on the tooth surfaces compared to the other three products analysed and reduced number of treatments. ULTRA+ by BlancOne works through a process of chemical photoactivation of the gel using specific wavelengths of light, which in turn can accelerate the release of free radicals and singlet oxygen [27]. However, as suggested by the lower bleaching effectiveness of Zoom WhiteSpeed, photoactivation per se is not enough, and a good aesthetic result occurs through an efficient synergy between a specific wavelength of light energy and the ability of the photoactivator to absorb it. Therefore, despite more specific analyses having to be conducted, BlancOne’s ULTRA+ formulation containing three natural photoactivators in synergy with the 430–490 nm wavelength range could cause a more efficient release of free radicals and singlet oxygen to allow faster and effective bleaching results. On the other hand, Zoom WhiteSpeed is based on Photo-Fenton photoactivation [33].
Hydrogen peroxide bleaching products are well established for cosmetic tooth bleaching, but the use of these substances in home cosmetic products is quite limited [34]. Conversely, in professional treatments, high concentrations of HP are used, with possible negative consequences on soft and hard tissues [35]. Indeed, a fundamental aspect is the effect of the bleaching agent on the structure of the enamel. In 2017, a comprehensive review [9] surfaced, presenting findings from a range of randomized clinical trials investigating the impact of utilizing 10% carbamide peroxide gel for at-home teeth bleaching. The focus was on assessing potential shifts in enamel microhardness, a factor influencing oral health resilience against the pressures of chewing. The comprehensive analysis indicated negligible alterations in enamel microhardness when employing the 10% carbamide peroxide bleaching gel over 7-, 14-, and 21-day spans. Additionally, de Souza Costa et al. [36] described that bleaching with 38% HP for 45 min causes irreversible pulp damage in lower incisors but not in premolars. Correlation among increased tooth sensitivity, alteration in the surface topography of enamel, and the time and the number of treatments suggest that with a 10% higher HP concentration, it is necessary to avoid prolonged and long-term bleaching use [37]. Of note, shortening the contact time of 35% HP to nearly 5 min reduces trans-enamel and trans-dentinal cytotoxicity to pulp cells [38]. Lastly, Cintra et al. [39] demonstrated that the number of bleaching sessions affects pulp tissue damage in rat teeth. Essentially, after 5 sessions with 35% HP, necrotic areas in the pulp tissue (the second third of the radicular pulp) and intense inflammation at the apical third were induced in the animals treated [39]. All our analysed products exhibit more than 10% HP. However, among the four bleaching agents tested in this study, BlancOne ULTRA+ is the only one that requires a maximum of three cycles of 8 min to release free radicals and singlet oxygen and perform the best bleaching result. Actually, there are certain weaknesses in our work. Indeed, despite the suitability of the bovine dental sample that was recently extensively reported [40], some differences could be experienced in vital human teeth and particularly concerning the long effects and a faster return of the teeth towards a darker shade. However, the work shows strengths. The choice of samples coming from animals of the same breeding and same age which were reared similarly and biologically and without antibiotics has allowed us, as demonstrated by the statistical analysis, to have a uniform brightness before the treatments, to better compare results after them. Indeed, a statical power higher than 99% on the primary variable results supports it. Additionally, the design of a bioreactor, which, as previously shown, mimics the oral cavity [17], and the use of a spectrophotometer to measure the bleaching effect, support the reliability of our data.
As can be seen in Table 2, only the ULTRA+ product has a pH slightly below the neutral threshold.
This could lead one to think that being a more acidic agent than the others, it could cause superficial damage to the enamel surfaces. However, these are not the answers obtained from the tests performed. Products with a neutral pH or above the neutrality threshold are balanced with buffer substances capable of raising the pH and keeping it stable over the working time [25].
However, as described by H. Betke et al. [26], the additives used to buffer the bleaching agents are able to dramatically increase the dehydration of dental tissues such as enamel and dentin, especially in bleaching treatments that involve very long tooth–gel contact times.
Also to be considered is the description made by Ramos et al. [41], who highlight that bleaching gel products with a high concentration of hydrogen peroxide undergo a change in state before releasing the reactive oxygen species, passing from a gelled state to a liquid one. This liquid phase can determine the ease of penetration within the hard tissues of the tooth, thus increasing the risk of sensitivity perceived by patients.
From the AFM topography images, it can be observed that all bleaching treatments, with the exception of ZOOM, tend to modify the surface texture, increasing the surface roughness, which is known to promote biofilm formation since it provides more area for bacterial adhesion while protecting bacteria from shear forces and saliva flow [42,43,44,45]. In particular, BOOST induces a much higher increase in surface roughness when compared to the others.
Nanoindentation measurements showed a softening of the enamel surface layer with ZOOM and BOOST treatments, indicated by the considerably lower values of hardness and Young’s modulus when compared to the untreated teeth, as reported in Figure 7, while POLA- and UTRA+-treated samples maintained values comparable to the untreated control.
5. Conclusions
In conclusion, we can state that from the results obtained, all the bleaching products tested can improve the brightness of teeth after treatment, even though they have different pH, application times, and activation methods. BlancOne, Zoom, and Pola can slightly modify the surface roughness of the dental enamel after treatment, while remaining in a modification index on the nanometric scale [46]. BOOST was the only one to present much more invasive structural modifications of surface roughness, which can be correlated to a decrease in surface hardness due to the consequent alterations of the mechanical properties of the material. Although controlled randomized clinical trials are required to confirm our findings, preliminary data on an ex vivo animal model support a better performance–safety relationship for BlancOne ULTRA+.
Author Contributions
Conceptualization, C.P., A.L. and A.A.; methodology, C.P.; software, A.A., M.S., E.D., R.R., D.B., L.C. and F.B.; validation, A.L. and A.A.; formal analysis, A.A.; investigation, C.P.; resources, F.B.; data curation, A.A. and D.B.; writing—original draft preparation, C.P., A.A. and N.D.A.; writing—review and editing, A.A.; supervision, A.L., E.D., R.R., L.C. and F.B.; funding acquisition, C.P. and S.B. All authors have read and agreed to the published version of the manuscript.
Funding
This research received no external funding.
Institutional Review Board Statement
Not applicable.
Informed Consent Statement
Not applicable.
Data Availability Statement
Not applicable.
Conflicts of Interest
The authors declare no conflict of interest.
References
- Kwon, S.-R.; Ko, S.-H.; Greenwall, L. Tooth Whitening in Esthetic Dentistry; Quintessence Publishing Company Limited: Berlin, Germany, 2009. [Google Scholar]
- Epple, M.; Meyer, F.; Enax, J. A Critical Review of Modern Concepts for Teeth Whitening. Dent. J. 2019, 7, 79. [Google Scholar] [CrossRef] [PubMed]
- Meireles, S.S.; Goettems, M.L.; Dantas, R.V.F.; Della Bona, Á.; Santos, I.S.; Demarco, F.F. Changes in oral health related quality of life after dental bleaching in a double-blind randomized clinical trial. J. Dent. 2014, 42, 114–121. [Google Scholar] [CrossRef]
- Pavicic, D.; Kolceg, M.; Lajnert, V.; Pavlic, A.; Brumini, M.; Spalj, S. Changes in Quality of Life Induced by Tooth Whitening are Moderated by Perfectionism: A Randomized, Double-Blind, Placebo-Controlled Trial. Int. J. Prosthodont. 2018, 31, 394–396. [Google Scholar] [CrossRef]
- Marshall, G.W., Jr.; Marshall, S.J.; Kinney, J.H.; Balooch, M. The dentin substrate: Structure and properties related to bonding. J. Dent. 1997, 25, 441–458. [Google Scholar] [CrossRef]
- Gillam, D.G. Dentine Hypersensitivity: Advances in Diagnosis, Management, and Treatment; Springer: Berlin/Heidelberg, Germany, 2015. [Google Scholar]
- Schulte, J.R.; Morrissette, D.B.; Gasior, E.J.; Czajewski, M.V. The Effects of Bleaching Application Time on the Dental Pulp. J. Am. Dent. Assoc. 1994, 125, 1330–1335. [Google Scholar] [CrossRef]
- Elfallah, H.M.; Swain, M.V. A review of the effect of vital teeth bleaching on the mechanical properties of tooth enamel. N. Z. Dent. J. 2013, 109, 87–96. [Google Scholar]
- Zanolla, J.; Marques, A.; da Costa, D.C.; de Souza, A.S.; Coutinho, M. Influence of tooth bleaching on dental enamel microhardness: A systematic review and meta-analysis. Aust. Dent. J. 2017, 62, 276–282. [Google Scholar] [CrossRef] [PubMed]
- Minoux, M.; Serfaty, R. Vital tooth bleaching: Biologic adverse effects-a review. Quintessence Int. 2008, 39, 645–659. [Google Scholar]
- Dias, S.; Mata, A.; Silveira, J.; Pereira, R.; Putignano, A.; Orsini, G.; Monterubbianesi, R.; Marques, D. Hydrogen Peroxide Release Kinetics of Four Tooth Whitening Products—In Vitro Study. Materials 2021, 14, 7597. [Google Scholar] [CrossRef] [PubMed]
- Kury, M.; Antonialli, F.M.; Soares, L.E.S.; Tabchoury, C.P.M.; Giannini, M.; Florez, F.L.E.; Cavalli, V. Effects of violet radiation and nonthermal atmospheric plasma on the mineral contents of enamel during in-office dental bleaching. Photodiagnosis Photodyn. Ther. 2020, 31, 101848. [Google Scholar] [CrossRef]
- Soares, F.Z.M.; Follak, A.; da Rosa, L.S.; Montagner, A.F.; Lenzi, T.L.; Rocha, R.O. Bovine tooth is a substitute for human tooth on bond strength studies: A systematic review and meta-analysis of in vitro studies. Dent. Mater. 2016, 32, 1385–1393. [Google Scholar] [CrossRef]
- Monterubbianesi, R.; Tosco, V.; Bellezze, T.; Giuliani, G.; Özcan, M.; Putignano, A.; Orsini, G. A Comparative Evaluation of Nanohydroxyapatite-Enriched Hydrogen Peroxide Home Bleaching System on Color, Hardness and Microstructure of Dental Enamel. Materials 2021, 14, 3072. [Google Scholar] [CrossRef] [PubMed]
- Soares, C.J.; Pizi, E.C.G.; Fonseca, R.B.; Martins, L.R.M. Influence of root embedment material and periodontal ligament simulation on fracture resistance tests. Braz. Oral Res. 2005, 19, 11–16. [Google Scholar] [CrossRef]
- Gallie, A. An introduction to air polishing and its benefits. Dent. Nurs. 2014, 10, 384–388. [Google Scholar] [CrossRef]
- Pasquale, C.; De Angelis, N.; Dellacasa, E.; Raiteri, R.; Barberis, F.; Lagazzo, A.; Benedicenti, S.; Amaroli, A. A Comparative Study on the Effect of Peri-Implant Infection Management Lasers (1064-nm Q-Switch Nd:YAG, 1064-nm Nd:YAG and 980-nm Diode) on Titanium Grade 4 Surface. Appl. Sci. 2022, 13, 125. [Google Scholar] [CrossRef]
- Dabbagh, S.; Hardan, L.; Kassis, C.; Bourgi, R.; Devoto, W.; Zarow, M.; Jakubowicz, N.; Ghaleb, M.; Kharouf, N.; Dabbagh, M.; et al. Effect of Intraoral Humidity on Dentin Bond Strength of Two Universal Adhesives: An In Vitro Preliminary Study. Coatings 2022, 12, 712. [Google Scholar] [CrossRef]
- Oliveira Tavares, N.R.N.; da Mata Galvão, A.; Dietrich, L.; Carvalho, R.F.; Silva, R.S.; Faria e Silva, A.L.; da Silva, G.R. Can ozone or violet light improve the color change or physicochemical properties of hydrogen peroxide-bleached tooth? Braz. Dent. J. 2021, 32, 19–29. [Google Scholar] [CrossRef]
- Dietrich, L.; de Assis Costa, M.D.M.; Blumenberg, C.; Nascimento, G.G.; Paranhos, L.R.; da Silva, G.R. A meta-analysis of ozone effect on tooth bleaching. Sci. Rep. 2021, 11, 13177. [Google Scholar] [CrossRef] [PubMed]
- Stout, K.J.; Blunt, L.; Dong, W.P.; Mainsah, E.; Luo, N.; Mathia, T.; Sullivan, P.J.; Zahouani, H. The Development of Methods for the Characterisation of Roughness in Three Dimensions; European Report EUR 15178 EN; Publications of the European Communities: Luxembourg, 1993; ISBN 0 7044 1313 2. [Google Scholar]
- Oliver, W.C.; Pharr, G.M. An improved technique for determining hardness and elastic modulus using load and displacement sensing indentation experiments. J. Mater. Res. 1992, 7, 1564–1583. [Google Scholar] [CrossRef]
- Kan, Q.; Yan, W.; Kang, G.; Sun, Q. Oliver–Pharr indentation method in determining elastic moduli of shape memory alloys—A phase transformable material. J. Mech. Phys. Solids 2013, 61, 2015–2033. [Google Scholar] [CrossRef]
- Rosner, B. Fundamentals of Biostatistics, 8th ed.; Cengage Learning: Boston, MA, USA, 2015; p. 927. ISBN 978-1305268920. [Google Scholar]
- Alkahtani, R.; Stone, S.; German, M.; Waterhouse, P. A review on dental whitening. J. Dent. 2020, 100, 103423. [Google Scholar] [CrossRef] [PubMed]
- Betke, H.; Kahler, E.; Reitz, A.; Hartmann, G.; Lennon, Á.; Attin, T. Influence of Bleaching Agents and Desensitizing Varnishes on the Water Content of Dentin. Oper. Dent. 2006, 31, 536–542. [Google Scholar] [CrossRef] [PubMed]
- Li, Z.; Wu, Z.; Wang, J.; Huang, M.; Lin, M. Expanding the applications of photodynamic therapy—Tooth bleaching. Clin. Oral Investig. 2022, 26, 2175–2186. [Google Scholar] [CrossRef] [PubMed]
- Schlafer, S.; Poulsen, P.N.; Johansen, J.; Trap, L.; Leite, F.R.M. The whitening effect of single brushing with blue-covarine containing toothpaste—A randomized controlled trial. J. Dent. 2021, 105, 103559. [Google Scholar] [CrossRef] [PubMed]
- Ishikawa-Nagai, S.; Yoshida, A.; da Silva, J.D.; Miller, L. Spectrophotometric Analysis of Tooth Color Reproduction on Anterior All-Ceramic Crowns: Part 1: Analysis and Interpretation of Tooth Color. J. Esthet. Restor. Dent. 2010, 22, 42–52. [Google Scholar] [CrossRef]
- Shetty, N.; Saluja, I.; Shenoy, R.; Pangal, S.N. Evaluation of the efficacy of diode laser in bleaching of the tooth at different time intervals using spectrophotometer: An in vitro study. J. Conserv. Dent. 2022, 25, 166–172. [Google Scholar] [CrossRef]
- Gómez-Polo, C.; Gómez-Polo, M.; Celemin-Viñuela, A.; De Parga, J.A.M.V. Differences between the human eye and the spectrophotometer in the shade matching of tooth colour. J. Dent. 2014, 42, 742–745. [Google Scholar] [CrossRef]
- Horn, D.J.; Bulan-Brady, J.; Hicks, M.L. Sphere spectrophotometer versus human evaluation of tooth shade. J. Endod. 1998, 24, 786–790. [Google Scholar] [CrossRef]
- Gamarra, V.S.; Zelada, G.C. Efecto del peróxido de hidrógeno al 25% sobre la microdureza del esmalte dental. Odontol. Sanmarquina 2013, 16, 25–28. [Google Scholar] [CrossRef]
- Horn, B.A.; Bittencourt, B.F.; Gomes, O.M.M.; Farhat, P.A. Clinical evaluation of the whitening effect of over-the-counter dentifrices on vital teeth. Braz. Dent. J. 2014, 25, 203–206. [Google Scholar] [CrossRef][Green Version]
- Joiner, A. Whitening toothpastes: A review of the literature. J. Dent. 2010, 38 (Suppl. S2), e17–e24. [Google Scholar] [CrossRef] [PubMed]
- de Souza Costa, C.A.; Riehl, H.; Kina, J.F.; Sacono, N.T.; Hebling, J. Human pulp responses to in-office tooth bleaching. Oral Surg. Oral Med. Oral Pathol. Oral Radiol. Endo. 2010, 109, e59–e64. [Google Scholar] [CrossRef] [PubMed]
- Tredwin, C.J.; Naik, S.; Lewis, N.J.; Scully, C. Hydrogen peroxide tooth-whitening (bleaching) products: Review of adverse effects and safety issues. Br. Dent. J. 2006, 200, 371–376. [Google Scholar] [CrossRef] [PubMed]
- Soares, D.G.; Basso, F.G.; Hebling, J.; de Souza Costa, C.A. Concentrations of and application protocols for hydrogen peroxide bleaching gels: Effects on pulp cell viability and whitening efficacy. J. Dent. 2014, 42, 185–198. [Google Scholar] [CrossRef]
- Cintra, L.T.A.; Benetti, F.; de Souza Facundo, A.C.; Ferreira, L.L.; Gomes-Filho, J.E.; Ervolino, E.; Rahal, V.; Briso, A.L.F. The Number of Bleaching Sessions Influences Pulp Tissue Damage in Rat Teeth. J. Endod. 2013, 39, 1576–1580. [Google Scholar] [CrossRef]
- Ribeiro, J.S.; da Silva Barboza, A.; Cuevas-Suárez, C.E.; da Silva, A.F.; Piva, E.; Lund, R.G. Novel in-office peroxide-free tooth-whitening gels: Bleaching effectiveness, enamel surface alterations, and cell viability. Sci. Rep. 2020, 10, 10016. [Google Scholar] [CrossRef]
- Ramos, E.; Calatrava, S.F.; Jiménez, L. Bleaching with hydrogen peroxide. A review. Afinidad 2008, 65, 537. [Google Scholar]
- Quirynen, M.; Dierickx, K.; van Steenberghe, D. Effects of surface roughness and free energy on oral bacterial adhesion. In Handbook of Bacterial Adhesion: Principles, Methods and Applications; An, Y.H., Friedman, R.J., Eds.; Humana Press: Totowa, NJ, USA, 2000; pp. 91–102. [Google Scholar]
- Murariu, A.; Vasluianu, R.; Matricala, L.; Stoica, I.; Forna, N.C. In vitro Evaluation of Morphological Integrity of Dental Enamel Exposed to Carbamide Peroxide-based Bleaching Agent. Rev. Chim. 2016, 67, 2103–2105. [Google Scholar]
- Koldehoff, J.; Swain, M.V.; Schneider, G.A. Influence of water and protein content on the creep behavior in dental enamel. Acta Biomater. 2023, 158, 393–411. [Google Scholar] [CrossRef]
- Seghi, R.R.; Denry, I. Effects of External Bleaching on Indentation and Abrasion Characteristics of Human Enamel in vitro. J. Dent. Res. 1992, 71, 1340–1344. [Google Scholar] [CrossRef]
- Polydorou, O.; Scheitza, S.; Spraul, M.; Vach, K.; Hellwig, E. The effect of long-term use of tooth bleaching products on the human enamel surface. Odontology 2018, 106, 64–72. [Google Scholar] [CrossRef] [PubMed]


Disclaimer/Publisher’s Note: The statements, opinions and data contained in all publications are solely those of the individual author(s) and contributor(s) and not of MDPI and/or the editor(s). MDPI and/or the editor(s) disclaim responsibility for any injury to people or property resulting from any ideas, methods, instructions or products referred to in the content. |
© 2023 by the authors. Licensee MDPI, Basel, Switzerland. This article is an open access article distributed under the terms and conditions of the Creative Commons Attribution (CC BY) license (https://creativecommons.org/licenses/by/4.0/).