Review

Medical Application of Big Data: Between Systematic Review and Randomized Controlled Trials

1
Department of Biomedical Informatics, College of Medicine, Konyang University, Daejeon 35365, Republic of Korea
2
Department of Anesthesiology and Pain Medicine, Soonchunhyang University Bucheon Hospital, Soonchunhyang University College of Medicine, Bucheon 14584, Republic of Korea
3
Department of Urology, Soonchunhyang University Seoul Hospital, Soonchunhyang University College of Medicine, Seoul 04401, Republic of Korea
*
Author to whom correspondence should be addressed.
These authors contributed equally to this work.
Appl. Sci. 2023, 13(16), 9260; https://doi.org/10.3390/app13169260
Submission received: 17 July 2023 / Revised: 11 August 2023 / Accepted: 14 August 2023 / Published: 15 August 2023
(This article belongs to the Special Issue Recent Advances in Big Data Analytics)

Abstract

:

Featured Application

Systematic review and meta-analysis deserves to be considered the gold standard of evidence-based medicine in the era of big data.

Abstract

In terms of medical health, we are currently living in the era of data science, which has brought tremendous change. Big data related to healthcare includes medical data, genome data, and lifelog data. Among medical data, public medical data is very important for actual research and medical policy reflection because it has data on a large number of patients and is representative. However, there are many difficulties in actually using such public health big data and designing a study, and conducting systematic review (SR) on the research topic can help a lot in the methodology. In this review, in addition to the importance of research using big data for the public interest, we will introduce important public medical big data in Korea and show how SR can be specifically applied in research using public medical big data.

1. Introduction

Most researchers aim to conduct RCTs (randomized controlled trial) in their fields of interest. Of course, RCTs represent the core of research, and they are the type of study that can best reveal causal relationships in disease [1]. However, RCTs unfortunately require a lot of research funds, and even if such funds are available, it is difficult to proceed if the corresponding drug and placebo are not provided. These conditions make it very difficult for young and less-established researchers to conduct RCTs. One way to obtain research funds to conduct an RCT is to conduct a pilot RCT that obtains highly promising results. RCTs are the highest level of EBM (evidence-based medicine), while systematic reviews (SRs) can also provide the most solid evidence when RCTs are used as targets [2,3]. The problem is that researchers have to accept the reality that they cannot all conduct the RCTs that they always wish to conduct. There are also certain research topics that cannot be explored using RCTs. An alternative research method for such cases is an observational study, and by designing and analyzing a retrospective cohort using the big data that we want to talk about today, i.e., the data of the Insurance Corporation, high evidence can be achieved, although it is still not equivalent to RCTs. When one practices medicine, it is recommended that they follow the treatment guidelines, which are established based on evidence. Therefore, a retrospective study using big data is a very important starting point for research topics for which RCTs cannot be conducted or for when a new RCT is being devised. The present review includes definitions and types of big data in the medical health area, the current application status of big data in the medical health area, features of the National Health Claimed Data for medical research, real applications of the Korean National Health Claimed Data for medical research, and EBM using SR (systematic review).

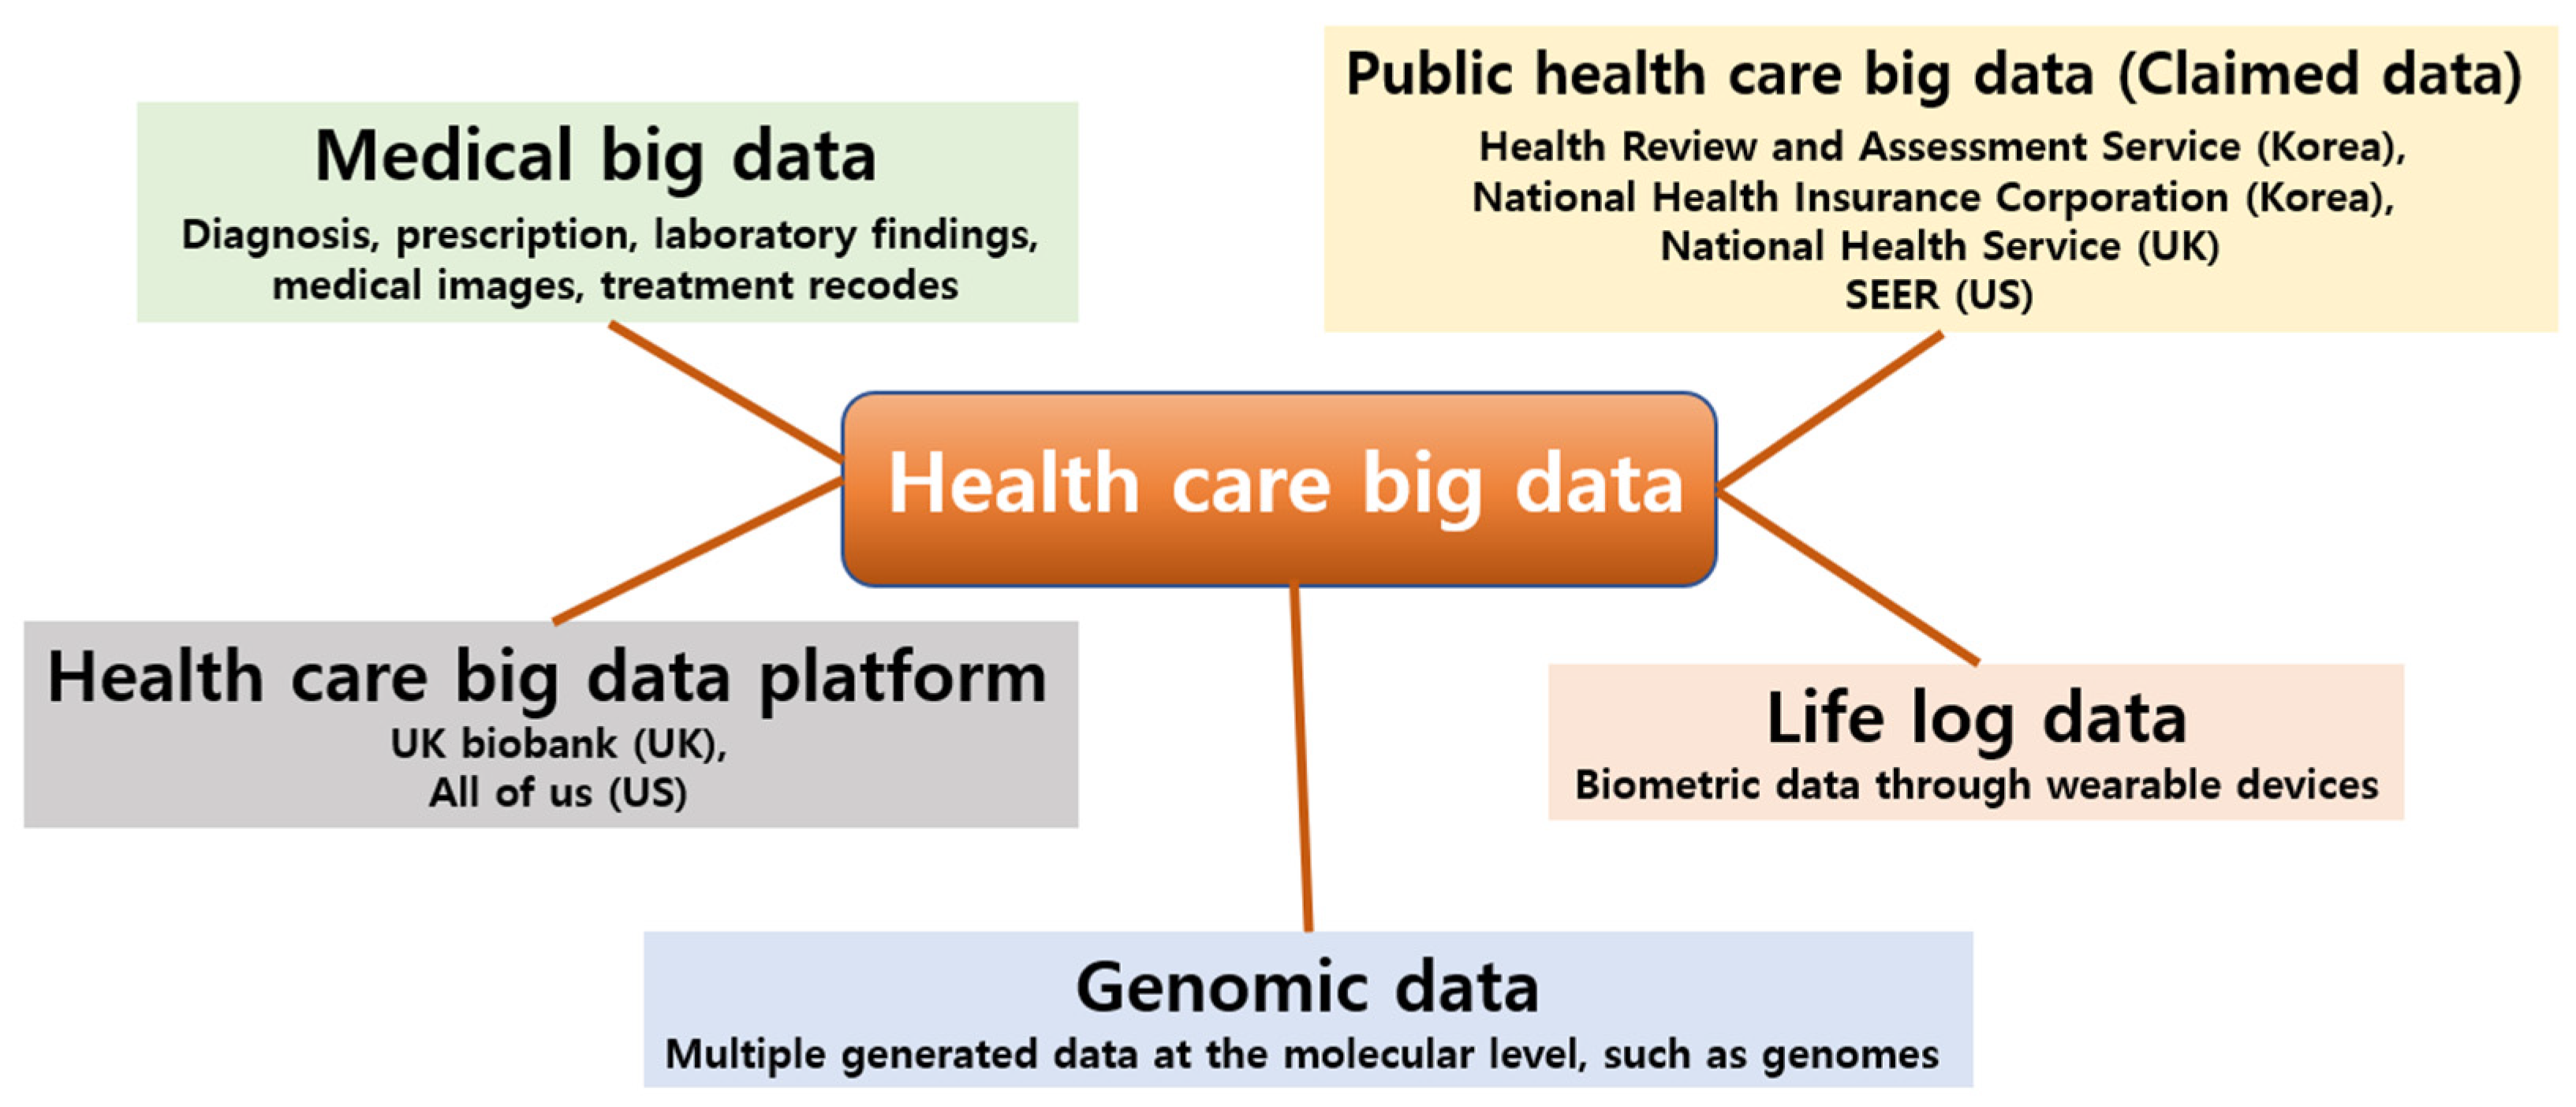
2. Definition and Types of Big Data in Medical Health Area

Big data can be explained in two ways [4]: first, for technology itself, it means analyzing skills to cover huge data in ways that would previously have been impossible with classic analytic tools; second, for huge data in itself. Big data can be categorized into classical (structured) and non-classical (unstructured) data. Non-classical data without characteristics means non-numerical data including pictures, sound, words, etc. The main purposes of using big data are to make policies for public health, medical institutions, business, and research. However, big data also involves the risk of it being used in ways other than its intended purpose.
Healthcare big data includes medical data, genomic data, and life-log data generated by humans during their lives, and it is scattered along a very wide range and on a huge scale (Figure 1), so it is essential to build an integrated platform that considers precise measurement, transmission, storage, and security methods for the proper use of such data [5,6]. Healthcare complexity arises due to the range of health conditions and their co-morbidities, varied treatments and outcomes, and intricate study designs, analytical methods, and data interpretation approaches in healthcare data management [7]. As a result, the role of domain knowledge can be dominant in both data analysis and interpretation of results [8]. There have been many researchers’ definitions of medical big data, and some have categorized medical big data based on who owns the data compared to traditional clinical data [9]. Basically, medical big data is often difficult to access, and most researchers in the medical field are hesitant to share their data due to the risk of data misuse by the other parties [10]. In addition, medical big data is relatively structured because it adheres to protocols regarding the collection of an individual’s medical information [11].
Lee and Yoon [12] well-summarized medical big data versus traditional classical statistical analysis. The main difference between the two data types is that traditional classical statistical analysis focuses on hypothesis testing, while medical big data analysis focuses on hypothesis generating. In addition, the research question is characterized by the fact that traditional classical statistical analysis is conducted to interpret the causal relationship, while medical big data analysis focuses on the correlation between variables or identification of specific patterns [12]. In fact, the power of big data lies in identifying correlations, not necessarily in establishing the significance or meaning of these correlations [13].
The potential value of medical big data has been demonstrated in: (1) predictive modelling for risk and resource use; (2) population management; (3) drug and medical device safety surveillance; (4) disease and treatment heterogeneity; (5) precision medicine and clinical decision support; (6) quality of care and performance measurement; (7) public health; and (8) research applications [14]. It is expected that the analysis of healthcare big data using artificial intelligence will facilitate the identification of specific patterns of diseases that we want to know about as well as the prevention, management, and treatment of diseases.

3. Current Application Status of Big Data in Medical Health Area

Big data has come to be increasingly recognized for its potential benefits in public health. In 2011, the UN (United Nations) declared the issues of ‘NCD Crisis’ and ‘GOAL 25 by 25’ [15]. NCD (Noncommunicable disease) refers to chronic diseases including cancer, cardiovascular disease, diabetes, dementia, and so on. These NCDs are increasingly being observed in the public health area compared to CD (communicable disease) due to the high prevalence and mortality of NCD, which is increasing with sharp speed even in proportion to the status of the aging society. The UN has declared that all efforts must be made to reduce health inequality in NCDs. Many research groups have now started conducting studies using big data to investigate the global burden of NCDs and inequality in NCDs. Moreover, the terminology ‘Health care crisis’ has appeared in recent days [16]. Korea’s average growth rate in individuals’ medical expenses is high among OECD (Organization for Economic Co-operation and Development) countries [17]. A similar concept as that which was investigated with evidence-based medicine is now being combined with research using big data.
Aside from its important role in public health, big data is also being widely used in the era of the health care industry and the focus on profitmaking. Medical industrialization is evolving because the delivery of medical care in an analogue style is expeditiously changing into that in a digital style. Medical industrialization using big data has launched a new era including the development of diagnostic strategies or the development of specific target agents.
Among the medical big data, the most recent one we encountered is the World Health Organization’s (WHO) medical big data. Through the recent COVID-19 pandemic, the WHO’s huge big data platform has been providing all of the information regarding the current status of the COVID-19 outbreak and the death rate in each country in real time. The WHO’s World Health Data Hub is a comprehensive digital platform for global health data. It provides end-to-end solutions to collect, store, analyze, and share [18]. Not only COVID-19, but also various disease status including NCD were reported annually by WHO.
With the utilization of big data, the most crucial issue is personal de-identification, which is closely related to ethical concerns. In the US, the health insurance portability and accountability act was enacted as a law in 1996 [19]. This mandates that personal information must be converted by personal de-identification, which is mainly performed by health care clearinghouses. To manage transparent big data, it is necessary to manage the government-oriented system.

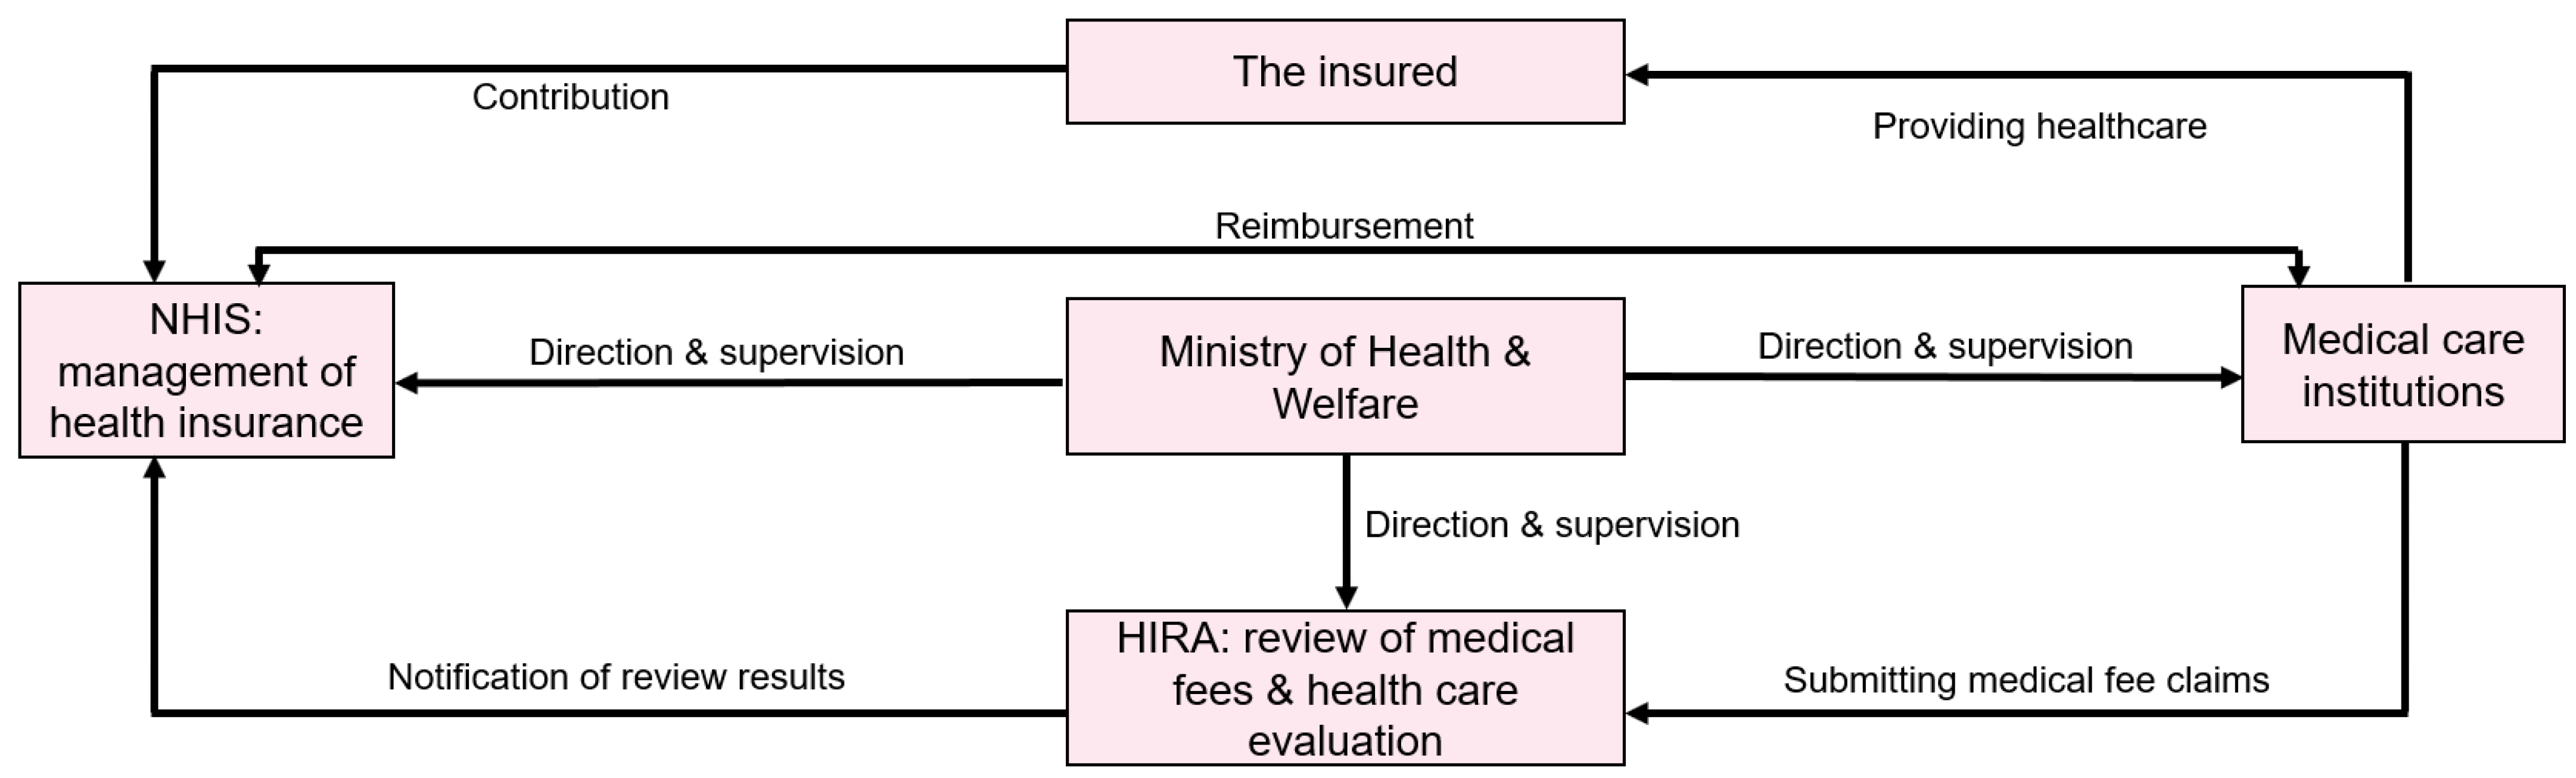
4. Korean National Health Claimed Data for Medical Research

Korea has a National Health Insurance Database system. This data system allows for full survey of the entire population of Korea. There are two main National Health Insurance Databases: National Health Insurance Service (NHIS) and Health Insurance Review and Assessment Service (HIRA) (Figure 2). The main merits of these databases include their large statistical power that allow for even small statistical differences to be found. They also have low levels of statistical errors and high levels of reproducibility. However, they are claimed data, which means that they are not originally created for research, so they require advanced processing skills. The biggest advantage of Korea’s medical big data is that it accommodates 99% of national data in the case of insurance claim data. In addition to individually accessing, applying for, and using data from nine institutions in the health and medical field, we are carrying out a project to open the data of nine institutions in the health and medical field to researchers so that they can be combined on an individual basis and used for public-purpose research. Therefore, it has the advantage that individual clinical records can be tracked more specifically [20].

5. Advantages and Disadvantages of Big Data Research Using Industrial Data

In Korea, there are various types of big data. The most commonly encountered big data are Health Review and Assessment Service data and Health Insurance Corporation data. Of course, there are also data from the National Health and Nutrition Examination Survey [21], the National Statistical Office, and the Korea Centers for Disease Control and Prevention. The biggest advantage of this is that it is easy to verify statistical significance because much more data can be obtained than can be obtained from hospitals. However, it can also be a major drawback. For example, in big data research, even a slight change in methodology often changes the direction of the results.
In Korea, the National Health Insurance Service operates a system that reduces some of the deductibles for patients with rare diseases, cancer, and other severe and intractable diseases that involve high medical expenses. Rare and intractable diseases [22] are defined by specific V codes, and this system of definition has the advantage of leading to very convenient disease arrangement. The incidence and prevalence of these diseases can be easily obtained simply by organizing the disease codes (Table 1). For example, when searching for organ transplant patients, it is possible to quickly find them using specific codes such as kidney transplants (V005), liver transplants (V013), pancreatic transplants (V014), and heart transplants (V015) without having to find the types of individual organ-specific diseases by manually using the ICD code. Moreover, when searching for dementia patients, various types of dementia diseases can be found in the ICD code (F00.1–F01.3), but the overall status can be quickly examined using the specific code of V810.
The big data research we conducted mainly uses health insurance corporation data. The problem is that these health insurance data themselves are not created for research purposes, so they need to be processed before being used for such purposes.
For diseases other than these V codes, an operational definition is required, which requires a verification procedure. In most cases, a retrospective cohort is created, and many studies [23,24] are conducted to analyze specific clinical indicators that occur when there is a risk of exposure and when there is no risk of exposure. Therefore, even if the operational definition is well performed, the results of the study can still be substantially influenced by each detailed methodology, such as the definition of exposure and the setting of the incubation period after exposure.

6. Big Data Research Design

Big data analytics is largely based on traditional statistical analysis and machine learning (ML). The boundaries between statistical inference and ML are debatable, but while some methods fall into one or the other, many are used in both [25]. Statistics focuses on making inferences to prove a specific hypothesis, while ML is about finding generalizable patterns of prediction [26].
Big data with more variables (features) than observed data leads to an increase in dimensionality, which means that there are more variables to control, but the observed data is relatively limited, and there are more and more empty spaces between the variables due to limited data, so the performance of the entire model will eventually decrease [7,27]. In other words, it is a major concern in big data analysis to consider the decrease in model performance caused by the curse of dimensionality compared to the actual benefit of increasing data. In general, the overfitting of the model due to too many variables causes the problem of generalization, so the curse of dimensionality is solved by reducing the dimensionality [28] or selecting the variables [29].
The most important factor in big data research is applying the right methodology. So how do we apply the right methodology? The answer lies in SR. We conduct SR to know the past of a certain study, study using big data to understand the current trend, and apply RCT to study preventive drugs or treatment that will be needed in the future. Conducting SR allows one to consider the design of all studies on the subject and know the strengths and weaknesses of each. Moreover, thorough qualitative evaluation of previous studies—whether they be observational studies or RCTs—can teach one how to overcome the shortcomings of such studies. Fortunately, disease codes are standardized and commonly used worldwide, and many papers using insurance data have been introduced worldwide, which is of great help in establishing research methodologies.
Here we suggest the important Q/As:
Q: What is the first step to perform a research using medical health claimed data?
A: Choose the data base you want to use. Incidence and mortality rates of specific diseases, or complications rates, etc. can be progressed through individual database access. However, if you plan a retrospective cohort study observed over a long follow-up period, it is convenient to use a platform that integrates multiple databases.
Q: Are there any restrictions on individual database access? Or are there any restrictions on access to the platform?
A: In Korea, access for research purposes is allowed for non-commercial research in accordance with the Health and Medical Technology Promotion Act. This is applied to both individual data access and platforms, and in the case of foreign countries, use access is determined after protocol review in the case of research purposes.
Q: Why is SR necessary for research using medical claims data?
A: Due to the nature of observational research, it is not easy to unify the methodology of research, and there is a risk that results may vary depending on the methodology. Re-searchers can determine the optimal methodology through SR and avoid possible bias.
Q: What should be kept in mind as a researcher when researching medical big data?
A: Since methodology is important in observational studies, the accuracy of the definition of the disease, the accuracy of the definition of occurrence, and above all, the setting of the control group and index date are the most important.
Q: How could we use SR in designing an observational study using medical big data specifically?
A: In the research of a liver donor study using big data platforms, including Korea Centers for Disease Control and Prevention, Health Review and Assessment Service, National Statistical Office, Health Insurance claim data, SR was performed (Figure 3) [30]. Figure 3a revealed that both OR and HR showed no significant difference between living liver donors and health controls. However, there were inconsistent methodological designs which represented a high risk of bias. Hence, after performing scrupulous reviews for qualitative analysis using ROBIN1 using own-judgment criteria for this study (Table 2), qualitative analysis was completed (Figure 3b). By excluding items from studies with a high risk of bias and adopting items from studies with a low bias, a stable methodology for selection and exclusion of subjects and setting and matching of control groups could be designed (Figure 4) [31].
During quantitative analysis, almost all of the included studies carried a large population size and long period. These kinds of outcomes compared with controls are most appropriately analyzed using HRs and ORs. The random-effects model published by DerSimonian and N. Laird [32] was used to determine the pooled overall incidence or mortality ratios with 95% confidence intervals for outcomes. Statistical heterogeneity was evaluated by the Cochran’s Q test and the I2 statistic. Meta-regression analysis was conducted for each moderator [33].
Many researchers do not spend much time in the process of qualitative evaluation. Qualitative evaluation of RCTs [34] can be completed relatively easily, but qualitative evaluation of observational studies is not easy. A qualitative evaluation can only be performed properly when the criteria for the methodology for each item are established [35,36]. We believe that an appropriate scientific methodology can only be created by following such a qualitative evaluation. Figure 3B evaluates how much the risk of bias is for the seven evaluation items. The problem here is that it is necessary to develop and evaluate indicators that can rank the risk for each of the seven evaluation items. The indicators developed in this way allow for detailed evaluation of these observational studies. Let us expand upon this. In the case of qualitative evaluation of items with bias due to confounding factors, we—who implement the SR—must separately create standards for this evaluation item. In this case, we did so based on whether or not it was matched and whether or not it was adjusted when calculating HR; if matching was completed and adjusted when calculating HR, it was evaluated as low, while if only matching was not adjusted when calculating HR, it was evaluated as moderate. In this way, an optimal methodology can be established in the process of qualitative evaluation of all items (Table 2). Through this qualitative evaluation, we could determine how to set up the control group, how to set the exposure period, how to set the index date, what exclusion criteria to set for the target group, and what to analyze (for example, RR or HR). Moreover, we could also understand how to achieve balancing by matching or weighing, and finally, whether to adjust covariates after matching.

7. Discussion

For big data to be applied and generalized in clinical practice, it must be subjected to a scientific evaluation called EBM. EBM is a medical methodology that integrates appropriate scientific evidence with the experience of doctors in clinical decision-making to provide patients with the best care possible. Therefore, when new findings are obtained using the healthcare big data integration platforms we have discussed above and published in professional journals or clinical trial results and eventually approved by regulatory agencies and recognized as EBM, this represents a complete use of healthcare big data. Another method for EBM is meta-analysis [37,38,39,40], which integrates the scientific knowledge on a subject that humans have thus far accumulated. Meta-analysis is a combined methodology that quantitatively synthesizes research findings within the framework of a SR [34,36]. Systematic reviews and meta-analyses should adhere to Preferred Reporting Items for Systematic Reviews and Meta-Analyses (PRISMA) guidelines [41] for RCTs and Meta-analysis of Observational Studies in Epidemiology (MOOSE) [42] guidelines for observational studies, which can improve the reliability and value of published health research literature by promoting transparent and accurate reporting and widespread use of robust reporting guidelines. New scientific knowledge is recognized as scientific fact through peer-reviewed publication in relevant professional journals, and the integration of these individual studies into a meta-analysis methodology to prove medical effectiveness is highly efficient, and it is considered to be the highest level of EBM. When searching for evidence-based information, you should select the highest level of evidence possible for clinical implications and recommendations. Systematic reviews and meta-analyses are considered the gold standard for medical decision-making because they are known to contain the best available evidence to answer health research questions [43,44,45].
Even if a qualitative or quantitative evaluation of previous studies has been completed by conducting SR, it is still very difficult to create and analyze a retrospective cohort using big data. First, there is the issue of access restriction, so even after IRB approval, access rights may take a long time to be obtained. Therefore, time difficulties can be said to represent the first issue. Second, even if access is granted, it is not easy for clinicians to actually analyze the data. It takes a lot of time to simply import and analyze such data, which is not easy for researchers who spend a lot of time doing clinical work. Lastly, when a thesis is completed, reviewed, and requested for revision, data access rights are lost again, which makes it difficult to reanalyze the data. So how can these points be overcome? The answer lies in collaborative research. Clinical researchers do not try to approach and analyze topics directly, but they instead aim to conduct collaborative research with non-clinical researchers who do a lot of big data research. However, even in this case, it is very important that the clinical researcher play a significant role in determining the methodology by implementing SR even if a joint study is conducted on the research topic.

8. Conclusions

There are several types of big data related to medical care. Among them, the data that we can use for research is mainly insurance claim data, and it is possible to access all of them through an individual database or a converged platform. SR can be of great help to researchers when planning observational studies through individual use of insurance claim data or databases of national institutions or observational studies using medical big data platforms. Through SR, researchers can determine the optimal methodology and de-rive unshakable results. In order to overcome the inherent disadvantages of observational research, SR on the same topic that has been published in the past is essential.

Author Contributions

S.R.S., J.-H.L. and J.H.K. conceived and designed the study. S.R.S. and J.H.K. screened databases and extracted data, accessed and verified the data, did the statistical analysis, and wrote the first draft of the manuscript. All authors interpreted the data, provided critical review, revision of the text, and approved the final version. J.H.K. had final responsibility for the decision to submit for publication. All authors have read and agreed to the published version of the manuscript.

Funding

This work was supported by the Soonchunhyang University Research Fund.

Institutional Review Board Statement

Not applicable.

Informed Consent Statement

Not applicable.

Data Availability Statement

This study used publicly available data, which are available through the National Health Insurance Service and Health Insurance Review and Assessment Service.

Conflicts of Interest

The authors declare no conflict of interest.

References

  1. Hariton, E.; Locascio, J.J. Randomised controlled trials—The gold standard for effectiveness research: Study design: Randomised controlled trials. Bjog 2018, 125, 1716. [Google Scholar] [CrossRef]
  2. Armstrong, R.; Hall, B.J.; Doyle, J.; Waters, E. Cochrane Update. ‘Scoping the scope’ of a cochrane review. J. Public Health 2011, 33, 147–150. [Google Scholar] [CrossRef]
  3. Higgins, J.P.T.; Green, S. Cochrane Handbook for Systematic Reviews of Interventions. Version 5.1.0. The Cochrane Collaboration; 2011. Available online: https://handbook-5-1.cochrane.org/ (accessed on 1 August 2023).
  4. Laney, D. 3D Data Management: Controlling Data Volume, Velocity, and Variety; Scientific Research Publishing: Wuhan, China, 2001. [Google Scholar]
  5. Davenport, T.H. Big Data at Work: Dispelling the Myths, Uncovering the Opportunities; Harvard Business School Publishing: Boston, MA, USA, 2014. [Google Scholar]
  6. Senthilkumar, S.A.; Rai, B.K.; Meshram, A.; Gunasekaran, A.; Chandrakumarmangalam, S. Big Data in Healthcare Management: A Review of Literature. Am. J. Theor. Appl. Bus. 2018, 4, 57–69. [Google Scholar]
  7. Dinov, I.D. Methodological challenges and analytic opportunities for modeling and interpreting Big Healthcare Data. Gigascience 2016, 5, 12. [Google Scholar] [CrossRef] [PubMed]
  8. Bellazzi, R.; Zupan, B. Predictive data mining in clinical medicine: Current issues and guidelines. Int. J. Med. Inform. 2008, 77, 81–97. [Google Scholar] [CrossRef] [PubMed]
  9. Tanaka, S.; Tanaka, S.; Kawakami, K. Methodological issues in observational studies and non-randomized controlled trials in oncology in the era of big data. Jpn. J. Clin. Oncol. 2015, 45, 323–327. [Google Scholar] [CrossRef]
  10. Scruggs, S.B.; Watson, K.; Su, A.I.; Hermjakob, H.; Yates, J.R., 3rd; Lindsey, M.L.; Ping, P. Harnessing the heart of big data. Circ. Res. 2015, 116, 1115–1119. [Google Scholar] [CrossRef] [PubMed]
  11. Wang, W.; Krishnan, E. Big data and clinicians: A review on the state of the science. JMIR Med. Inform. 2014, 2, e1. [Google Scholar] [CrossRef] [PubMed]
  12. Lee, C.H.; Yoon, H.J. Medical big data: Promise and challenges. Kidney Res. Clin. Pract. 2017, 36, 3–11. [Google Scholar] [CrossRef]
  13. Khoury, M.J.; Ioannidis, J.P. Medicine. Big data meets public health. Science 2014, 346, 1054–1055. [Google Scholar] [CrossRef]
  14. Rumsfeld, J.S.; Joynt, K.E.; Maddox, T.M. Big data analytics to improve cardiovascular care: Promise and challenges. Nat. Rev. Cardiol. 2016, 13, 350–359. [Google Scholar] [CrossRef]
  15. United Nations. Non-Communicable Diseases Deemed Development Challenge of ‘Epidemic Proportions’ in Political Declaration Adopted During Landmark General Assembly Summit. 2011. Available online: https://press.un.org/en/2011/ga11138.doc.htm (accessed on 1 August 2023).
  16. Linsk, J.A. American medical culture and the health care crisis. Am. J. Med. Qual. 1993, 8, 174–180. [Google Scholar] [CrossRef]
  17. Kim, E.Y. Korea’s Healthcare Spending Grows Fastest among OECD. Korea Biomedical Review; 2021. Available online: https://www.koreabiomed.com/news/articleView.html?idxno=10890 (accessed on 1 August 2023).
  18. World Health Organization. World Health Statistics. 2023. Available online: https://data.who.int/ (accessed on 1 August 2023).
  19. Atchinson, B.K.; Fox, D.M. The politics of the Health Insurance Portability and Accountability Act. Health Aff. 1997, 16, 146–150. [Google Scholar] [CrossRef] [PubMed]
  20. Korea Health Information Service. Healthcare Big Data Platform. Korean. Public Health Big Data Platform. 2023. Available online: https://hcdl.mohw.go.kr/ (accessed on 1 August 2023).
  21. Korea Disease Control and Prevention Agency. Korea Health Statistics 2019: Korea National Health and Nutrition Examination Survey (KNHANES VII-3). 2020. Available online: https://knhanes.kdca.go.kr/knhanes/sub04/sub04_04_01.do (accessed on 1 August 2023).
  22. Korean Law Information Center. Criteria for Special Exceptions to Copayment Calculations. Korean. Korean Law Information Center. 2023. Available online: https://www.law.go.kr (accessed on 1 August 2023).
  23. Kim, H.; Lee, C.H.; Kim, S.H.; Kim, Y.D. Epidemiology of complex regional pain syndrome in Korea: An electronic population health data study. PLoS ONE 2018, 13, e0198147. [Google Scholar] [CrossRef]
  24. Lee, J.H.; Park, S.; Kim, J.H. A Korean nationwide investigation of the national trend of complex regional pain syndrome vis-à-vis age-structural transformations. Korean J. Pain 2021, 34, 322–331. [Google Scholar] [CrossRef] [PubMed]
  25. Bzdok, D. Classical Statistics and Statistical Learning in Imaging Neuroscience. Front. Neurosci. 2017, 11, 543. [Google Scholar] [CrossRef]
  26. Bzdok, D.; Altman, N.; Krzywinski, M. Statistics versus machine learning. Nat. Methods 2018, 15, 233–234. [Google Scholar] [CrossRef]
  27. Sinha, A.; Hripcsak, G.; Markatou, M. Large datasets in biomedicine: A discussion of salient analytic issues. J. Am. Med. Inform. Assoc. 2009, 16, 759–767. [Google Scholar] [CrossRef] [PubMed]
  28. Li, L. Dimension reduction for high-dimensional data. Methods Mol. Biol. 2010, 620, 417–434. [Google Scholar] [CrossRef]
  29. Saeys, Y.; Inza, I.; Larrañaga, P. A review of feature selection techniques in bioinformatics. Bioinformatics 2007, 23, 2507–2517. [Google Scholar] [CrossRef]
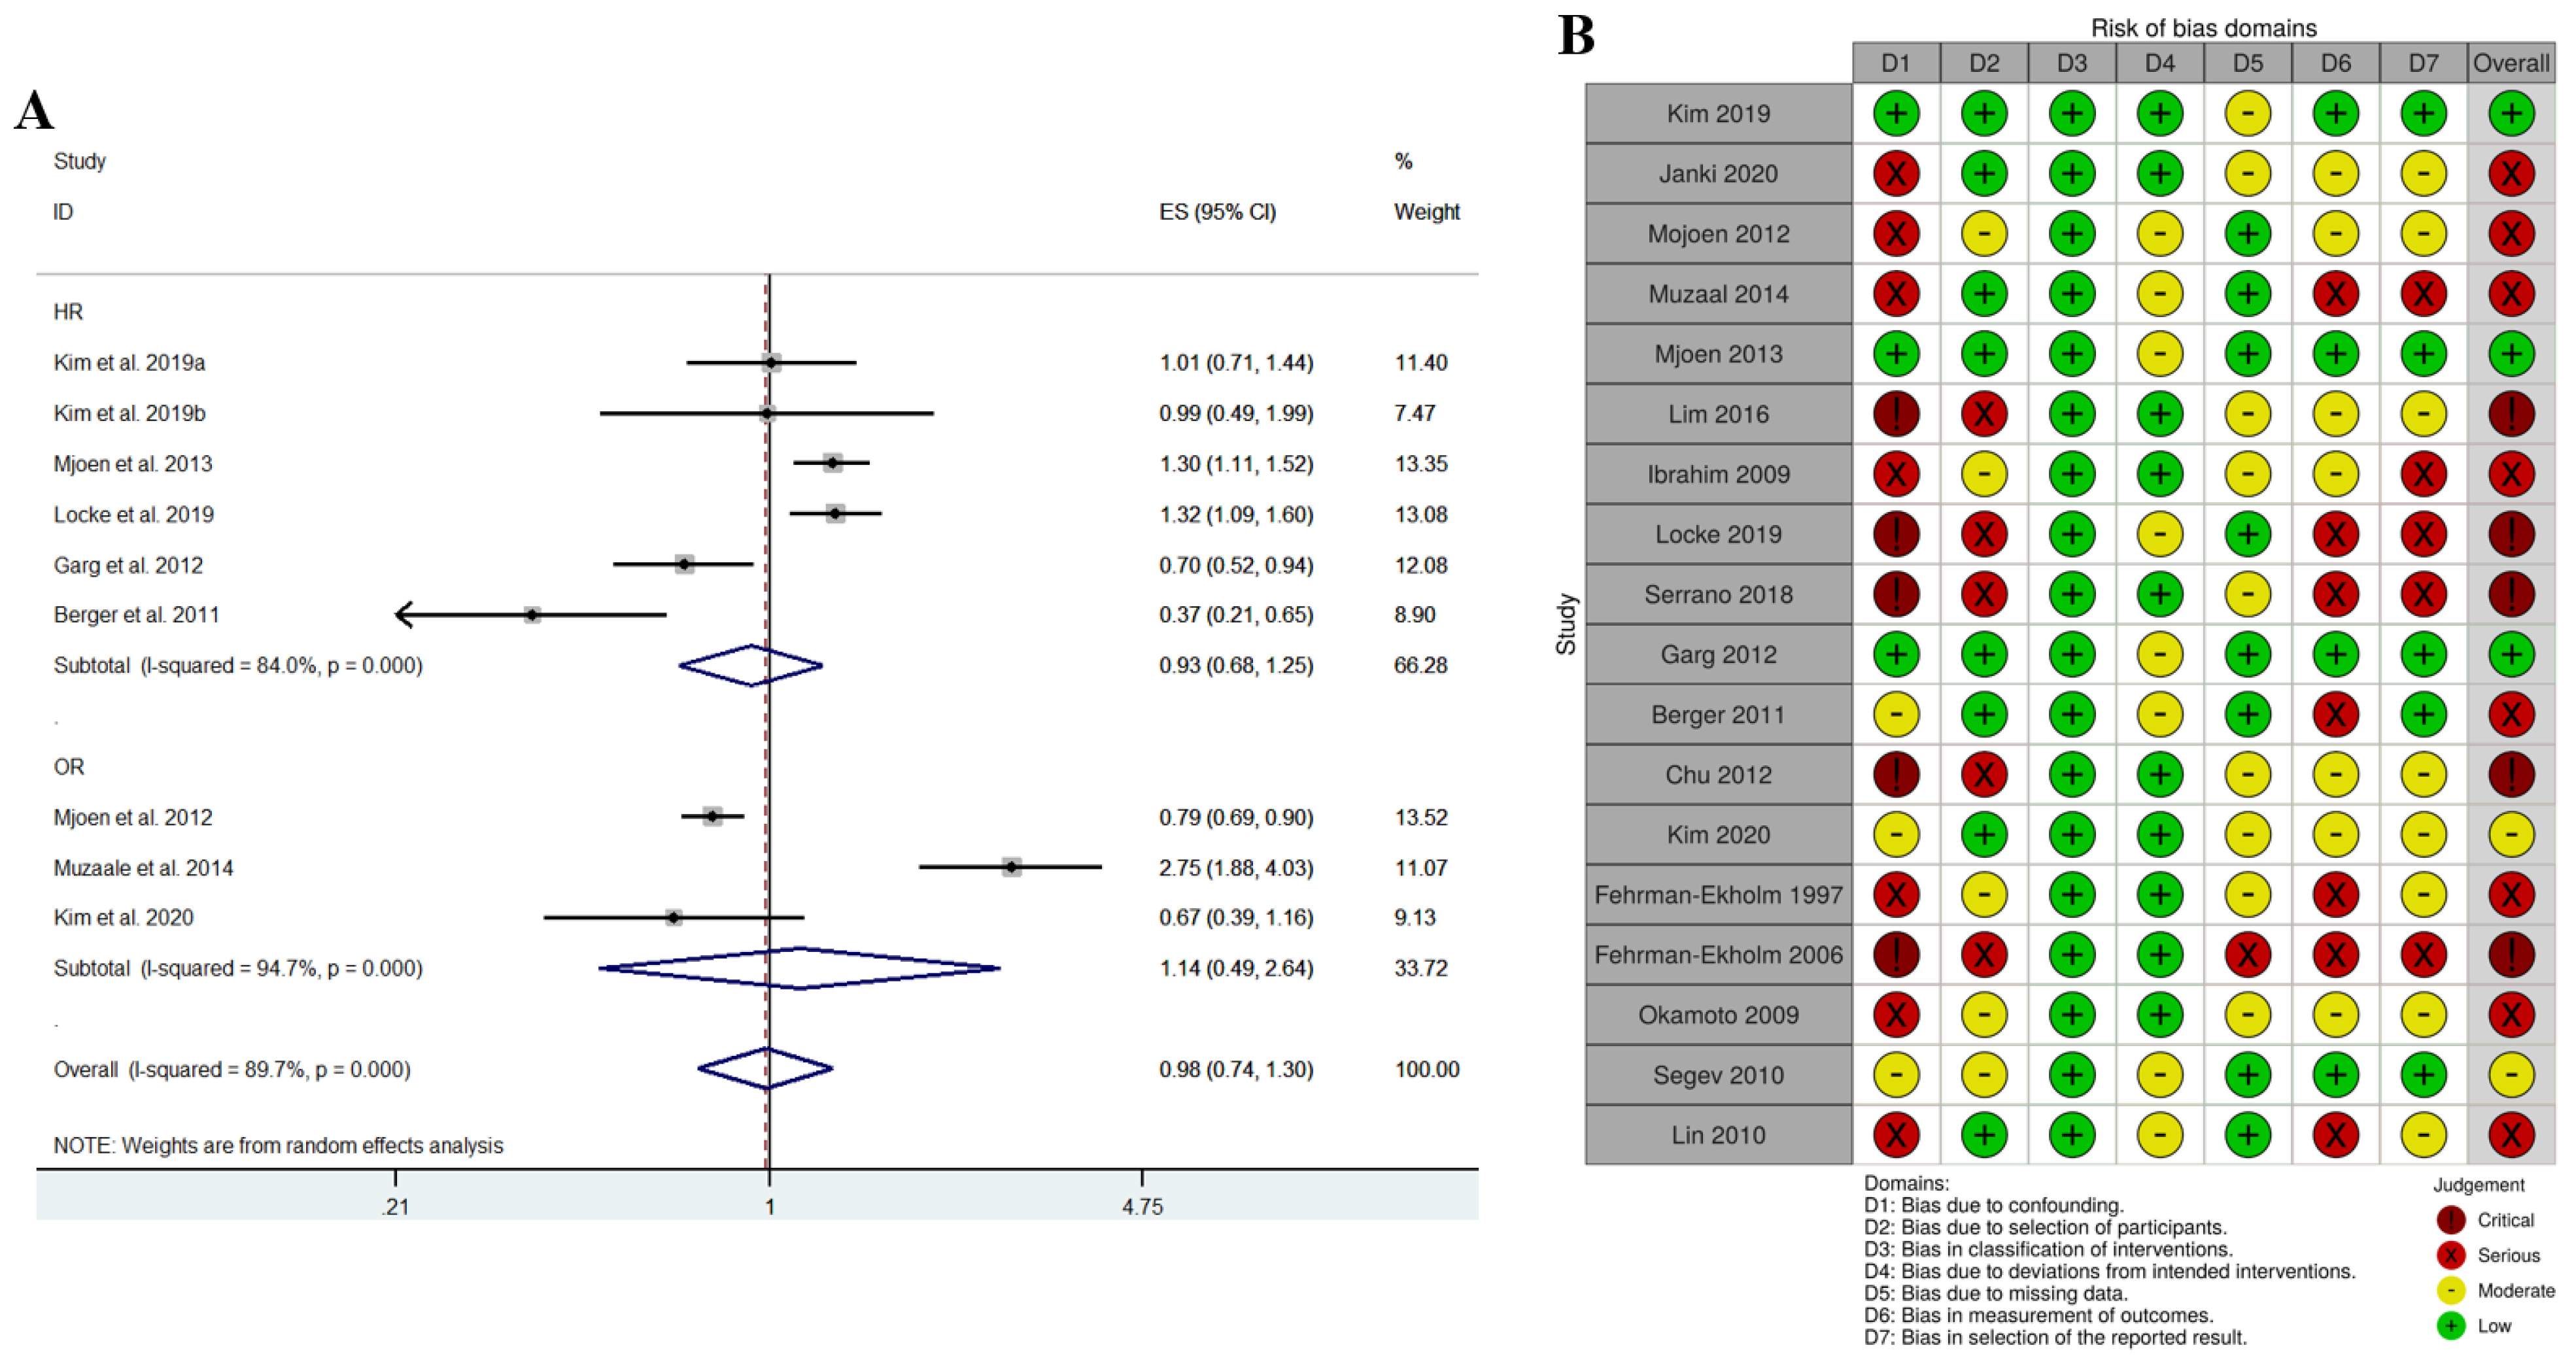
  30. Park, J.J.; Kim, K.; Choi, J.Y.; Shim, S.R.; Kim, J.H. Long-term mortality of living kidney donors: A systematic review and meta-analysis. Int. Urol. Nephrol. 2021, 53, 1563–1581. [Google Scholar] [CrossRef] [PubMed]
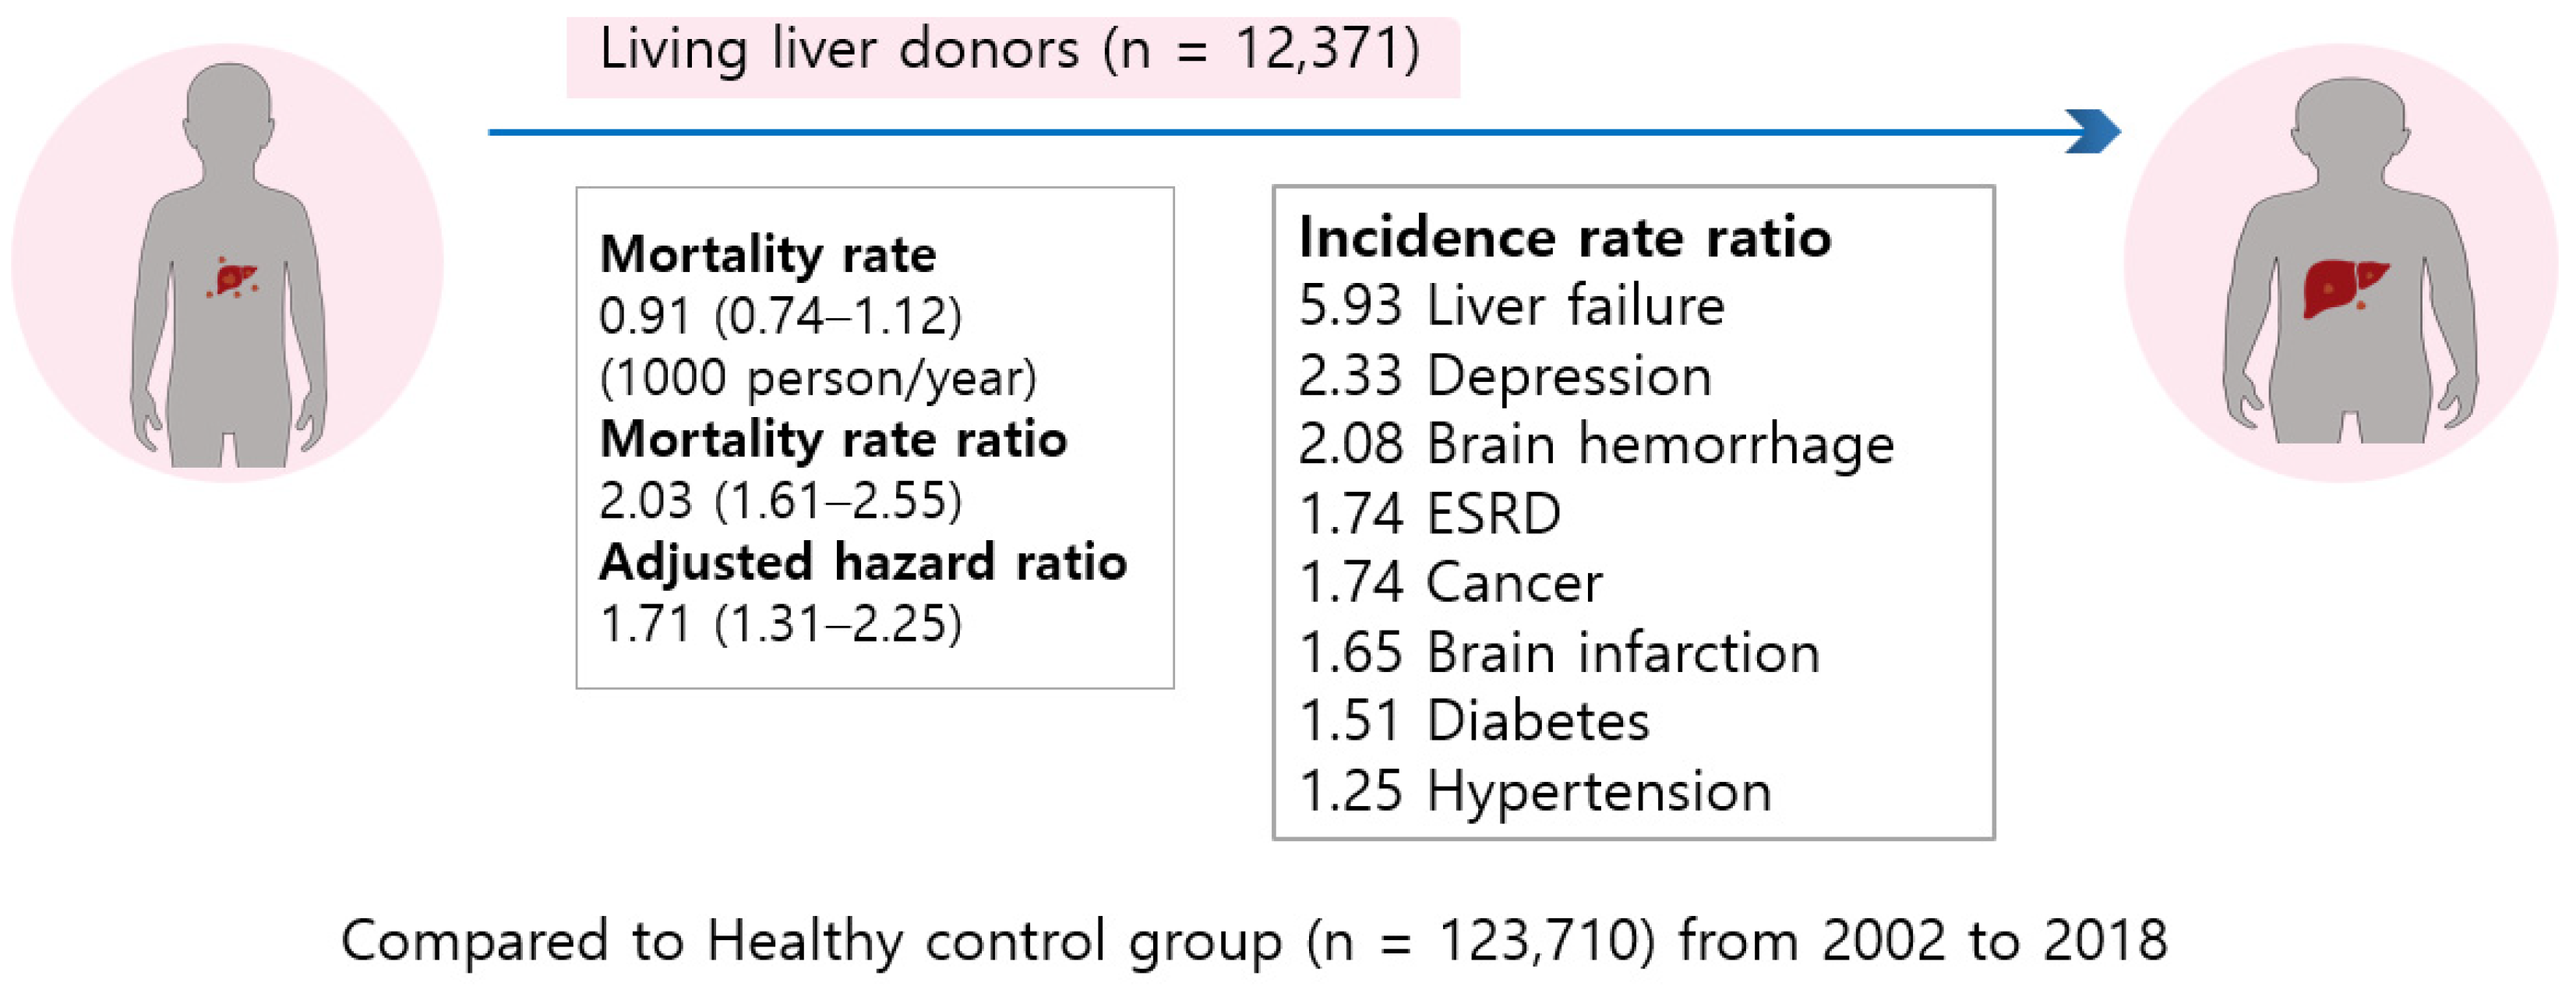
  31. Choi, J.Y.; Kim, J.H.; Kim, J.M.; Kim, H.J.; Ahn, H.S.; Joh, J.W. Outcomes of living liver donors are worse than those of matched healthy controls. J. Hepatol. 2022, 76, 628–638. [Google Scholar] [CrossRef] [PubMed]
  32. DerSimonian, R.; Laird, N. Meta-analysis in clinical trials. Control Clin. Trials 1986, 7, 177–188. [Google Scholar] [CrossRef]
  33. Shim, S.R.; Kim, S.J. Intervention meta-analysis: Application and practice using R software. Epidemiol. Health 2019, 41, e2019008. [Google Scholar] [CrossRef] [PubMed]
  34. Sterne, J.A.C.; Savović, J.; Page, M.J.; Elbers, R.G.; Blencowe, N.S.; Boutron, I.; Cates, C.J.; Cheng, H.Y.; Corbett, M.S.; Eldridge, S.M.; et al. RoB 2: A revised tool for assessing risk of bias in randomised trials. BMJ 2019, 366, l4898. [Google Scholar] [CrossRef]
  35. Stang, A. Critical evaluation of the Newcastle-Ottawa scale for the assessment of the quality of nonrandomized studies in meta-analyses. Eur. J. Epidemiol. 2010, 25, 603–605. [Google Scholar] [CrossRef] [PubMed]
  36. Sterne, J.A.; Hernán, M.A.; Reeves, B.C.; Savović, J.; Berkman, N.D.; Viswanathan, M.; Henry, D.; Altman, D.G.; Ansari, M.T.; Boutron, I.; et al. ROBINS-I: A tool for assessing risk of bias in non-randomised studies of interventions. BMJ 2016, 355, i4919. [Google Scholar] [CrossRef] [PubMed]
  37. Shim, S.; Yoon, B.H.; Shin, I.S.; Bae, J.M. Network meta-analysis: Application and practice using Stata. Epidemiol. Health 2017, 39, e2017047. [Google Scholar] [CrossRef]
  38. White, I.R. Network meta-analysis. Stata J. 2015, 15, 951–985. [Google Scholar] [CrossRef]
  39. Harbord, R.M.; Deeks, J.J.; Egger, M.; Whiting, P.; Sterne, J.A. A unification of models for meta-analysis of diagnostic accuracy studies. Biostatistics 2007, 8, 239–251. [Google Scholar] [CrossRef]
  40. Orsini, N.; Greenland, S. A procedure to tabulate and plot results after flexible modeling of a quantitative covariate. Stat. J. 2011, 11, 1–29. [Google Scholar] [CrossRef]
  41. Moher, D.; Liberati, A.; Tetzlaff, J.; Altman, D.G. Preferred reporting items for systematic reviews and meta-analyses: The PRISMA statement. PLoS Med. 2009, 6, e1000097. [Google Scholar] [CrossRef] [PubMed]
  42. Stroup, D.F.; Berlin, J.A.; Morton, S.C.; Olkin, I.; Williamson, G.D.; Rennie, D.; Moher, D.; Becker, B.J.; Sipe, T.A.; Thacker, S.B. Meta-analysis of observational studies in epidemiology: A proposal for reporting. Meta-analysis Of Observational Studies in Epidemiology (MOOSE) group. JAMA 2000, 283, 2008–2012. [Google Scholar] [CrossRef] [PubMed]
  43. U.S. Food and Drug Administration. Meta-Analyses of Randomized Controlled Clinical Trials to Evaluate the Safety of Human Drugs or Biological Products Guidance for Industry. 2023. Available online: https://www.fda.gov/regulatory-information/search-fda-guidance-documents/meta-analyses-randomized-controlled-clinical-trials-evaluate-safety-human-drugs-or-biological (accessed on 1 August 2023).
  44. U.S. Food and Drug Administration. Enhancing Regulatory Science—Methodologies for Meta-Analysis. 2023. Available online: https://www.fda.gov/industry/prescription-drug-user-fee-amendments/enhancing-regulatory-science-methodologies-meta-analysis (accessed on 1 August 2023).
  45. Murad, M.H.; Asi, N.; Alsawas, M.; Alahdab, F. New evidence pyramid. Evid. Based Med. 2016, 21, 125–127. [Google Scholar] [CrossRef] [PubMed]
Figure 1. Definition Types of big data related to healthcare and types of big data in the medical health area.
Applsci 13 09260 g001
Figure 2. Data connection relationship between National Health Insurance Service (NHIS) and Health Insurance Review and Assessment Service (HIRA).
Applsci 13 09260 g002
Figure 3. (A) quantitative analysis using meta-analysis; (B) qualitative analysis using ROBIN-I. “Adapted with permission from Ref. [30]. 2023, Springer Nature B.V.”.
Applsci 13 09260 g003
Figure 4. Graphical abstract of outcomes of living liver donors are worse than those of matched healthy controls [31].
Applsci 13 09260 g004
Table 1. Severe chronic incurable diseases subject to special calculation.
DiseaseDisease CodeSpecific Code
Chronic renal failure
    End stage renal disease with dialysis V001, V003
Blood clotting disorders (e.g., hemophilia)
    Acquired clotting factor deficiencyD68.4V284
Organ transplantation
    Liver, kidney, lung, heart, pancreas, V013, V014, V015, V005,
    small bowel transplantation V277, V278
Psychiatric disease
    Schizophrenia (81 cases)F20.0V161
Specific Infection V103, V124, V131, V140,
V142, V162, V170, V201,
    Specific encephalitis (118 cases)A81.1V223, V237, V279, V280,
V282, V283, V285, V286,
V287, V288, V289, V290
    Dementia
    Early onset Alzheimer’s dementia (14 cases)
F00.0V800
    Dementia
    Late onset Alzheimer’s dementia (12 cases)
F00.1V810
Table 2. Qualitative assessment for observational study (ROBINS-I) (example: cohort study for mortality after donor nephrectomy).
Bias DomainBias Due to ConfoundingBias Due to Selection of ParticipantsBias in Classification of InterventionBias Due to Deviations from Intended InterventionBias Due to Missing DataBias Due to Measurement of OutcomesBias in Selection of the Reported Results
Evaluation standard for each bias domain(1) Low:
Matched control, adjusted HR
(2) Moderate:
(i) Matched control, unadjusted HR
(ii) Unmatched control, adjusted HR
(3) Serious:
Unmatched control, no HR
Critical:
No control
(1) Low:
Healthy control
(2) Moderate:
Non-healthy control
(3) Serious:
No control (or No description of control group)
(1) Low:
Because all studies are on donor nephrectomy
(1) Low:
Single center
(2) Moderate:
Multicenter, claimed data
(1) Low:
Claimed data
(2) Moderate:
Not claimed data, description of the follow up method
(3) Serious:
Not claimed data, no description of the follow up method
(1) Low:
HR is calculated, median follow up period is presented
(2) Moderate:
No HR, median follow up period and survival rate are presented
(3) Serious:
HR, median follow up period and survival rate are not presented
(1) Low:
HR, survival rate and cause of death are presented
(2) Moderate:
HR isn’t presented
(3) Serious:
HR and survival rate are not presented
Own-created criteria for each item were written in Italics.
Disclaimer/Publisher’s Note: The statements, opinions and data contained in all publications are solely those of the individual author(s) and contributor(s) and not of MDPI and/or the editor(s). MDPI and/or the editor(s) disclaim responsibility for any injury to people or property resulting from any ideas, methods, instructions or products referred to in the content.

