Article

Effects of Blue-Light Laser Irradiation on the Enzymatic Activities and Sporulation of Trichoderma atroviride Grown on Rice Husks

by
Ioana-Alexandra Bala
1,2,†,
Naomi Tritean
1,3,†,
Alin Alexandru Enache
4,
Bogdan Trică
1,5,
Diana Constantinescu-Aruxandei
1,* and
Florin Oancea
1,2,*
1
Bioresources Department, National Institute for Research & Development in Chemistry and Petrochemistry—ICECHIM, Splaiul Independenței nr. 202, 060021 Bucharest, Romania
2
Faculty of Biotechnologies, University of Agronomic Sciences and Veterinary Medicine of Bucharest, Bd. Mărăști nr. 59, 011464 Bucharest, Romania
3
Faculty of Biology, University of Bucharest, Splaiul Independenței nr. 91-95, 050095 Bucharest, Romania
4
Apel Laser SRL., Vânătorilor Street nr. 25, 077135 Ilfov, Romania
5
Faculty of Chemical Engineering and Biotechnologies, “Politehnica” University of Bucharest, Spl. Independenței nr. 313, 060042 Bucharest, Romania
*
Authors to whom correspondence should be addressed.
These authors contributed equally to this work.
Appl. Sci. 2023, 13(16), 9191; https://doi.org/10.3390/app13169191
Submission received: 28 June 2023 / Revised: 3 August 2023 / Accepted: 8 August 2023 / Published: 12 August 2023
(This article belongs to the Special Issue Resource and Applied Microbial Technology)

Abstract

:

Featured Application

Our study is the first in a series of programmed investigations that aim to bring the knowledge related to light effects on Trichoderma closer to industrial and agricultural applications and develop optimized sources of irradiation in this respect.

Abstract

Light is known to impact various aspects of Trichoderma, with possible implications for industrial and agricultural applications. In this study, we investigated the irradiation of Trichoderma atroviride with blue light using a laser source system. We determined the cellulase and protease activities and the effects of UV–Vis absorption of the filtrated culture on conidia formation, dimension, and behavior, and on the apparent chlamydospore abundance, as a function of irradiation duration, dose of irradiation, and moment of irradiation. We show that the effects on the enzymatic activities range from positive to neutral to negative. Compared with previous studies, our stimulation with light does not show a drastic negative effect on the cellulase (CMC-ase) activity, but it seems to delay the maximum activity over time. The effects on the proteases are partially in agreement with the only previous study reported for the light effects on protease activity. The number of conidia is increased upon irradiation, representing an expected behavior, and we show for the first time to the best of our knowledge that the conidia dimensions and chlamydospore number also increase. Our data also suggest that the highest dose resulted in the conidia clustering around the liquid–air interface, suggesting an increased hydrophobic character.

Graphical Abstract

1. Introduction

Light regulates various gene expressions in fungi, involving complex machinery triggered by the photoreceptors present in fungi. It has been shown that the fungal photoreceptors absorb blue (400–490 nm), green (495–570 nm), and red (600–850 nm) light, as recently reviewed by Yu and Fischer [1]. The first light effect previously reported for Trichoderma was the induction of conidiation upon exposure to short pulses of blue or white light, the photoinduction being “remembered” during and after incubation in conditions that inhibit growth [2,3]. Previous studies showed that light regulates the growth of Trichoderma atroviride and Trichoderma reesei via its photoreceptors, the most studied being blue-light regulators 1 and 2 (BLR-1 and BLR-2), and the growth of other fungal species via a conserved pathway [4,5,6]. Light influences the carbon metabolism of Trichoderma as well [4,6]. Cross-talk between signal transduction pathways induced by light and nutrients/carbon metabolism was previously reported [7,8]. Trichoderma is one of the most studied filamentous fungal species with respect to light effects, due to its biotechnological and agronomic importance [6,9,10,11,12,13,14,15,16]. Trichoderma is of the most interest due to its high capacity to degrade biomass, especially lignocellulose; high production of relevant enzymes and bioactive compounds including those used for producing biofuels or for use in the pharmaceutical industry; and reduced pathogenicity and high efficiency as a biocontrol agent and plant biostimulant [17,18,19,20]. T. reesei, T. harzianum, and T. atroviride are some of the most studied species due to their high bioactivity, in terms of enzymatic machinery and/or impact on plants. Valorization of co- and sub-products from different industries, such as rice husks, has gained more and more interest for a sustainable bioeconomy [21,22,23]. Some of the most important enzymes for biomass degradation are the carbohydrate active enzyme (CAZyme) family of proteins and the proteases [24]. In some cases, very high levels of proteases are not desired as they could determine degradation of other enzymes of interest, such as cellulases [24,25]. The most investigated CAZ enzymes with respect to light effect, i.e., cellulases, have been shown to be regulated by light [25]. The effects of light on protease synthesis and activity have been less studied than the effects on cellulases. To the best of our knowledge, only Dr. Schmoll’s group reported on the effects induced by light with respect to protease activity of a Trichoderma strain, with the study showing a stimulation of the activity under light conditions [25].
In agriculture, Trichoderma is used as a biocontrol agent and as a microbial biostimulant [26]. For these applications, formulations of spores that could be applied either radicularly [27] or foliarly [28,29] are the most efficient. Therefore, efficient induction of Trichoderma sporulation in cultures is economically relevant. Trichoderma produces two main types of spores, conidia and chlamydospores, the latter being larger, with a thicker cell wall, and more resistant to adverse conditions than conidia. Light has been shown to amplify conidia formation, but not much is known about the effects on chlamydospores. Hydrophobin proteins, which are involved in sporulation, have been detected in the medium of light-grown T. reesei [25].
Despite the relatively intense research employed by some research groups in the last years, the light-mediated processes are still far from being completely understood, including the spatio-temporal aspects. Moreover, most of the studies focused on the molecular and mechanistical points of view and less on the biotechnological and applicative relevance of using the best light sources on Trichoderma cultures. Optimizing both the production of enzymes and fungal sporulation simultaneously would benefit both industry and agriculture, but in order for this to happen it is first necessary to understand the possible influences of the various parameters involved. In this respect, it was previously reported that during conidiation of T. reesei, the genes codifying for the biomass-degrading enzymes were upregulated, especially in the case of cellulases and hemicellulases [30]. MAPkinases have been recently reported to be involved in light-dependent cellulase regulation with interconnections to secondary metabolism and sexual development [12].
Most studies have investigated the effects of light on Trichoderma by using LED sources of light in the blue wavelength domain. To the best of our knowledge, light in the form of a laser source has been used in only one study and just for the effect of laser radiation at 355 nm on the sporulation of Trichoderma harzianum [31]. In that study, it was demonstrated that irradiation induced and intensified sporulation in Trichoderma. Both LED and lasers emit photons that produce light, but light resulting from LED sources is dispersed and multidirectional, compared to laser light, which is focused and highly localized. Therefore, the effects induced by laser could be different from the effects induced by LED.
In this study, we investigated the effects of blue light generated by a 400 nm laser on the enzymatic activity and sporulation of T. atroviride grown on rice husks, a sub-product of the rice production industry. We show that blue laser light can impact the protease and cellulase activity, either positively or negatively, the effect being dependent on the irradiation time and also on the incubation time in combination with the number of irradiations. There was an increase in the UV absorption of the UV–Vis spectra, which could reflect an intensification of the rice husk degradation and/or induction of fungal water-soluble metabolites. The irradiation also increased the number and size of conidia and seems to have an effect on chlamydospore formation. A positive effect on the size of conidia is reported for the first time, to the best of our knowledge. This is the first study to report the effect of light irradiation using a laser source on the cellulase and protease activities of Trichoderma cultures, to the best of our knowledge. It is also the first reported study in a series of programmed investigations that aim to bring knowledge related to light effects on Trichoderma to industrial and agricultural applications and develop optimized sources of irradiation in this respect. The first step in this process is to understand how irradiation parameters influence the process and how the effects evolve over time.

2. Materials and Methods

2.1. Materials

Trichoderma atroviride P1 ATCC 74058 was used in this study, as part of the Microbial Collection of ICECHIM (Bucharest, Romania). Rice husks (Risso Scotti Danubio, Bucharest, Romania) were used as growth substrate in order to induce the synthesis of enzymes that decompose lignocellulose. The following chemicals were used: potassium dihydrogen phosphate, di-potassium hydrogen phosphate, calcium chloride, ammonium sulfate, potato dextrose agar (PDA), meat peptone, D(+)-glucose anhydrous for analysis, sodium hydroxide, potassium sodium tartrate for analysis, phenol molecular biology grade, potassium chloride, potassium metabisulfite, zinc sulfate heptahydrate, magnesium sulfate heptahydrate, ferrous sulfate heptahydrate, magnesium sulfate heptahydrate, trichloroacetic acid (TCA), sodium carbonate, sodium acetate, hydrochloric acid, 3,5-Dinitrosalicylic acid (Scharlau, Barcelona, Spain), L-Tyrosine, Casein Hammarsten grade, and Folin & Ciocalteu’s phenol reagent (Sigma-Aldrich, Merck Group, Darmstadt, Germany).

2.2. Fungal Strain Inoculation and Growing Conditions

In order to refresh the strain, a mycelial disk of T. atroviride excised from the edge of old cultures was placed into the center of Petri dishes using PDA medium, followed by incubation at 28 °C for 5 days. Subsequently, mature spores were collected by flooding the plate with sterile double-distilled water (ddH2O); they were then inoculated into 500 mL Erlenmeyer flasks with ISM medium (0.68 g/L KH2PO4; 0.87 g/L K2HPO4; 1.7 g/L (NH4)2SO4; 0.2 g/L KCl; 0.2 g/L CaCl2; 0.2 g/L MgSO4·7H2O; 2 mg/L FeSO4·7H2O; 2 mg/L MnSO4·7H2O; 2 mg/L ZnSO4·7H2O; 1% glucose; and 0.05% peptone) and incubated in an orbital-shaking incubator (ES-20/60 Orbital Shaker-Incubator, Biosan, Riga, Latvia) at 28 °C, 100 rpm, for 6 days. The purpose of using this medium was to induce cerato-platanins (CPs), small proteins that loosen or break the lignocellulosic matrix [32].
The mycelium from ISM was incubated in sterilized double-distilled water supplemented with rice husks using a ratio of 1:30:1 mycelium (g)-water (mL)-rice husks (g) in Erlenmeyer flasks of 50 mL, in the orbital-shaking incubator (ES-20/60) at 28 °C and 100 rpm for 15 days. All media were autoclaved at 121 °C for 15 min (Panasonic MLS—3751L, PHC Corporation Singapore Pte. Ltd., Cintech III, Singapore). The Erlenmeyer flasks were kept in the dark throughout the experiment. The samples were run in triplicate.

2.3. Experimental Design of Trichoderma Irradiation with Blue–Violet-Light Laser

The samples were subjected to blue–violet-light laser irradiation (400 nm) using a MDL-III-400-300mW (PSU-III-FDA) diode laser with optic fiber, with power variation between 0 and 100%. The MDL-III-400-300mW system was bought from Changchun New Industries Optoelectronics Tech. Co., Ltd., No.888 Jinhu Road, High-Tech Zone, Changchun, China CNI. The RMS stability as declared by the manufacturer is 2%, measured over a 4 h period after the initial warm-up phase. Additionally, the laser manufacturer declares that the transversal spatial profile of the laser is near TEM00.
The laser came with a calibration curve of the optical average power at the beam radiation’s exit from the laser source as a function of the pump electrical current. It is known that any additional connection along the path of the laser beam leads to a decrease in power. In order to measure the optical average power at the exit from the beam expander, a Coherent PM2 measuring sensor with a useful surface with a diameter of 19 mm was used. It was necessary to adjust the distance between the sensor and the autocollimator so that all the laser radiation reaches the useful surface of the sensor. It can be seen that in the case of the 400 nm laser, around 50% of its power is lost both through the optical fiber coupling and the beam expander (Appendix A).
Irradiation was carried out at a pump electrical current of 151 mA, which generated an optical average power of 81 mW (with the beam expander). At a distance of 10 cm from the beam expander, the beam completely illuminated the base of the 100 mL Erlenmeyer flask, which had a diameter of 5.5 cm. Since the beam direction was normal to the surface holding the flask, the beam was circle-like, not elliptical-like. Since the beam size had the same diameter as the Erlenmeyer flask (as measured with a ruler from different directions), the optical intensity at the base of the flask was calculated to be 3.4 ± 0.2 mW/cm2. The optical intensity and its associated uncertainty (expressed in terms of relative experimental error) are presented in Table 1, showing the size of the measured beam at different distances from the expanded beam source.
The mean relative experimental error for the beam diameter was estimated to be 5.1% with respect to the function obtained via linear regression for the beam diameter as a function of the distance from the source (Appendix B). Due to error propagation, the beam area at different distances from the source had a relative experimental error of 7.2% with its values calculated considering that the beam is circular in all cases, as is shown in Table 1. Since the relative error of the average optical power can be estimated from the RMS stability value declared via the producer of 2%, the associated uncertainty of the optical intensity is 7.5% through propagation of errors.
Two irradiation times were considered. Based on a definition previously proposed in the literature [33], the irradiation dose was defined as the optical intensity multiplied by the irradiation time, which was expressed in units of energy per area (mJ/cm2). Thus, for an irradiation time of 60 s the irradiation dose at the base of the flasks was 204.5 ± 15.3 mJ/cm2. Similarly, when the irradiation time was 300 s, the irradiation dose was 1023 ± 76.7 mJ/cm2. The calculated values also express the uncertainty associated with the optical intensity.
The flasks were manipulated aseptically in the presence of a Bunsen burner flame. The irradiation took place in a specially designed box in the dark. In order to maintain the sterility of the medium, and also to ensure uniform irradiation, a glass lens BK7 (EKSMA Optics, Vilnius, Lithuania) functioning as an optical window was placed at the open ends of the flasks. The first irradiation of samples using the two different intensities of laser light was performed 4 h after incubation of the fungal strain with the rice husks. The samples were analyzed to confirm the lack of enzymatic activity at the beginning of the incubation period. After 5 days of incubation, samples were collected in order to evaluate the effect of the first irradiation, after which irradiation number two was carried out. To assess the effect of the first two irradiations, samples were analyzed on day 12 (7 days after the second irradiation), and finally the third irradiation took place on the same day. To see the effect of the three irradiations, the enzyme activity assays were performed again after 15 days of total incubation (3 days after the last irradiation).

2.4. Quantitative Analysis of Enzyme Activity

The supernatant was centrifuged at 19,000× g for 10 min at 4 °C in order to determine the enzyme activity. The protease activity was determined using casein as substrate together with Folin–Ciocalteu reagent. Each sample was followed by a control in which 10% TCA was added before the protein mixture was added in order to inhibit binding of the enzyme to the substrate. A standard calibration curve was prepared starting from a stock solution of 100 µg/mL tyrosine mixed with 0.5 M Na2CO3 and six-times diluted Folin–Ciocalteu reagent. The enzymatic reaction took place at 37 °C for 30 min. The absorbance of the samples, controls, and calibration curve was read at 660 nm using a microplate reader (CLARIOstar BMG Labtech, Ortenberg, Germany) [34,35]. At the end of the experiment, after 15 days of incubation, the specific protease activity on a mg of protein was calculated by dividing the protease activity into the total protein concentration.
The cellulase activity (Endo-1,4-β-D-glucanase) was assessed using carboxymethyl cellulose (CMC) as a substrate together with DNS reagent. Each sample was followed by a control, in which the pre-existing reducing sugars from the reaction mixture were dosed by introducing the DNS reagent before the protein mixture was introduced. The enzymatic reaction took place at 50 °C for 30 min. The reaction was stopped by addition of DNS reagent, followed by incubation for 15 min at 95 °C in a digital dry bath (BSH1004, Benchmark Scientific, Sayreville, NJ, USA). A stock solution of 1 mg/mL glucose was used for the calibration curve preparation, which was subjected to the same steps described above. The absorbance was read at 540 nm [36]. The irradiated samples were compared with non-irradiated samples, all incubated under the same conditions. At the end of the experiment, after 15 days of incubation, the specific cellulase activity on a mg of protein was calculated by dividing the cellulase activity into the total protein concentration.

2.5. Total Protein Content

The total number of proteins was determined using two methods: Bradford, which is a dye-binding assay, and Biuret, which is a copper-based method, measured against a bovine serum albumin (BSA) standard curve. In the case of Bradford, 200 μL of 10× diluted sample was mixed with 50 μL of Bradford reagent in a 96-well microplate. The 96-well microplate was orbitally mixed at 100 rpm and read spectrophotometrically at λ = 595 nm using a CLARIOstar microplate reader (BMG LABTECH, Ortenberg, Germany) after 5 min of incubation at room temperature. The calibration curve was prepared from a standard stock solution of 246 µg/mL BSA in distilled water, which was subjected to the same treatment [37]. In the case of the Biuret assay, 40 µL of undiluted sample were mixed with 200 µL of Biuret reagent in a 96-well plate. The 96-well plate was incubated 30 min at room temperature. Absorbance was read with the microplate reader at λ = 540 nm. The calibration curve was made from a standard stock solution of 10 mg/mL BSA in distilled water, which underwent the same preparation steps as in [38]. Because of the known interferences of certain compounds such as polyphenols and flavonoids with both assays [39,40], the average value between the two methods was calculated.

2.6. UV–Vis Spectroscopy

The absorbance (A) measurement of the irradiated and non-irradiated samples was assessed using UV–Vis spectroscopy in the range of 200–1000 nm, after 10× dilution each, against water as a blank, using a spectrophotometer UV-VIS-NIR USB 2000+ (Ocean Optics (now Ocean Insight), Orlando, FL, USA) and a quartz cuvette (Quartz SUPRASIL, Hellma Analytics, Müllheim, Germany), with light path = 10 mm. The transmittance mode was used to record the absorbance of the samples.

2.7. Determination of the Refractive Index and Dry Mass Content of Supernatant

The refractive index and dry mass content were measured using a digital refractometer (Hanna HI-96800, Woonsocket, RI, USA) following the guidelines provided by the manufacturer. Prior to the measurements, the refractometer was calibrated using double-distilled water. The dry mass content was expressed as Brix degrees (percent dry mass).

2.8. Optical Microscopy

Fresh liquid slide-blade preparations containing mycelium from the inoculated flasks with the fungal strain were made in order to visualize and analyze various morphological structures, thereby establishing the effect of the irradiation with blue light on the samples. The slides with medium and mycelium of T. atroviride were examined under a Leica DM 1000 LED microscope (Leica Microsystems, Wetzlar, Germany) provided with a digital camera ICC50W, at the end of the 15 days of incubation. The conidia were measured using the hemocytometer technique. The irradiated samples were compared with non-irradiated samples, all incubated under the same conditions.

2.9. Statistical Analysis

IBM SPSS 26 software was used for the statistical analysis.

3. Results and Discussion

A representation of the experimental system is shown in Figure 1.
The system includes a current source with the possibility to adjust the intensity of the pump electrical current, laser head (the exit optical average power, which is directly proportional to the pump electrical current), optical fiber, autocollimator, optical window, Erlenmeyer flask (or any recipient for fermentation), and box for keeping the optical fiber at constant distance and the samples in total surrounding darkness. The electric source and the laser head are outside of the box. The optical fiber connects the laser head to the autocollimator, which is in the box.

3.1. Protease and Cellulase Activity and Total Protein Content

Following the determination of protease activity, it was noticed that T. atroviride did not present significant protease activity after 4 h of incubation, having less than 1 µM Tyrosine.
After 5 days of incubation, there was a relevant increase in protease activity in both non-irradiated and laser-irradiated strains. Statistically significant higher protease activity was observed for the 60 s irradiated sample (104.3 ± 9.6 µM) compared to the non-irradiated sample (74.9 ± 3.2 µM) and 300 s irradiated sample (69.7 ± 2.6 µM), 39% and 50% higher, respectively (Figure 2a).
The protease activity increased further after 12 days of incubation, and there was no significant difference between the non-irradiated and irradiated samples at this time. A noticeable decrease could be observed in all samples after 15 days of incubation, the lowest value being for 3 × 300 s irradiated samples (33.8 ± 4.2 µM, 56% less than the non-irradiated samples). There was no significant difference between the control and the 60 s irradiated sample.
The cellulase activity of T. atroviride was less than 50 µM glucose after 4 h of incubation. After 5 days of incubation from the first irradiation, there was a similar increase in cellulosolytic enzyme synthesis in both non-irradiated and irradiated samples (Figure 2b). There was no significant difference between the irradiated and non-irradiated samples. After 12 days of incubation and two rounds of irradiation, there was a significant increase in cellulase production only in the non-irradiated sample (1027.4 ± 22.4 µM) (Figure 2b). The irradiated samples, both 60 s and 300 s, maintained the same cellulase activity after 12 days as after 5 days, and this activity was around 50% less than the non-irradiated sample. After 15 days of incubation and three irradiations, there was an increase in the cellulase activity for the samples irradiated for 60 s (851.2 ± 54.2 µM) and 300 s (803.2 ± 31.2 µM) in comparison to the corresponding cellulase activity measured after 12 days of incubation (540 ± 51.4 and 487.2 ± 41.3 µM, respectively), i.e., the cellulase activity increased by 58% and 65%, respectively, from the 12th day to the 15th day of incubation. The cellulase activity for the non-irradiated sample (730.2 ± 27.9 µM) was 29% lower after 15 days than after 12 days of incubation (Figure 1b). The cellulase activity became higher by 17% and 10% in the 60 s and 300 s irradiated samples, respectively, compared with the non-irradiated samples on the 15th day of incubation and after three rounds of irradiation.
These data indicate that the first effect of irradiation with blue-light laser is the stimulation of protease production, accompanied by a stagnation of cellulase production, followed by an increase in cellulase production. Cellulase synthesis seems to be delayed due to laser irradiation. Too much of an irradiation dose can have an inhibitory effect on protease production.
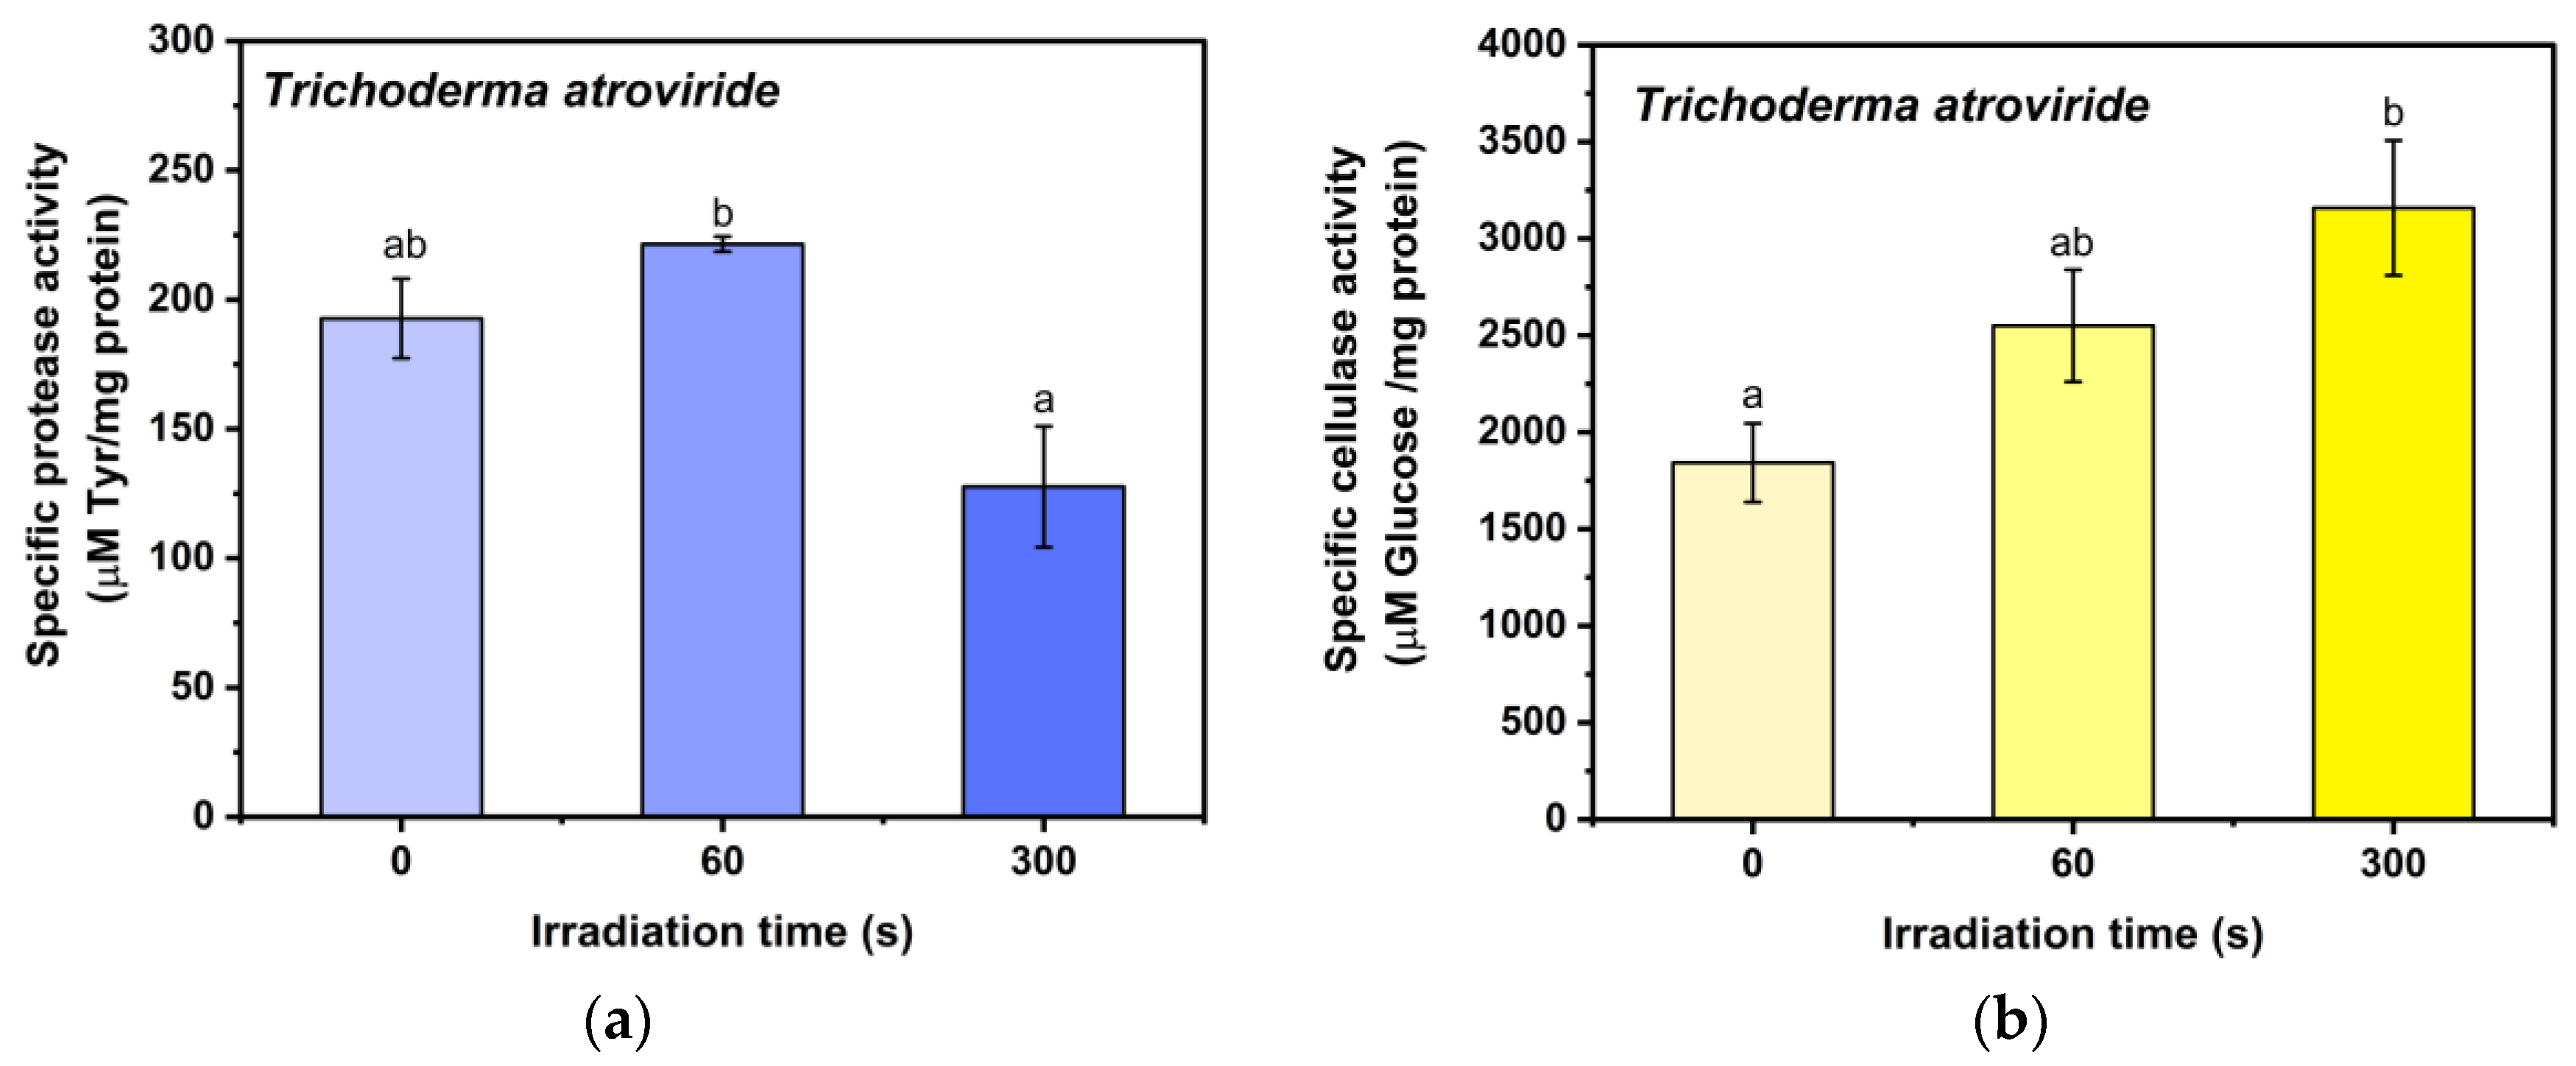
We quantified the total protein from the culture using the Bradford and Biuret methods. Biuret gave 10× higher protein concentration compared to Bradford. It is known that both methods can be affected by interference from other compounds such as polyphenols and flavonoids. As these compounds are liberated from rice husks during fermentation with Trichoderma, they can affect the estimation of total protein. Therefore, the average value between the two methods was taken into consideration. Irradiation induced a decrease in the total protein from 403 µg/mL in the control to 335 µg/mL (17% decrease) for 60 s irradiation to 260 µg/mL (35.5% decrease) for 300 s irradiation. At the end of the experiment, we evaluated the differences between the specific protease and cellulase activities, as expressed per mg of protein (Figure 3). In the case of protease activity, the behavior was similar to total protease activity, but with slightly higher specific activity than the control at 60 s irradiation (Figure 3a). This difference was marginally statistically significant. The data (Figure 2a and Figure 3a) indicate that, although the total protein decreased by 17%, the proportion of proteases from the total protein stayed at the same level as in the control. The percent of proteases decreased significantly after 300 s compared with the control. The significant decrease of the total protein also included a decrease in protease expression. The proportion of active cellulase from the total protein in the cultures became higher at 60 s irradiation and 300 s irradiation compared to the control (Figure 2b and Figure 3b). The decrease in the total protein resulted in higher specific cellulase activity in the irradiated samples than in the control.
The previously reported data proved to be intriguing. Light has previously been shown to stimulate the transcription of cellulase in T. reesei [6,41]. A more recent study found significant differences between the natural isolate of T. reesei QM6 and the derivative strain QM9414, which has improved cellulase gene expression, the latter being more light-tolerant than the former [25]. The investigation showed that, although light induced an increase of transcript levels of specific cellulase genes (in agreement with other studies) of QM9414, the actual cellulase biosynthesis and CMC-ase activity was inhibited [25]. The authors proposed the involvement of post-transcriptional regulation, but this remains to be confirmed. Even more intriguingly, in the case of QM6 even the transcript level was significantly inhibited by light, which contradicts all other previously reported observations. The effects were optical intensity-dependent, with higher optical intensity having higher effect (in the range 700–5000 lux). It is not clear if there is a correlation between the capacity of enzyme production and light tolerance. Light apparently upregulated protease secretion and activity [25].
Our data indicate that the effects of blue laser light on enzymatic activities are highly complex in T. atroviride as well, but our irradiation system seems to induce a less drastic negative effect than that reported for the CMC-ase activity of T. reesei QM6a and QM9414 where the activity was almost completely abolished. In fact, we even observe positive effects at later time and after three irradiations, showing only an apparent delay in reaching maximum cellulase activity upon irradiation. Until the 12th day, and after two irradiations, the cellulase activity stayed at the basal level reached in the control after 5 days of incubation. The effects on enzymatic activities can range from inhibition to stimulation and vice versa, depending on the incubation and irradiation times. Because of the complexity of the context and the differences between the irradiation systems used, and also differences between incubation periods, a direct comparison between our data and previously reported results is difficult to make. Whether the discrepancies are due to genetic differences between species, irradiation systems, or temporal and/or other parameters is unclear and remains to be established in future investigations. For practical applications, there is clearly a need for rigorous optimization of parameters, including the fungal development stage at irradiation, the optical intensity of the laser, the duration of irradiation, and the moment of prelevation. Other Trichoderma/fungal species need to be investigated as well.
In the case of protease activity, our data are partially in agreement with those of the study by Stappler et al., which is, to the best of our knowledge, the only previous study [25], and in which the lower doses are either stimulated or have no effect over time. The highest dose (3 × 300 s) applied seems to be too much as it inhibits the protease activity.

3.2. UV–Vis Spectroscopy

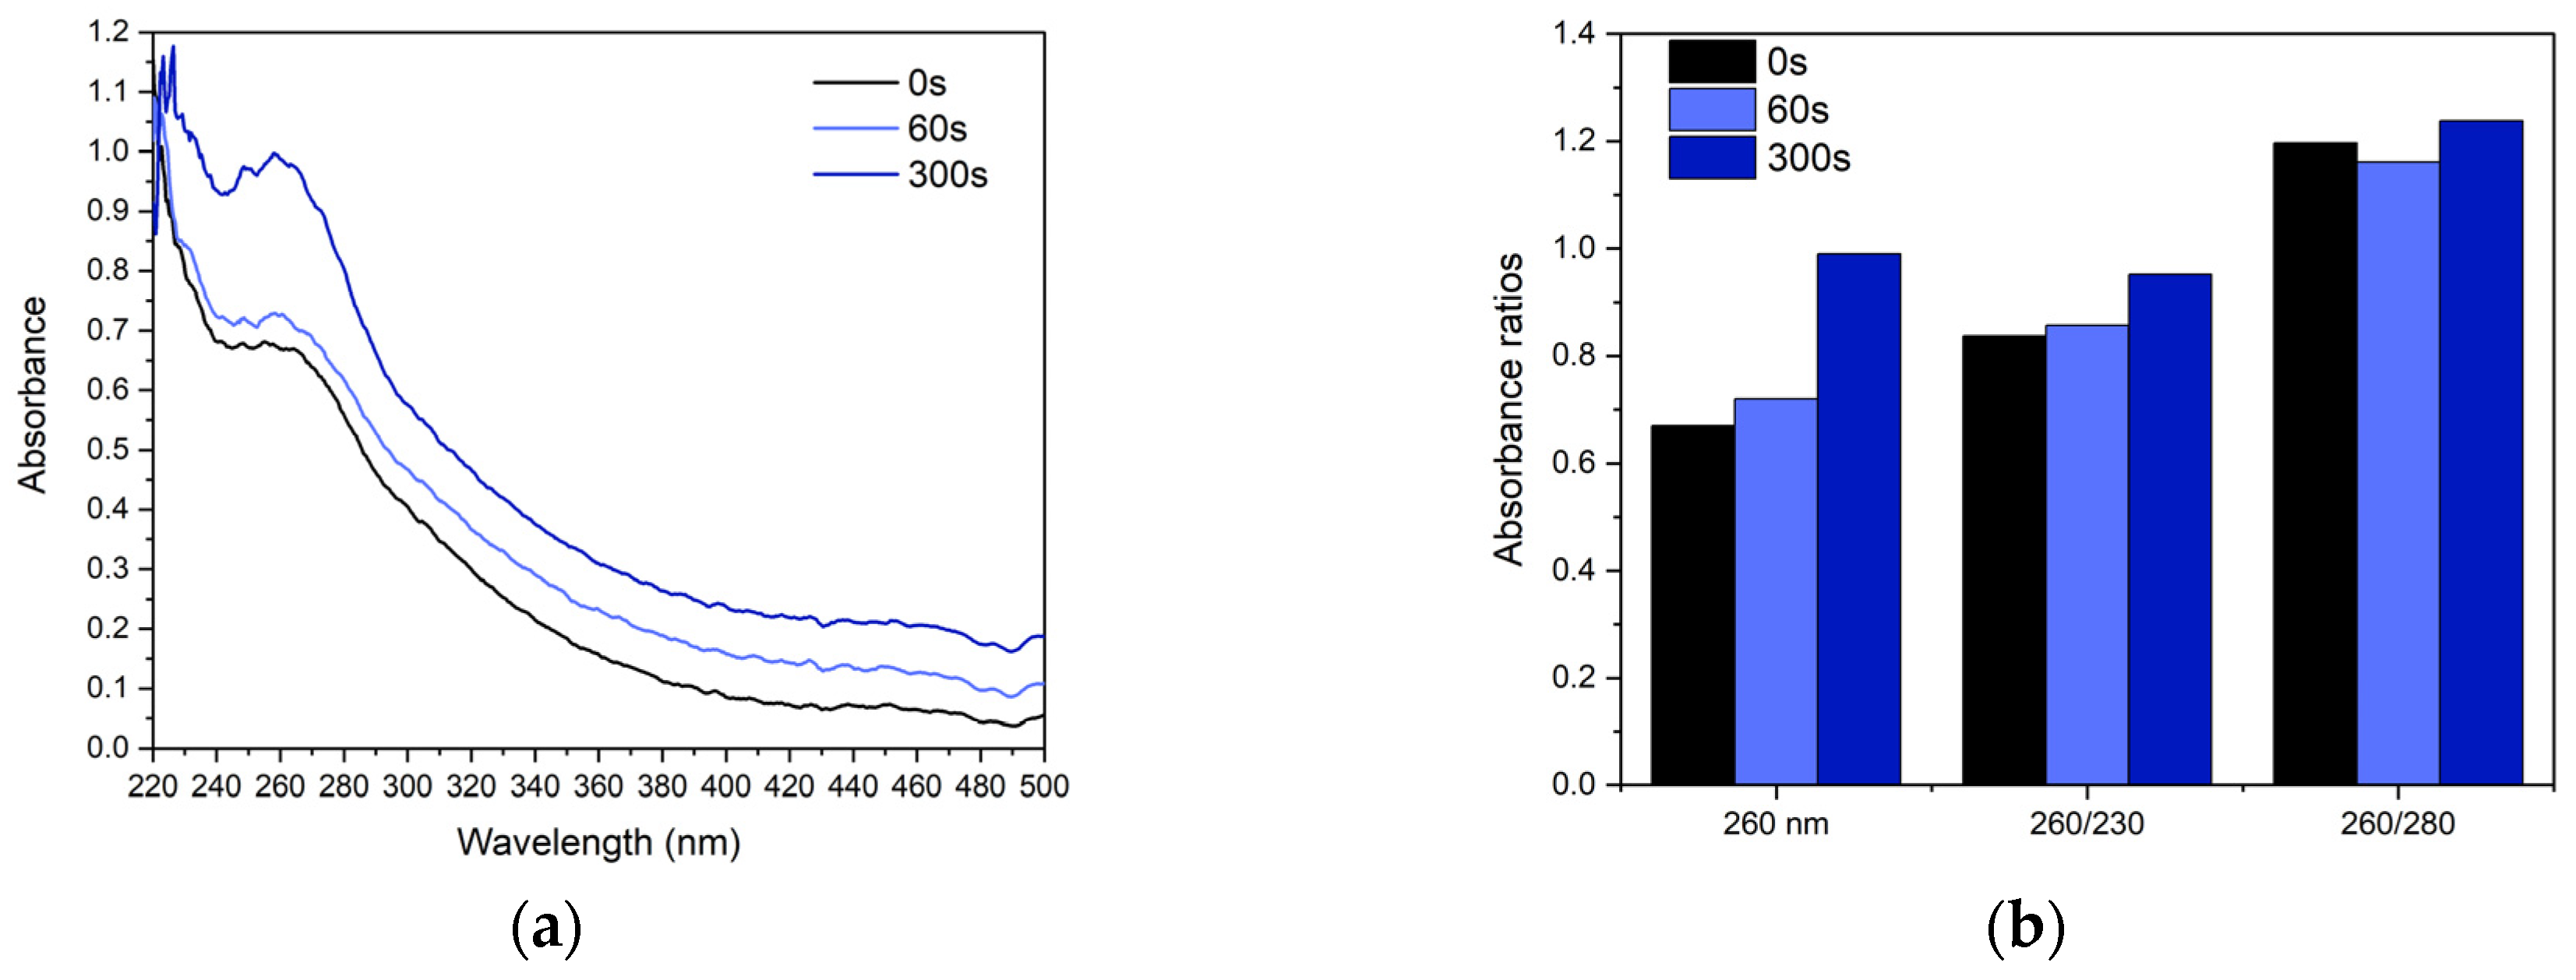
Figure 4 shows the UV–Vis spectra of irradiated and non-irradiated samples. The spectra had a maximum at approx. 260 nm and a second maximum at 220–230 nm for all samples. The absorbance increased along the entire spectrum as a function of irradiation, especially when irradiating for 300 s. The ratio 260/230 was below 1 for all samples and increased with irradiation compared to the control. The ratio 260/280 slightly decreased at 60 s irradiation compared to the control and increased at 300 s irradiation compared to both the control and 60 s irradiation. The spectra most probably represent the overlapping of proteins, polyphenols, polysaccharides, DNA, and metabolites from rice husk and/or Trichoderma, in various proportions, which seem to be partially affected by irradiation. The irradiation for 300 s significantly increased the absorption in the UV region, implying an intense liberation and production of compounds absorbing UV. The average refractive indices of the samples were approximately 1.3336 and 1.3337 for non-irradiated and irradiated samples, respectively. The dry mass contents of undiluted samples, as determined via refractometry were 0.47 ± 0.05% (control, 0 s irradiation), 0.57 ± 0.08% (3 × 60 s total irradiation), and 0.57 ± 0.06% (3 × 300 s total irradiation). The total dry mass slightly increased as a result of irradiation compared to the control, but the higher irradiation dose seemed to increase the proportions of only certain compounds that mainly absorb UV compared to other compounds, and not the total dry mass. Further, more in-depth investigations are necessary to confirm this observation and identify the compounds responsible for it.

3.3. Optical Microscopy Observations

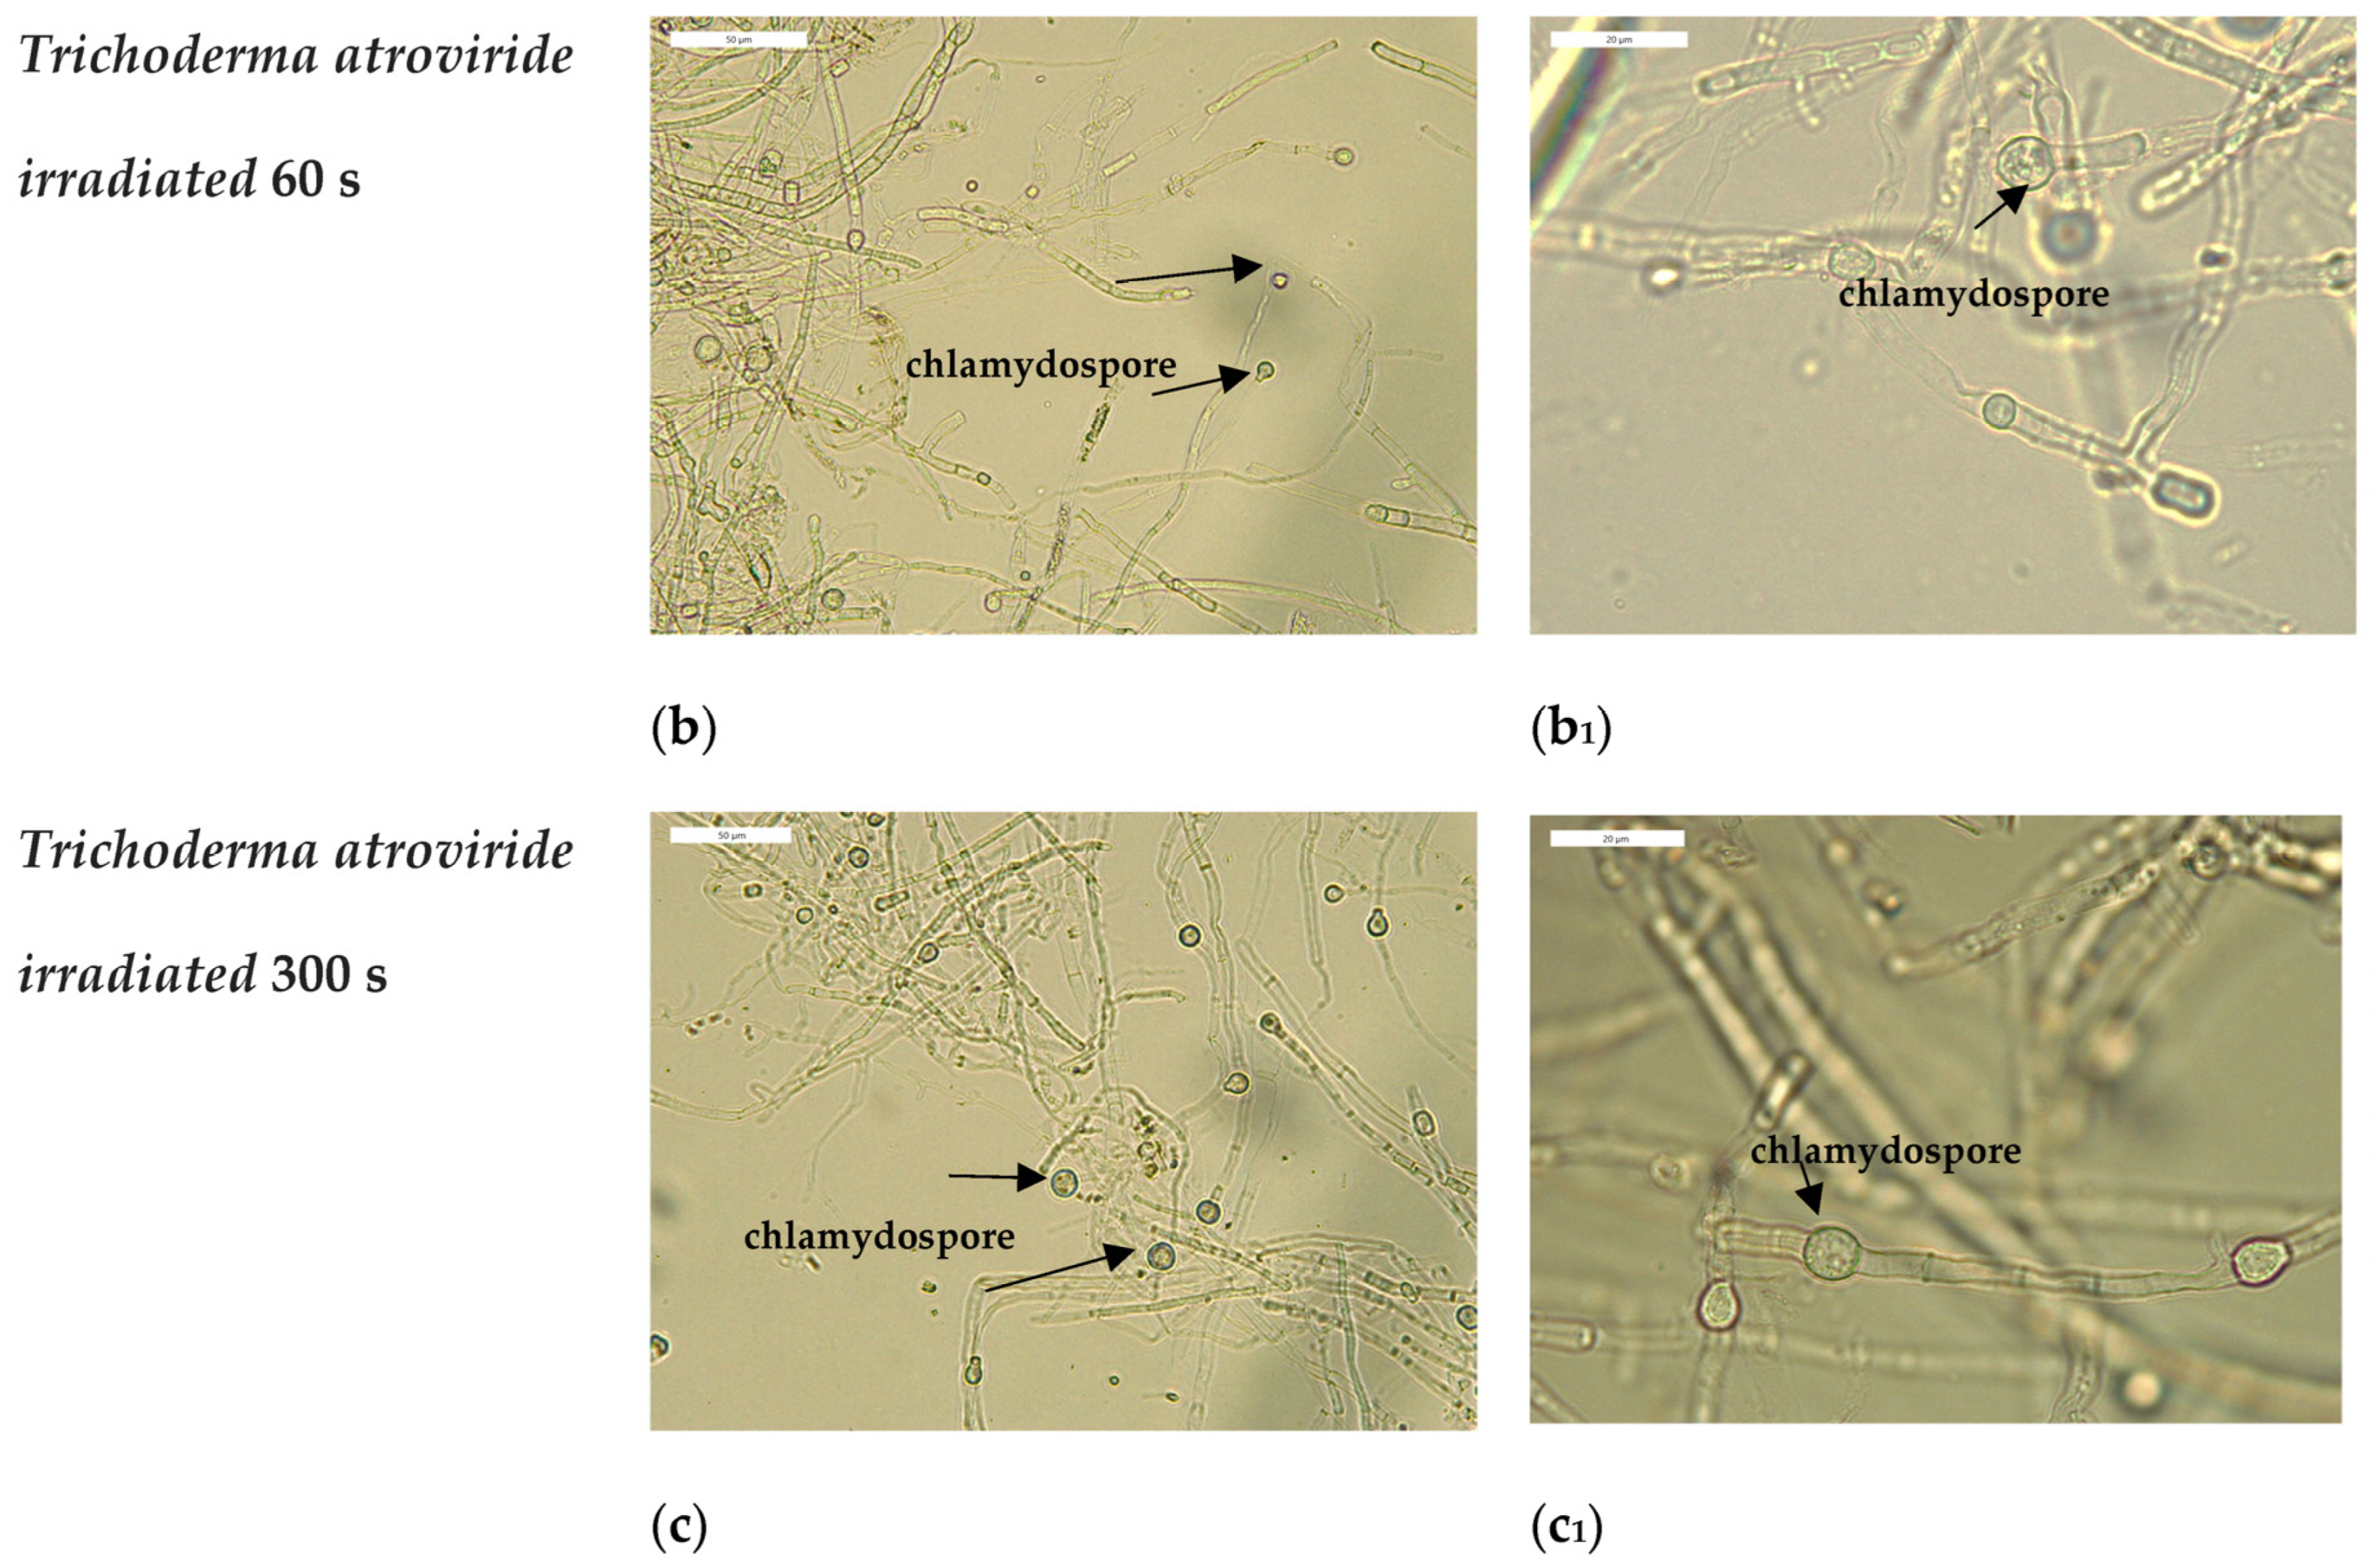
The presence and abundance of conidia and chlamydospores and the morphology of hyphae were analyzed in order to determine the effects of the blue-light laser as a function of irradiation time. Both non-irradiated and irradiated samples presented the following morphological features: long, either straight or sinuous, segmented (septate), and predominantly cylindrical-shaped hyphae; small, green-colored, and ovoid-shaped (globular) conidia (microconidia); chlamydospores (asexual spores with a thicker cell wall and a higher survival rate than microconidia), which were globular in shape, intercalary, or terminal (Figure 5). The irradiation did not affect the shape of the hyphae, conidia, and chlamydospores of T. atroviride, as can be seen in Figure 5.
The abundance of chlamydospores was marginally increased after the 3 × 300 s irradiation time compared to the control, but it was not statistically significant, as quantified from microscopic images (Figure 6). The quantification of chlamydospores is not easy as they are bound to mycelium and are difficult to separate. The trend indicates a possible effect of irradiation on the formation of chlamydospores, but more investigations are necessary in this respect.
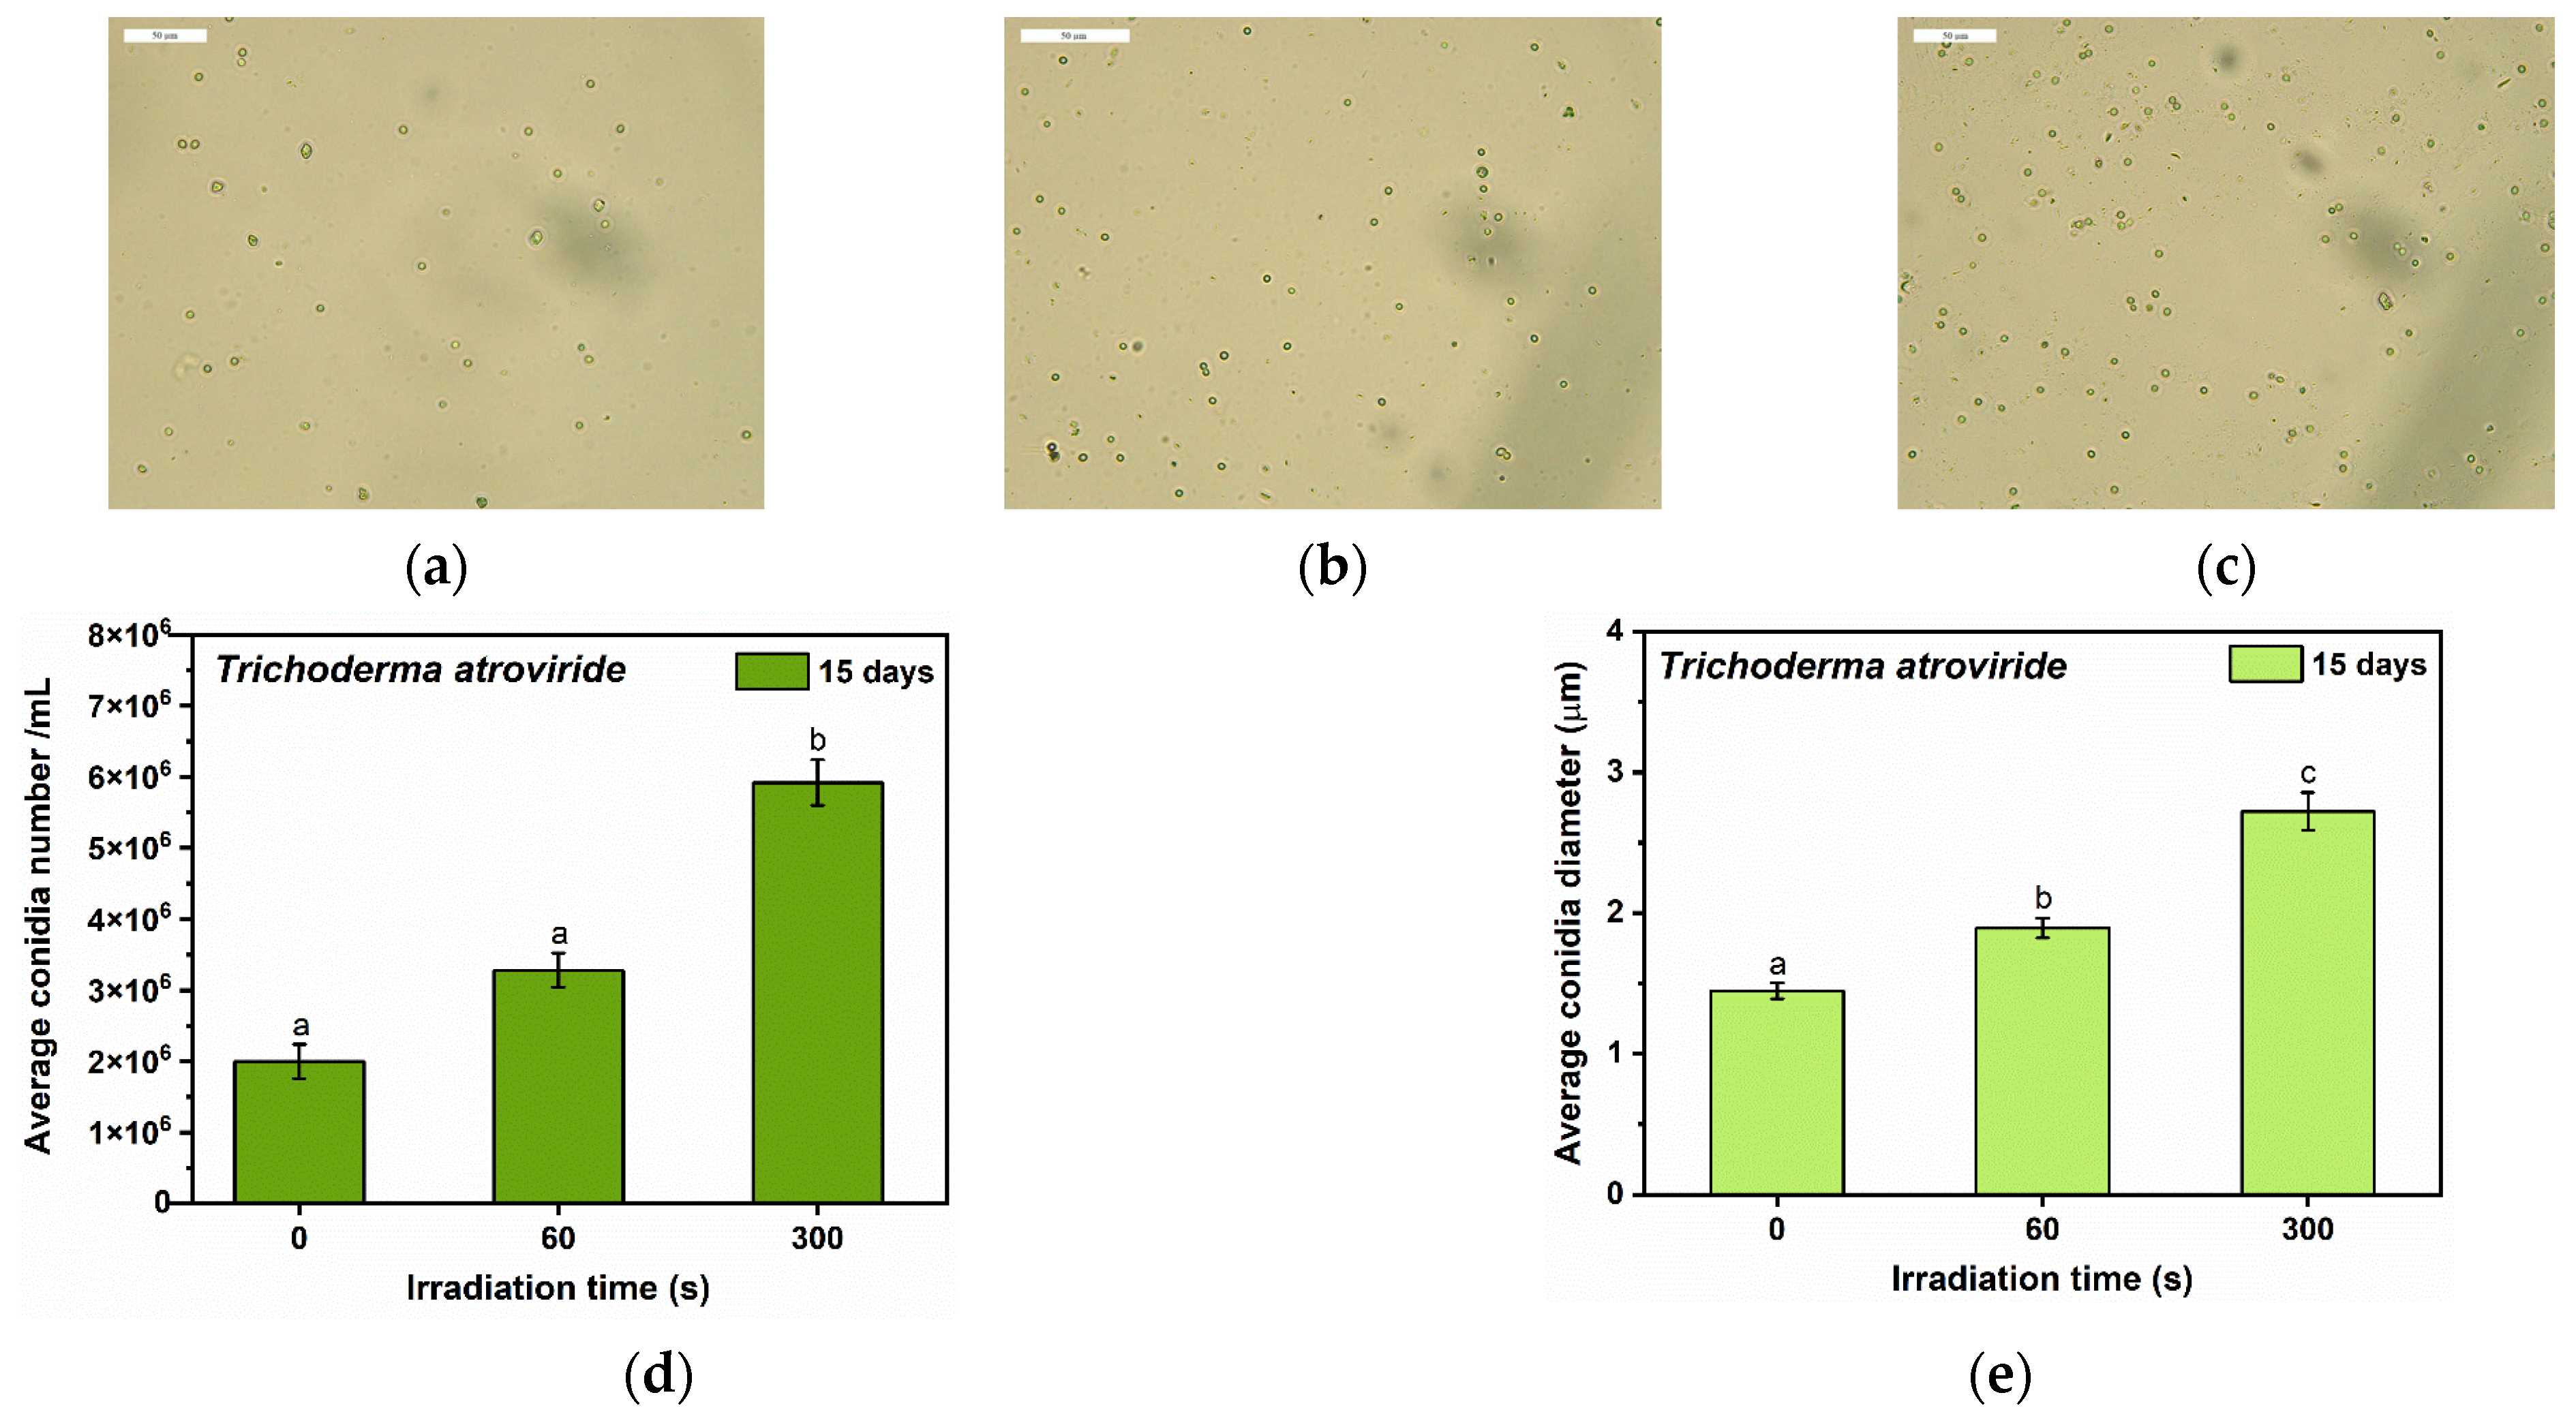
Irradiation for 3 × 60 s slightly increased the production of conidia, and longer irradiation (3 × 300 s) induced a statistically significant increase in conidiation of T. atroviride (Figure 7). This is in agreement with the previous studies and shows that the general effect of light on conidiation is in general independent of the species/strains, irradiation system, or other parameters. Interestingly, the diameter of conidia increased upon irradiation, an aspect that has not been investigated before.
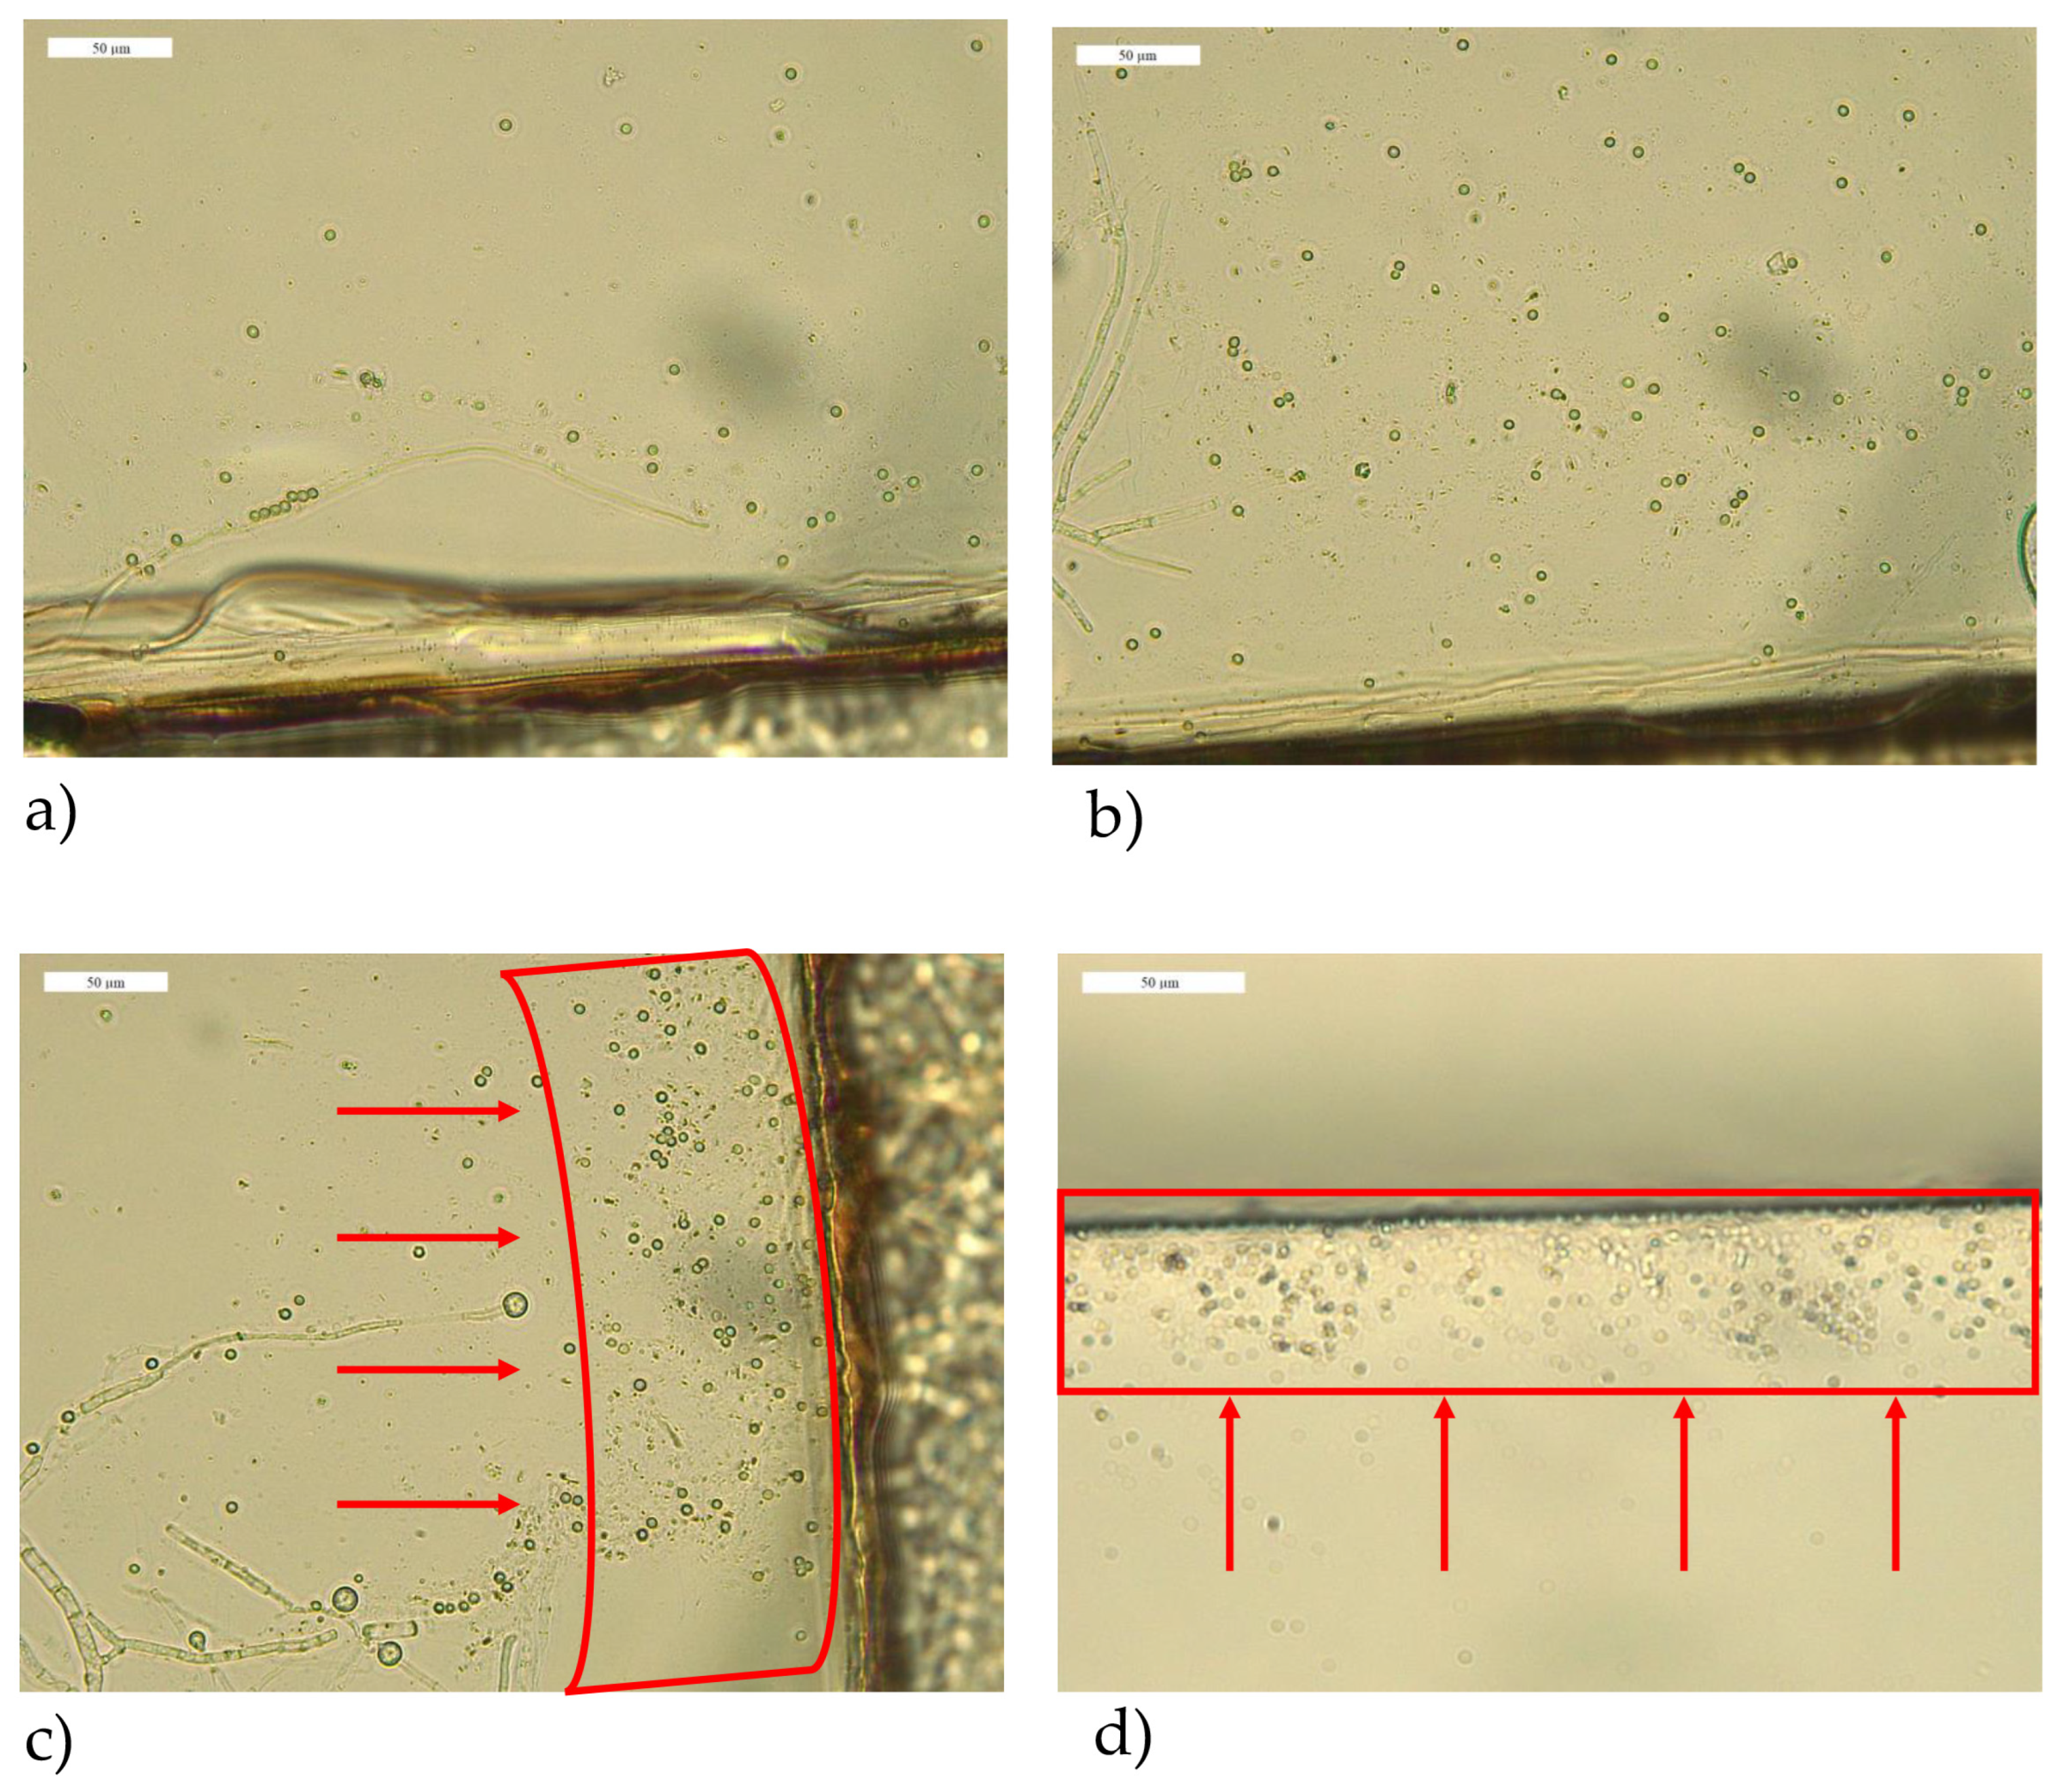
An interesting observation was that the conidia had the tendency to cluster around the liquid–air interface when the longer irradiation of 3 × 300 s was applied (Figure 8), a phenomenon that was not observed in the non-irradiated sample or for the shorter irradiation times. This migration to the liquid–air interface indicates that the conidia could be more hydrophobic upon irradiation compared to the control, but this needs to be confirmed. In a previous study, hydrophobin HFB2, known to be involved in sporulation [42], was identified in the culture of T. reesei grown in light and on cellulose [25]. HFB2 was shown to be highly expressed in T. reesei grown in the presence of complex plant polysaccharides and as response to N and C starvation [43]. Hydrophobins have been shown to be required for conidial hydrophobicity in C. rosea [44]. Correlating these data and considering our substrate, rice husks, with their complex lignocellulosic structure that is hard to decompose, we speculate that the laser irradiation stimulated the production of hydrophobins that probably increased the hydrophobicity of the conidia.
In conclusion, the production as reflected in the activity of enzymes from T. atroviride was cyclic, the highest level being at 12 days of incubation for the control. Irradiation of T. atroviride with a blue-light 400 nm laser was found to influence the protease and cellulase activities. The highest positive impact of the laser on the protease activity compared to the control was observed after 5 days of incubation from the first 60 s irradiation. The highest negative impact of the laser on the protease activity compared to the control was observed after 15 days of incubation and 3 × 300 s irradiations during this period. The highest positive impact of the laser on the cellulase activity compared to the control was observed after 15 days of incubation and 3 × 60 s irradiations during this period. The highest negative impact of the laser on the cellulase activity compared to the control was observed after 12 days of incubation and 3 × 300 s irradiations during this period, but the 3 × 60 s irradiation had a similar negative impact. The effects seem to exhibit a hormesis behavior. The irradiation for 3 × 300 s induces an intensification in the UV absorption of the supernatant, reflecting a higher concentration of UV-absorbing compounds. Regarding the morphological analysis of the T. atroviride strain, there is an increase in the number and dimensions of conidia as a response to irradiation, and there also seems to be an effect on the chlamydospore formation. This was the first study to report blue laser-induced effects on cellulase and protease activities and on conidia dimensions of Trichoderma. More in-depth investigations are needed to optimize the system and technology for possible applications in industry and agriculture.

Author Contributions

Conceptualization, D.C.-A. and F.O.; methodology, F.O., A.A.E. and B.T.; validation, I.-A.B. and N.T.; formal analysis, I.-A.B., N.T., A.A.E. and B.T.; investigation, I.-A.B., N.T., A.A.E. and B.T.; resources, F.O. and A.A.E.; data curation, I.-A.B. and N.T.; writing—original draft preparation, I.-A.B. and N.T.; writing—review and editing, D.C.-A. and F.O.; visualization, D.C.-A. and F.O.; supervision, D.C.-A. and F.O.; project administration, D.C.-A. and A.A.E.; funding acquisition, F.O. All authors have read and agreed to the published version of the manuscript.

Funding

This research was funded by project POC-A1-A1.2.3-G-2015-P_40_352-SECVENT, Sequential processes to close bioeconomy side stream and innovative bioproducts resulted from these, contract 81/2016, SMIS 105684, funded by Cohesion Funds of the European Union, subsidiary project 1477/2020 TrichoSpor. The APC was funded by the same project.

Institutional Review Board Statement

Not applicable.

Informed Consent Statement

Not applicable.

Data Availability Statement

Data are available from authors.

Conflicts of Interest

The authors declare no conflict of interest. The funders had no role in the design of the study; in the collection, analyses, or interpretation of data; in the writing of the manuscript; or in the decision to publish the results.

Appendix A

Table A1. Laser parameters (optical average power as a function of the pump electrical current).
400 nm Laser
Parameters at the exit of the beam radiation from the laser source
Pump Electrical Current (mA)037517494111133151 *170186205227251
Optical Average Power (mW)01306090120150180 *210240270300325
Parameters at the exit from the beam expander
Pump Electrical Current (mA)037517494111133151 *170186205227251
Optical Average Power (mW)0110.1425.8539.8551.867.5881 *97.75106.6119.1134.8152.5
* The underlined numbers represent the values of the laser parameters used in this study.

Appendix B

Figure A1. Average beam diameter as a function of distance from the source and estimation of mean relative error.
Applsci 13 09191 g0a1

References

  1. Yu, Z.; Fischer, R. Light sensing and responses in fungi. Nat. Rev. Microbiol. 2019, 17, 25–36. [Google Scholar] [CrossRef] [PubMed]
  2. Gressel, J.; Galun, E. Morphogenesis in Trichoderma: Photoinduction and RNA. Dev. Biol. 1967, 15, 575–598. [Google Scholar] [CrossRef] [PubMed]
  3. Horwitz, B.A.; Gressel, J.; Malkin, S. The Quest for Trichoderma Cryptochrome. In Proceedings of the Blue Light Effects in Biological Systems, Marburg, Germany, 20–23 July 1984; pp. 237–249. [Google Scholar]
  4. Casas-Flores, S.; Rios-Momberg, M.; Bibbins, M.; Ponce-Noyola, P.; Herrera-Estrella, A. BLR-1 and BLR-2, key regulatory elements of photoconidiation and mycelial growth in Trichoderma atroviride. Microbiology 2004, 150, 3561–3569. [Google Scholar] [CrossRef] [PubMed] [Green Version]
  5. Idnurm, A.; Heitman, J. Light Controls Growth and Development via a Conserved Pathway in the Fungal Kingdom. PLoS Biol. 2005, 3, e95. [Google Scholar] [CrossRef]
  6. Castellanos, F.; Schmoll, M.; Martínez, P.; Tisch, D.; Kubicek, C.P.; Herrera-Estrella, A.; Esquivel-Naranjo, E.U. Crucial factors of the light perception machinery and their impact on growth and cellulase gene transcription in Trichoderma reesei. Fungal Genet. Biol. 2010, 47, 468–476. [Google Scholar] [CrossRef] [PubMed]
  7. Casas-Flores, S.; Rios-Momberg, M.; Rosales-Saavedra, T.; Martínez-Hernández, P.; Olmedo-Monfil, V.; Herrera-Estrella, A. Cross talk between a fungal blue-light perception system and the cyclic AMP signaling pathway. Eukaryot. Cell 2006, 5, 499–506. [Google Scholar] [CrossRef] [PubMed] [Green Version]
  8. Friedl, M.A.; Schmoll, M.; Kubicek, C.P.; Druzhinina, I.S. Photostimulation of Hypocrea atroviridis growth occurs due to a cross-talk of carbon metabolism, blue light receptors and response to oxidative stress. Microbiology 2008, 154, 1229–1241. [Google Scholar] [CrossRef] [Green Version]
  9. Schmoll, M.; Esquivel-Naranjo, E.U.; Herrera-Estrella, A. Trichoderma in the light of day—Physiology and development. Fungal Genet. Biol. 2010, 47, 909–916. [Google Scholar] [CrossRef] [Green Version]
  10. Schmoll, M. Regulation of plant cell wall degradation by light in Trichoderma. Fungal Biol. Biotechnol. 2018, 5, 10. [Google Scholar] [CrossRef]
  11. Hitzenhammer, E.; Büschl, C.; Sulyok, M.; Schuhmacher, R.; Kluger, B.; Wischnitzki, E.; Schmoll, M. YPR2 is a regulator of light modulated carbon and secondary metabolism in Trichoderma reesei. BMC Genom. 2019, 20, 211. [Google Scholar] [CrossRef] [Green Version]
  12. Schalamun, M.; Beier, S.; Hinterdobler, W.; Wanko, N.; Schinnerl, J.; Brecker, L.; Engl, D.E.; Schmoll, M. MAPkinases regulate secondary metabolism, sexual development and light dependent cellulase regulation in Trichoderma reesei. Sci. Rep. 2023, 13, 1912. [Google Scholar] [CrossRef] [PubMed]
  13. Tisch, D.; Schuster, A.; Schmoll, M. Crossroads between light response and nutrient signalling: ENV1 and PhLP1 act as mutual regulatory pair in Trichoderma reesei. BMC Genom. 2014, 15, 425. [Google Scholar] [CrossRef] [Green Version]
  14. Tisch, D.; Schmoll, M. Targets of light signalling in Trichoderma reesei. BMC Genom. 2013, 14, 657. [Google Scholar] [CrossRef] [Green Version]
  15. Schmoll, M.; Schuster, A.; Silva, R.d.N.; Kubicek, C.P. The G-Alpha Protein GNA3 of Hypocrea jecorina (Anamorph Trichoderma reesei) Regulates Cellulase Gene Expression in the Presence of Light. Eukaryot. Cell 2009, 8, 410–420. [Google Scholar] [CrossRef] [Green Version]
  16. Speckbacher, V.; Ruzsanyi, V.; Wigger, M.; Zeilinger, S. The Trichoderma atroviride Strains P1 and IMI 206040 Differ in Their Light-Response and VOC Production. Molecules 2020, 25, 208. [Google Scholar] [PubMed] [Green Version]
  17. Bischof, R.H.; Ramoni, J.; Seiboth, B. Cellulases and beyond: The first 70 years of the enzyme producer Trichoderma reesei. Microb. Cell Fact. 2016, 15, 106. [Google Scholar] [CrossRef] [PubMed] [Green Version]
  18. Schalamun, M.; Schmoll, M. Trichoderma—Genomes and genomics as treasure troves for research towards biology, biotechnology and agriculture. Front. Fungal Biol. 2022, 3, 1002161. [Google Scholar] [CrossRef]
  19. Rosolen, R.R.; Horta, M.A.C.; de Azevedo, P.H.C.; da Silva, C.C.; Sforca, D.A.; Goldman, G.H.; de Souza, A.P. Whole-genome sequencing and comparative genomic analysis of potential biotechnological strains of Trichoderma harzianum, Trichoderma atroviride, and Trichoderma reesei. Mol. Genet. Genom. 2023, 298, 735–754. [Google Scholar] [CrossRef]
  20. Shahnaz, E.; Anwar, A.; Banday, S. Chapter 15—Trichoderma spp. as bio-stimulant: Molecular insights. In New and Future Developments in Microbial Biotechnology and Bioengineering; Singh, H.B., Vaishnav, A., Eds.; Elsevier: Amsterdam, The Netherlands, 2022; pp. 337–350. [Google Scholar]
  21. Velasco-Muñoz, J.F.; Aznar-Sánchez, J.A.; López-Felices, B.; Román-Sánchez, I.M. Circular economy in agriculture. An analysis of the state of research based on the life cycle. Sustain. Prod. Consum. 2022, 34, 257–270. [Google Scholar] [CrossRef]
  22. Magalhães, A.I., Jr.; de Carvalho, J.C.; de Melo Pereira, G.V.; Karp, S.G.; Câmara, M.C.; Medina, J.D.C.; Soccol, C.R. Lignocellulosic biomass from agro-industrial residues in South America: Current developments and perspectives. Biofuels Bioprod. Biorefin. 2019, 13, 1505–1519. [Google Scholar] [CrossRef]
  23. Monteiro, A.R.; Battisti, A.P.; Valencia, G.A.; de Andrade, C.J. The production of high-added-value bioproducts from non-conventional biomasses: An overview. Biomass 2023, 3, 123–137. [Google Scholar]
  24. Sethupathy, S.; Morales, G.M.; Li, Y.; Wang, Y.; Jiang, J.; Sun, J.; Zhu, D. Harnessing microbial wealth for lignocellulose biomass valorization through secretomics: A review. Biotechnol. Biofuels 2021, 14, 154. [Google Scholar] [CrossRef] [PubMed]
  25. Stappler, E.; Walton, J.D.; Beier, S.; Schmoll, M. Abundance of Secreted Proteins of Trichoderma reesei Is Regulated by Light of Different Intensities. Front. Microbiol. 2017, 8, 2586. [Google Scholar] [CrossRef] [PubMed] [Green Version]
  26. Woo, S.L.; Hermosa, R.; Lorito, M.; Monte, E. Trichoderma: A multipurpose, plant-beneficial microorganism for eco-sustainable agriculture. Nat. Rev. Microbiol. 2023, 21, 312–326. [Google Scholar] [PubMed]
  27. Contreras-Cornejo, H.A.; Macías-Rodríguez, L.; Del-Val, E.; Larsen, J. Ecological functions of Trichoderma spp. and their secondary metabolites in the rhizosphere: Interactions with plants. FEMS Microbiol. Ecol. 2016, 92, fiw036. [Google Scholar] [PubMed] [Green Version]
  28. Şesan, T.E.; Oancea, A.O.; Ştefan, L.M.; Mănoiu, V.S.; Ghiurea, M.; Răut, I.; Constantinescu-Aruxandei, D.; Toma, A.; Savin, S.; Bira, A.F. Effects of foliar treatment with a Trichoderma plant biostimulant consortium on Passiflora caerulea L. yield and quality. Microorganisms 2020, 8, 123. [Google Scholar] [PubMed] [Green Version]
  29. Saxena, A.; Raghuwanshi, R.; Singh, H.B. Elevation of defense network in chilli against Colletotrichum capsici by phyllospheric Trichoderma strain. J. Plant Growth Regul. 2016, 35, 377–389. [Google Scholar]
  30. Metz, B.; Seidl-Seiboth, V.; Haarmann, T.; Kopchinskiy, A.; Lorenz, P.; Seiboth, B.; Kubicek, C.P. Expression of Biomass-Degrading Enzymes Is a Major Event during Conidium Development in Trichoderma reesei. Eukaryot. Cell 2011, 10, 1527–1535. [Google Scholar] [CrossRef] [Green Version]
  31. Horwitz, B.A.; Perlman, A.; Gressel, J. Induction of Trichoderma sporulation by nanosecond laser pulses: Evidence against cryptochrome cycling. Photochem. Photobiol. 1990, 51, 99–104. [Google Scholar] [CrossRef]
  32. Gaderer, R.; Lamdan, N.; Frischmann, A.; Sulyok, M.; Krska, R.; Horwitz, B.; Seidl-Seiboth, V. Sm2, a paralog of the Trichoderma cerato-platanin elicitor Sm1, is also highly important for plant protection conferred by the fungal-root interaction of Trichoderma with maize. BMC Microbiol. 2015, 15, 2. [Google Scholar] [CrossRef] [Green Version]
  33. Zaidem, A.; Silva, L.; Ferreira, A.; Carvalho, M.; Ragni, M.; Abegão, L.; Pinheiro, P. New biocompatible technique based on the use of a laser to control the whitefly Bemisia tabaci. Photonics 2023, 10, 636. [Google Scholar] [CrossRef]
  34. Anson, M.L. The estimation of pepsin, trypsin, papain, and cathepsin with hemoglobin. J. Gen. Physiol. 1938, 22, 79–89. [Google Scholar] [CrossRef] [PubMed]
  35. Folin, O.; Ciocalteu, V. On tyrosine and tryptophane determinations in proteins. J. Biol. Chem. 1927, 73, 627–650. [Google Scholar] [CrossRef]
  36. Zhang, Y.-H.P.; Hong, J.; Ye, X. Cellulase Assays. Biofuels Methods Mol. Biol. 2009, 581, 213–231. [Google Scholar] [CrossRef]
  37. Bradford, M.M. A rapid and sensitive method for the quantitation of microgram quantities of protein utilizing the principle of protein-dye binding. Anal. Biochem. 1976, 72, 248–254. [Google Scholar] [CrossRef]
  38. Copeland, R.A. Methods for Protein Quantitation. In Methods for Protein Analysis; Copeland, R.A., Ed.; Springer: Boston, MA, USA, 1994; pp. 39–58. [Google Scholar]
  39. Compton, S.J.; Jones, C.G. Mechanism of dye response and interference in the Bradford protein assay. Anal. Biochem. 1985, 151, 369–374. [Google Scholar] [CrossRef] [PubMed]
  40. Singh, R.; Lu, R.; Hu, M. Flavonoids interference in common protein assays: Effect of position and degree of hydroxyl substitution. Anal. Biochem. 2020, 597, 113644. [Google Scholar] [CrossRef]
  41. Schmoll, M.; Franchi, L.; Kubicek, C.P. Envoy, a PAS/LOV Domain Protein of Hypocrea jecorina (Anamorph Trichoderma reesei), Modulates Cellulase Gene Transcription in Response to Light. Eukaryot. Cell 2005, 4, 1998–2007. [Google Scholar] [CrossRef] [Green Version]
  42. Askolin, S.; Penttilä, M.; Wösten, H.A.B.; Nakari-Setälä, T. The Trichoderma reesei hydrophobin genes hfb1 and hfb2 have diverse functions in fungal development. FEMS Microbiol. Lett. 2005, 253, 281–288. [Google Scholar] [CrossRef] [Green Version]
  43. Nakari-Setälä, T.; Aro, N.; IlméN, M.; Muñoz, G.; Kalkkinen, N.; Penttilä, M. Differential Expression of the Vegetative and Spore-Bound Hydrophobins of Trichoderma Reesei Cloning and Characterization of the Hfb2 Gene. Eur. J. Biochem. 1997, 248, 415–423. [Google Scholar] [CrossRef]
  44. Dubey, M.K.; Jensen, D.F.; Karlsson, M. Hydrophobins are required for conidial hydrophobicity and plant root colonization in the fungal biocontrol agent Clonostachys rosea. BMC Microbiol. 2014, 14, 18. [Google Scholar] [CrossRef] [Green Version]
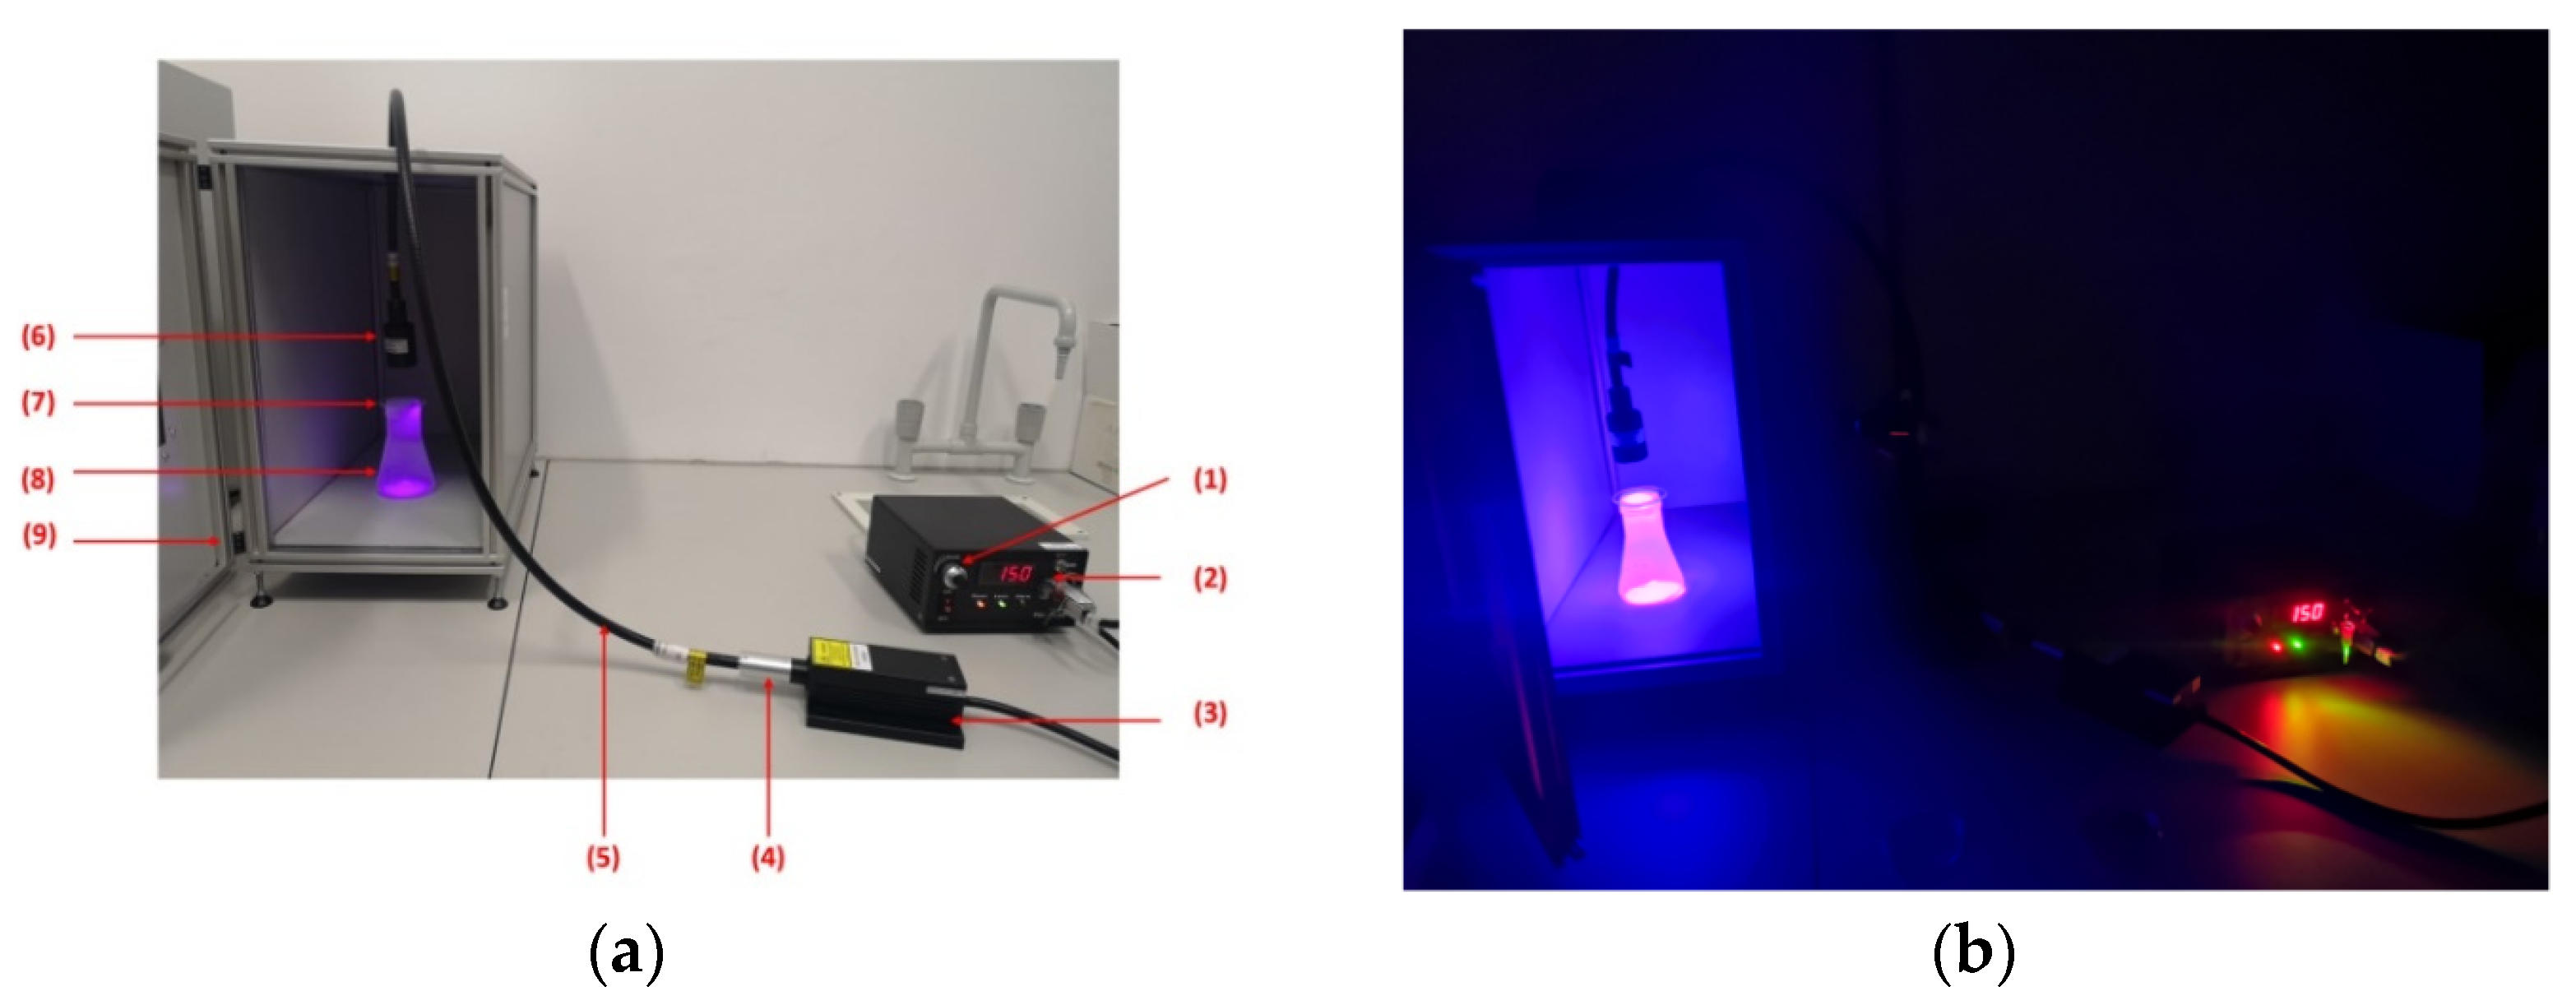
Figure 1. (a) Experimental model for the laser irradiation of T. atroviride: (1) potentiometer for adjusting the intensity of the pump electrical current; (2) current source; (3) laser head; (4) system for coupling the optical fiber; (5) optical fiber; (6) autocollimator; (7) optical window; (8) Erlenmeyer flask; (9) box for irradiation in the dark. (b) The experimental model during irradiation in the dark. (The door was kept closed during the irradiation.)
Applsci 13 09191 g001
Figure 2. Protease and cellulase production: (a) protease activity of T. atroviride as a response to being exposed for different time intervals (60 and 300 s) to 0.271 µmoles/s 400 nm laser irradiation; (b) cellulase activity of T. atroviride as a response to being exposed for different time intervals to 0.271 µmoles/s 400 nm laser irradiation; Tyr = tyrosine; The columns with the same letter do not differ significantly. Bars are ± error bars, α = 0.05, n = 3.
Applsci 13 09191 g002
Figure 3. Specific protease (a) and cellulase (b) activity of T. atroviride as a function of irradiation time with the 400 nm laser. The columns with the same letter do not differ significantly. Bars are ± error bars, α = 0.05, n = 3.
Applsci 13 09191 g003
Figure 4. (a) UV–Vis spectra of Trichoderma cultures grown on rice husks, non-irradiated (0 s) and irradiated for 3 × 60 s and 3 × 300 s with 0.271 µmoles/s 400 nm laser irradiation, after 15 days of incubation; (b) the absorbance values at 260 nm and the ratios 260 nm/230 nm and 260 nm/280 nm of Trichoderma cultures grown on rice husks, non-irradiated (0 s) and irradiated for 3 × 60 s and 3 × 300 s with 0.271 µmoles/s 400 nm laser irradiation, after 15 days of incubation.
Applsci 13 09191 g004
Figure 5. Morphological structures present in Trichoderma atroviride strain irradiated at 0.271 µmoles/s: (ac) (40× objective); (a1c1) (100× objective, with immersion). Arrow indicates chlamydospores. White labelled bars represent dimension at microscopic level—50 µm.
Applsci 13 09191 g005aApplsci 13 09191 g005b
Figure 6. Relative abundance of chlamydospores in the irradiated and non-irradiated T. atroviride The columns with the same letter do not differ significantly. Bars are ±error bars, α = 0.05, n = 6.
Applsci 13 09191 g006
Figure 7. Abundance of conidia: (a) conidia of non-irradiated T. atroviride; (b) conidia of 3 × 60 s irradiated T. atroviride; (c) conidia of 3 × 300 s irradiated T. atroviride; (d) average number of conidia/mL in the irradiated and non-irradiated T. atroviride, as measured using hemocytometer. The columns with the same letter do not differ significantly. Bars are ±error bars, α = 0.05, n = 3; (e) average diameter of conidia The columns with the same letter do not differ significantly. Bars are ±error bars, α = 0.05, n = 15. White labelled bars represent dimension at microscopic level—50 µm.
Applsci 13 09191 g007
Figure 8. The conidia of T. atroviride strain had the tendency to cluster more at the liquid–air interface in the samples irradiated with 0.271 µmoles/s 400 nm laser for 3 × 300 s (c,d) compared to those non-irradiated (a) or irradiated for shorter time, 3 × 60 s (b). All images were taken with 40× objective. White labelled bars represent dimension at microscopic level—50 µm.
Applsci 13 09191 g008
Table 1. Laser parameters for the MDL-III-400-300mW (PSU-III-FDA) diode laser.
Distance from Source [cm]Beam
Diameter [cm]
Beam Area
[cm2]
Avg. Optical Power [mW]Optical Intensity [mW/cm2]
105.5 ± 0.323.8 ± 1.781 ± 1.63.4 ± 0.3
158 ± 0.450.3 ± 3.681 ± 1.61.6 ± 0.1
21.511 ± 0.695.0 ± 6.981 ± 1.60.9 ± 0.1
3517 ± 0.9227.0 ± 16.481 ± 1.60.4 ± 0.0
41.520 ± 1314.2 ± 22.781 ± 1.60.3 ± 0.0
Disclaimer/Publisher’s Note: The statements, opinions and data contained in all publications are solely those of the individual author(s) and contributor(s) and not of MDPI and/or the editor(s). MDPI and/or the editor(s) disclaim responsibility for any injury to people or property resulting from any ideas, methods, instructions or products referred to in the content.