Article

Implementing a Digital Twin of an Underground Utility Tunnel for Geospatial Feature Extraction Using a Multimodal Image Sensor

1
Department of Future & Smart Construction Research, Korea Institute of Civil Engineering and Building Technology, Goyang-si 10223, Republic of Korea
2
IANSIT, Incheon 21999, Republic of Korea
*
Author to whom correspondence should be addressed.
Appl. Sci. 2023, 13(16), 9137; https://doi.org/10.3390/app13169137
Submission received: 18 July 2023 / Revised: 4 August 2023 / Accepted: 9 August 2023 / Published: 10 August 2023
(This article belongs to the Special Issue Advances in Civil Infrastructures Engineering)

Abstract

:
The increasing interest in digital twin technology, the digitalization of worn-out social overhead capital (SOC), and disaster management services has augmented the usage of 3D spatial models and information to manage infrastructure. In this study, a digital twin of a subterranean utility tunnel was created, and spatial objects were identified using inbuilt image sensors. The novelty lies in the development of a unique algorithm that breaks down the structure of the utility tunnel into points, lines, and planes, identifying objects using a multimodal image sensor that incorporates light detection and ranging (LiDAR) technology. The three main conclusions of this study are the following: First, a digital twin of the utility tunnel was constructed using building information modeling integrated with a geographic information system (BIM-GIS). Second, a method for extracting spatial objects was defined. Third, image-sensor-based segmentation and a random sample consensus (RANSAC) were applied. In this process, the supplementary algorithm for extracting and updating 3D spatial objects was analyzed and improved. The developed algorithm was tested using point cloud data, showing easier object classification with more precise LiDAR data.

1. Introduction

The increasing interest in digital twin technology, along with the digital transformation of deteriorating social overhead capital (SOC) and disaster response services, has propagated diverse three-dimensional spatial models in the management of facilities grounded in 3D spatial data [1]. These virtual models are applied in sectors such as urban, disaster, and facility management, necessitating the establishment and maintenance of both internal and external spatial data [2]. However, existing spatial information services primarily focus on external spaces, and data models have been primarily formulated to depict objects, leading to insufficient property information and restrained spatial analysis capabilities [3]. Therefore, a data model that supports services using 3D interior space data and geographic information system (GIS) technology is required. Such a model would provide visual details about interior spaces and enable robust spatial analyses.
Underground utility tunnels are essential for urban infrastructure and housing and for managing vital systems of a city, such as the power, communication, water supply, and heating facilities in underground environments [4]. These tunnels help circumvent recurrent excavations and the indiscriminate use of underground spaces for the upkeep of these facilities, enhancing the urban landscape, mitigating disasters, maintaining road structures, and ensuring smooth traffic flow [5]. Nevertheless, because these tunnels encompass vital services, disasters within them can damage both underground and ground-level spaces [6].
Therefore, it is urgent to create digital twins of these underground utility tunnels to provide disaster and structural safety management services. Recently, studies have begun to apply machine learning to solve structural problems in underground tunnels [7,8]. Digital twin technology, thus, digitalizes real-world designs, enabling the intelligent management of aging underground utility tunnel systems.

2. Literature Review

2.1. Underground Facility Digital Twins and Structure Performance Analysis

Digital twin technology is a cutting-edge technique that creates virtual models of physical processes, products, or services [9,10]. This model enables a real-time data analysis and system monitoring, offering the opportunity to optimize efficiency, identify problems preventively, and test potential solutions [11]. The applications of digital twin technology in various sectors include the following:
-
Manufacturing [12,13,14]: Digital twins create virtual models of machinery to anticipate failures, schedule maintenance, and enhance quality control.
-
Construction [15,16,17]: Through digital twins, buildings are virtually replicated to optimize designs, reduce waste, and enhance safety by predicting hazards.
-
Transportation [18,19,20]: Digital twins mirror real-life transport systems to optimize traffic flow, reduce congestion, and improve safety by recreating accident scenarios.
-
Healthcare [21,22]: Digital twins mimic patients’ body parts to formulate personalized treatment plans and educate healthcare professionals for various scenarios.
In particular, digital twins are extremely useful for underground facilities where conventional visual inspections might be challenging or unfeasible. They offer the capacity to track the structural integrity of these structures, monitoring aspects such as the stress and strain on walls and various other elements. This is possible by setting up sensors that can identify shifts in the structural activities, such as vibrations or movements. The information obtained from these sensors is integrated into the digital twin, delivering a precise depiction of structural dynamics.
Technologies such as imaging sensors and LiDAR are employed to assess the sturdiness of structures such as buildings, bridges, and subterranean utility tunnels [23]. These sensors are capable of identifying structural deformations and movements that may suggest instability while also tracking alterations in structures over time to flag possible issues. Digital twins facilitate the visualization and analysis of the data gathered from these sensors, enabling the prompt identification and prevention of potential structural collapses.

2.2. Geospatial Feature Extraction

Light detection and ranging (LiDAR) is a technology that can measure distances by shooting light pulses and recording the time they require to bounce back [24]. It is often used for creating accurate 3D maps or models, commonly in the form of point clouds (datasets composed of 3D points representing the surfaces of objects). While identifying changes in spatial entities, this involves comparing different scans or time frames of the same location to detect changes. These include structural changes in a building, vegetation growth or reduction, and shifts in land topography.
These 3D LiDAR data often must be processed using specialized software or libraries to be analyzed. Two libraries commonly used for this purpose are the Point Cloud Library (PCL) and Open3D.
-
PCL (Point Cloud Library): This is a comprehensive, open-source library specifically designed for the processing of 3D point cloud data [25]. It provides many features and functions such as point filtering, surface normal or curvature estimation, disparate point cloud alignment, and shape recognition. It can support a variety of formats, making it suitable for various applications.
-
Open3D: This is another open-source library aimed at processing 3D data. It is known for its speed, and it provides easy-to-use pipelines for processing point clouds, meshes, and depth images [26]. Open3D also includes functions for 3D visualization, 3D reconstruction, and 3D registration (aligning different 3D data sets).

2.3. Finding Changes in 2D and 3D Spatial Objects

For 2D spatial entities, the primary techniques employed are segmentation and classification. These techniques can be described as follows:
-
Segmentation: This process involves dividing an image into regions or segments that correspond to objects or their parts [27]. In 2D, this is achieved based on x and y pixel coordinates, disregarding depth (z) information.
-
Classification: After segmentation, color information in the form of red, green, and blue (RGB) values from each segment is used for classification [28]. Pixels or regions are grouped into categories or classes based on their RGB values. An alternative approach is using digital elevation model (DEM) data to assign z values to a 2D image, providing a measure of depth or elevation.
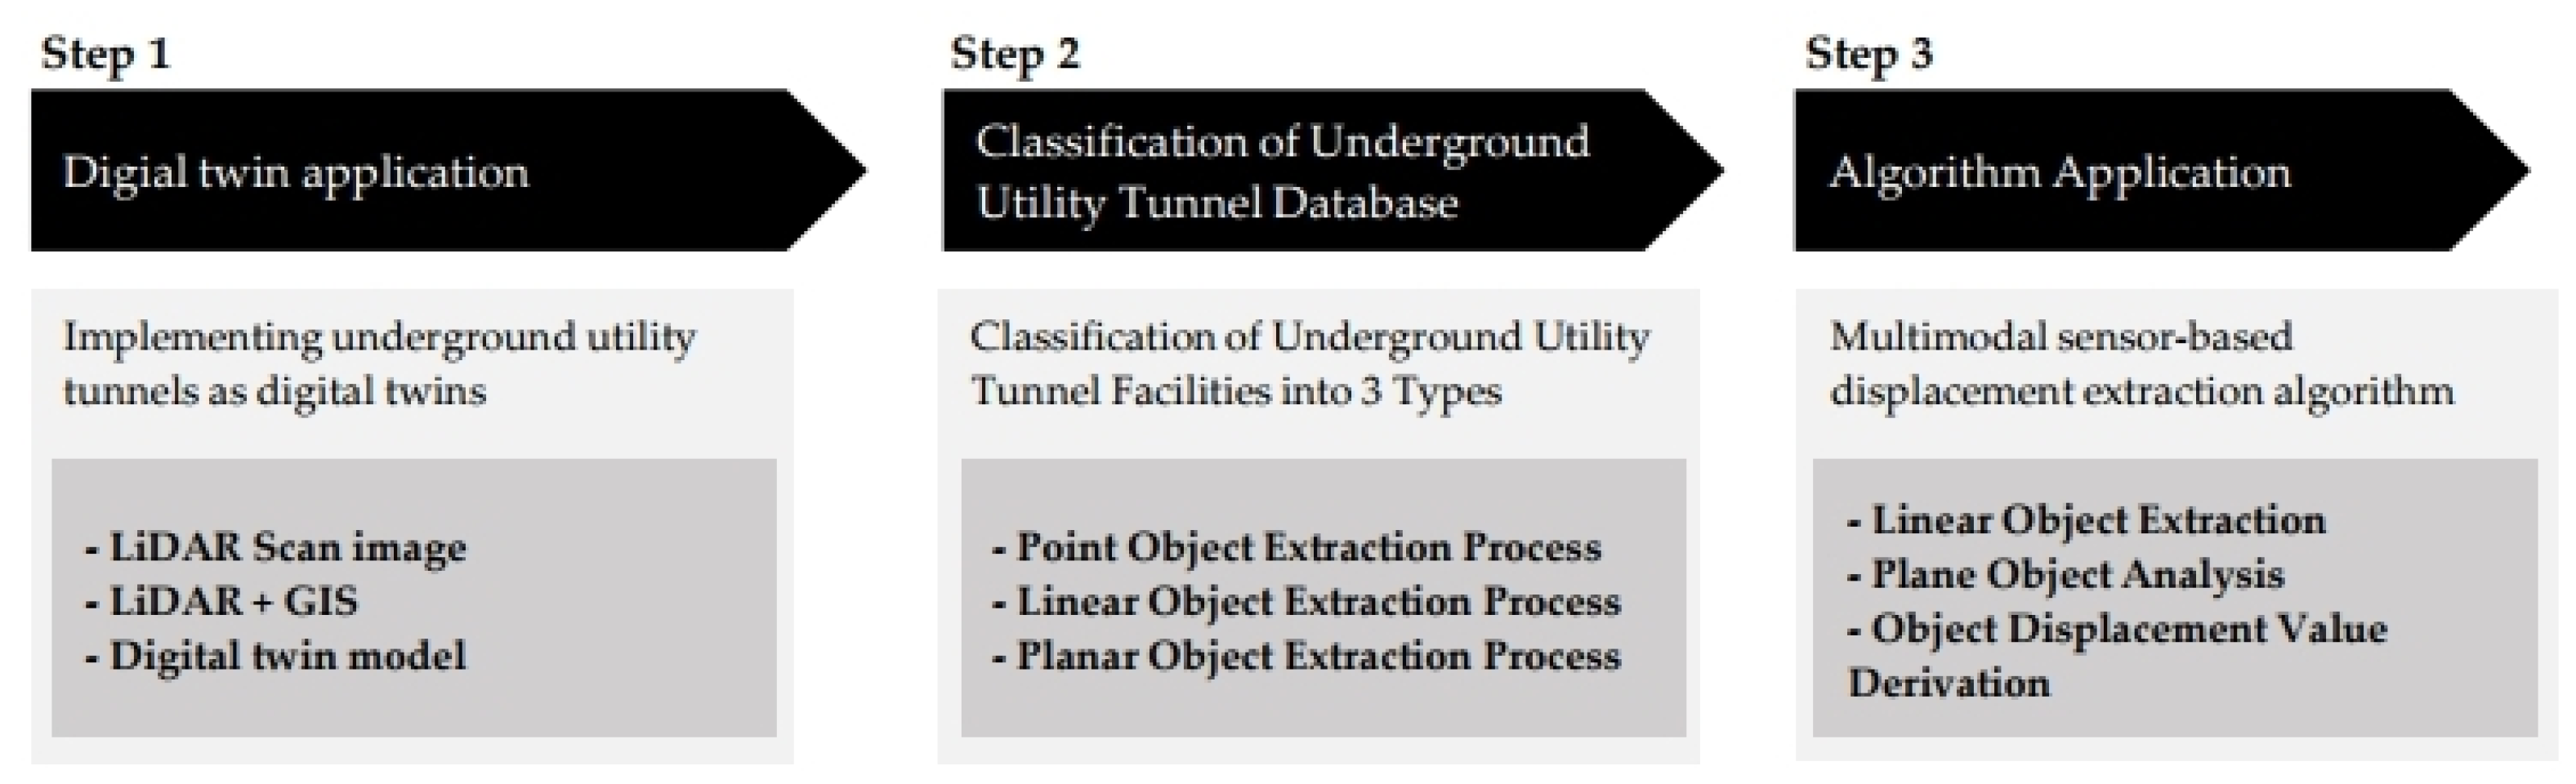
The final step in evaluating changes is conducting a time-series analysis of the segmented or classified data. This analysis involves the comparison of the same spatial entity over multiple time points, looking for changes in its segmentation or classification.
For 3D spatial entities, the process starts with segmentation but differs in the subsequent steps [29]. Rather than classification, the data are partitioned further according to pre-established rules that might be based on specific characteristics of the spatial entities, such as size, shape, or relation to other entities. After the rule-based partitioning, the altered (or current) and pre-existing 3D datasets are compared to identify changes. The use of “rule-based” methods, as described, signifies that the rules for partitioning or categorizing the data are not set and can be adapted based on the data or objectives of the analysis. They can be optimized over time based on the accuracy of their results.
The primary objective of this study was to devise and implement scenarios for detecting changes in spatial objects to forecast potential disasters and the expansion of underground utility tunnels. For this, we used 3D LiDAR sensor data to analyze the spatial object extraction algorithm. Additionally, software was developed to assess the performance of the algorithm using simulated environments.

3. Methods

As shown in Figure 1, there were three steps in this study.
-
Step 1: Underground Utility Tunnel Digital Twin: Create a virtual replica (digital twin) of the underground utility tunnel to bridge the physical and digital worlds. This involves using sensor data, 3D modeling, and simulation software to create a detailed digital model for monitoring, planning, and a predictive analysis.
-
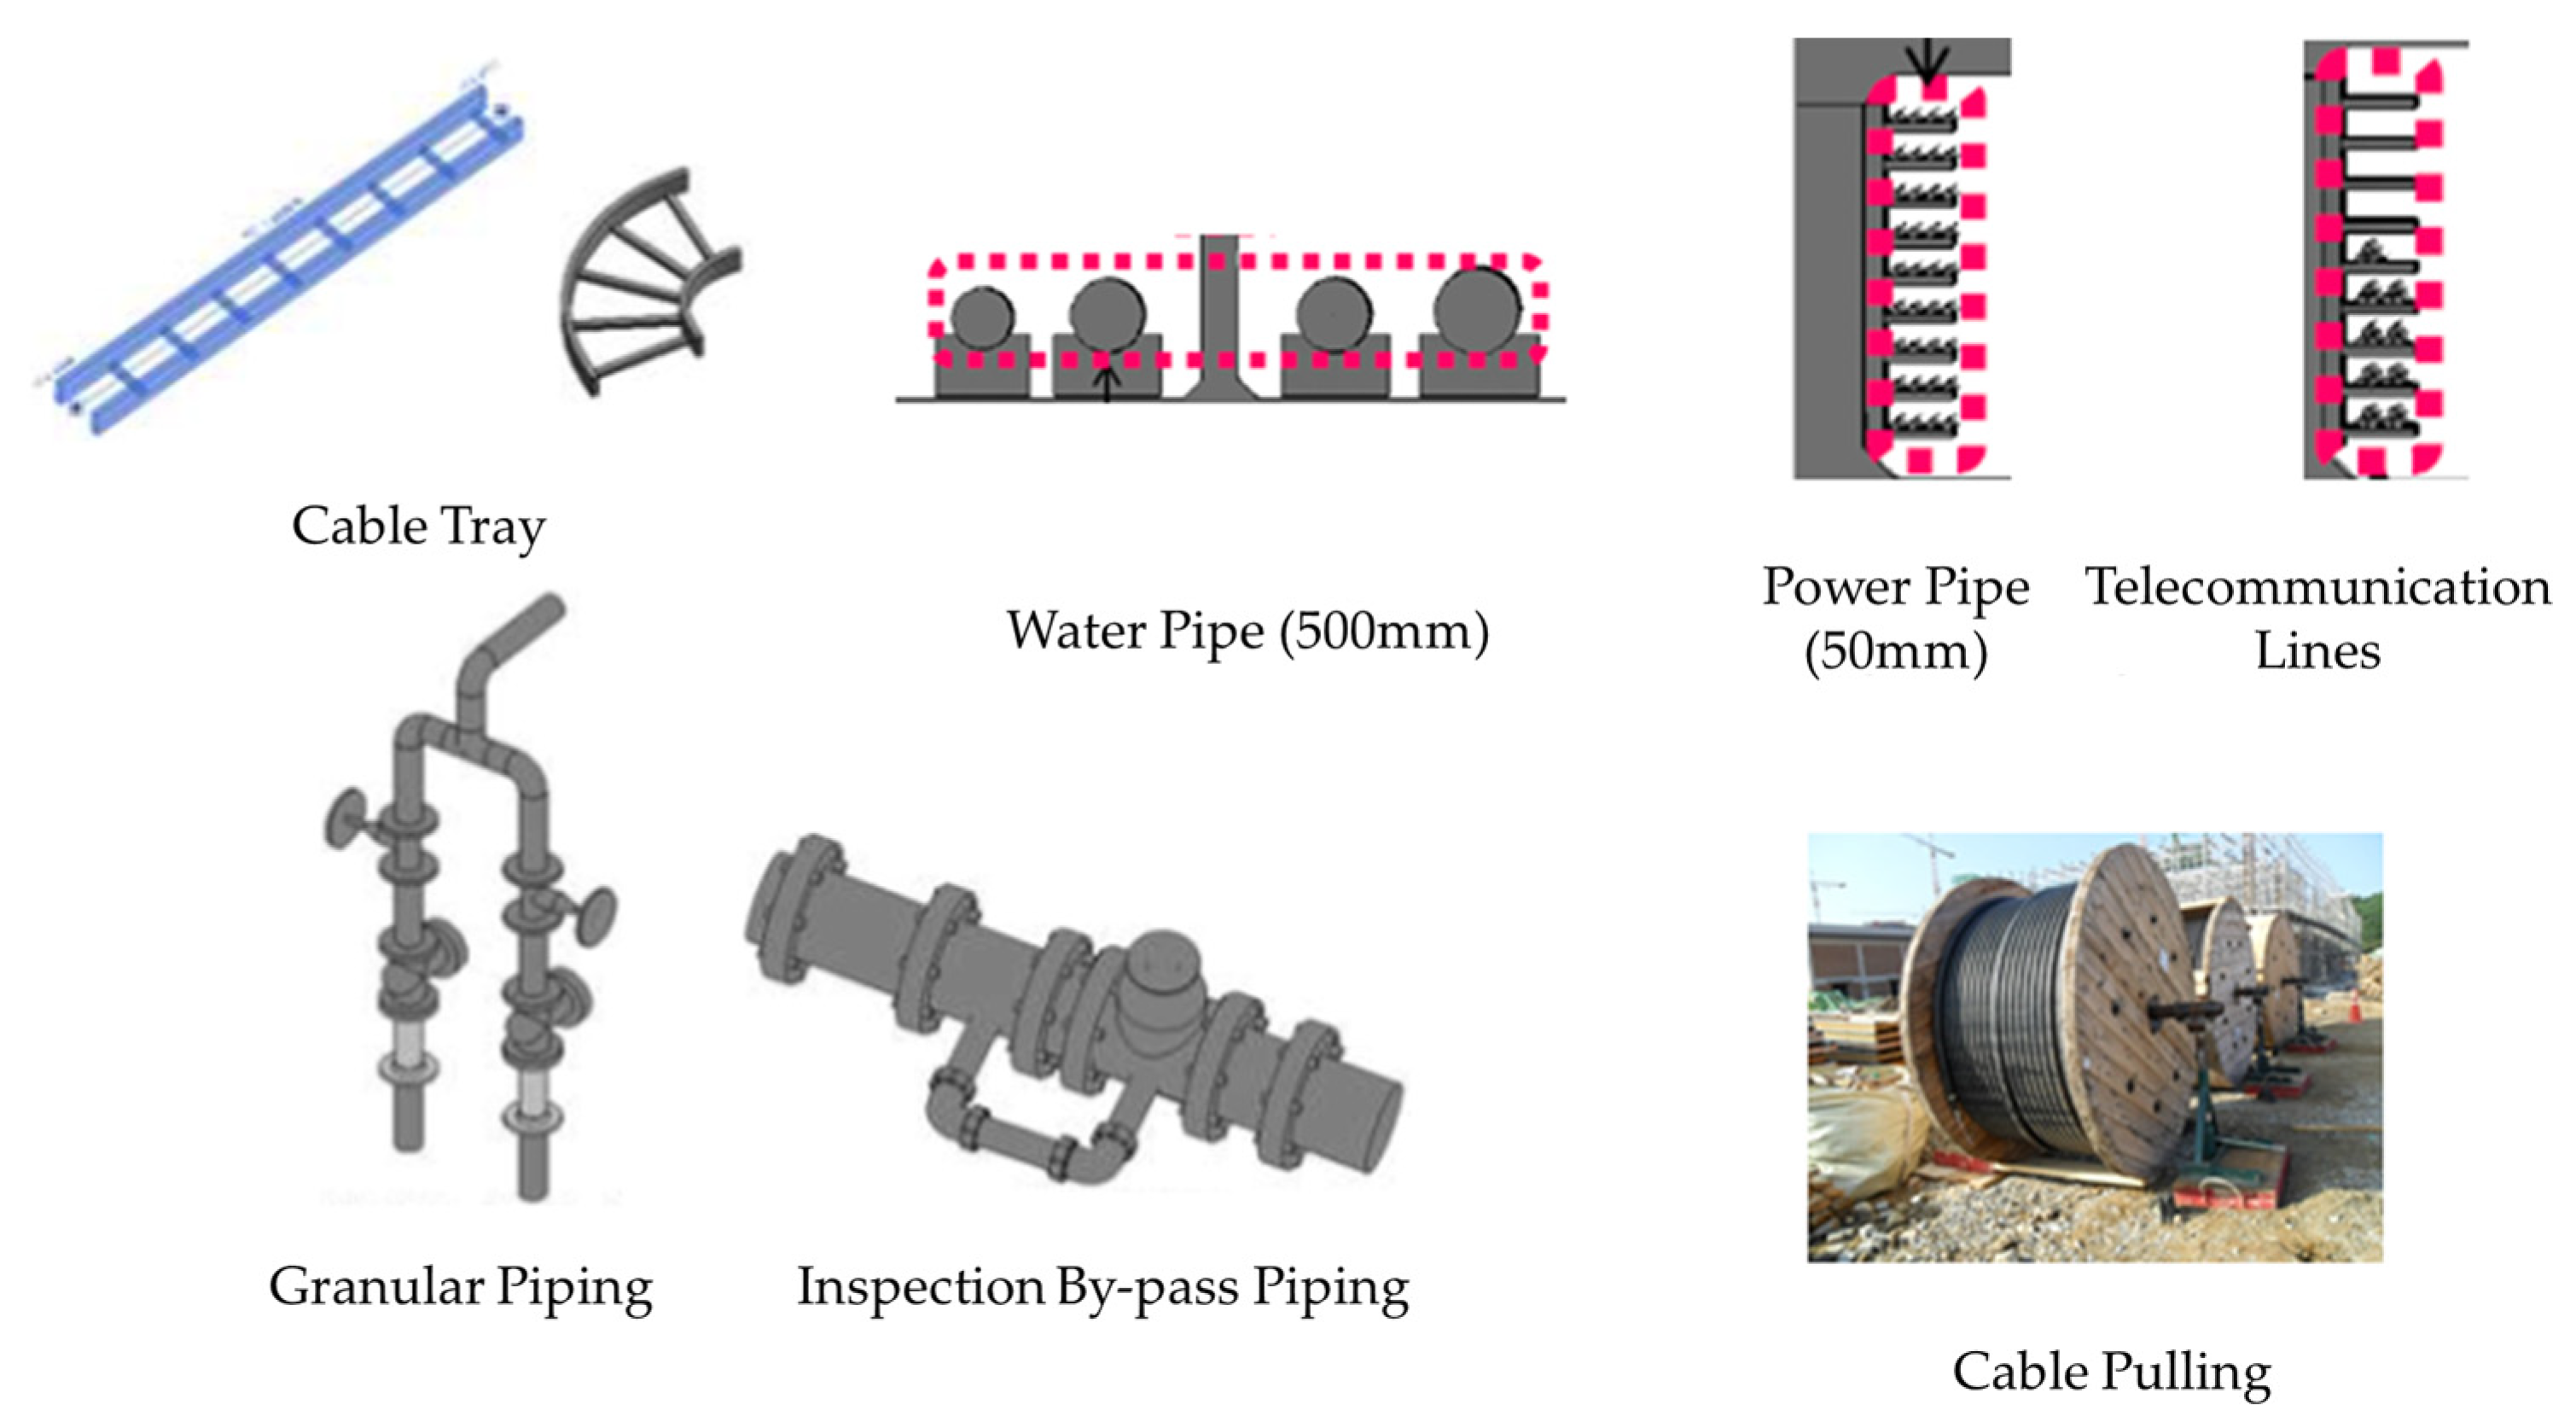
Step 2: Classification of Tunnel Database: Classify the data collected about the underground utility tunnels based on attributes like function, materials, location, and size. Also, categorize the tunnels as point, linear, or planar objects.
Point objects represent specific locations, e.g., junctions or sensors.
Linear objects have a length but a negligible width and height, e.g., pipelines or cables.
Planar objects have two dimensions (length and width), representing sections or larger features within the tunnel.
-
Step 3: Object Segmentation Algorithm: Apply object segmentation algorithms to the digital twin of the underground utility tunnel to identify and distinguish different elements within the model. This involves dividing the digital image into meaningful segments for an easier analysis, enabling tasks such as identifying utility lines, structural components, and sections of the tunnel to support decision making and predictive maintenance.

3.1. Constructions of the Digital Twin of an Underground Utility Tunnel Based on BIM-GIS

Building information modeling (BIM) and geographic information systems (GIS) are two powerful technologies that have been applied separately in many engineering and construction projects. BIM creates detailed 3D models of a facility, including all its components and their characteristics, while GIS is designed to capture, manipulate, analyze, and present geographical data. Combining these two systems for underground facilities can provide numerous advantages, including better planning and design, more efficient construction and maintenance, improved safety, and cost savings. In this process, we first needed to collect relevant geographical and facility-specific data. These data were then integrated into the BIM and GIS systems, creating a 3D model of the facility and mapping it in its geographical context. This combined system can be used in the design and planning stages, offering insight into spatial relationships and potential issues. During construction, the system guides the process and is later used for maintenance tracking, predicting repairs and replacements. Finally, BIM and GIS can be used for simulating various scenarios to improve the facility’s design and safety features, aiding in risk management decisions.
The Ochang utility tunnel spans three segments with a cumulative length of 5586 m, of which the demonstration segment measures 1210 m. Some portions of the tunnel were selected as demonstration service segments owing to their challenging conditions. These segments include a 750 m stretch of the power section prone to fire incidents, a 60 m intense condensation area, and a 400 m part of the communications/water supply section. Figure 2 denotes these segments. To aid the research, 3D building information modeling (BIM) was implemented for the entire section, using the as-built drawings available at the time of its completion. However, for the demonstration segment, only level of development (LOD) 4-based 3D modeling was carried out through laser scanning.

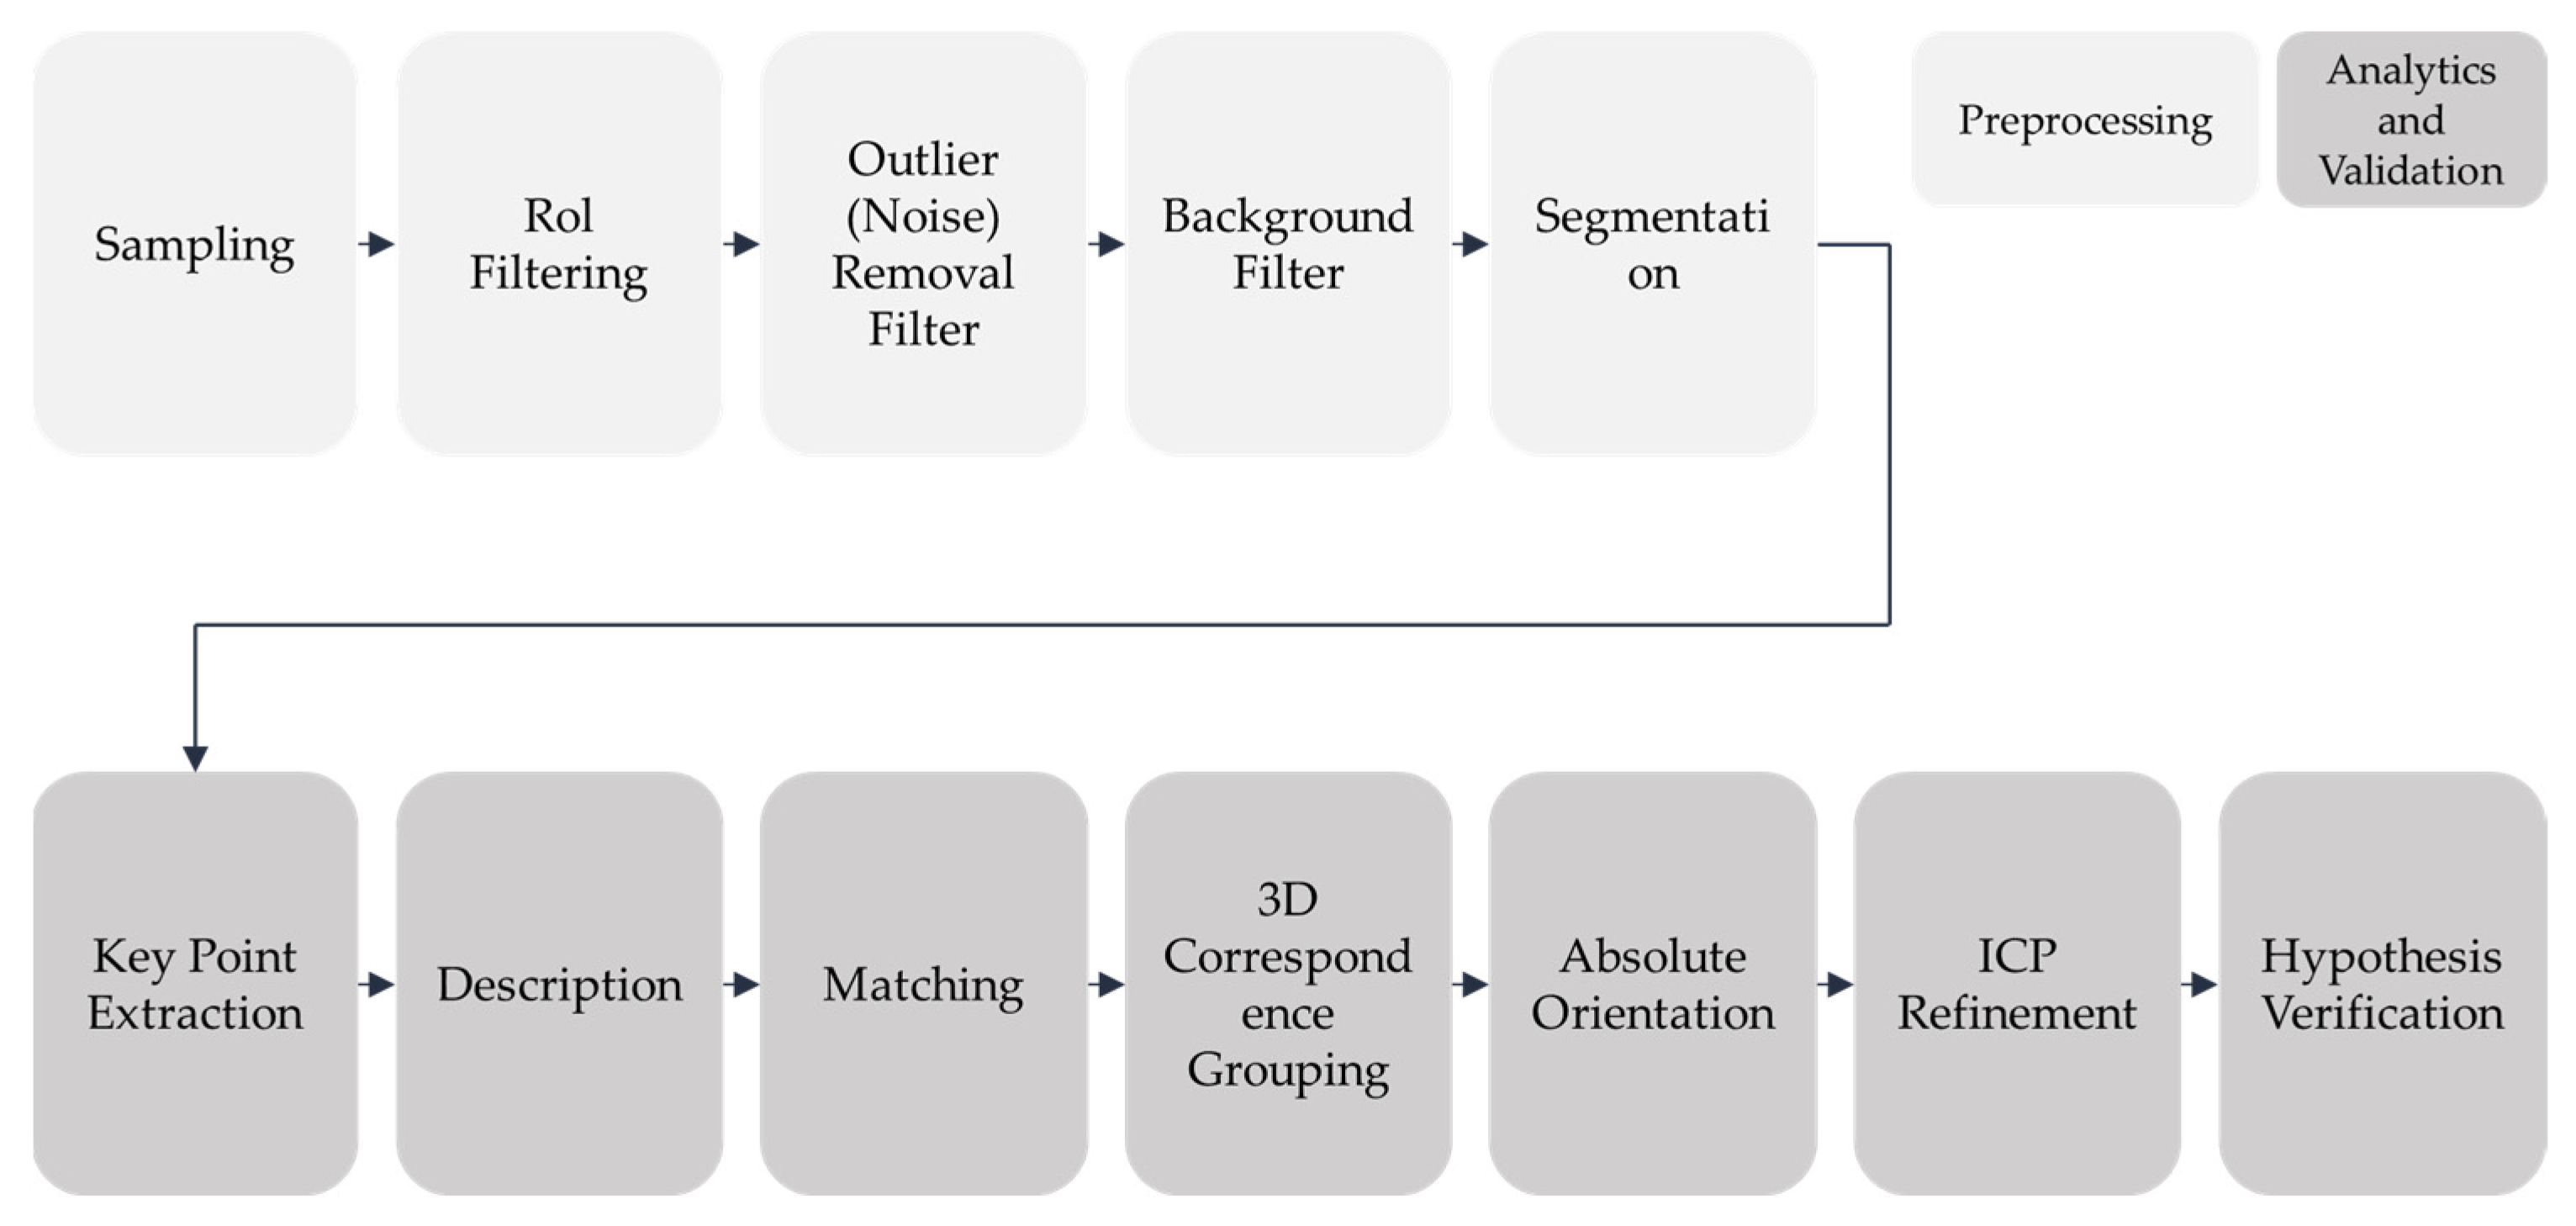
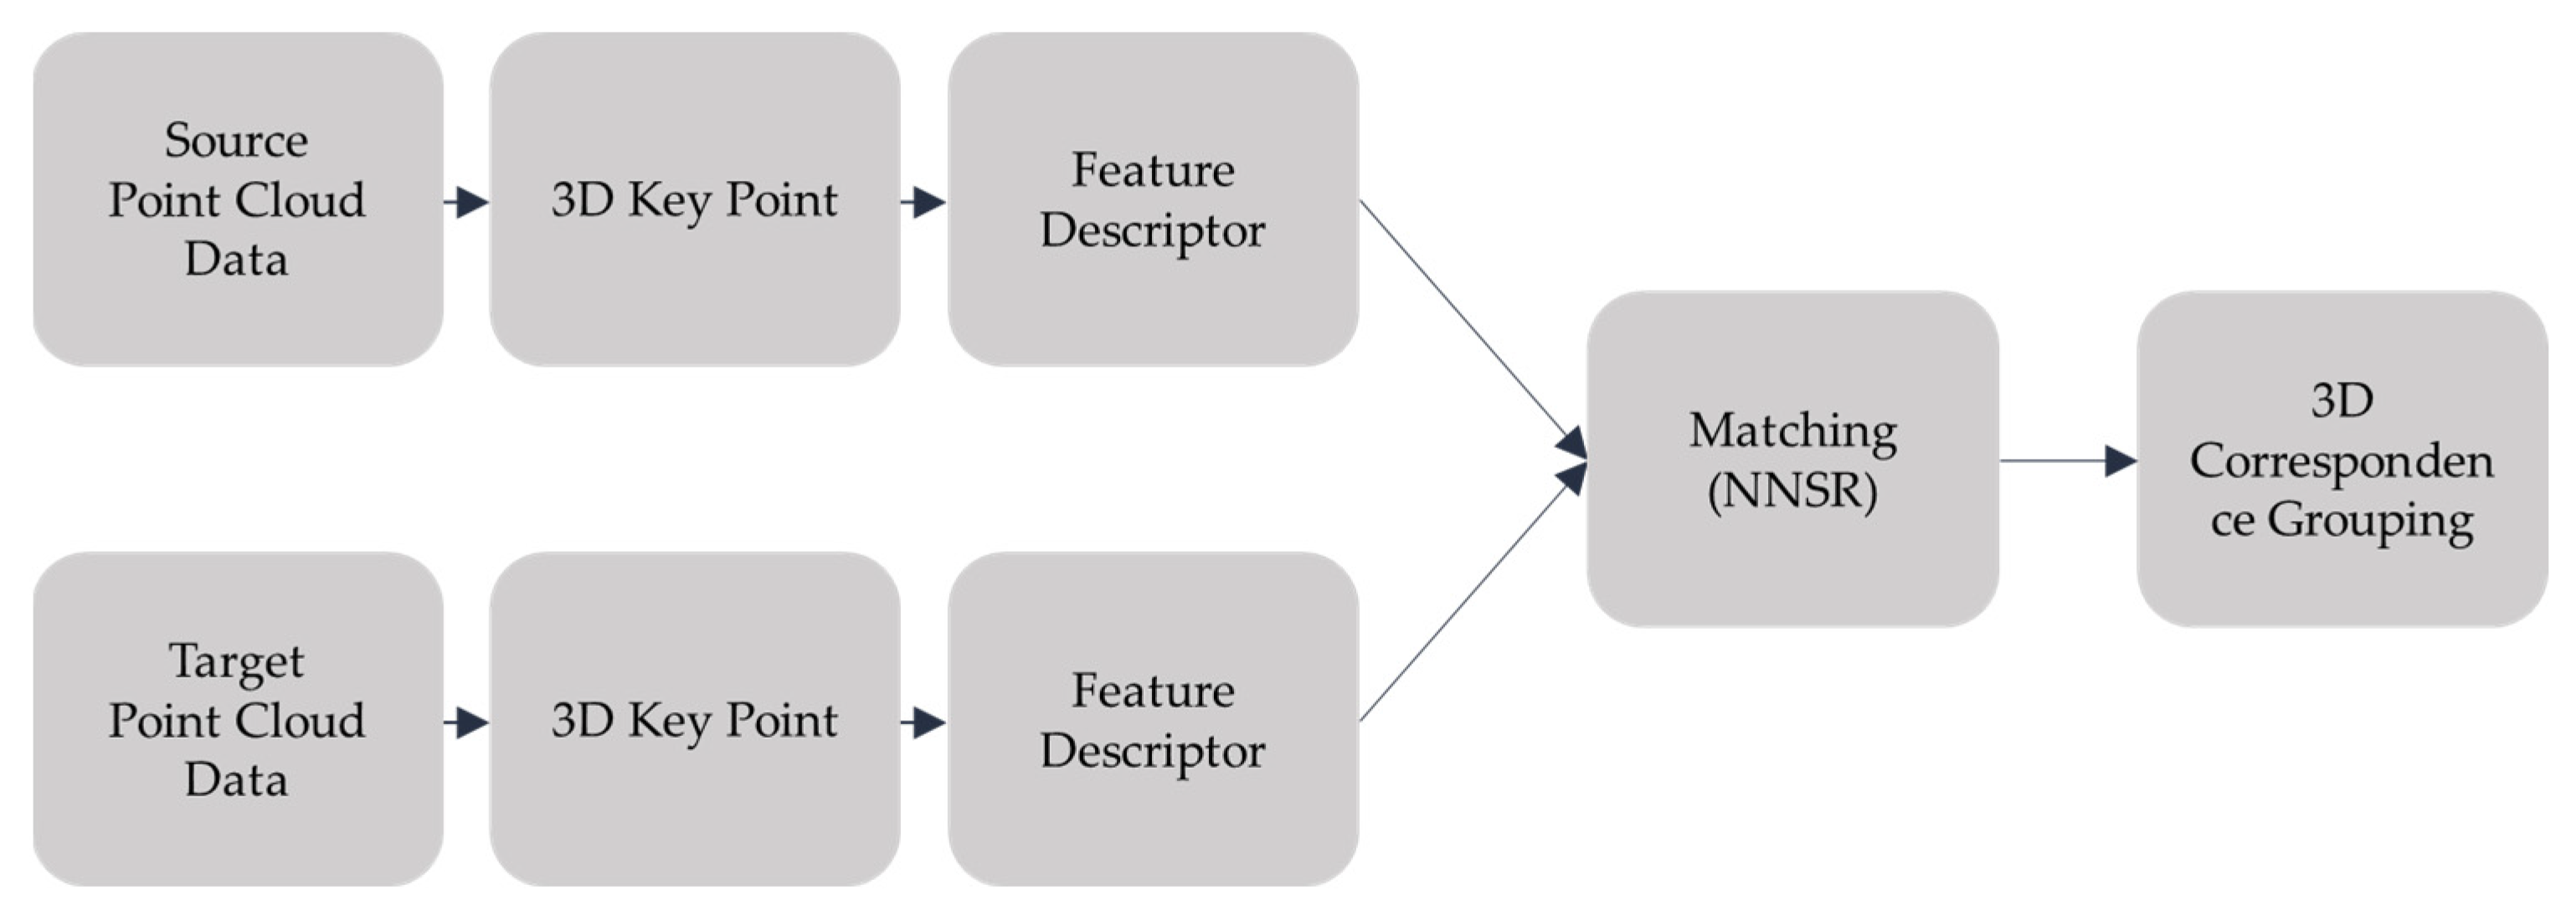
3.2. Composition of Digital-Twin-Based Spatial Object Extraction Algorithm

In computer vision, image segmentation is the process of dividing a digital image into multiple segments (sets of pixels), often referred to as superpixels. This process is aimed to simplify and/or change the representation of an image into something more meaningful and easier to analyze. This process is commonly used to identify objects and boundaries (such as lines and curves) in an image. In the context of digital twins, image segmentation is significant for understanding and replicating the physical attributes and details of an object or environment.
To derive spatial objects from point cloud data, relationships among each data point, which are typically three-dimensional, must be established using location coordinates (X, Y, and Z) and color values (R, G, and B) via segmentation. Segmentation resembles assembling pixels in 2D images into a singular entity. For 3D data, segmentation entails collecting proximate points and segregating them into a single-point cloud. PCL offers various segmentation methods. This study employed the region growing (RG) segmentation algorithm, which is recognized as the most effective means to segment points, lines, and planes.
When dealing with a large number of outliers, segmentation may fail to extract the desired object accurately. In such cases, outliers may be removed using two methods: the preprocessor method and random sample consensus (RANSAC). The preprocessor method removes nearby data to segment the region that the user wants to extract from all the points. Preprocessors can be set up based on both relative and absolute coordinates. In this study, the preprocessor function was initially based on relative coordinates because absolute coordinates were not yet set. However, even with preprocessing, outliers may remain. For example, if a user wants to extract fire extinguishers, which are point objects, the preprocessed 3D data may still contain line and plane data. In such cases, the RANSAC algorithm is used to remove elements such as planes, floors, ceilings, and walls. It can also be used to extract only plane data. PCL provides the self-supervised augmentation consistency algorithm for implementing RANSAC.
The objective of this study was to achieve spatial object extraction in (near) real-time. Therefore, Open3D was deemed less suitable than PCL, which was the primary point cloud library selected to manage the final data. The core algorithms of PCL, including segmentation and RANSAC (to be discussed later), offer multiple configuration options and make it highly user-friendly. In addition, it is open-source and provides thoroughly validated reliability and efficiency.
The algorithm for identifying changes in the final spatial objects, which compares the final classified 3D point cloud data with the original data, used an octree. Octrees are frequently employed to condense large volumes of 3D data. In this context, they were used to ascertain whether objects have changed. The algorithm determines this with the absence of data in the octree, which signals that the data have been displaced when contrasted with the existing data. Because 3D data change across the x, y, and z coordinates, unlike 2D data, the algorithm of this study had to consider the extent of data variation. Therefore, an octree was incorporated into it.

4. Results and Discussion

4.1. Underground Implementation of a Digital-Twin-Based Spatial Object Extraction Algorithm

4.1.1. Linear Spatial Object Extraction Process

To extract 3D objects, point cloud data were gathered from the sensors and subjected to preprocessing, and feature points (descriptions) were computed. These data were then compared with the information stored in the object database to extract details such as location and direction. The algorithm clustered the point cloud data and extracted feature points, then compared them to obtain information such as location and direction. This process is depicted in Figure 3.
The first phase of the process is sampling, which involves choosing sample points for object extraction within the point cloud. Second, region of interest (RoI) filtering is undertaken to isolate areas of interest, minimizing resource usage and time consumption. Third, outlier (noise) removal filtering is conducted to eliminate points that do not exist in the point cloud. These are points from sensor errors that were initially purged from the internal process of the sensor but still lingered.
The fourth phase is background filtering, which omits fixed structures such as walls, slabs, and floors when line objects are extracted. Points belonging to fixed regions are removed for being part of the background. In the fifth step, the algorithm executes segmentation to categorize objects, finding correlations among points based on their K-nearest neighbors, minimum cluster, and maximum cluster values.
At the sixth stage, the preprocessing ends, and objects are generated by identifying feature points through the key point extraction process, which isolates actual objects. Based on this, the description process employs descriptors to compare feature points. In the seventh step, the algorithm matches linear objects by comparing the points with existing data, and correspondence grouping is executed to form object clusters.
Finally, the iterative closest point refinement process makes refinements through repeated points, and an administrator undertakes the hypothesis verification step to validate the hypothesis.

4.1.2. Point Spatial Object Extraction Process

The method of extracting point objects was improved using the 3D correspondence grouping algorithm. It facilitates grouping related points in preprocessed point cloud data to geometrically derive objects after key point extraction. This grouping provides geometric consistency by continually comparing the grouped reference data with the comparison data, adding them to a model subset when a geometric match is found. The method adds the benefit of circumventing pose estimation because it also calculates transformations (rotations and transformations) for all subsets, which are expected to align with the model instance. However, it consumes more computational resources and time, owing to the increase in the number of computations.
The technique for identifying point objects entails preprocessing and executing correspondence grouping. This technique clusters the point correspondence set, which is acquired after description matching, into a model instance within the current scene. The algorithm identifies the feature points of both reference and comparison data and compares feature descriptors to carry out geometric matching. Figure 4 provides a representation of this point object extraction process.

4.1.3. Planar Spatial Object Extraction Process

RANSAC was used for extracting planar objects. This approximates the parameters of the model by ascertaining a consensus: whether the sample from the point cloud aligns with the predefined model. Using RANSAC for segmentation has benefits such as the capacity to separate the ground from objects using a planar model and isolate each object by eliminating the ground and walls. This study incorporated an algorithm that carried out segmentation to draw out wall objects.
The procedure for extracting planar objects with RANSAC entails the following: The model is initialized to align with the virtual inliers, implying that all of the free parameters of the models are set to match those of the inliers. If sufficient points are categorized as virtual inliers, the model is considered as accurately estimated. Subsequently, the error of the inliers concerning the model is calculated to assess the quality of the model, and then the planar objects are extracted.

4.1.4. Supplementing the Algorithm via Octree Creation

To extract object changes using an octree, several steps must be undertaken. First, the point cloud for the bounding box is computed and the root node (the initial node) is established. Subsequently, the octree is segmented, dividing the nodes into eight smaller nodes. Each node is characterized by its geometry and address, and its form is determined with the coordinates of the node center. Each node within the octree structure has a unique address, reflecting the connections between neighbor nodes and the pathway from the present node to its ancestor node. Defining appropriate terminal criteria for octrees is essential. In this study, the minimum node size and minimum point count were established as the terminal criteria. Moreover, the spatial division was assumed to cease if the node met the minimum point threshold, even if the minimum node size criterion was yet unmet. The entire iterative procedure formed the octree, and a list of points was stored in each occupied leaf.

4.2. Plan for Constructing and Renewing Digital Twin with Spatial Object Type

4.2.1. Linear Spatial Object Extraction Process

Spatial objects encountered in underground utility tunnels can be primarily classified into three categories. The first type includes point objects, depicted in Figure 5, which encompass small objects such as fire extinguishers, CCTV systems, and lighting fixtures. The second type comprises line objects, represented in Figure 6, including items such as power cables, water conduits, gas pipes, and telecommunication lines. The third type consists of plane objects, illustrated in Figure 7, which include items like walls, floors, and staircases.
In Table 1, objects in the underground utility tunnel were classified into points, lines, and planes, and detailed categories were set accordingly. Representative point-type objects include fire extinguishers, lights, and sensors, while representative linear objects include electric wires and drain pipes. Representative planar objects include walls, roofs, and floors. Accordingly, updates are set to be triggered by the movement of point-shaped 3D objects, with no updates for the remaining linear and planar shapes. In addition, updates to property information preservation are set to proceed, with some exceptions for point-type objects.

4.2.2. Spatial Object Update Plan

To ensure the precision of spatial information for each object in the underground utility tunnel, a method must be devised for updating the information and specifying update times. Given the characteristics of the underground tunnel, objects such as fire extinguishers are usually situated at specific points, and their locations must be updated if they are relocated or if they disappear. The decision on whether an update is required depends on the update interval. Too small intervals result in excessive event data because even momentarily used objects prompt updates. Similarly, displacement information for individuals patrolling the tunnel can produce errors if updated too frequently. Therefore, an appropriate interval is crucial, and the update periods were broadly classified into long-term and short-term. The short-term period was presumed to be (nearly) real-time, as underground utility tunnels undergo minimal changes owing to their unique characteristics, which encompass underground space, security facilities, and other facilities. Consequently, spatial information should be updated from a long-term viewpoint to maintain accuracy.
Descriptions of various update types are provided below, and Figure 8 illustrates these based on the period, event type, and update method.
  • Underground Tunnel Update: This pertains to the update of spatial information for disaster/facilities management. Shapes and properties are updated using data gathered with sensors, which are distinct from a precise update.
  • Shape Update: This relates to long-term changes to an object/displacement size of 10 cm or more. Objects that have been moved, such as fire extinguishers, would be exceptions.
  • Property Update: This involves updates that generate property information of objects, including information about the object itself, displacement, location value, and time.
  • Event Range: This includes movements (point), deflections (line), and cracks (plane).

4.3. Image-Sensor-Based Spatial Object Extraction

To examine the effectiveness of the image-sensor-based spatial object extraction, an indoor setting replicating an underground utility tunnel was established. Leveraging this environment, LiDAR sample data were gathered to imitate an underground utility tunnel scenario. The initial step involved comparing the obtained LiDAR data to identify displaced objects and implement the required updates. Moreover, a data collection test was conducted to identify target objects at their installation height, considering the height of the power lines.

4.3.1. Utility Tunnel Data Linear Object Extraction

To extract line objects from the utility tunnel data, the algorithm was customized by adjusting variables to match the data, and the corresponding results were ascertained. These results are shown in Figure 9 and Figure 10. Although line recognition was based on modifications to the K-nearest neighbor value and minimum cluster size, each line was identified as a distinct object (Figure 9). For higher K-nearest neighbor values, the line objects were recognized as unified entities (Figure 10). Finally, by fine-tuning the algorithm variables through the parametric adjustment of specific values, the final object derivation results were obtained (Figure 10).

4.3.2. Utility Tunnel Data Plane Object Analysis

To identify line objects from the tunnel data, the variables of the algorithm were fine-tuned to align with the data, generating the corresponding results. Figure 11, Figure 12 and Figure 13 illustrate the outcomes of each variable adjustment. Figure 11 illustrates the result when the minimum value for plane recognition was defined. In this instance, planes within the data were recognized, but each plane was treated as a separate object. This suggests that the algorithm identified different planar elements within the tunnel system, but it may not have correctly grouped or classified these elements together where appropriate. In Figure 12, the K-nearest neighbor value was set to 100. The K-nearest neighbor algorithm is a type of instance-based learning where the function is approximated locally, and all computation is deferred until classification. By setting this value to 100, planes were again recognized as individual objects. This might indicate that the algorithm was able to classify or group similar planar elements together more accurately. Figure 13 shows the final results of recognizing plane objects in the tunnel data after the algorithm variables were further adjusted. The specifics of these adjustments are not detailed here, but the implication is that the algorithm was able to accurately identify and classify the planar objects within the digital twin of the tunnel system, potentially leading to a more precise and insightful analysis of the tunnel data. These figures demonstrate how adjusting variables within an algorithm can influence the results obtained, particularly in complex tasks such as identifying and classifying different elements within a large, detailed dataset like a digital twin of an underground utility tunnel.

4.3.3. Utility Tunnel Object Displacement Value Derivation

The primary aim of this procedure was to conduct data object classification and obtain displacement values based on the discrepancies between the reference and comparison data. In this study, differences were identified using an octree-based displacement detection technique, as depicted in Figure 14. For linear objects, both the displacement values and corresponding displacement information are presented. Displacement information was obtained by comparing data from linear objects. According to the results of Change Detection, displacement due to an intended change of about 10 cm was detected on the left side, as well as on the right side where incorrect and inaccurate results were produced. In this scenario, it is deemed that these issues can be rectified through precise parameter adjustment.

5. Conclusions

In this study, we created a digital twin of an underground utility tunnel and identified spatial objects using a unique algorithm that utilized a multimodal image sensor, incorporating light detection and ranging (LiDAR) technology. The research consisted of three stages: constructing the digital twin using building information modeling integrated with a geographic information system (BIM-GIS), defining a method for extracting spatial objects, and applying image-sensor-based segmentation and a random sample consensus (RANSAC). This method allows for the creation of digital twins for underground areas and extraction of spatial objects using inbuilt image sensors, enabling the detection of structural shifts and management of future structural irregularities. The following conclusions were drawn regarding the extraction of 3D spatial objects and the implemented algorithm:
  • The rationale behind executing real-time updates of 3D spatial information was discussed. This clarification distinguishes automatic updates from real-time updates that directly mirror object movements, preventing potential confusion.
  • We described the categories of (near) real-time 3D spatial information updates, the information being updated in them, the update process, and how updates vary based on object types.
  • We re-evaluated existing algorithms to enhance (near) real-time spatial information update algorithms for each 3D object type. In doing so, we also redefined the scenario process, data flow, and other essential algorithms to support the existing ones.
  • The supplementary algorithm for extracting and updating 3D spatial objects was scrutinized and analyzed. Specifically, the algorithm for extracting point cloud data spatial objects was enhanced, and the algorithms for extracting feature points, spatial objects, and displacement information were examined and analyzed to propose a new integrated algorithm.
  • We tested the developed algorithm using point cloud sample data. For this, an environment resembling a utility tunnel was set up, and LiDAR data were collected. The more precise the LiDAR data, the simpler the data analysis. Our results showed that object classification became significantly easier. Lastly, when deriving displacement data, we did not obtain accurate data because relative coordinate data were employed. However, precise data could be obtained through data processing.
In this study, data accuracy was compromised owing to axial transformations and asynchronous data visualizations, which arise from the general motion of unfixed line data and shifts in LiDAR installation positions. To address these issues in future studies, we propose two main solutions:
-
Collecting sufficient data from fixed multimodal sensors: By securing and using multiple sensors that operate in different modalities (for instance, combining LiDAR with photogrammetric or radar sensors), you can gather richer, more comprehensive data. If these sensors are also fixed in position, it could help mitigate issues arising from shifts in sensor installation positions.
-
Performing repeated testing in diverse environments: This approach would help validate the effectiveness of the extraction algorithms across various conditions, enhancing their robustness and reliability. By repeatedly testing the system under different scenarios, you can refine the displacement detection information extraction process, making it more efficient and accurate.
In sum, these strategies could significantly enhance the quality of displacement information extracted in future studies, contributing to more reliable and effective outcomes in the field of spatial data analyses and 3D modelling.

Author Contributions

Methodology, S.P.; Software, Y.L.; Data curation, Y.L.; Writing—original draft, J.L.; Writing—review & editing, C.H. All authors have read and agreed to the published version of the manuscript.

Funding

This research was supported by an Institute of Information & Communications Technology Planning & Evaluation (IITP) grant funded by the Korean government (MSIT, MOIS, MOLIT, and MOTIE) (No. 2020-0-00061, Development of integrated platform technology for fire and disaster management in underground utility tunnel based on digital twin).

Institutional Review Board Statement

Not applicable.

Informed Consent Statement

Not applicable.

Data Availability Statement

The datasets used and analyzed during the current study are available from the corresponding author on reasonable request.

Conflicts of Interest

The authors declare no conflict of interest.

References

  1. El Marai, O.; Taleb, T.; Song, J. Roads infrastructure digital twin: A step toward smarter cities realization. IEEE Netw. 2020, 35, 136–143. [Google Scholar] [CrossRef]
  2. Fan, C.; Zhang, C.; Yahja, A.; Mostafavi, A. Disaster City Digital Twin: A vision for integrating artificial and human intelligence for disaster management. Int. J. Inf. Manag. 2021, 56, 102049. [Google Scholar]
  3. Singh, M.; Srivastava, R.; Fuenmayor, E.; Kuts, V.; Qiao, Y.; Murray, N.; Devine, D. Applications of digital twin across industries: A review. Appl. Sci. 2022, 12, 5727. [Google Scholar] [CrossRef]
  4. Lee, J.; Lee, Y.; Hong, C. Development of Geospatial Data Acquisition, Modeling, and Service Technology for Digital Twin Implementation of Underground Utility Tunnel. Appl. Sci. 2023, 13, 4343. [Google Scholar] [CrossRef]
  5. Park, S.; Hong, C.; Hwang, I.; Lee, J. Comparison of Single-Camera-Based Depth Estimation Technology for Digital Twin Model Synchronization of Underground Utility Tunnels. Appl. Sci. 2023, 13, 2106. [Google Scholar] [CrossRef]
  6. Marco, Z.; Giuseppe, C.P.; Giuseppe, T.; Marco, S. On the influence of shallow underground structures in the evaluation of the seismic signals. Ing. Sismica 2021, 38, 23–35. [Google Scholar]
  7. Li, X.; Tang, L.; Ling, J.; Chen, C.; Shen, Y.; Zhu, H. Digital-twin-enabled JIT design of rock tunnel: Methodology and application. Tunn. Undergr. Space Technol. 2023, 140, 105307. [Google Scholar]
  8. Zhou, Z.; Zhang, J.; Gong, C. Hybrid semantic segmentation for tunnel lining cracks based on Swin Transformer and convolutional neural network. Comput.-Aided Civ. Infrastruct. Eng. 2023, 1–20. [Google Scholar]
  9. Boje, C.; Guerriero, A.; Kubicki, S.; Rezgui, Y. Towards a semantic Construction Digital Twin: Directions for future research. Autom. Constr. 2020, 114, 103179. [Google Scholar] [CrossRef]
  10. Jones, D.; Snider, C.; Nassehi, A.; Yon, J.; Hicks, B. Characterising the Digital Twin: A systematic literature review. CIRP J. Manuf. Sci. Technol. 2020, 29, 36–52. [Google Scholar] [CrossRef]
  11. Agnusdei, G.P.; Elia, V.; Gnoni, M.G. Is digital twin technology supporting safety management? A bibliometric and systematic review. Appl. Sci. 2021, 11, 2767. [Google Scholar] [CrossRef]
  12. Kritzinger, W.; Karner, M.; Traar, G.; Henjes, J.; Sihn, W. Digital Twin in manufacturing: A categorical literature review and classification. Ifac-PapersOnline 2018, 51, 1016–1022. [Google Scholar] [CrossRef]
  13. Shao, G.; Helu, M. Framework for a digital twin in manufacturing: Scope and requirements. Manuf. Lett. 2020, 24, 105–107. [Google Scholar]
  14. Meierhofer, J.; Schweiger, L.; Lu, J.; Züst, S.; West, S.; Stoll, O.; Kiritsis, D. Digital twin-enabled decision support services in industrial ecosystems. Appl. Sci. 2021, 11, 11418. [Google Scholar] [CrossRef]
  15. Opoku, D.-G.J.; Perera, S.; Osei-Kyei, R.; Rashidi, M. Digital twin application in the construction industry: A literature review. J. Build. Eng. 2021, 40, 102726. [Google Scholar]
  16. Madubuike, O.C.; Anumba, C.J.; Khallaf, R. A review of digital twin applications in construction. J. Inf. Technol. Constr. 2022, 27, 145–172. [Google Scholar]
  17. Lee, D.; Lee, S. Digital twin for supply chain coordination in modular construction. Appl. Sci. 2021, 11, 5909. [Google Scholar] [CrossRef]
  18. Gao, Y.; Qian, S.; Li, Z.; Wang, P.; Wang, F.; He, Q. Digital twin and its application in transportation infrastructure. In Proceedings of the 2021 IEEE 1st International Conference on Digital Twins and Parallel Intelligence (DTPI), Beijing, China, 15 July–15 August 2021; pp. 298–301. [Google Scholar]
  19. Martínez-Gutiérrez, A.; Díez-González, J.; Ferrero-Guillén, R.; Verde, P.; Álvarez, R.; Perez, H. Digital twin for automatic transportation in industry 4.0. Sensors 2021, 21, 3344. [Google Scholar] [CrossRef]
  20. Pang, T.Y.; Pelaez Restrepo, J.D.; Cheng, C.-T.; Yasin, A.; Lim, H.; Miletic, M. Developing a digital twin and digital thread framework for an ‘Industry 4.0′Shipyard. Appl. Sci. 2021, 11, 1097. [Google Scholar] [CrossRef]
  21. Erol, T.; Mendi, A.F.; Doğan, D. The digital twin revolution in healthcare. In Proceedings of the 2020 4th International Symposium on Multidisciplinary Studies and Innovative Technologies (ISMSIT), Istanbul, Turkey, 22–24 October 2020; pp. 1–7. [Google Scholar]
  22. Liu, Y.; Zhang, L.; Yang, Y.; Zhou, L.; Ren, L.; Wang, F.; Liu, R.; Pang, Z.; Deen, M.J. A novel cloud-based framework for the elderly healthcare services using digital twin. IEEE Access 2019, 7, 49088–49101. [Google Scholar] [CrossRef]
  23. Xue, F.; Lu, W.; Chen, Z.; Webster, C.J. From LiDAR point cloud towards digital twin city: Clustering city objects based on Gestalt principles. ISPRS J. Photogramm. Remote Sens. 2020, 167, 418–431. [Google Scholar]
  24. Tavakolibasti, M.; Meszmer, P.; Böttger, G.; Kettelgerdes, M.; Elger, G.; Erdogan, H.; Seshaditya, A.; Wunderle, B. Thermo-mechanical-optical coupling within a digital twin development for automotive LiDAR. Microelectron. Reliab. 2023, 141, 114871. [Google Scholar] [CrossRef]
  25. Sommer, M.; Stjepandić, J.; Stobrawa, S.; von Soden, M. Automated generation of a digital twin of a manufacturing system by using scan and convolutional neural networks. In Transdisciplinary Engineering for Complex Socio-Technical Systems—Real-Life Applications; IOS Press: Amsterdam, The Netherlands, 2020; Volume 12, pp. 363–372. [Google Scholar]
  26. Choi, S.H.; Park, K.-B.; Roh, D.H.; Lee, J.Y.; Mohammed, M.; Ghasemi, Y.; Jeong, H. An integrated mixed reality system for safety-aware human-robot collaboration using deep learning and digital twin generation. Robot. Comput.-Integr. Manuf. 2022, 73, 102258. [Google Scholar]
  27. Zhang, J.; Fukuda, T.; Yabuki, N. Automatic generation of synthetic datasets from a city digital twin for use in the instance segmentation of building facades. J. Comput. Des. Eng. 2022, 9, 1737–1755. [Google Scholar]
  28. Kunze, P.; Rein, S.; Hemsendorf, M.; Ramspeck, K.; Demant, M. Learning an empirical digital twin from measurement images for a comprehensive quality inspection of solar cells. Sol. RRL 2022, 6, 2100483. [Google Scholar]
  29. Nica, E.; Popescu, G.H.; Poliak, M.; Kliestik, T.; Sabie, O.-M. Digital Twin Simulation Tools, Spatial Cognition Algorithms, and Multi-Sensor Fusion Technology in Sustainable Urban Governance Networks. Mathematics 2023, 11, 1981. [Google Scholar]
Figure 1. Research methodology.
Applsci 13 09137 g001
Figure 2. (a) Ochang underground utility tunnel and (b) floor plan of the target underground utility tunnel [4].
Applsci 13 09137 g002
Figure 3. Linear spatial object extraction process.
Applsci 13 09137 g003
Figure 4. Point spatial object extraction process.
Applsci 13 09137 g004
Figure 5. BIM library of underground utility tunnel point objects.
Applsci 13 09137 g005
Figure 6. BIM library of underground utility tunnel line objects.
Applsci 13 09137 g006
Figure 7. BIM library of underground tunnel plane objects.
Applsci 13 09137 g007
Figure 8. Method for updating a spatial object in a digital twin.
Applsci 13 09137 g008
Figure 9. Although lines are recognized, each is recognized as a separate object.
Applsci 13 09137 g009
Figure 10. Final object results obtained by adjusting algorithm variables for (a) 700, (b) 800, and (c) 900 K-nearest neighbors, respectively.
Applsci 13 09137 g010aApplsci 13 09137 g010b
Figure 11. Although planes are recognized, each is recognized as a separate object.
Applsci 13 09137 g011
Figure 12. Plane recognition maximum value analysis.
Applsci 13 09137 g012
Figure 13. Final plane object results obtained by adjusting algorithm variables for (a) 80, (b) 90, and (c) 100 K-nearest neighbors, respectively.
Applsci 13 09137 g013aApplsci 13 09137 g013b
Figure 14. Results of displacement detection based on octree methodology.
Applsci 13 09137 g014
Table 1. Classification and update information with object type.
Major CategoryMinor CategoryLibrary3D Object
Update
Property Information Update
PointPoint
Facilities
Fire extinguisherYesYes
LightYesYes
SensorYesYes
Sprinkler headYesYes
Gate valveYesYes
Air valveYesYes
Notice signYesYes
Wire splitterYesYes
Emergency exit signYesYes
Automatic fire extinguishing equipmentYesYes
Automatic fire detection equipmentYesYes
CCTVYesYes
FlangeNoYes
Distribution panelNoYes
Plumbing equipmentNoYes
············
Point
Structures
BracketNoYes
SupportNoYes
BranchNoNo
Pipe protectionNoNo
············
LineLine
Facilities
Power lineNoYes
Water pipeNoYes
Communications lineNoYes
············
PlanePlane
Structures
WallNoYes
SlabNoYes
FloorNoYes
Ventilation openingNoYes
StairsNoYes
Entrance/ExitNoYes
············
OtherOtherRandom objectsXYesNo
Disclaimer/Publisher’s Note: The statements, opinions and data contained in all publications are solely those of the individual author(s) and contributor(s) and not of MDPI and/or the editor(s). MDPI and/or the editor(s) disclaim responsibility for any injury to people or property resulting from any ideas, methods, instructions or products referred to in the content.

