Article

Experimental Study of the Fatigue Life of Off-Highway Steel Wheels Using the Rim Section Test Approach

Department of Mechanical and Industrial Engineering, University of Brescia, Via Branze 38, 25123 Brescia, Italy
*
Author to whom correspondence should be addressed.
Appl. Sci. 2023, 13(16), 9119; https://doi.org/10.3390/app13169119
Submission received: 14 July 2023 / Revised: 5 August 2023 / Accepted: 8 August 2023 / Published: 10 August 2023
(This article belongs to the Special Issue Focus on Fatigue and Fracture of Engineering Materials, Volume II)

Abstract

:
Wheels are structural components designed to sustain dynamic loads and avoid fatigue failures in service. For their validation, when standard fatigue tests are not feasible due to premature tyre wear, alternative methods should be used. In this paper, the rim section test approach is evaluated for the fatigue life assessment of steel rims for off-highway wheels. Customized specimens were studied by finite element analysis and subjected to bending fatigue tests to obtain the fatigue curve for the critical point of the rim. The results were also compared to fatigue data from standard tests of the base material, confirming the importance of testing components in conditions as similar as possible to the final ones in service. Additional measurements of the specimens’ surface hardness showed how this approach is valid to consider the effects of possible work hardening induced in the components by the production process. The residual stress state, instead, does not seem to be considered appropriately, since the initial compressive residual stresses of the component were released during the manufacturing of the specimens. The overall results of the study confirmed the suitability of the section test approach as an alternative method for the fatigue life evaluation of structural components. Moreover, it could be used for specific investigations concerning the influence of the production process parameters on wheel rims.

1. Introduction

Wheels are critical parts for the safety and reliability of land vehicles. They are subjected to cyclic loads in service, which can generate fatigue phenomena in the most stressed points, leading to cracks, nucleation, and development until failure if the component is not properly designed.
For that reason, wheels are usually tested by manufacturers or independent laboratories to assess their durability according to industrial standards [1]. Both in the automotive and in the off-highway industry, some test standards have been defined by technical organizations such as, for example, EUWA (Association of European Wheel Manufacturers [2]) and SAE (Society of Automotive Engineers [3]). Generally, test standards target specific vehicle applications, but they are mainly based on two kinds of tests: the dynamic radial fatigue test and the dynamic cornering fatigue test. The former is used to assess the fatigue strength of the rim component by pushing the tyre and wheel assembly against a rotating drum at a certain radial load [4] (Figure 1a). The latter simulates the effects of lateral loads, which arise in service, during vehicle turning, on the wheel disc by submitting it to a rotating bending moment [5] (Figure 1b). A further test, which combines both radial and lateral load conditions, has been developed through a remarkable work by LBF-Germany [6,7]. It is known as the biaxial fatigue test and is mainly used in the automotive industry.
All these tests are usually conducted at constant amplitude loads, which are calculated multiplying the wheel rated load, specified by the vehicle manufacturer, by an accelerated test factor. This factor depends on both the vehicle application and the test standard of reference, but it is generally included in a value range between 1.3 and 2.5 [8]. It is important to reduce fatigue test times, however, this can lead to a situation where the test load is too high for the durability of tyres or even test machine fixtures. For example, a premature wear of the tyre can make it impossible to finish the test in reasonable time and with acceptable cost. That is the reason why, for many years, researchers have been trying to develop analytical and numerical models, based on the finite element method analysis (FEA), to simulate fatigue test conditions and assess wheel durability, reducing or avoiding physical tests [5,9,10,11,12]. Alternative approaches to predict the fatigue life of structural components are based on strain acquisitions, by means of proper sensors, during field tests of vehicles in real working conditions. Similarly, forces and moments acting on wheels can be acquired through special devices such as wheel force transducers (WFT) [13] and can then converted to stresses and strains by FEA. Data recorded can be analyzed, in a time or frequency domain [14,15,16], to estimate the fatigue life of the component in case the standard durability tests are not feasible.
In any of the alternative methods, reliable fatigue properties of the material are fundamental for an accurate evaluation of the durability of the components, as pointed out in [13,14]. For that reason, the material properties should also consider the effect of the production process on the surface condition from the point of view of roughness, residual stresses, and potential local work hardening induced by plastic deformations. Some of these aspects are highlighted, for example, in [17,18,19,20] for an automotive wheel disc and in [21] for an automotive wheel rim.
The topic of properly designing against fatigue is essential for the reliability and safety of vehicles, especially considering the increasing request of reducing their fuel and energy consumption. To achieve this target, in fact, designers have continuously been working on the weight reduction of components [22]. This underlines the importance of improving the knowledge of fatigue-related phenomena, which are still the main cause of failure for structural components in the modern industry.
In this paper, an alternative procedure was investigated for the assessment of the material fatigue properties of a steel rim for off-highway applications. It can be used when standard dynamic radial fatigue tests are not feasible because the test loads are too severe for the tyre resistance. It consists of testing rim sections directly obtained from the finished component, thus keeping the same local geometry and surface conditions. Customized specimens were manufactured from those sections, after a preliminary FEA, to achieve the fatigue crack development in a specific point of interest, which usually corresponds to the most stressed point of the rim during working operations in field or in standard laboratory tests. Dynamic bending tests were completed to create a fatigue curve of the material, which can be used for the durability analysis of the final wheel. A similar procedure was used in previous research for automotive wheels made of different materials, i.e., AISI steel 1008 and aluminum alloy 5454 [8,23]. Here, the focus is on off-highway steel wheels, where the material thickness is bigger to sustain much higher loads in working conditions and, consequently, the effect of the production process on the final product may change.
To better assess this aspect, the following experimental steps were further completed:
  • Comparison between rim sections fatigue test results and standard fatigue test results of specimens obtained from the base material, as received prior to the production process;
  • Investigation of the residual stress state of both complete rim and rim section specimens;
  • Hardness measurement of the rim section specimens to evaluate the influence of the local plastic deformation on the mechanical properties of the material.
These aspects are discussed, respectively, in Section 3.2, Section 3.3 and Section 3.4.

2. Materials and Methods

2.1. Wheel Geometry, Material Specifications, and Rim Production Process

Off-highway wheels are usually made of two main components that are welded together: the rim, which is the part directly in contact with the tyre, and the disc, which is the part connected to the hub of the machine through bolts. Although this study is focused on the rim component, a similar procedure could be applied to the disc, as in [18,19], to the welding joint between rim and disc, or extended to other structural components.
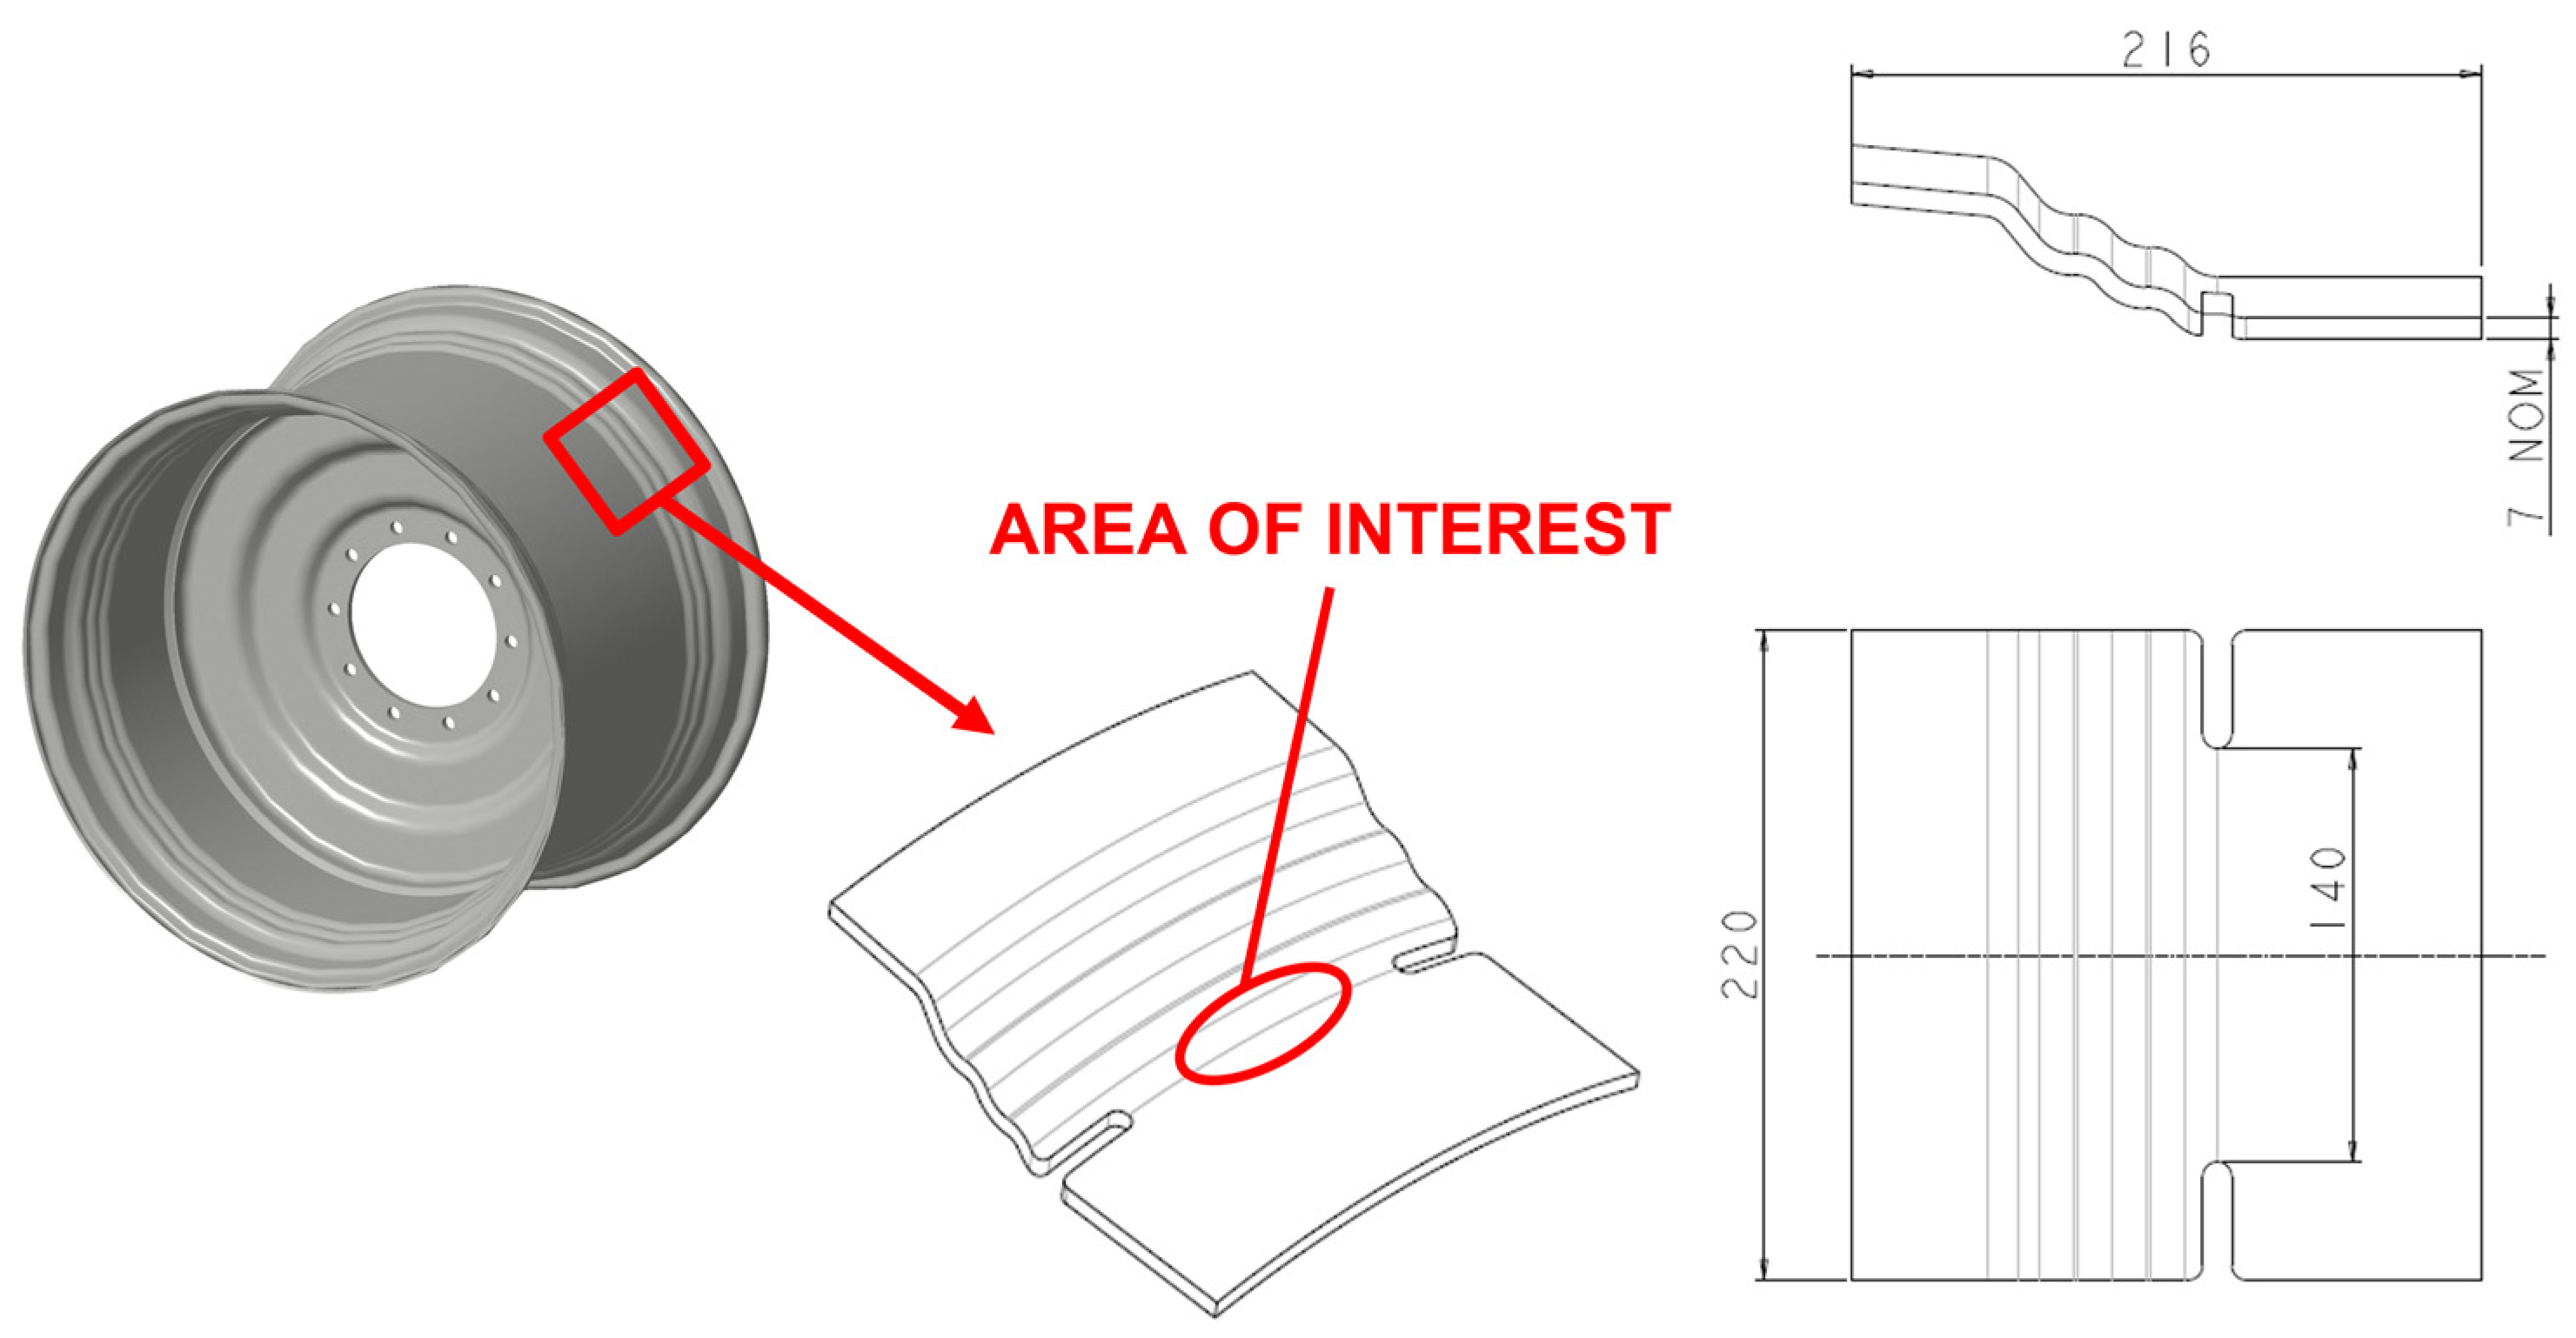
An example of an off-highway wheel is represented in Figure 2a, while the rim specifically analyzed in this paper is represented in Figure 2b. Its denomination is TW27×38″, where numbers 27 and 38 indicate, respectively, the rim width and the rim nominal diameter in inches, while the term TW identifies the geometry of the profile section.
The rim is made from a strip of hot rolled steel DD11 (EN 10111) with 7 mm nominal thickness. The rim manufacturer is Moveero A/S, Lunderskov, Denmark. The chemical composition and the mechanical properties of the material, from experimental tests made by the steel supplier, are shown, respectively, in Table 1 and Table 2. Those values refer to the material characteristics before the rim production process. With reference to Table 2, Rm is the ultimate tensile strength, Rp0.2 is the yield strength, A50 is the total elongation to fracture referred to a gauge length of 50 mm, and E is the Young modulus. The mechanical properties of the material are referred to the transverse direction of the strip (T), which is the one investigated in this study.
The rim production process consists in several steps, mainly:
  • Rim band coiling;
  • Flash butt welding;
  • Flaring;
  • Cold roll forming;
  • Final expanding;
  • Valve hole punching.
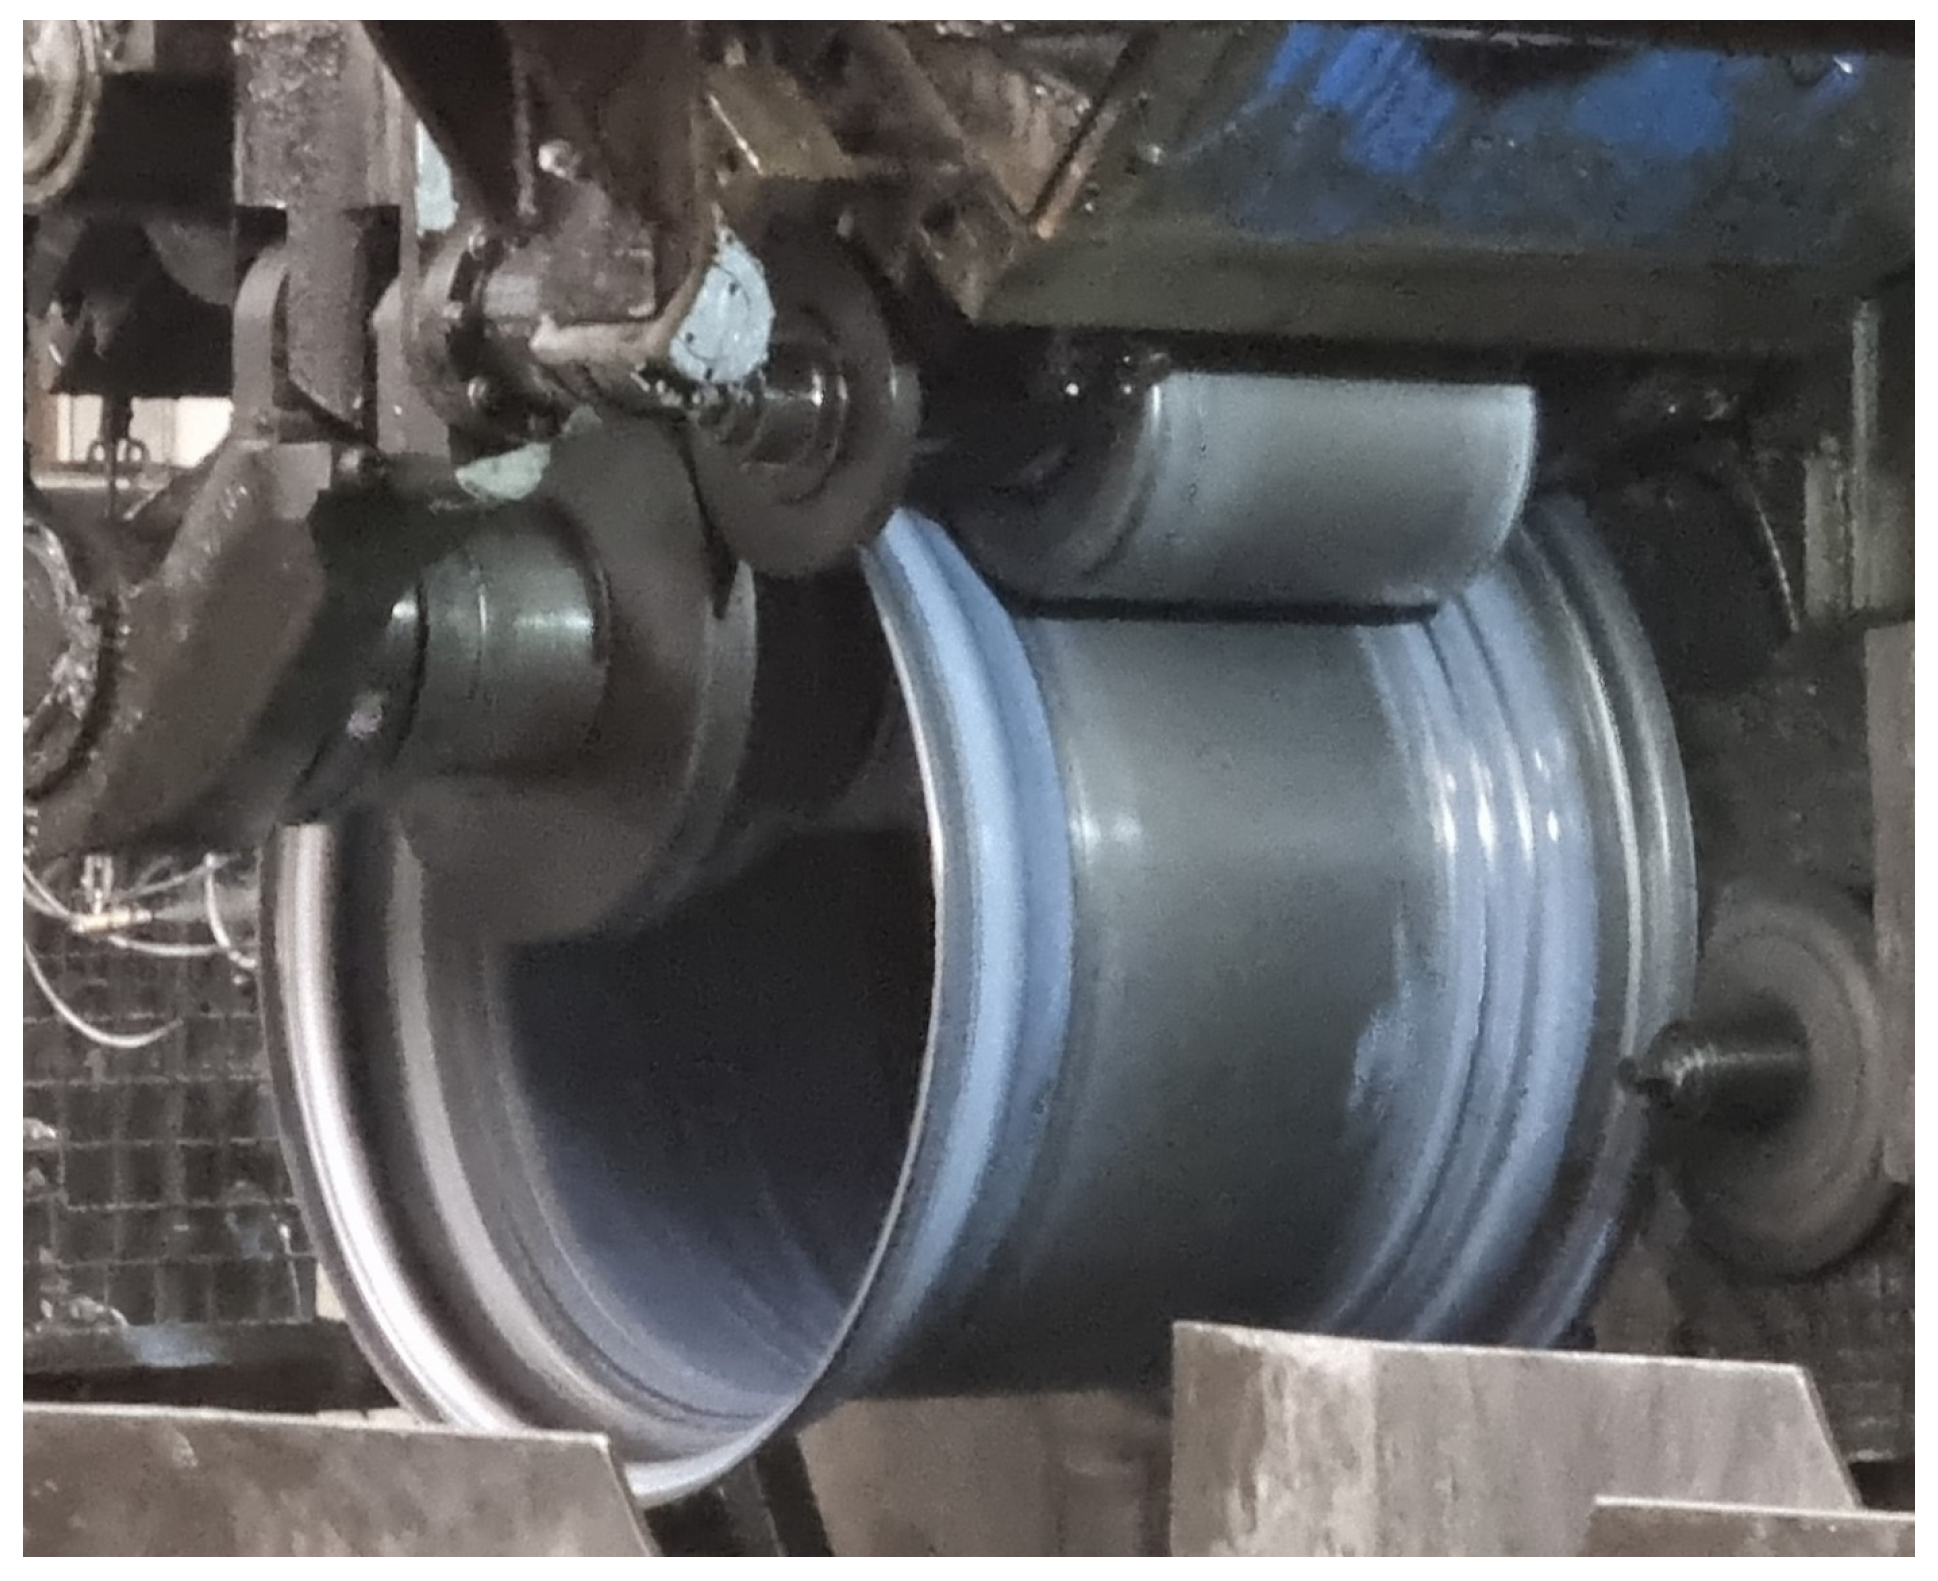
In this case, the cold roll forming is made in two steps, and it is the operation that most affects the area under investigation. In fact, the roll forming gives the final shape to the rim section profile, inducing local plastic deformation and material thinning, especially in the correspondence of the section radii. It may also change the surface condition of the base material from the point of view of roughness and residual stress state. This aspect is treated in Section 3.3, while an example of the rolling operation is shown in Figure 3. The rim was e-coated by a cataphoresis process to its final surface finish.
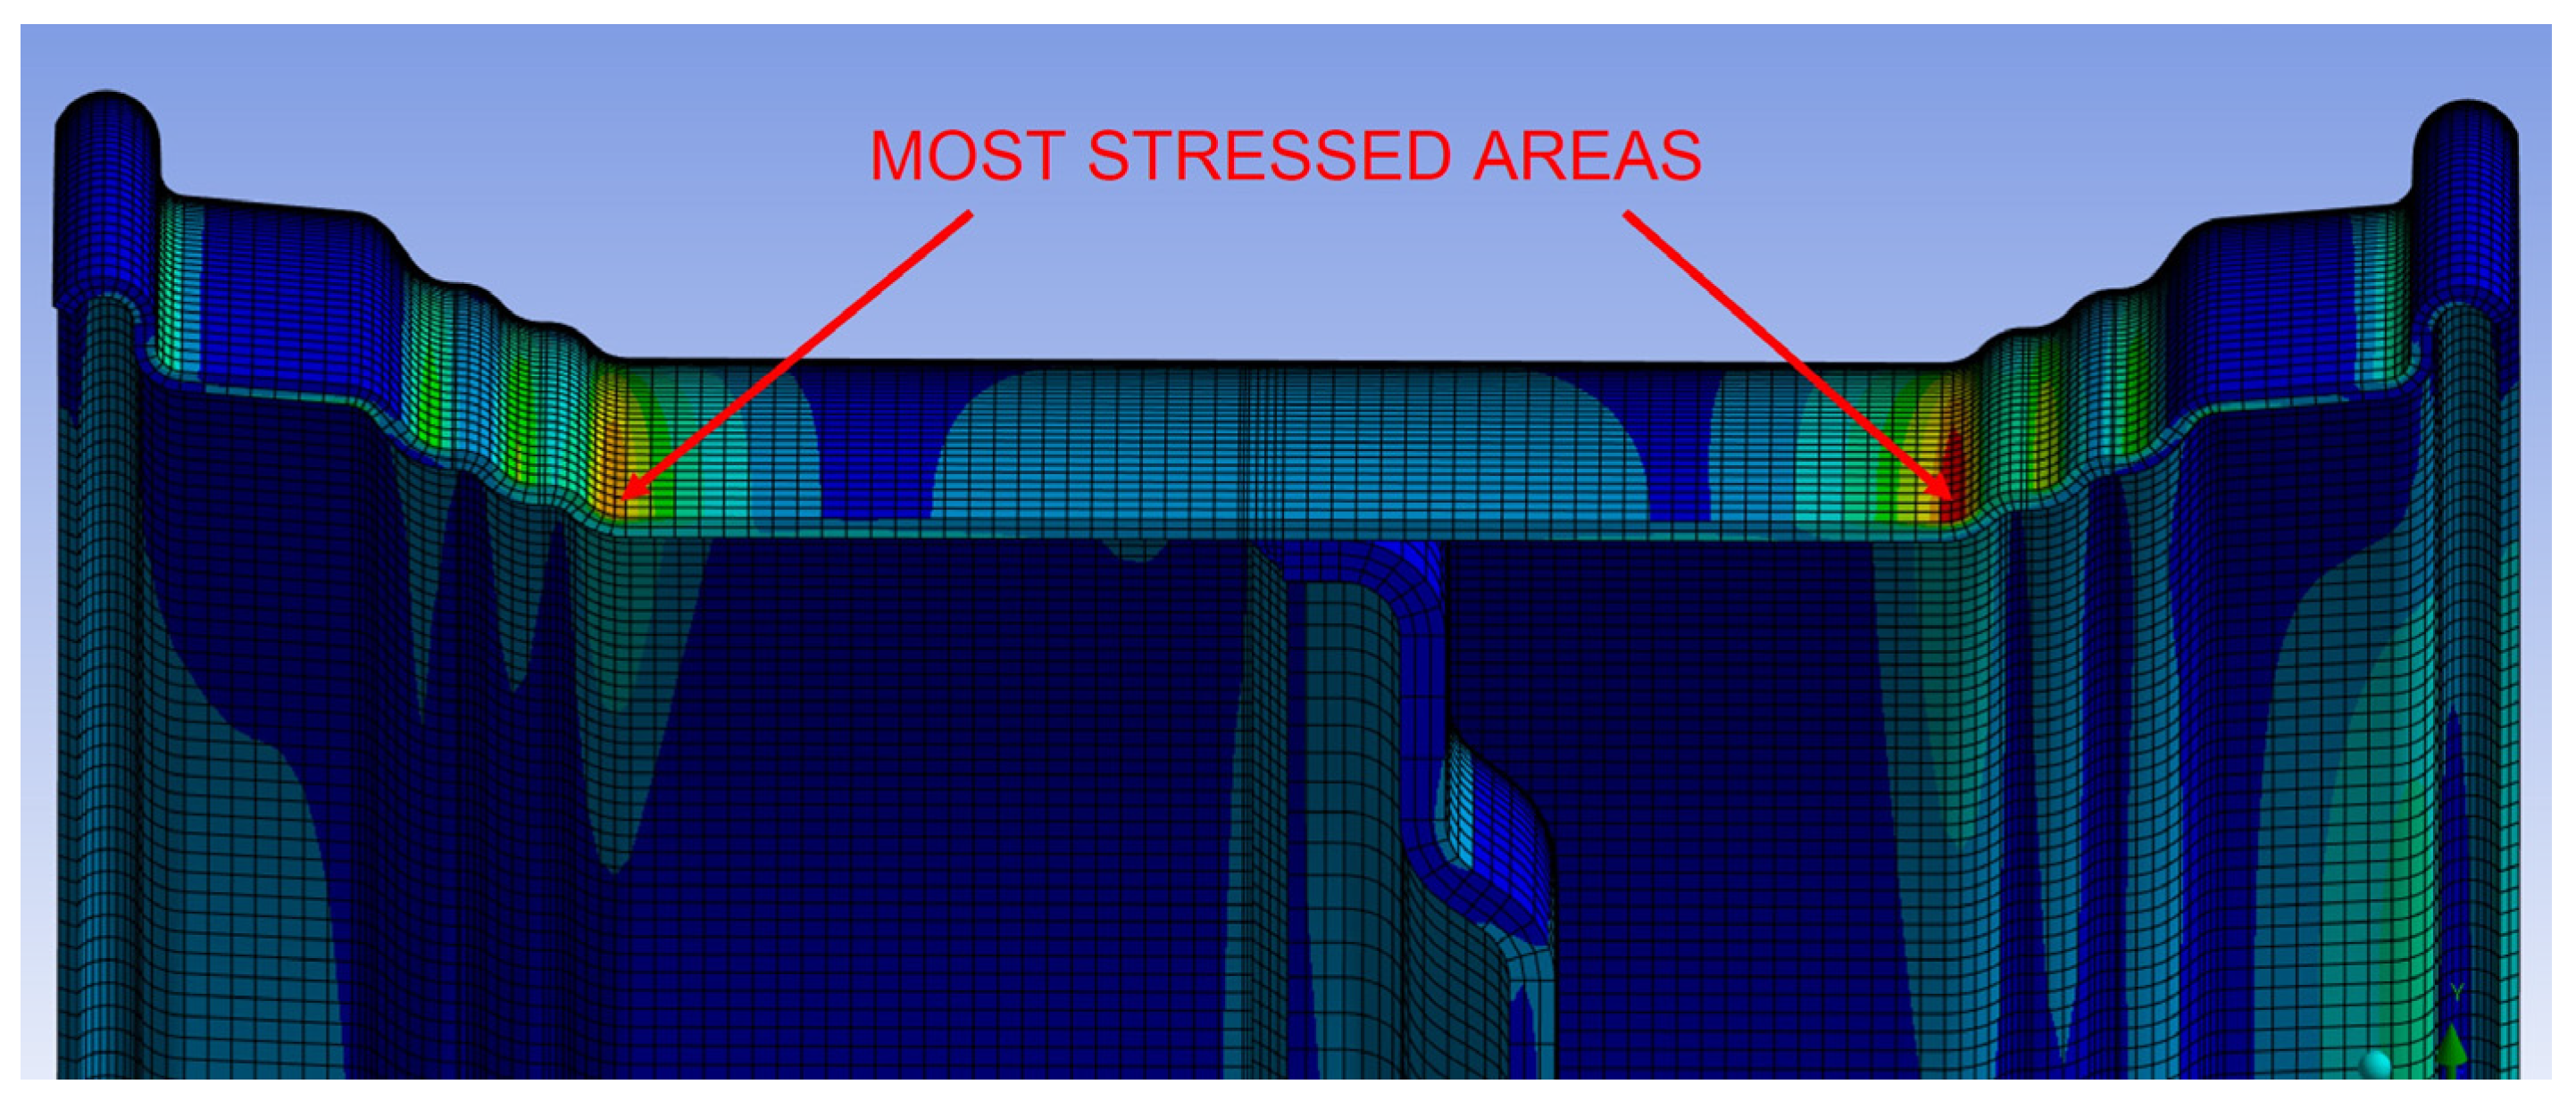
The rim size TW27×38″ is mostly used in agricultural applications, such as harvesters and high-power tractors, coupled with tyres of radial design. In these working conditions, it is known, from the experience of wheel manufacturers, that the most stressed point of the rim is the radius next to the rim vertical center line. This is highlighted in a typical FEA result shown in Figure 4. For that FEA, the software used was Ansys Workbench 2022. A simplified symmetrical model of the wheel was developed to save computational time. The finite element model was composed of a total number of 81,330 hexahedral elements and 446,815 nodes. A static linear elastic analysis was conducted, using a general structural steel as a material model, with mechanical properties according to Table 2 and Poisson’s ratio ν = 0.3. A fixed support boundary condition was applied to the surface of the disc that is bolted to the hub of the machine. The wheel model was subjected to the combined action of tyre pressure and radial load.
Although the most stressed point of the rim is known, it is not currently possible to obtain a fatigue crack development in this rim during the standard dynamic radial fatigue test, with acceptable time and cost, as discussed in Section 1. The overload required, in fact, leads to premature wear of the tyre. The number of tyres that should be used to reach either the expected number of cycles or a fatigue crack development would be excessive for the common industrial practice. Also, the test boundary conditions could vary due to repeated tyre changes from brand-new to heavily worn ones. Therefore, a different approach, based on rim sections testing, was used.

2.2. Description of Test Machines, Fatigue Tests Setup, and Specimen Geometry

In the following sections, the machines used for the fatigue testing are briefly described, together with notes on the fatigue test setup. The geometry of the specimens used is also presented, with a focus on those for the rim sections fatigue tests. They were specifically designed to investigate the fatigue properties of the most stressed area of the rim in service.

2.2.1. Test Machine for Rim Section Fatigue Tests

The fatigue tests on rim section specimens were conducted on a customized test machine made of the following components:
  • The hydraulic actuator, with a maximum load capacity of 100 kN;
  • The Hydraulic Power Unit (HPU), allowing a maximum oil flow of 62.5 L/min at 207 bar pressure;
  • The Controller, which allows a real-time closed-loop control of the system in load or displacement mode.
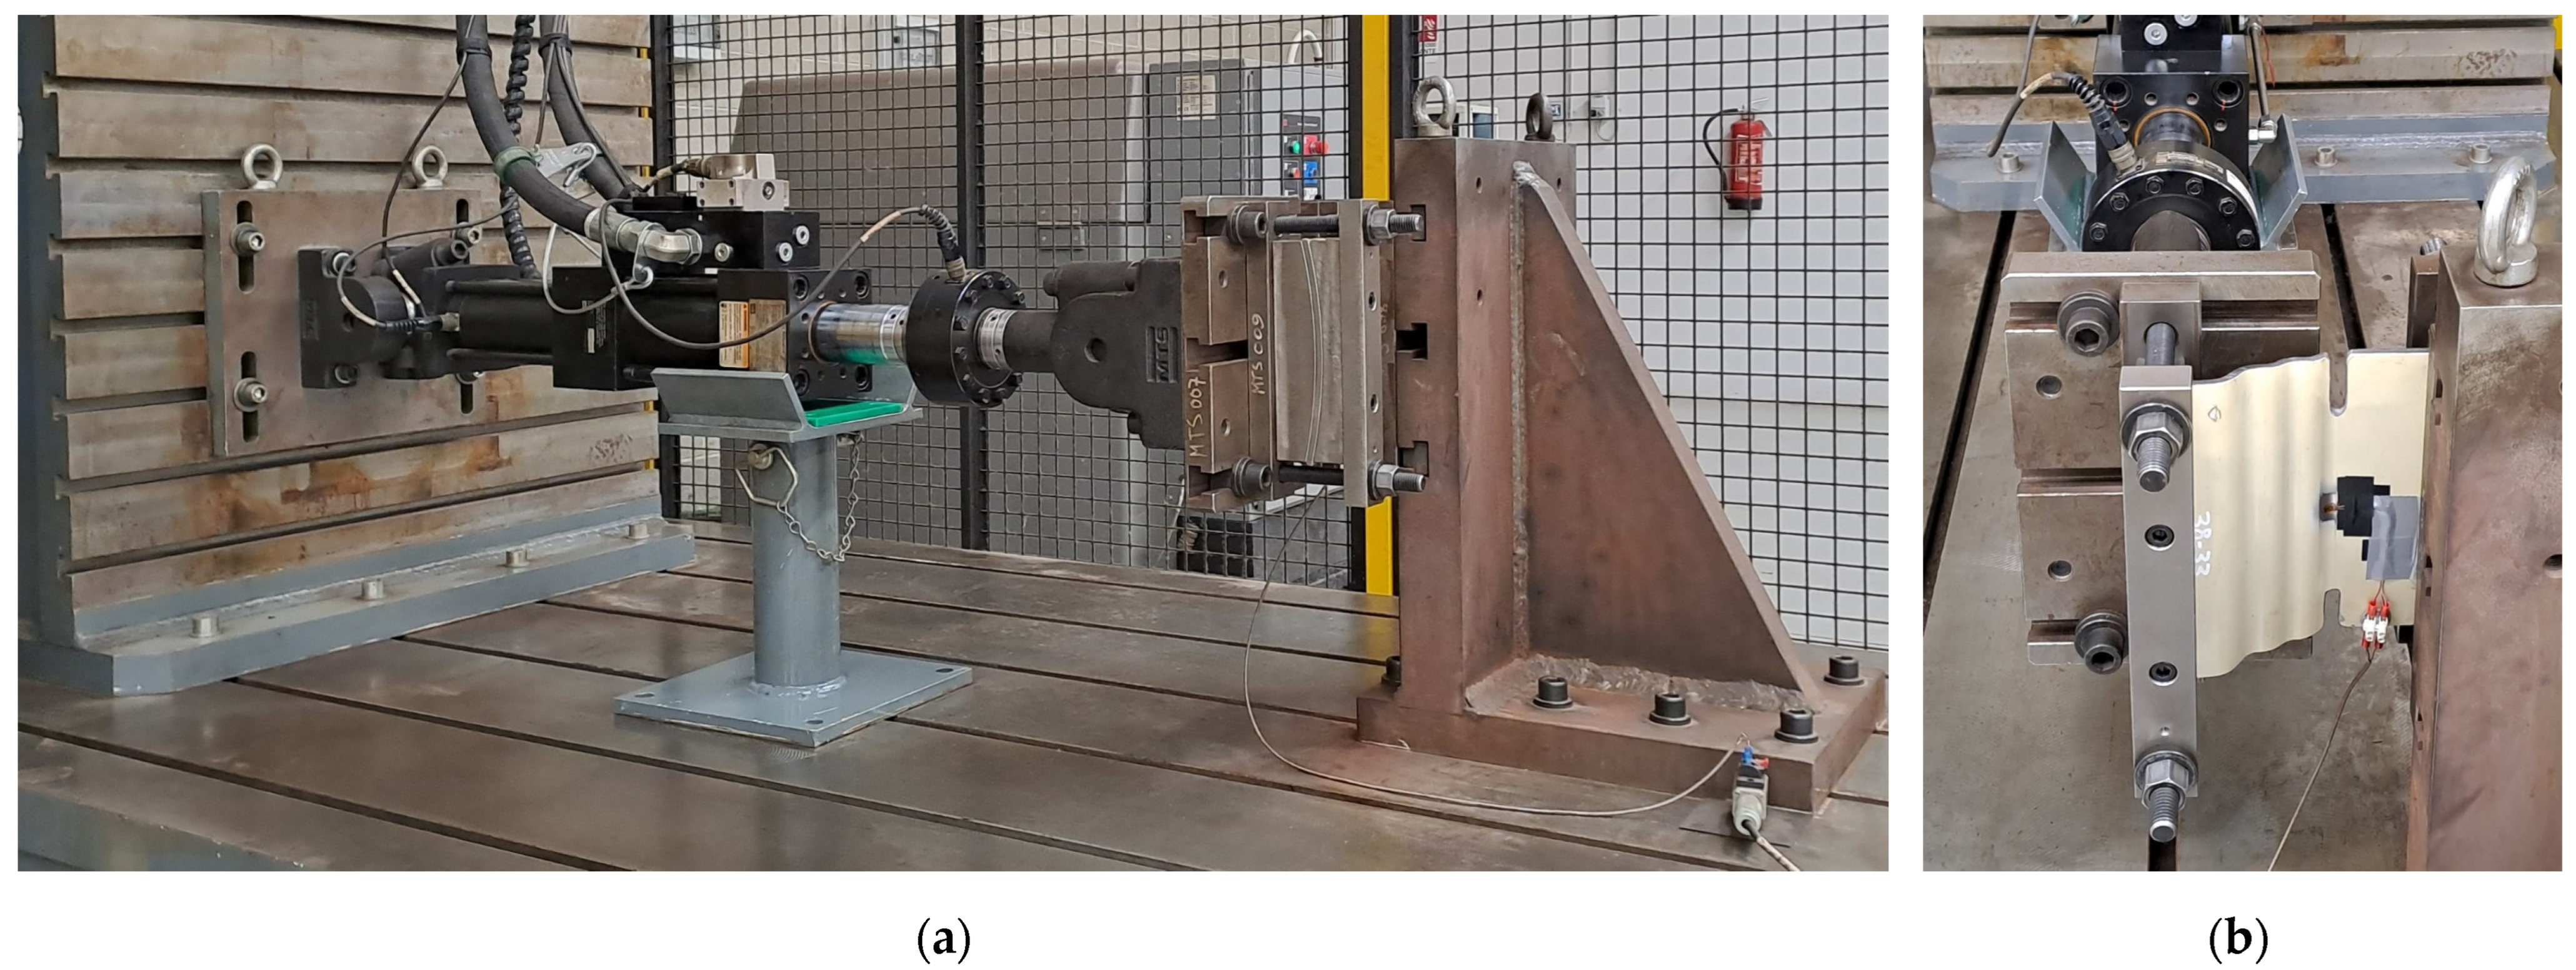
They are manufactured by MTS Systems Corporation (Eden Prairie, MN, USA). A simple machine frame gives the possibility of testing different kinds of components, after a proper customization of the fixture for specimens clamping. In this case, the specimens were clamped at both sides, in a horizontal configuration, which is the same configuration of the rim in contact with the ground. The test machine and the setup for the fatigue testing of rim sections are shown in Figure 5.
The specimens were tested in tension–tension bending fatigue. This was necessary to keep the maximum stress in the outer surface of the radius of interest, which is the most critical point of the rim in service conditions. In fact, in the case of fully reversed bending, fatigue cracks would have developed from non-significant areas because of the curved geometry of the specimens. Moreover, this load condition is more similar to the real service load condition of rims, where tensile stresses mainly originate from the superposition of a constant mean load, due to the tyre pressure, to additional variable loads due to the vehicle maneuvers [8,14].
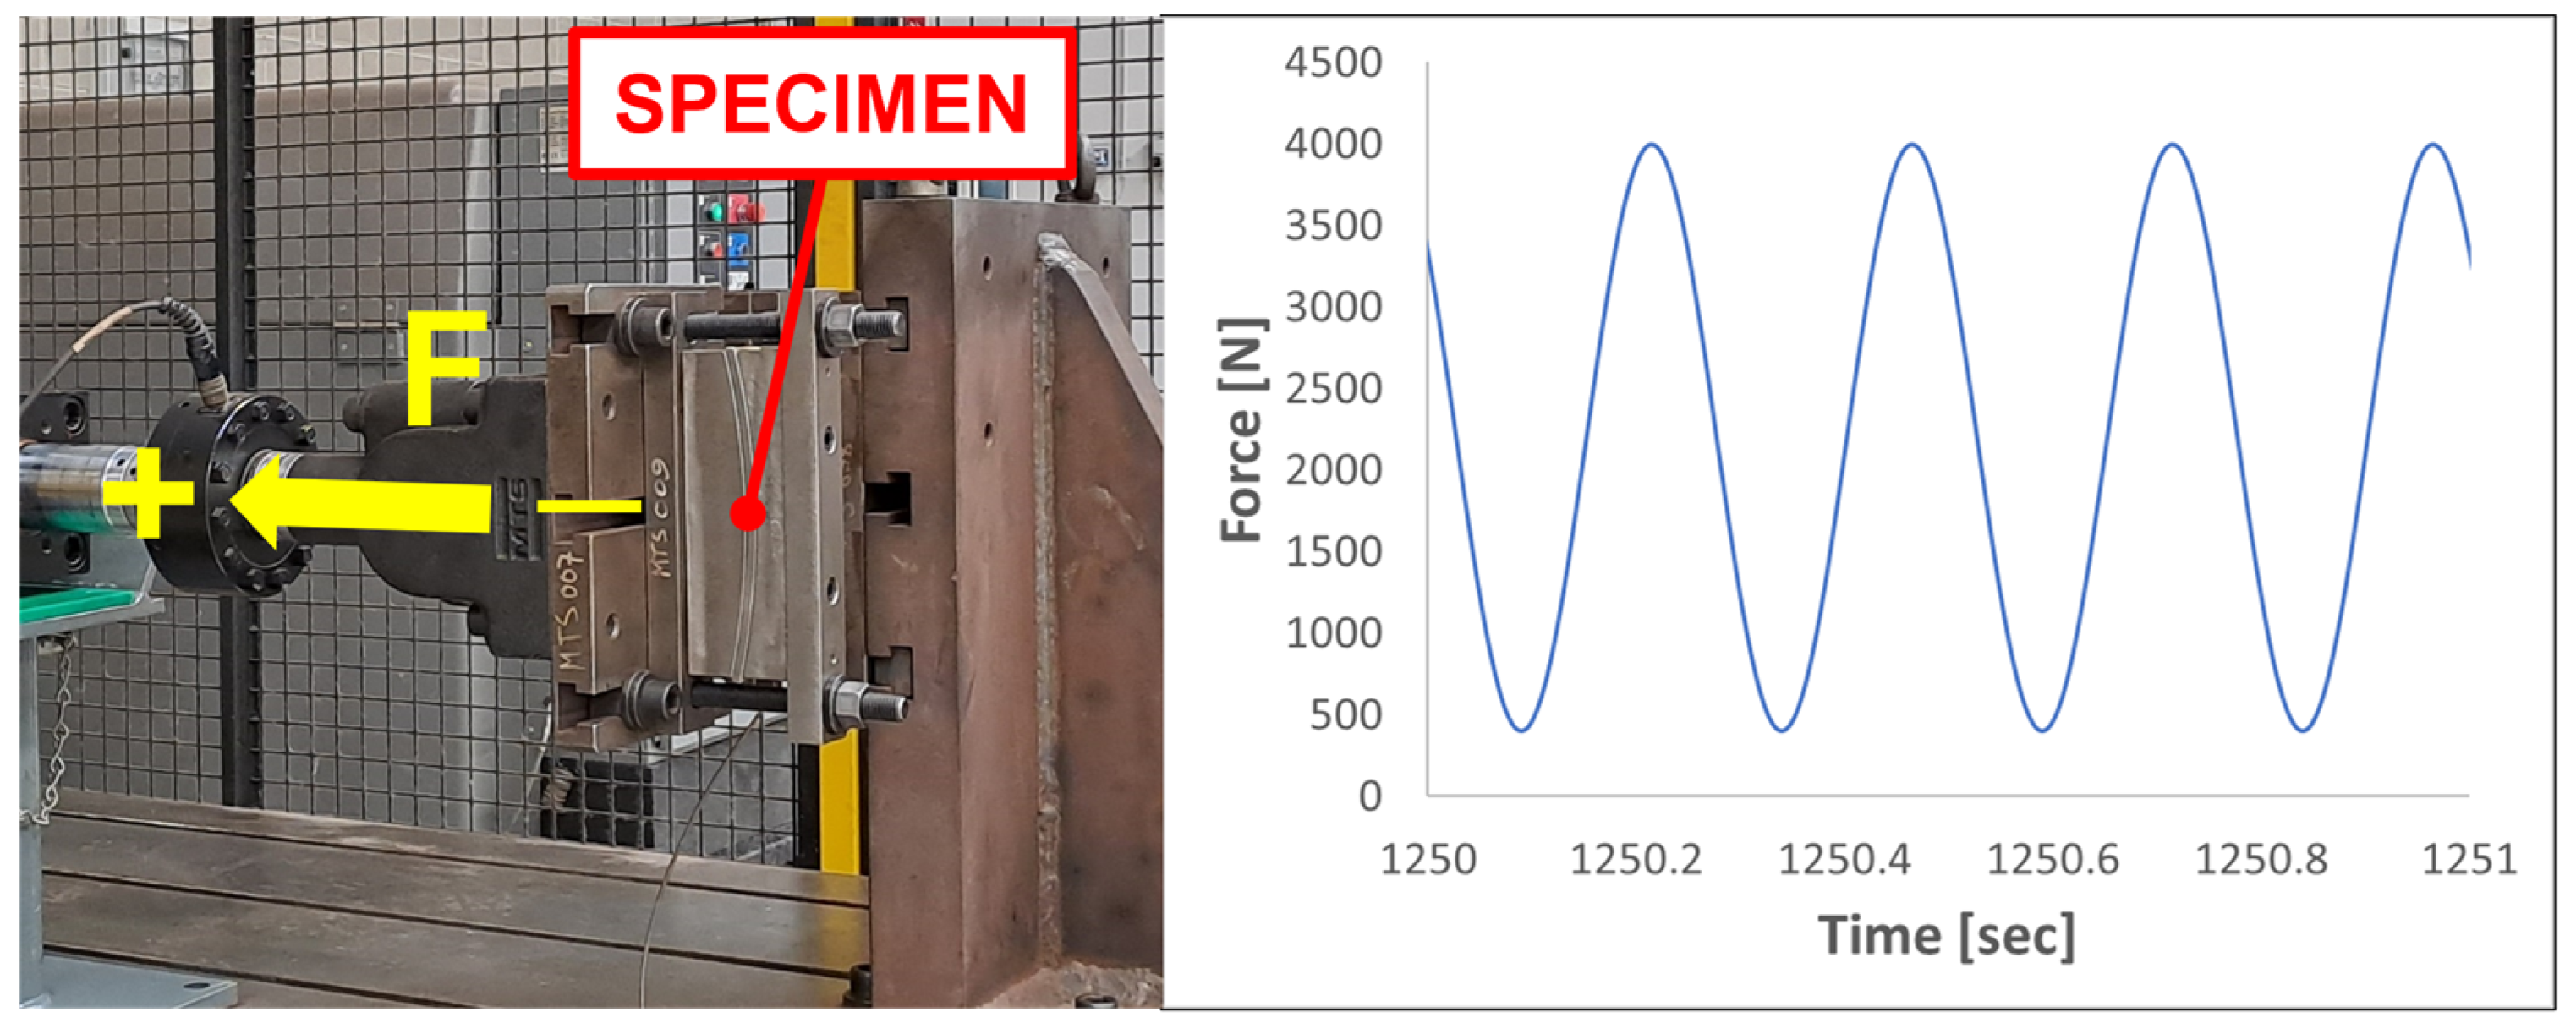
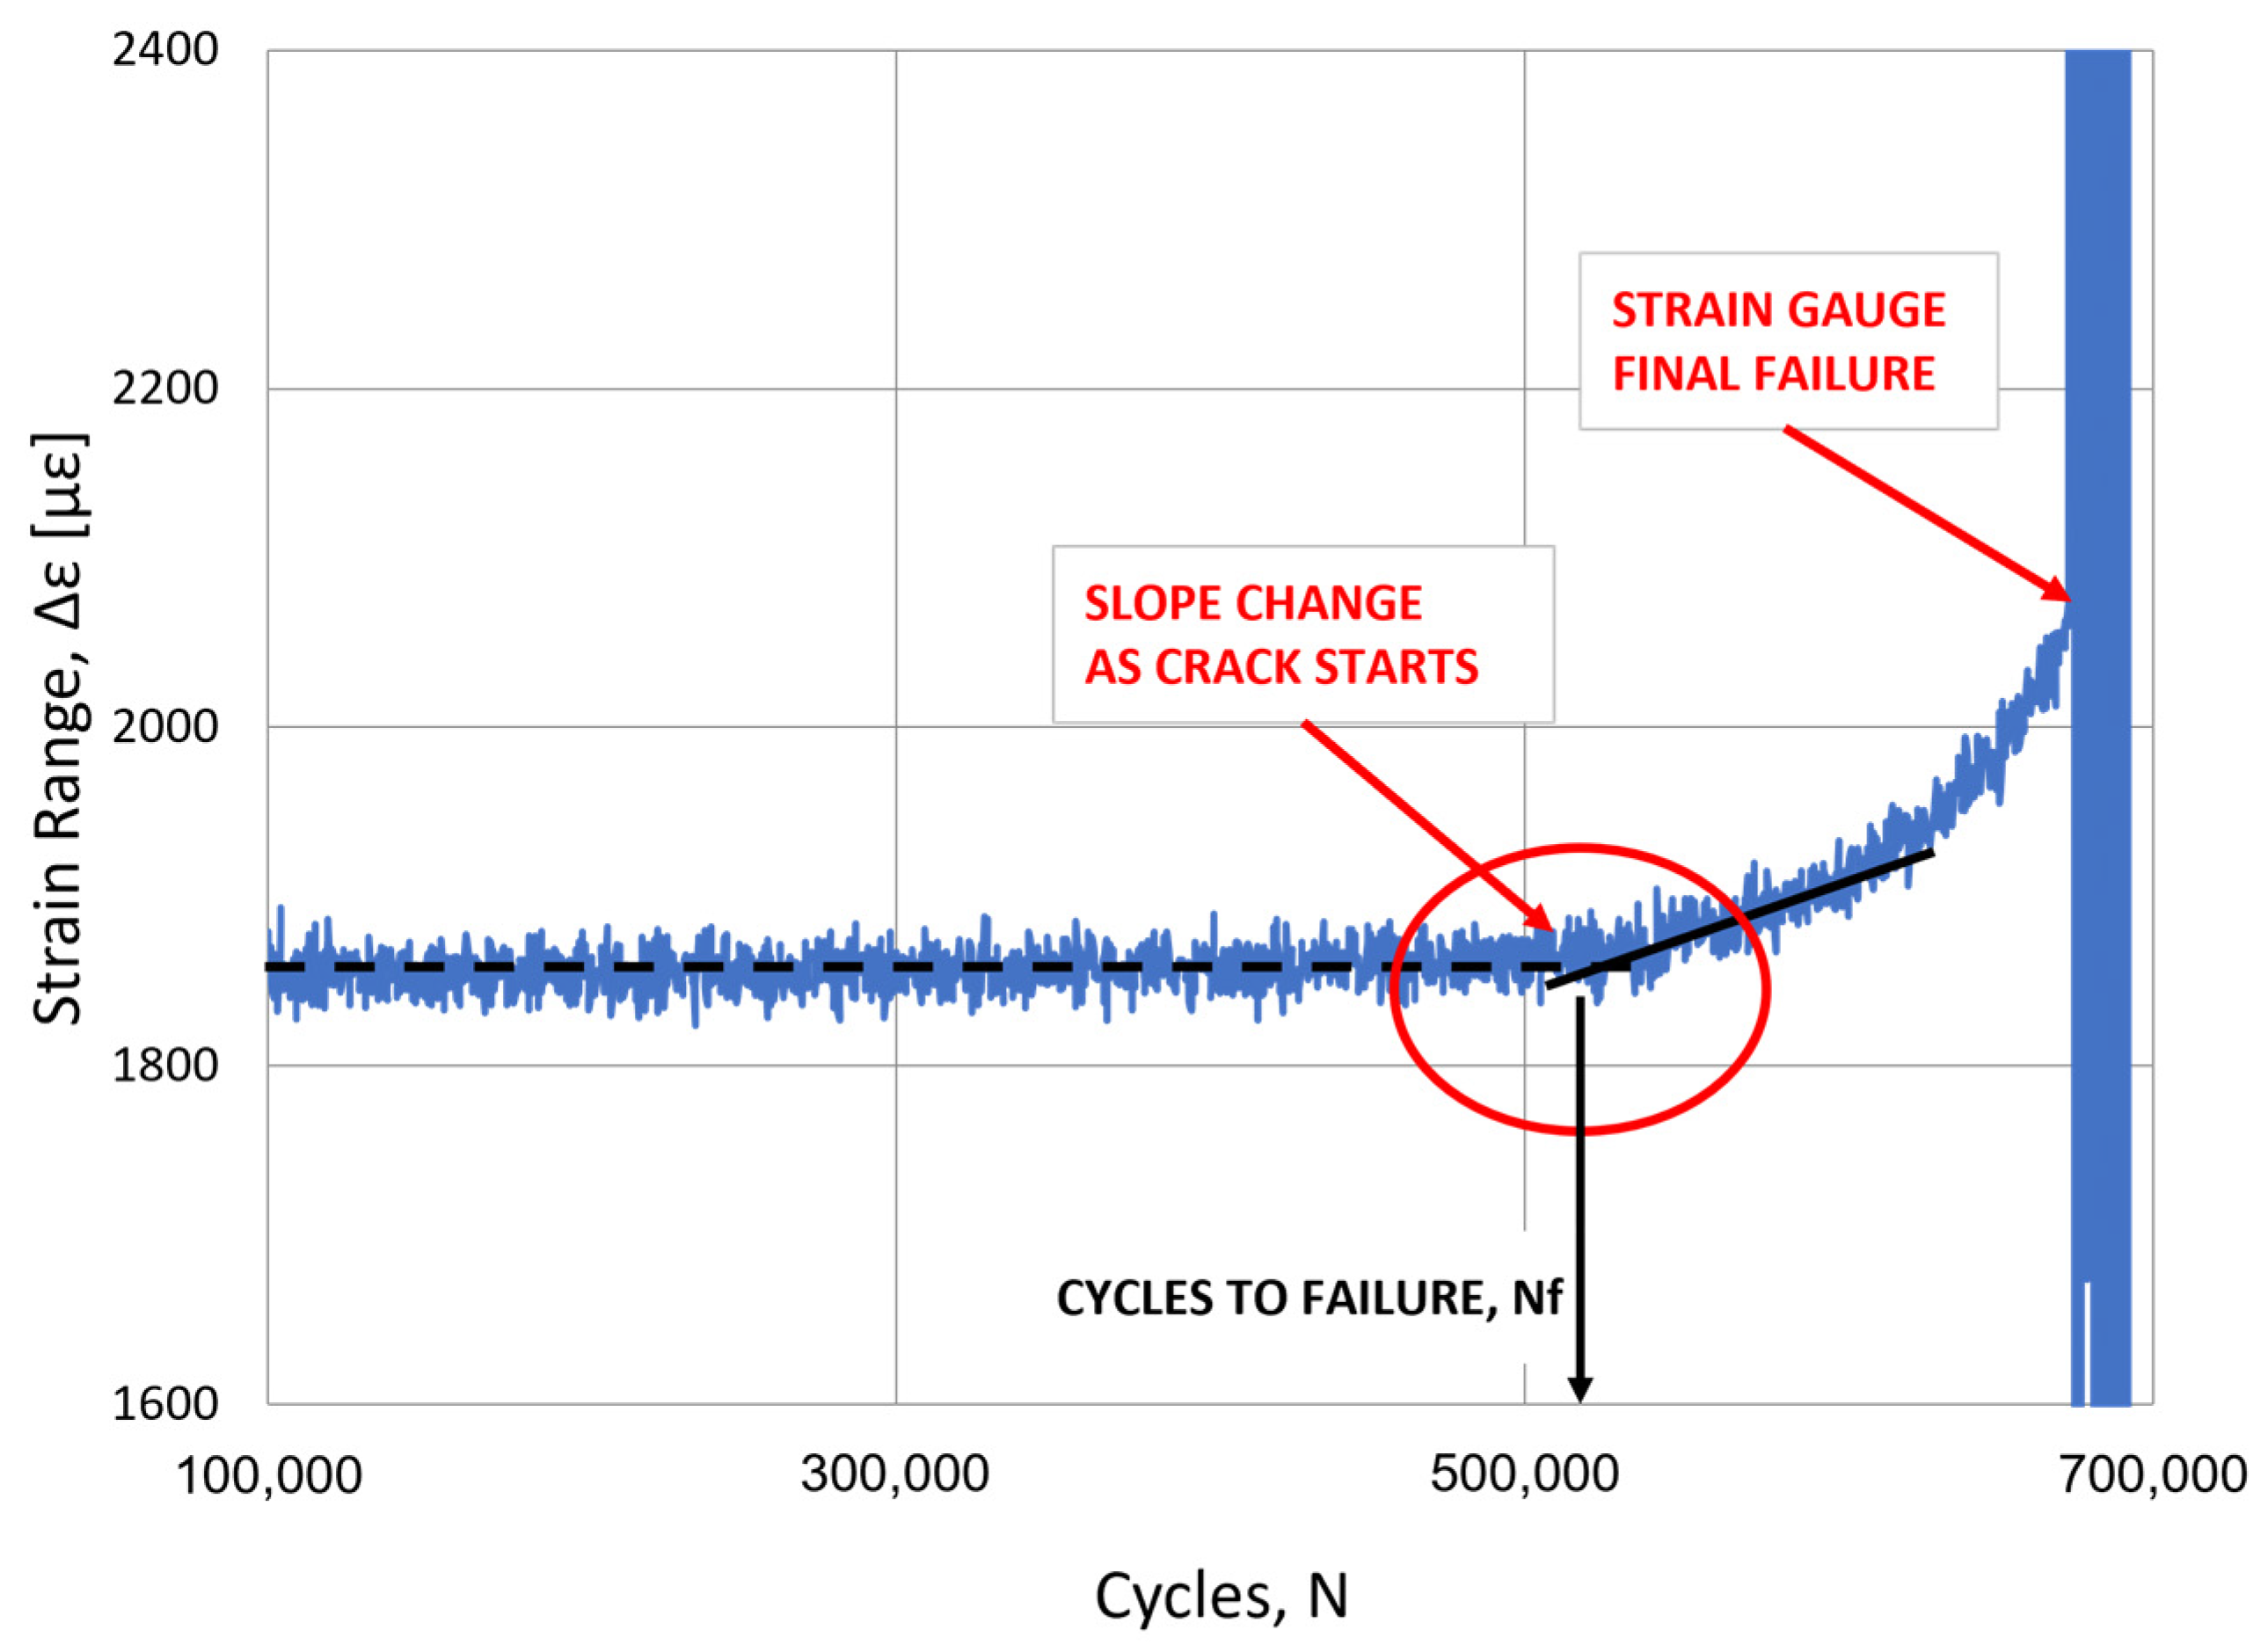
The fatigue tests were conducted in load control mode at 4 Hz frequency, with load ratio R = Fmin/Fmax = 0.1 and a sinusoidal load function. These parameters were chosen to optimize the test machine behavior from the point of view of dynamics and oil temperature control. An example of the load function is shown in Figure 6. An additional strain gauge was applied on each specimen, in the area of maximum stress, to acquire the actual strain value, ε, during the fatigue test. The strain gauges used were Micro Measurements (Wendell, NC, USA) WK-06-125BT-350, with a gauge factor of 2.01. A change in the behavior of the strain range, Δε = εmax − εmin, from steady to continuously increasing values, was considered the signal of fatigue crack development, as will be discussed in Section 3.1. In the absence of this trend, tests were conducted up to 2 × 10⁶ cycles, considered as a limit to runout. At the end of the test, each specimen was submitted to magnetic particle inspection to confirm the fatigue crack development.

2.2.2. Geometry of the Specimens for Rim Section Fatigue Tests

The customized geometry of the specimen for the rim section tests was designed to obtain the fatigue crack development exactly in the area of interest—the radius shown in Figure 4.
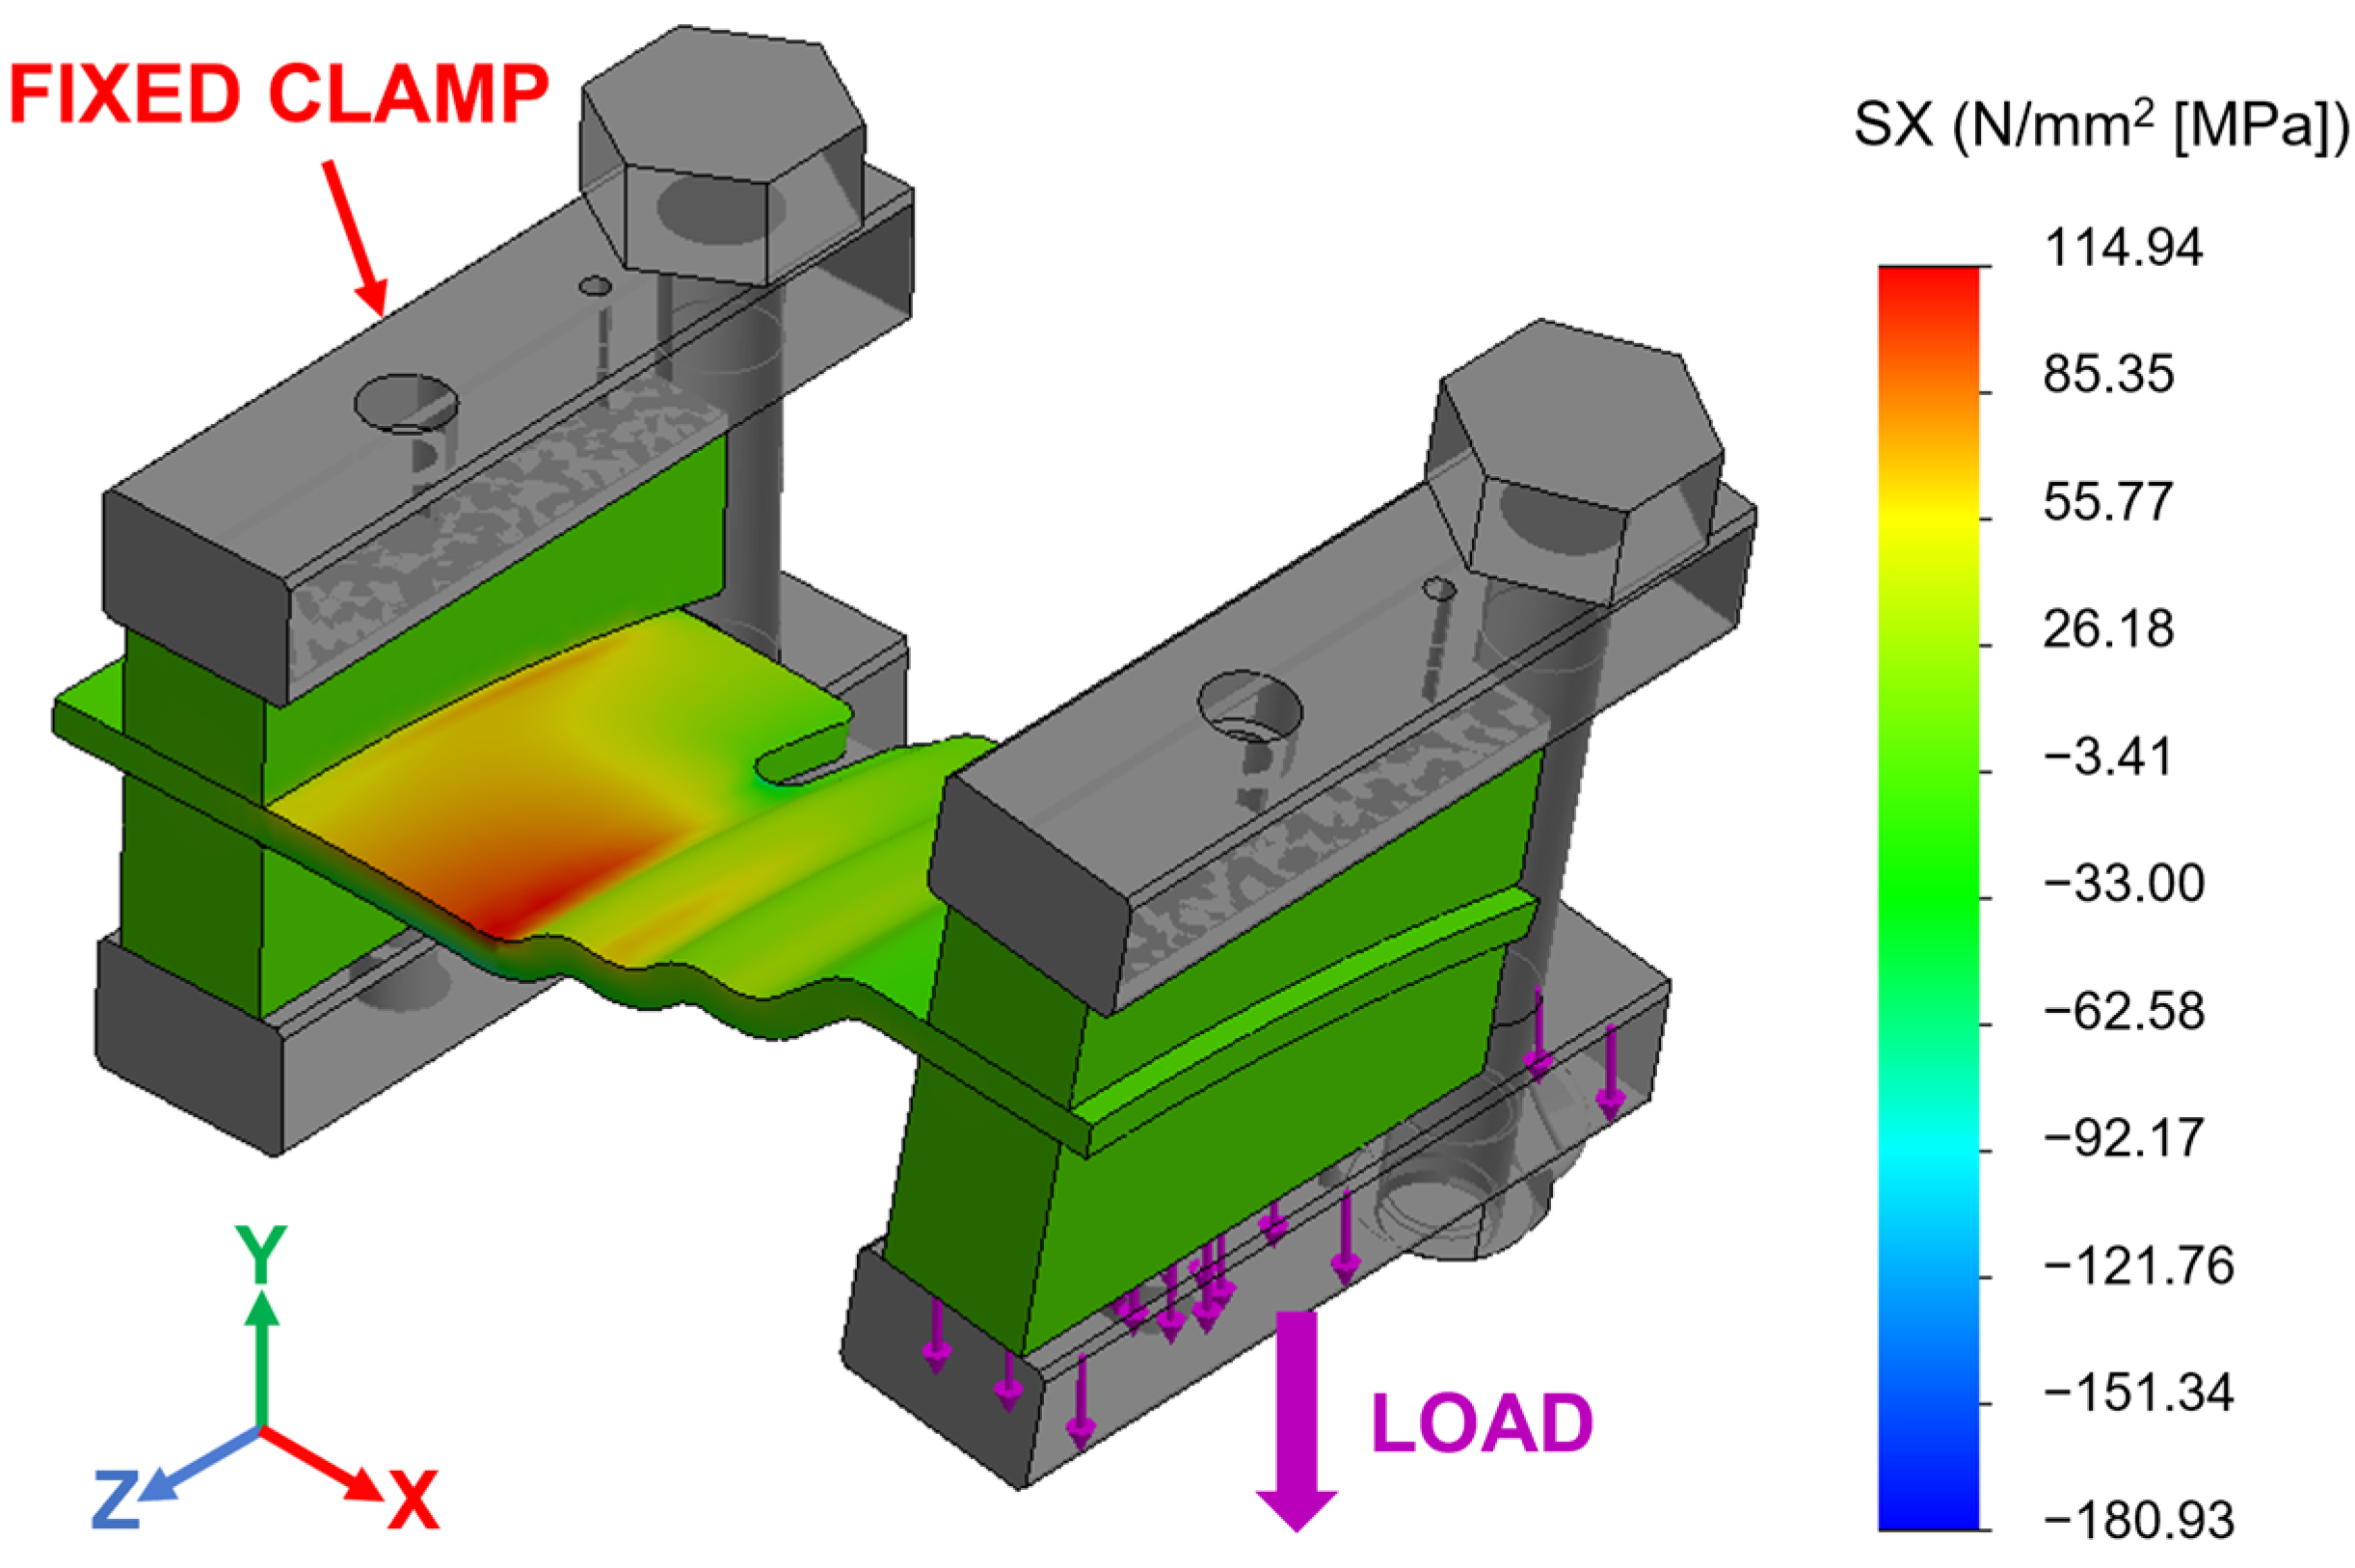
The final geometry is represented in Figure 7. It is the result of the optimization conducted by FEA, using the software SolidWorks Simulation 2022.
The main aim of the FEA was to obtain a proper shape to guarantee the crack development in the radius under investigation, avoiding comparable stress values in the remaining regions of the specimen. Therefore, a simplified symmetrical model was adopted, simulating only the clamping system and the specimen. The symmetry constraint was used to save computational time. A static linear elastic analysis was conducted, using a general structural steel as a material model, with mechanical properties according to Table 2 and Poisson’s ratio ν = 0.3. The load conditions of the test machine were applied—a fixed boundary condition to the fixed clamp and a unidirectional pulling force to the clamp directly joint to the machine hydraulic actuator. The finite element model is shown in Figure 8.
The contact condition between the clamps and the specimen surface was simulated using a frictional coefficient of 0.3 and a proper preload was applied to the connection bolts. Parabolic solid elements, with 16 integration points, were used for the mesh generation. A 2 mm mesh size was used, resulting in a total number of 455,986 elements and 670,942 nodes. The mesh size was chosen after a preliminary sensitivity analysis, the results of which are shown in Figure 9. The comparison between three different mesh sizes showed a maximum difference below 3% in the stress distribution along the specimen axial direction. The choice of the final mesh size allowed us to optimize the overall computational time without influencing the accuracy of the result.
The finite element model of the specimen was developed in a simplified way because the basic target of the analysis was the design of a proper shape to obtain the fatigue crack development where needed. For this reason, no further effort was made to exactly recreate the test machine behavior in the model and the FEA result must be considered from a qualitative point of view.
The shape optimization resulted in the introduction of a notch at both sides of the specimen, near the radius under investigation, as shown in Figure 7. It is important to notice that, given the load conditions and the curved geometry of the specimen, the notch acts as a stress raiser only for the central part of the remaining section and not at the root of the notch itself. This is an essential difference, if compared to standard fatigue tests of notched specimens. The optimization study focused on two parameters of the notch geometry: the notch length and the notch radius. The notch length was optimized to reduce the specimen cross-section, thus increasing the stress in the area of interest without affecting the test machine setup. In fact, the stiffness of the specimen had to be sufficient to allow proper test loads in the sensitivity range of the machine. The notch radius was optimized to not create the maximum stress peak at the root of the notch itself, thus avoiding an undesired failure mode. As a final result, considering the maximum principal stress along the axial direction of the specimen (x, in Figure 8), the stress ratio between the radius under investigation and the region next to the fixed clamp, where the bending moment is maximum, was 1.53. Therefore, the probability of obtaining the specimen failure where needed, for the test purpose, was maximized, as later confirmed by the fatigue test results, discussed in Section 3.1.

2.2.3. Test Machine for Uniaxial Fatigue Tests

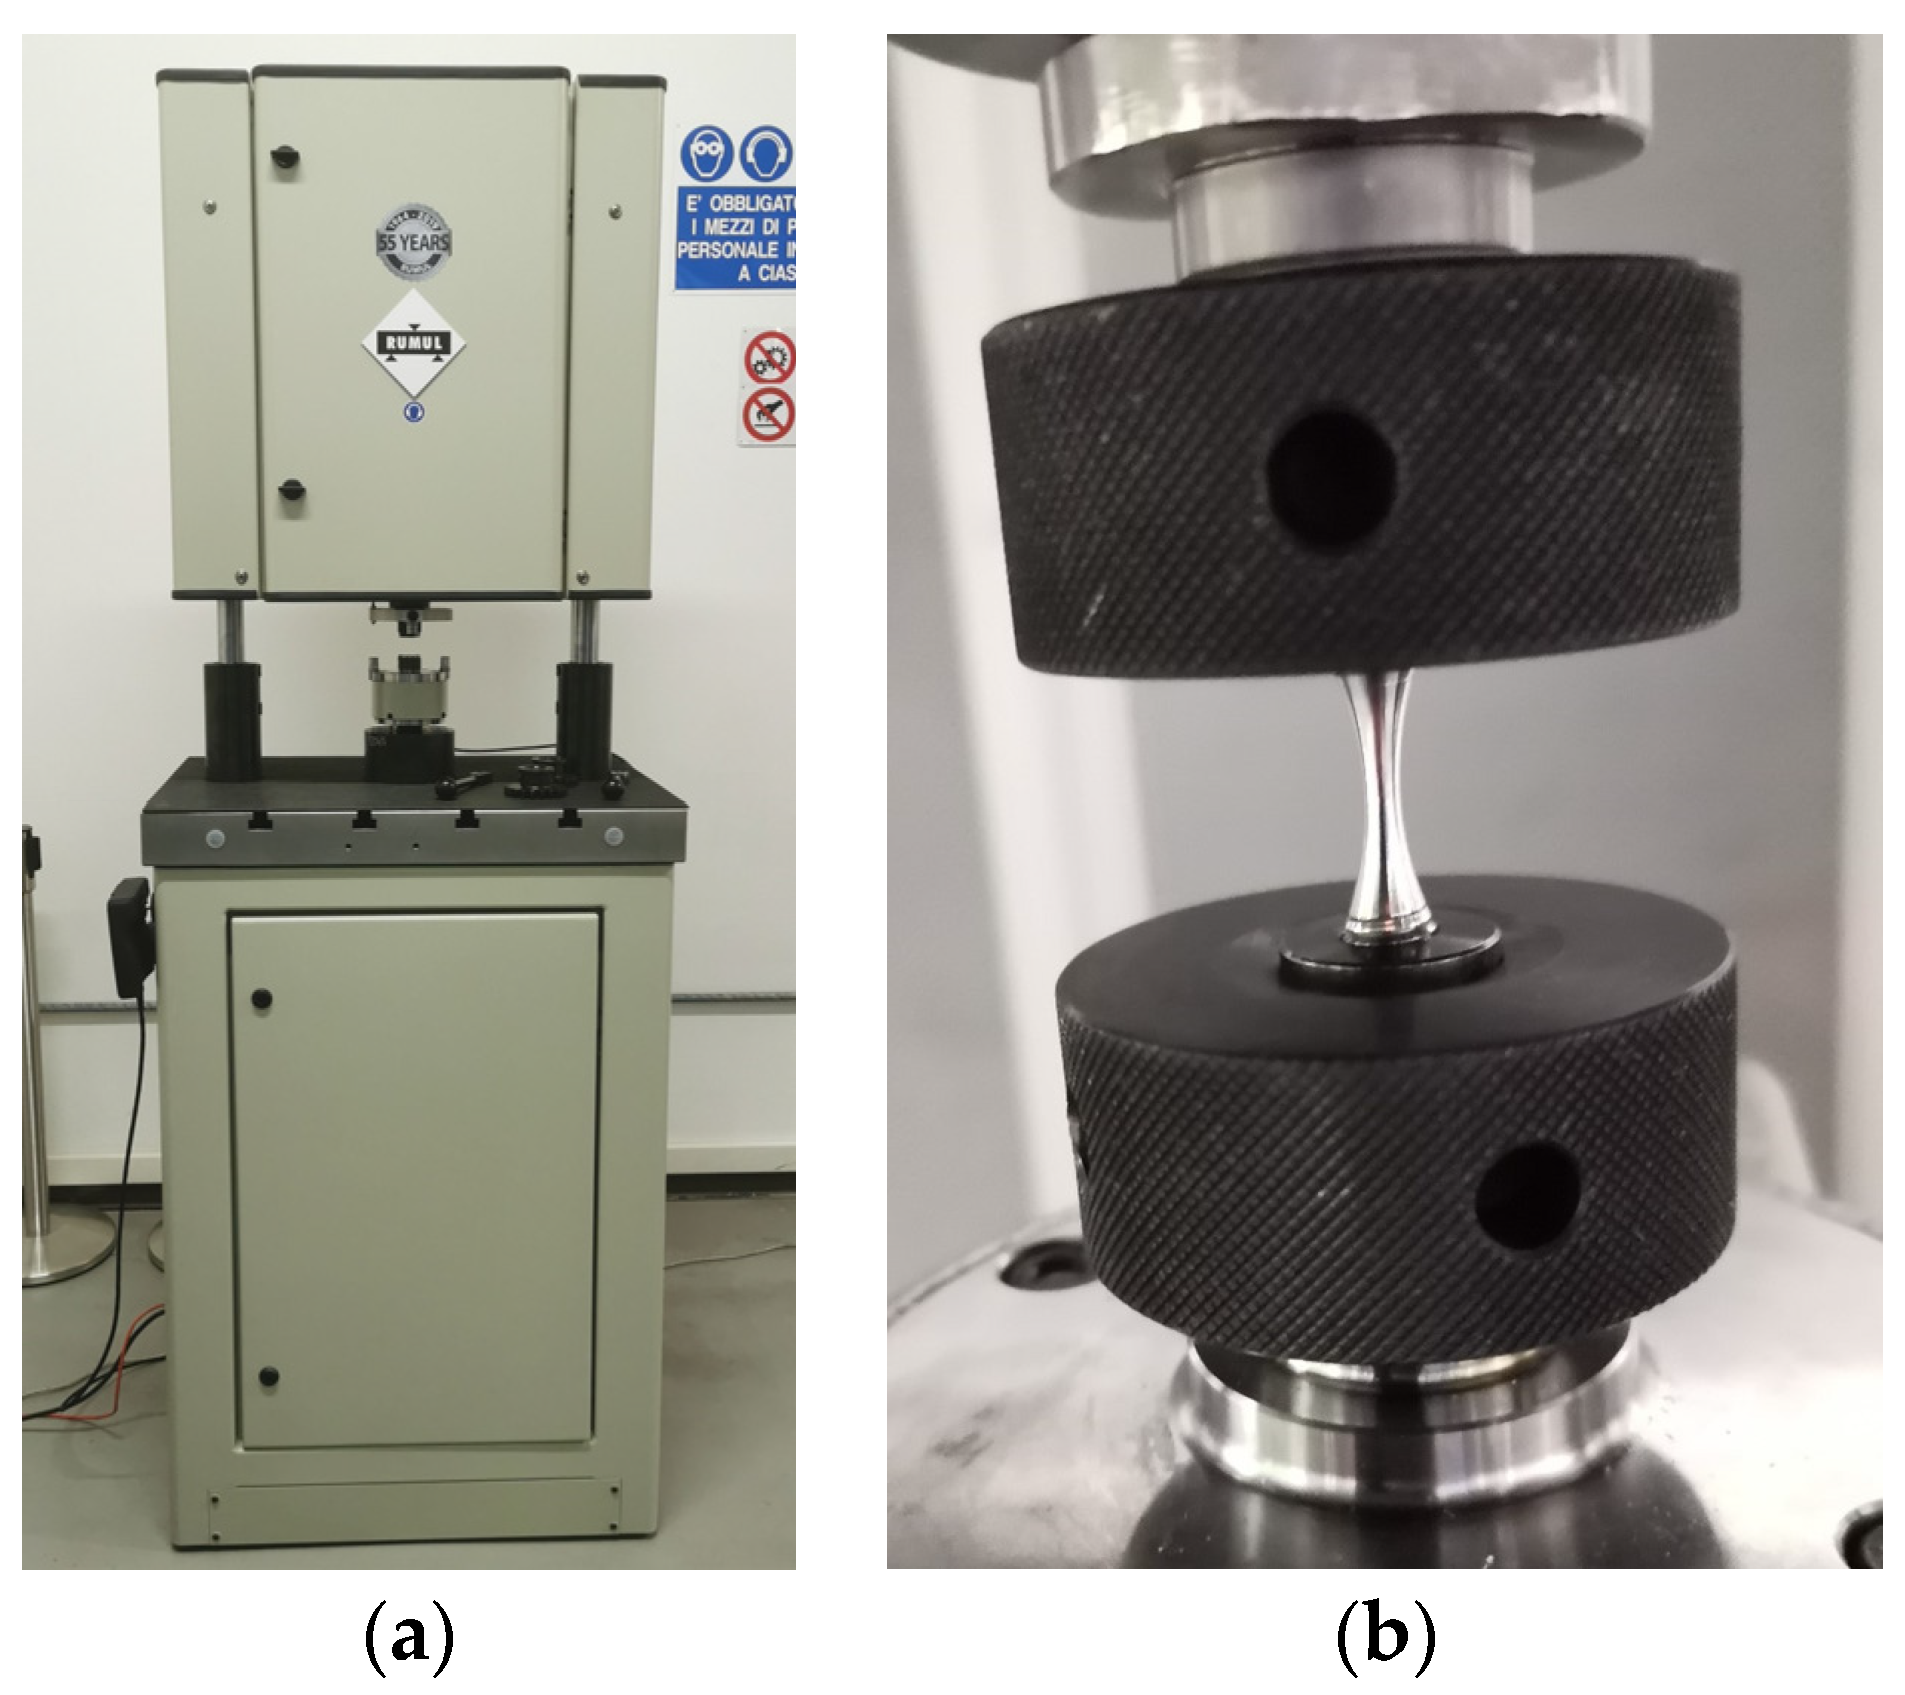
The machine used for the fatigue tests of the base material is a Rumul Mikrotron resonant machine (Russenberger Prüfmaschinen AG, Neuhausen am Rheinfall, Switzerland) with a maximum load capacity of 20 kN. Uniaxial fatigue tests were conducted in load control mode, at 30 Hz frequency, with load ratio R = 0.1 and a sinusoidal load function. In this case, the complete fracture of the specimen was assumed as the failure criterion. Otherwise, tests were stopped at 2 × 10⁶ cycles and considered as runouts.
The test machine and a detail of the test setup are represented in Figure 10.

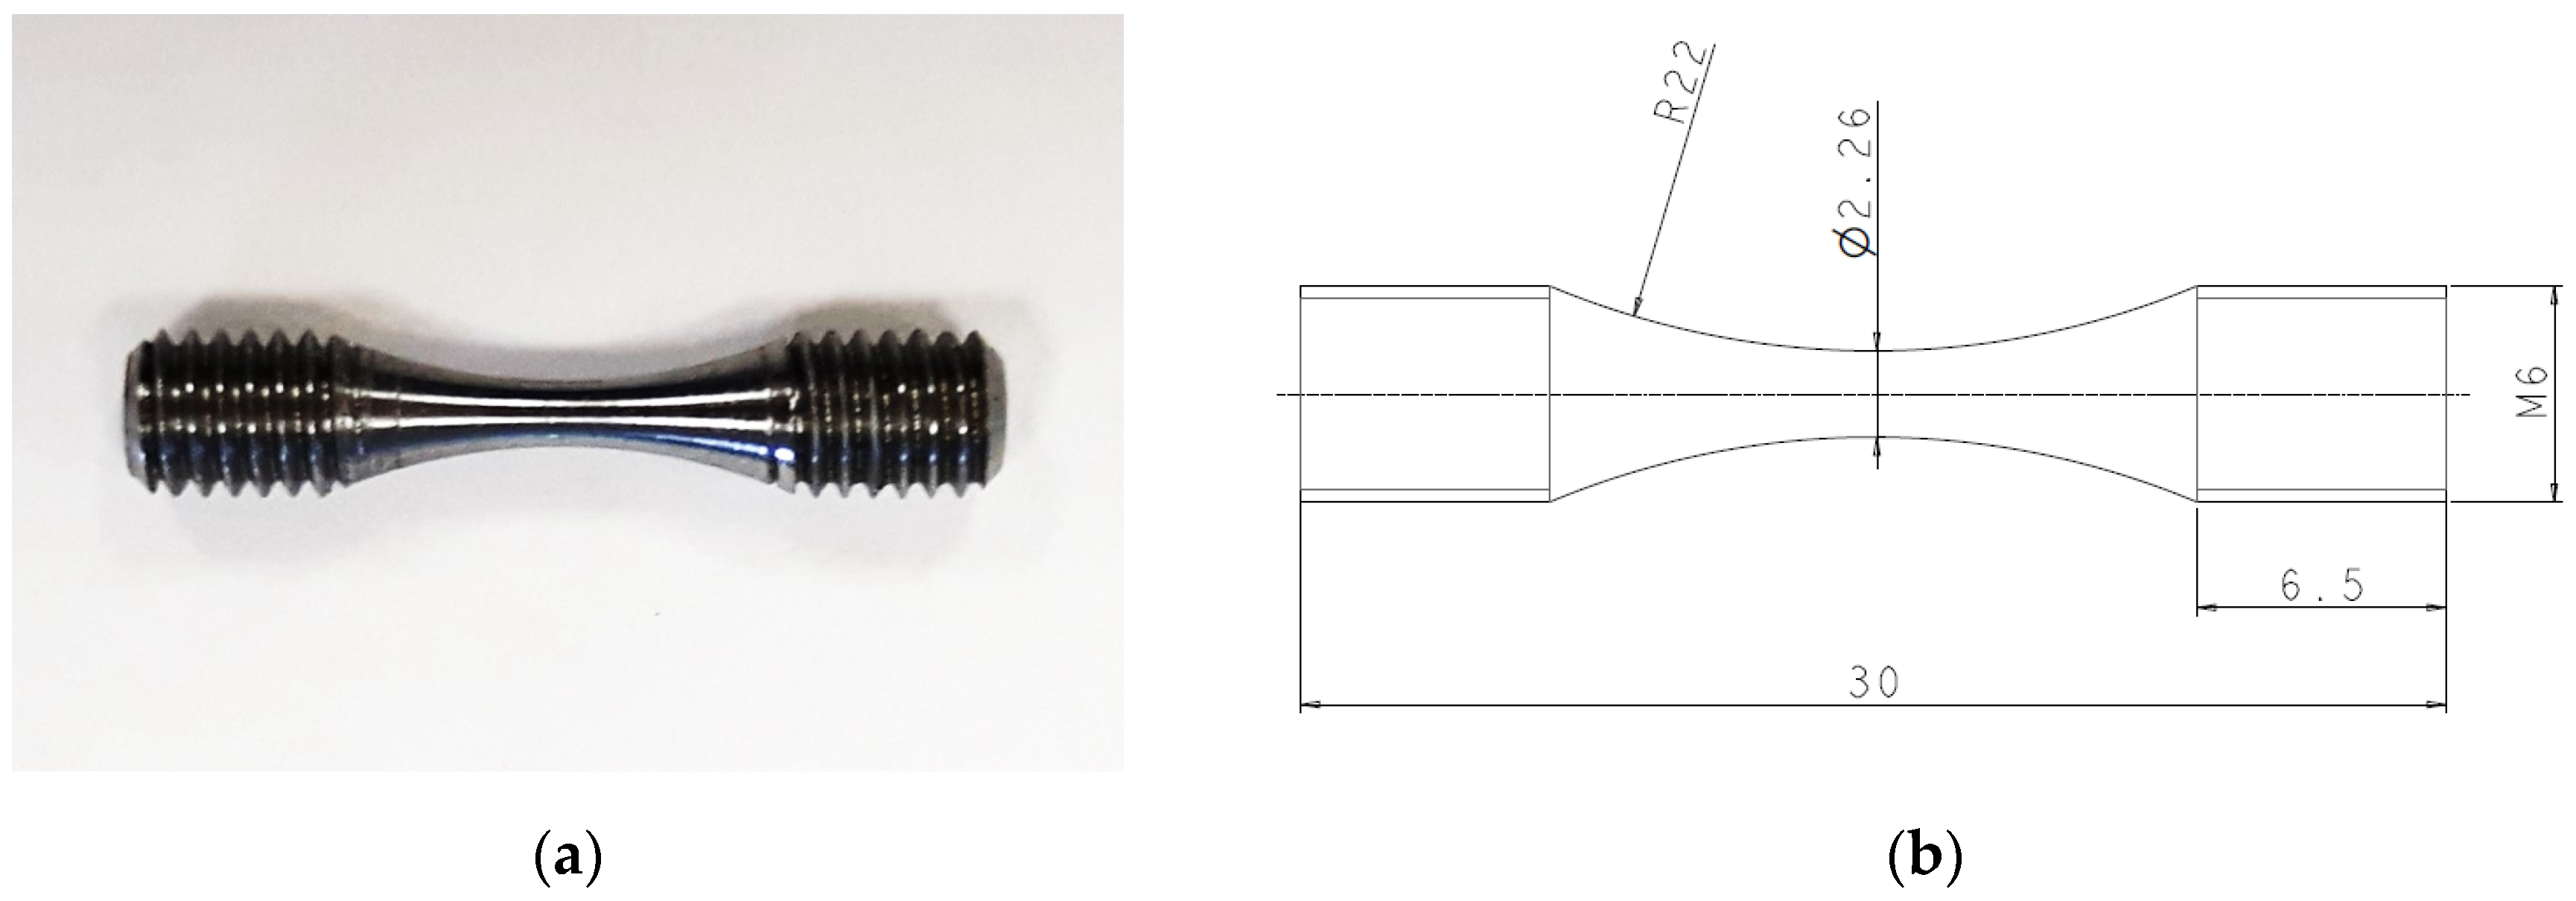
2.2.4. Geometry of the Specimens for Uniaxial Fatigue Tests

The specimens used for the uniaxial fatigue testing had a more traditional hourglass shape. Their dimensions were simply adapted to the specifications required by the resonant machine, with the maximum cross-sectional area allowable to be cut out from the base material strip, whose nominal thickness was 7 mm. The specimens were aligned along the transverse direction of the strip (T), which corresponds to the direction of the main stress component acting in the critical area of the rim in service conditions. The location of the material samples from the original strip was chosen in accordance with ISO 377:2017 [24]. The geometry of the specimens for uniaxial testing is shown in Figure 11.

3. Results and Discussion

3.1. Fatigue Test Results of Rim Section Specimens

A total number of 24 specimens were tested according to the procedure presented in Section 2.2.1. All the failed specimens showed a fatigue crack development in the radius under investigation, thus confirming the appropriateness of the specimen geometry studied by FEA. As a failure criterion, the change in the slope of the strain range, Δε, was assumed, with reference to a graph where the strain range behavior is monitored versus the total number of load cycles, N. In the presence of a fatigue crack, in fact, the strain range value starts to increase noticeably, leading to the strain gauge failure when the crack path reaches the strain gauge grid, which is narrower than the area of the specimen subjected to the maximum stress. An example of the typical behavior indicating the nucleation and development of a fatigue crack in the rim section specimens is shown in Figure 12, where the strain range, Δε, is represented in microstrain units [µε]. The number of cycles to failure, Nf, was assumed as the value by the slope change.
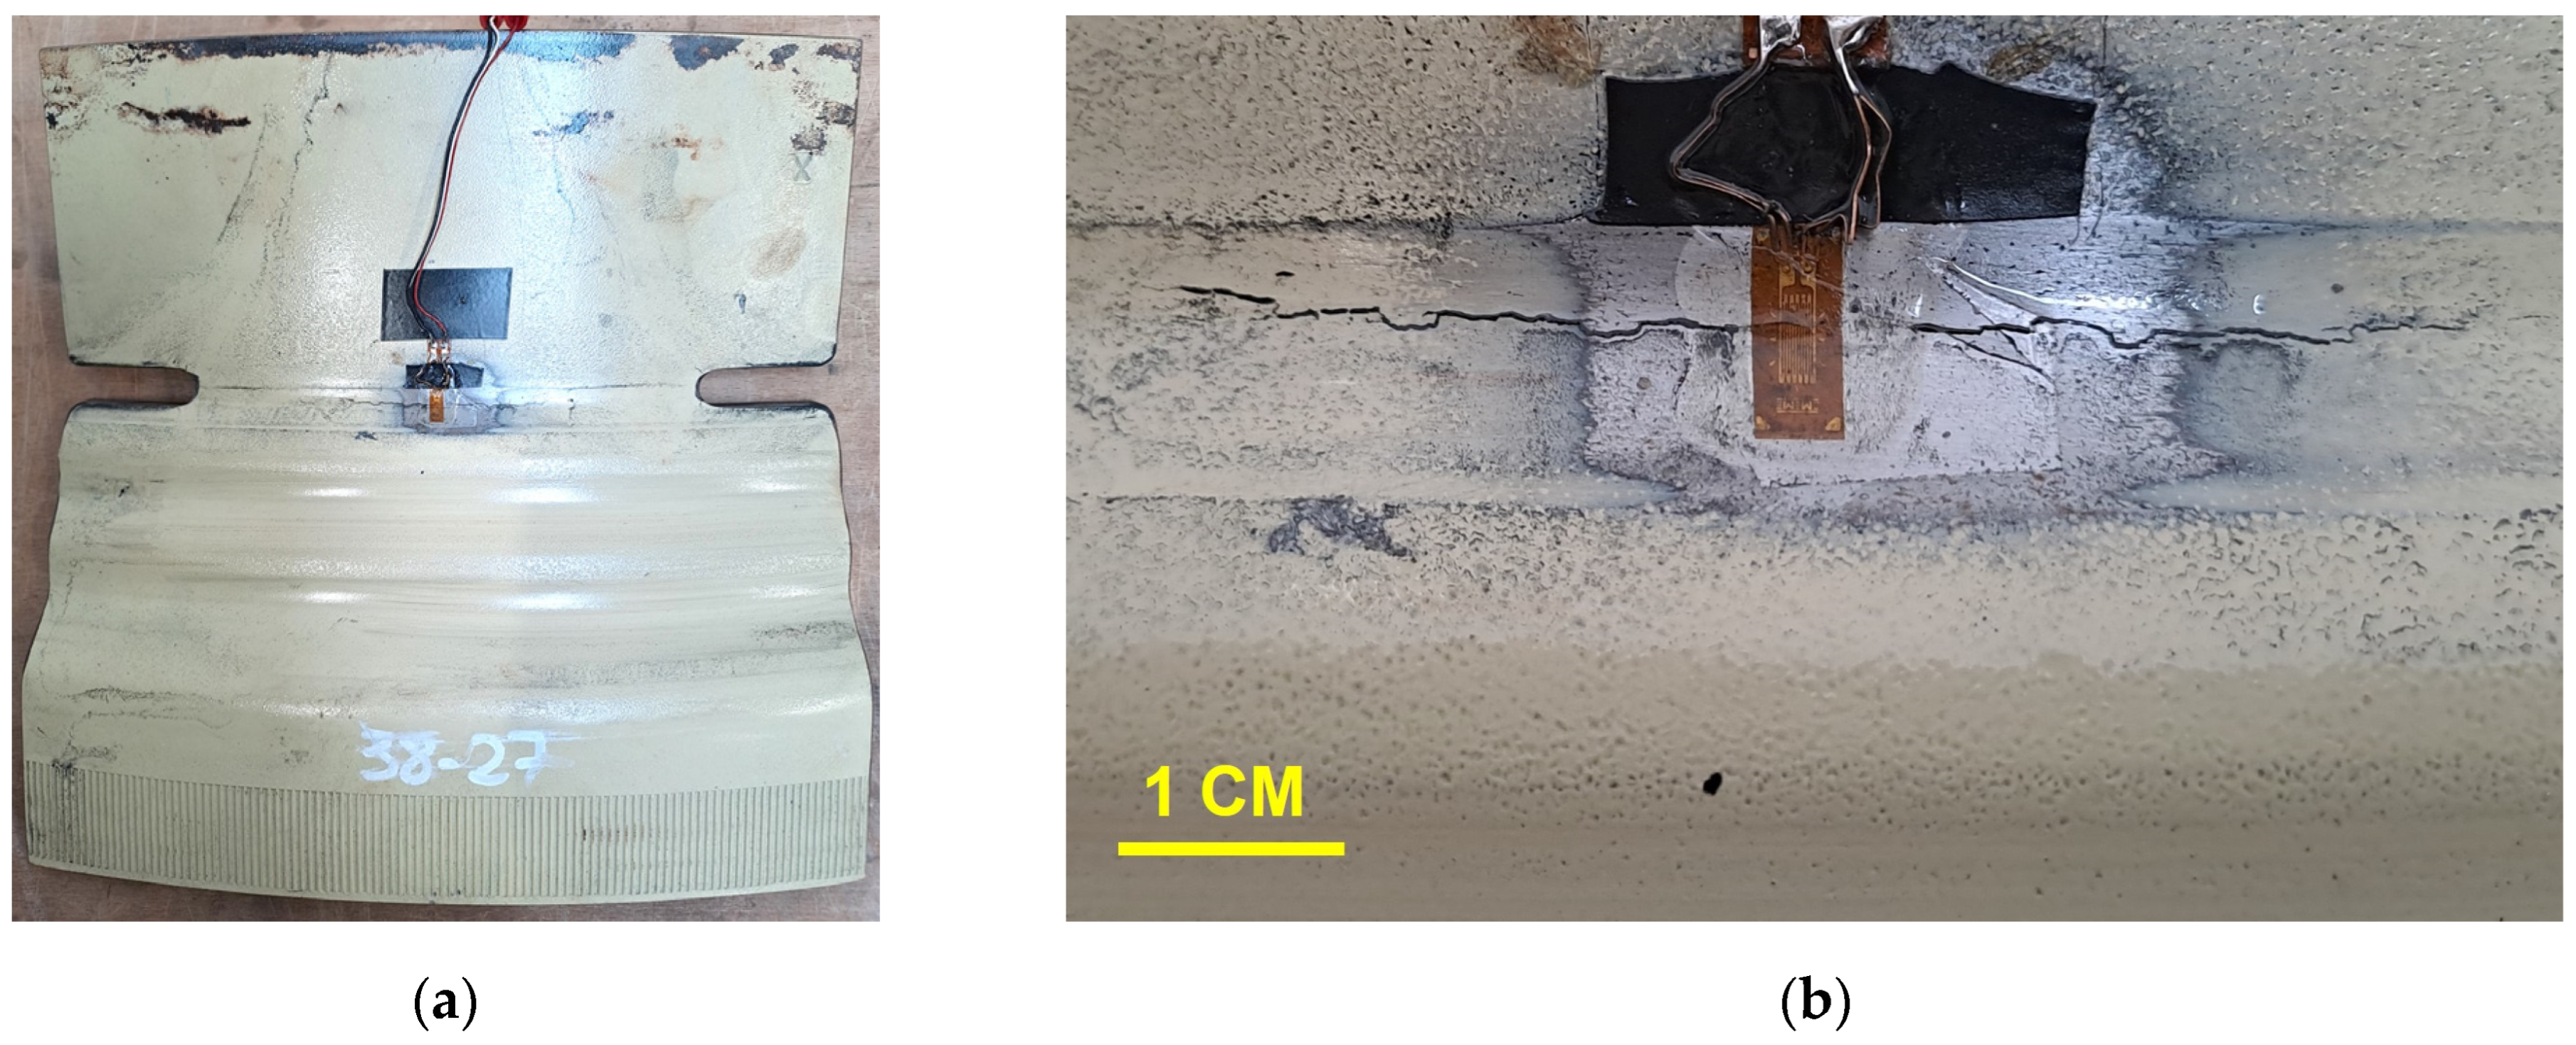
When the failure criterion of the specimen was met, the test was stopped, and the actual presence of a fatigue crack was confirmed by magnetic particle inspection. An example of a detected fatigue crack is shown in Figure 13. The crack originated exactly in the desired point, confirming the development path that is usually found in the case of rim failures in service [14].
The cracked surface after the total fracture of the specimen is shown in Figure 14. The surface aspect confirmed the typical morphology of fatigue failures, with beach marks indicating the crack tip arrest and progress at each load cycle, and a small area of brittle final fracture. Due to the unidirectional bending load condition and the curved geometry of the section, the crack path is more developed along the outer side of the specimen, corresponding to the rim circumferential direction, than through the thickness of the section. This leads to a sort of elliptical shape of the fatigue region in the cross-sectional view of Figure 14, where this elliptical area is approximately 9.5 cm long and 5 mm wide. The starting point of the crack was slightly aside the strain gauge position. This can be explained by the fact that the local stress is near the maximum value in a region of the specimen which is wider than the strain gauge grid. Therefore, any possible surface defect in that area may become the initial point of a fatigue crack.
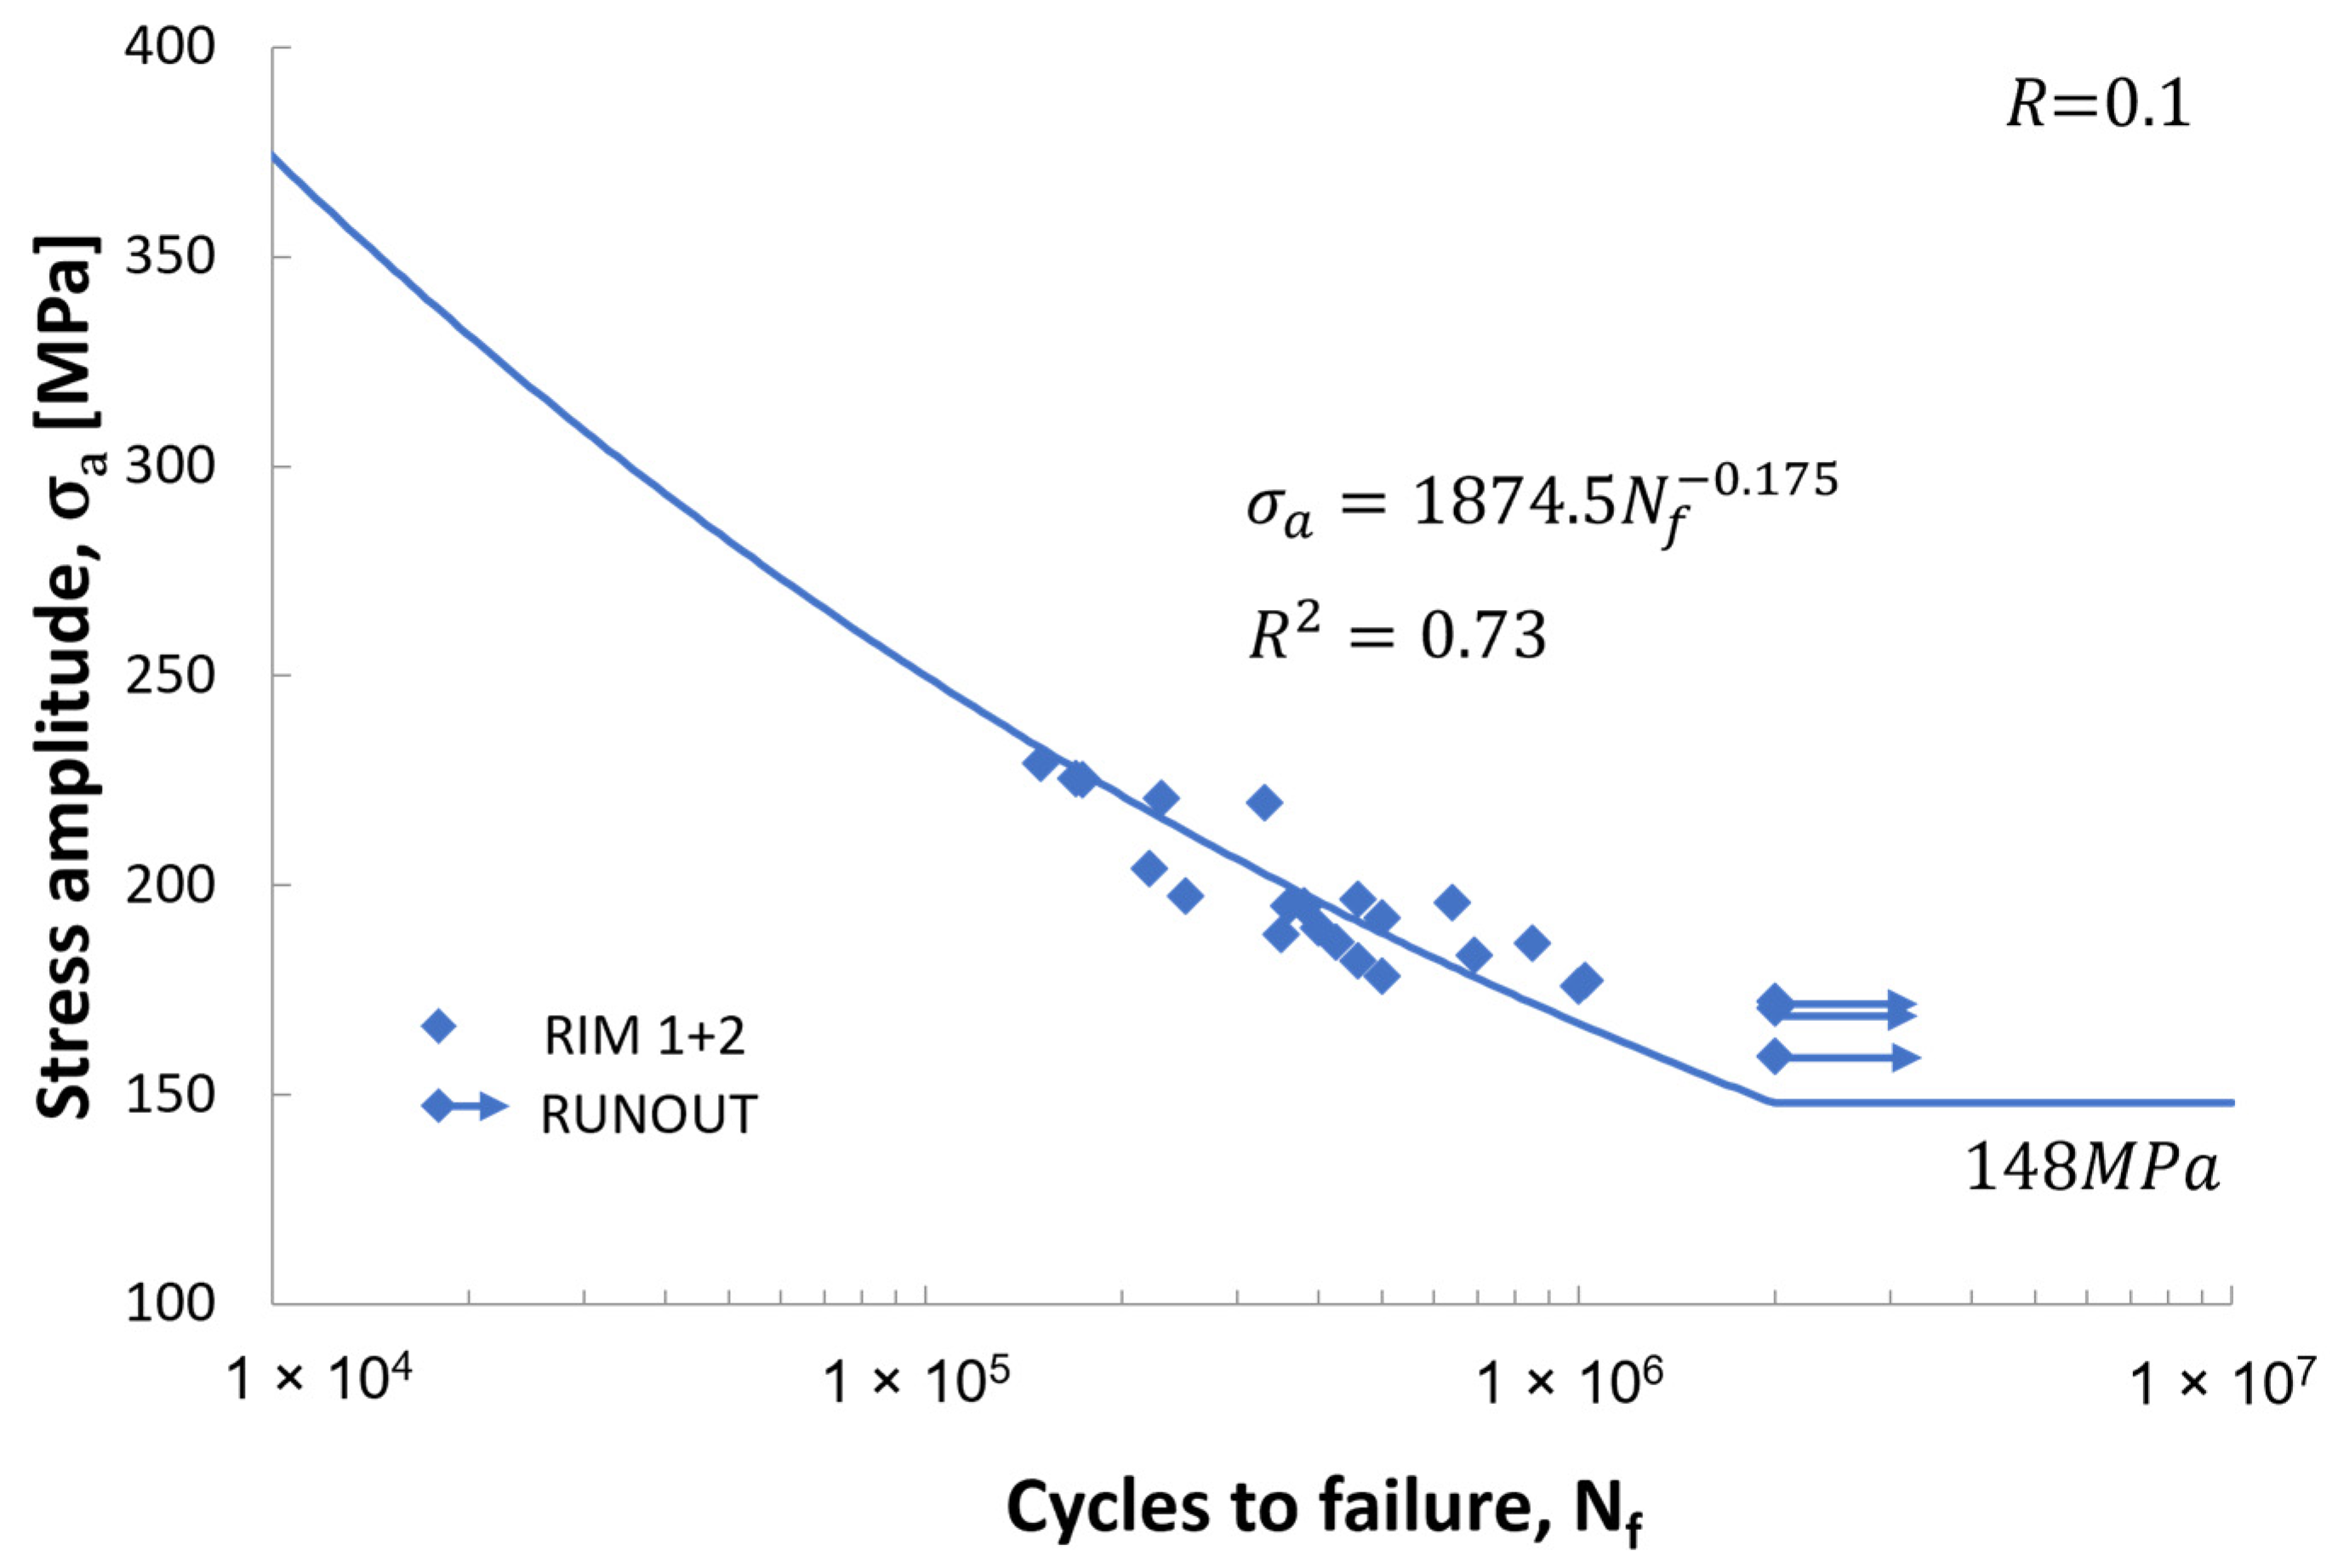
The specimens tested were obtained from two different rims of the same production batch, not manufactured consecutively but at a certain time interval. Henceforth, they will be referred to as Rim 1 and Rim 2. First, the aggregated fatigue data of both rims were considered to obtain the S-N (stress-life) diagram for the component at 50% probability of survival. The fatigue curve of the finite life region was obtained by linear regression of the fatigue data. It is represented in Figure 15, in terms of stress amplitude, σ a = ( σ m a x σ m i n ) / 2 , versus cycles to failure, Nf. The horizontal line of the graph represents the fatigue strength at runout (2 × 10⁶ cycles) for tension–tension bending tests with load ratio R = 0.1. Since it refers to the stress amplitude, it will be named as σ a f throughout this paper. From the analysis of the aggregated data of Rim 1 and Rim 2, σ a f = 148 MPa.
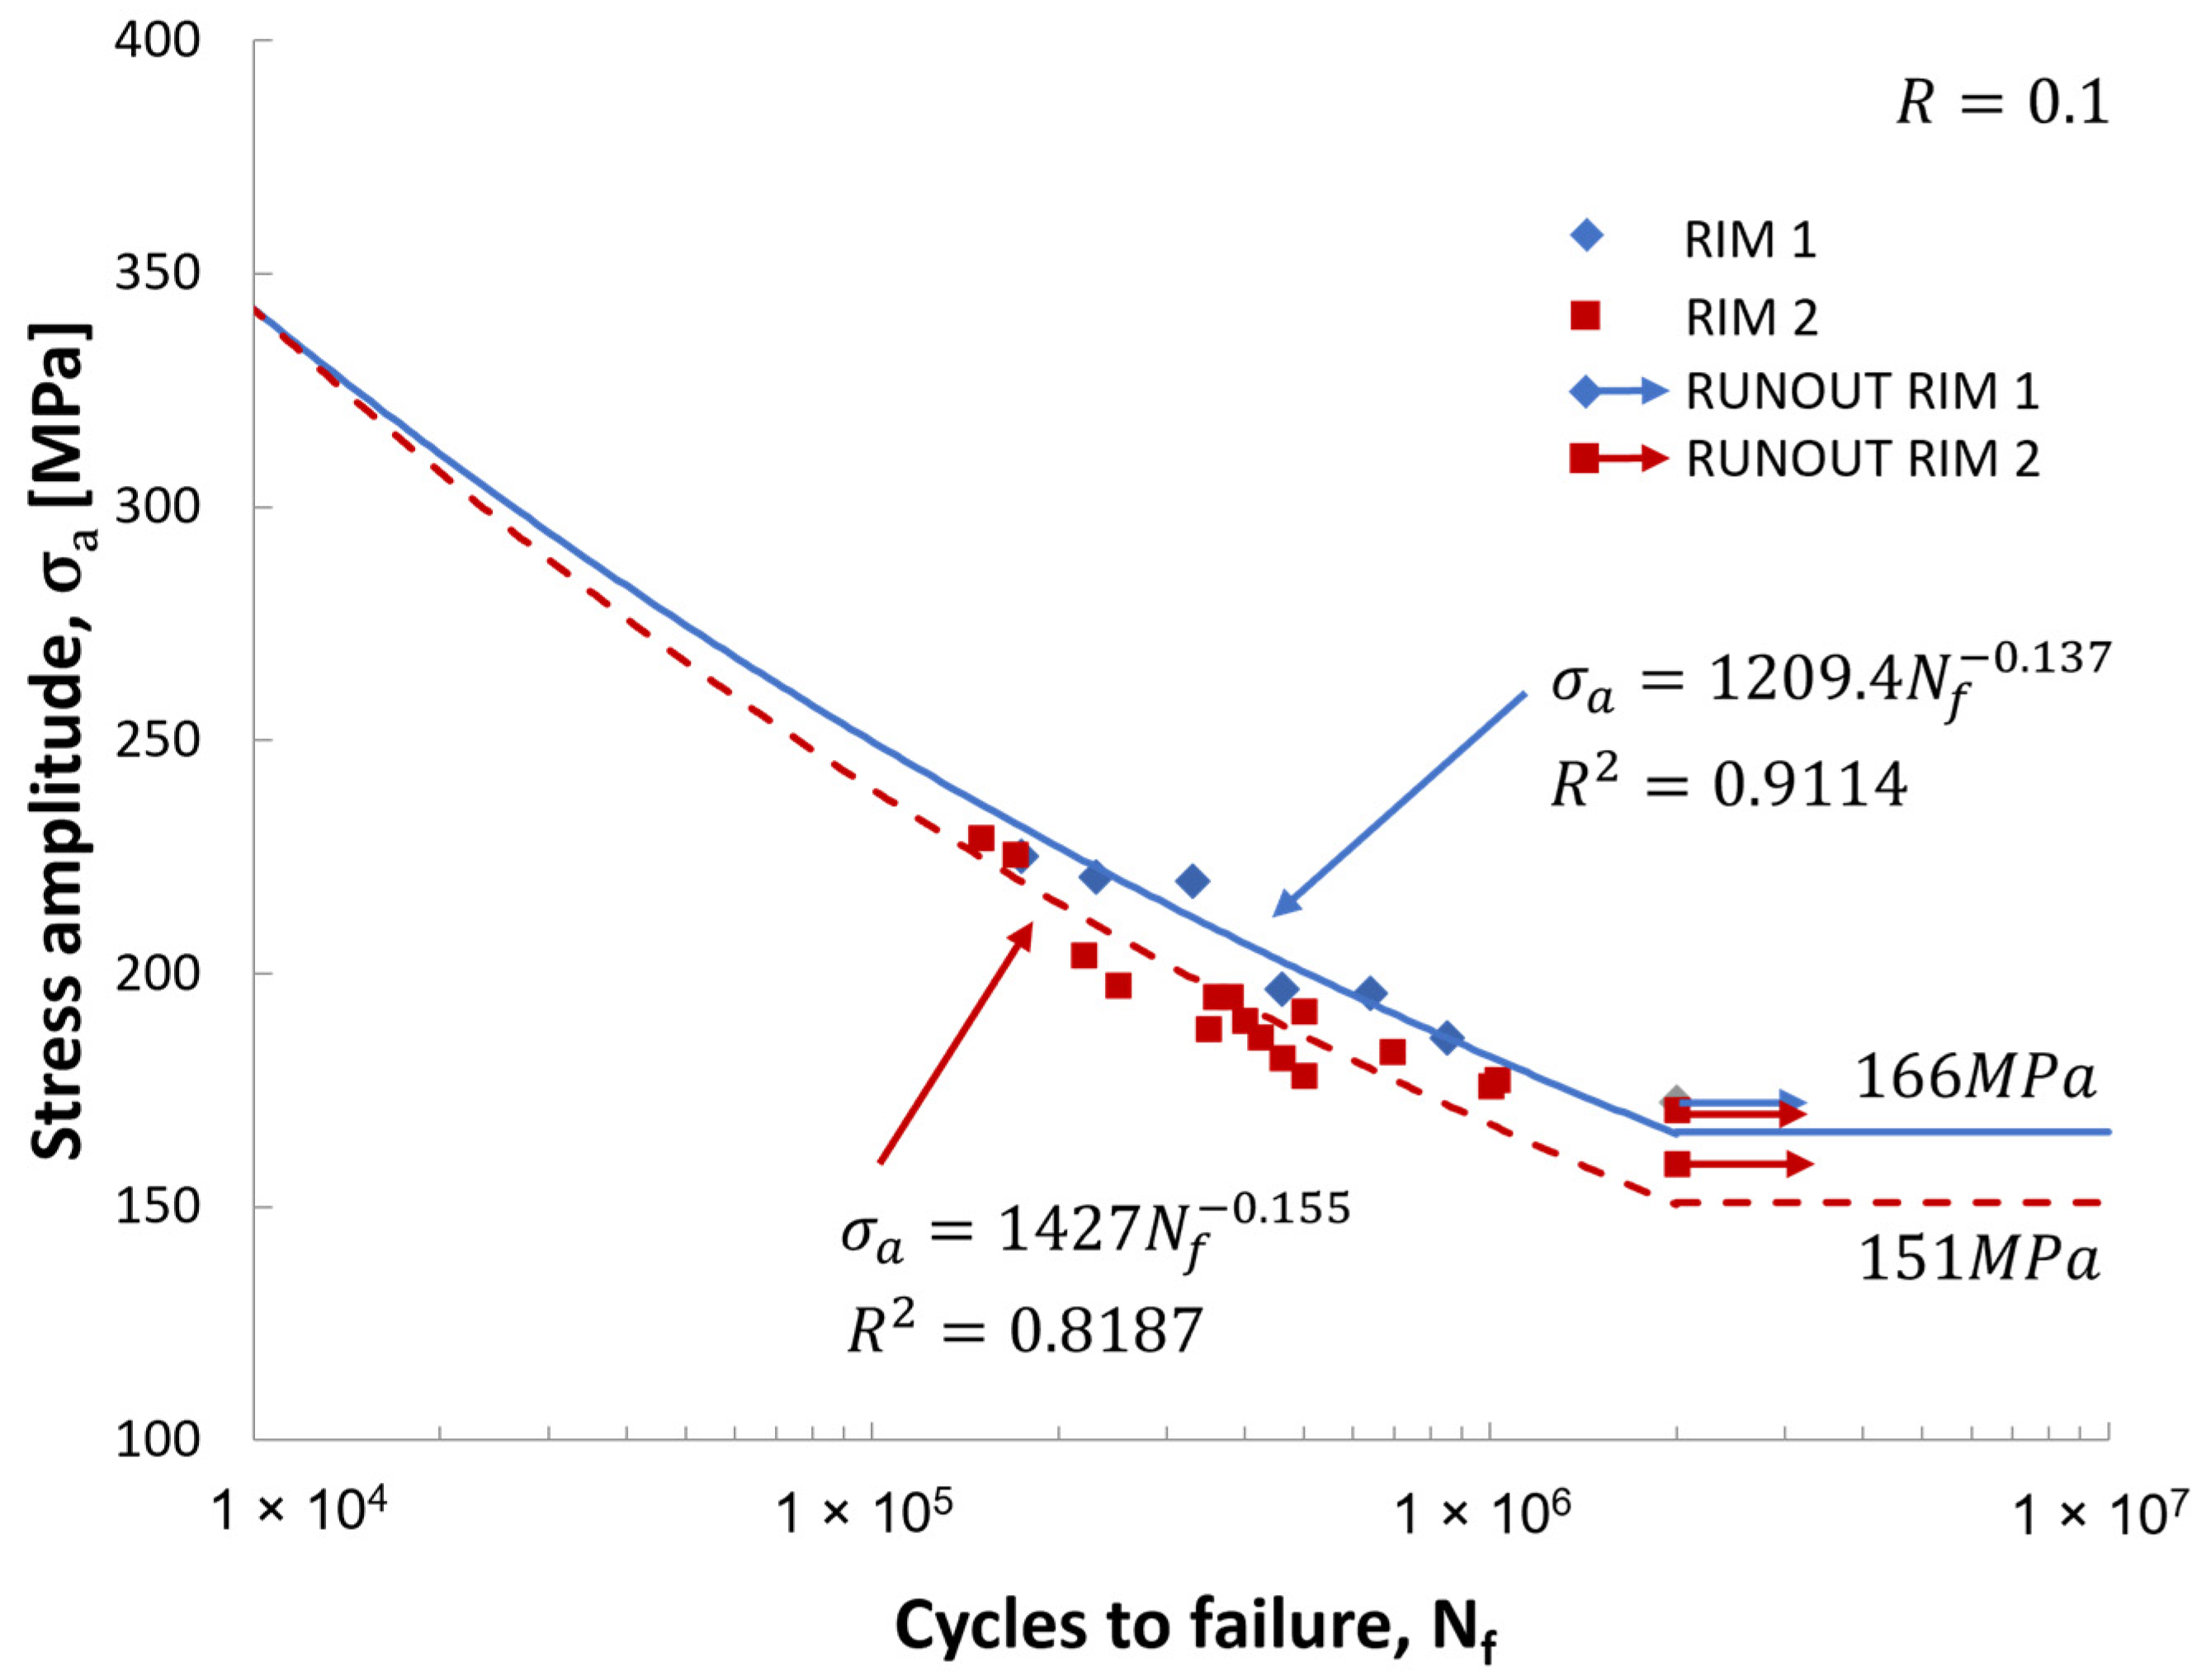
The correlation factor of the finite life part of the S-N curve is R2 = 0.73, thus indicating a certain scatter of the data. For that reason, the same analysis of the fatigue data was then repeated, considering the specimens from Rim 1 and Rim 2 separately. The comparison is shown in Figure 16. In general, the fatigue life results are better for Rim 1 than for Rim 2. The recalculated fatigue strength at runout is σ a f , R I M 1 = 166 MPa for Rim 1 and σ a f , R I M 2 = 151 MPa for Rim 2. It must be noted that the number of specimens used from Rim 1 was limited to seven, therefore these data allow just for preliminary and exploratory research, according to ASTM E739-23 [25]. However, this trend was quite clear during the development of the tests and may indicate that the rolling process parameters changed between the manufacturing of Rim 1 and Rim 2. Just a few seconds difference in the rolling time of the components could locally induce a change in the characteristics of the material. That aspect needs to be confirmed by further investigation as a future development of this study.

3.2. Comparison of the Fatigue Test Results between Rim Section Testing and Base Material Testing

The importance of reliable material fatigue properties is discussed in Section 1. When fatigue data of actual components are not available, or cannot be obtained through standard tests, designers usually refer to fatigue data available from the technical literature or alternative sources. Many sets of data can be found, but attention must be paid to the correlation between their test conditions and the conditions of the components in service. For example, there could be substantial differences regarding the kind of load (e.g., full traction versus bending), the load or stress ratio R, and the material surface conditions, which can heavily be changed by the production process. Although empirical relationships may be used to account for some of these aspects, sometimes they are just indicative or refer to specific cases.
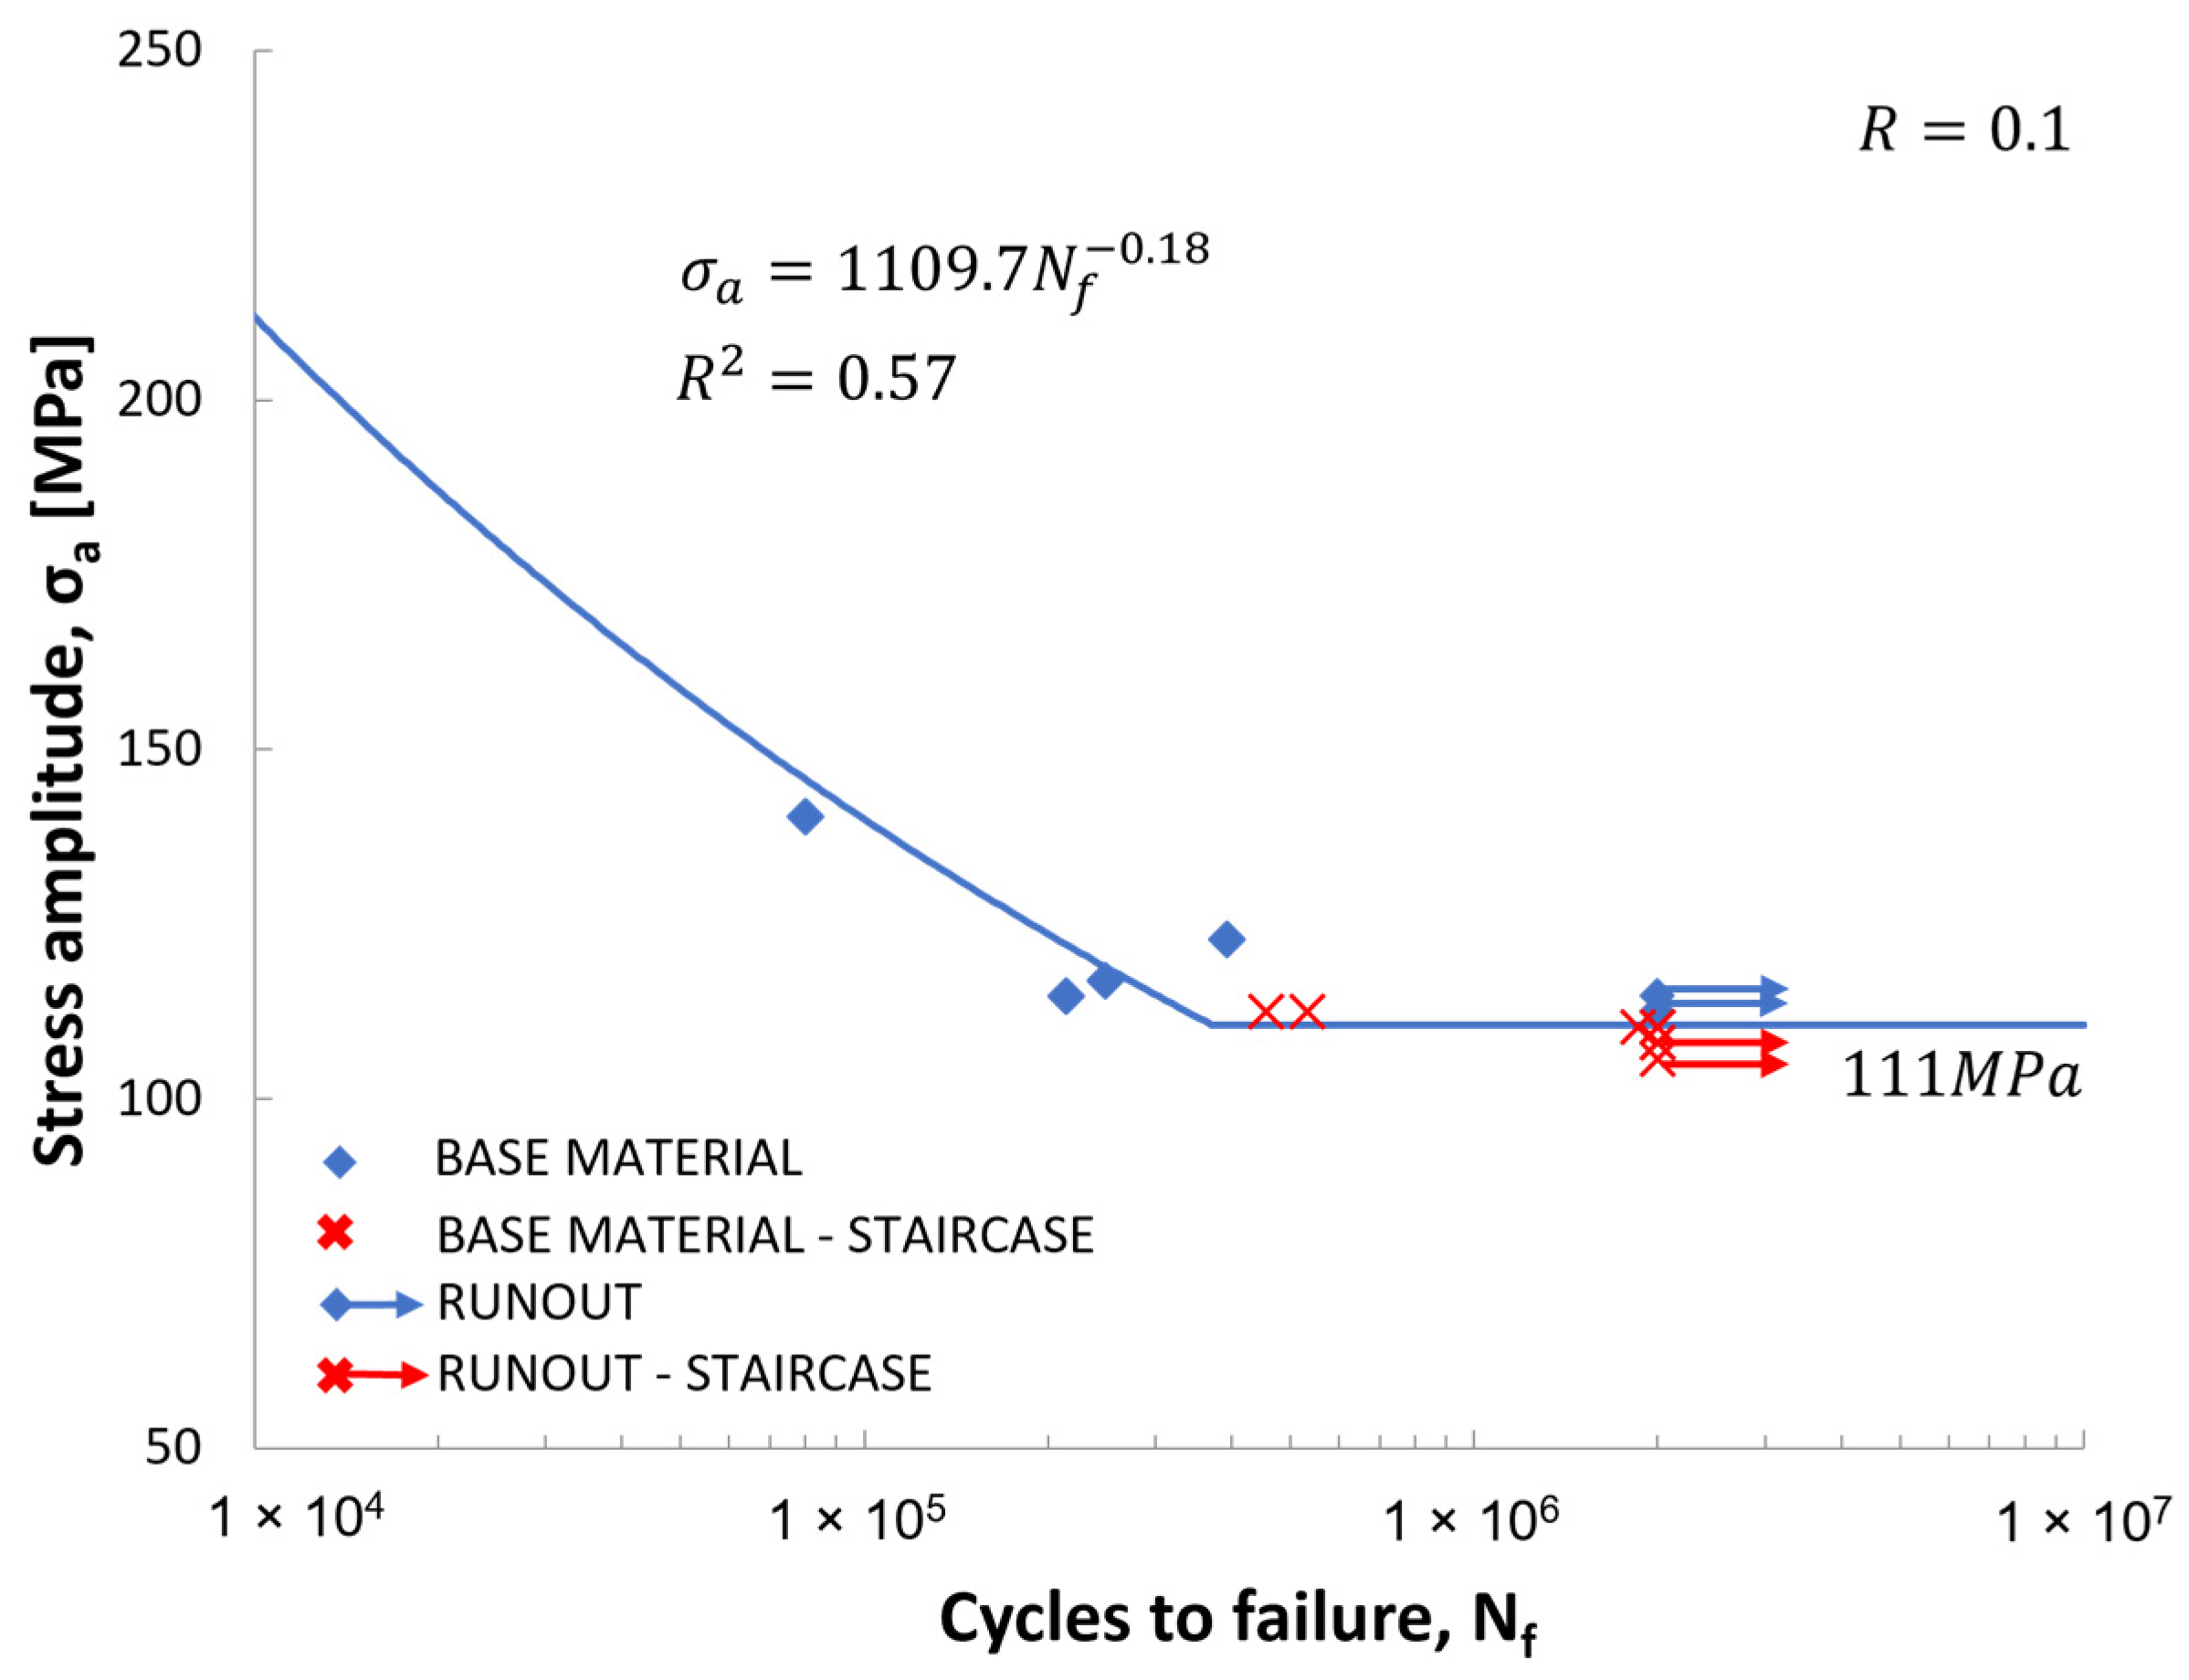
To investigate further this topic, standard fatigue tests were run on the base material of the rim, with the test setup and the specimen geometry presented in Section 2.2.3 and Section 2.2.4. Fourteen hourglass specimens were obtained from a strip of the material before the rim production process. They were oriented in the transverse direction of the strip (T), which is the direction of the maximum principal stress both in actual rim service condition and in rim section fatigue testing. Given the possibility of using a high-frequency test machine, special attention was paid to the fatigue strength at 2 × 10⁶ cycles, which was investigated by a methodology based on the staircase method (UNI 3964 and JSME standard [26]). Six specimens were available, in this preliminary analysis, for the finite life region of the S-N curve, which should only be considered as approximate. As a failure criterion, the complete break of the specimen in two parts was assumed.
The test results are shown in Figure 17. For clarity, a detail related only to the staircase results is shown in Figure 18. The fatigue strength at 2 × 10⁶ cycles, for the axial testing of the base material, is σ a f = 111 MPa. Therefore, the ratio between the fatigue strength of rim sections bending tests and the one from axial tests of the base material is between 1.36 and 1.5 if we consider Rim 1 and Rim 2 separately. Being equal the cross-section and the material, the higher fatigue strength of specimens subjected to plane bending, compared to full axial traction, is well known in technical literature. This is due to the different volume of material subjected to the maximum stress, in relation to the load condition. Although empirical coefficients are available to convert the results, in actual tests they may change, depending on the material type or the specimen geometry. For example, in [27] three different steels were tested, showing a ratio of the fatigue limit ranging from 1.11 to 1.23 between plane bending and full traction of smooth cylindrical specimens.
It is not the aim of this study to propose a more correct correlation coefficient between bending and axial fatigue tests for steel DD11. However, the comparison made in this section highlights, once again, the importance of considering the material fatigue properties in conditions as near as possible to those of the final components in actual field use.

3.3. Residual Stress Measurement

The influence of the production process on the fatigue behavior of structural components is very important, even if it is not always considered properly. This is one of the main issues in fatigue life estimations based on data resulting from standard fatigue tests of specimens obtained from the base material. Both possible strain hardening, due to local plastic deformation, and residual stresses are neglected in that case. This illustrates the importance of testing the finished components whenever possible.
The section test approach certainly considers the effect of local plastic deformations and the finished state of the component surface. It is questionable, instead, to what extent possible residual stresses change during the preparation of the specimens. A stress release can be expected along the circumferential direction of the rim, where the cutting operation removes material constraints at the boundary of the sections. However, some doubts exist about the behavior along the rim axial direction, which is the principal stress direction during fatigue testing.
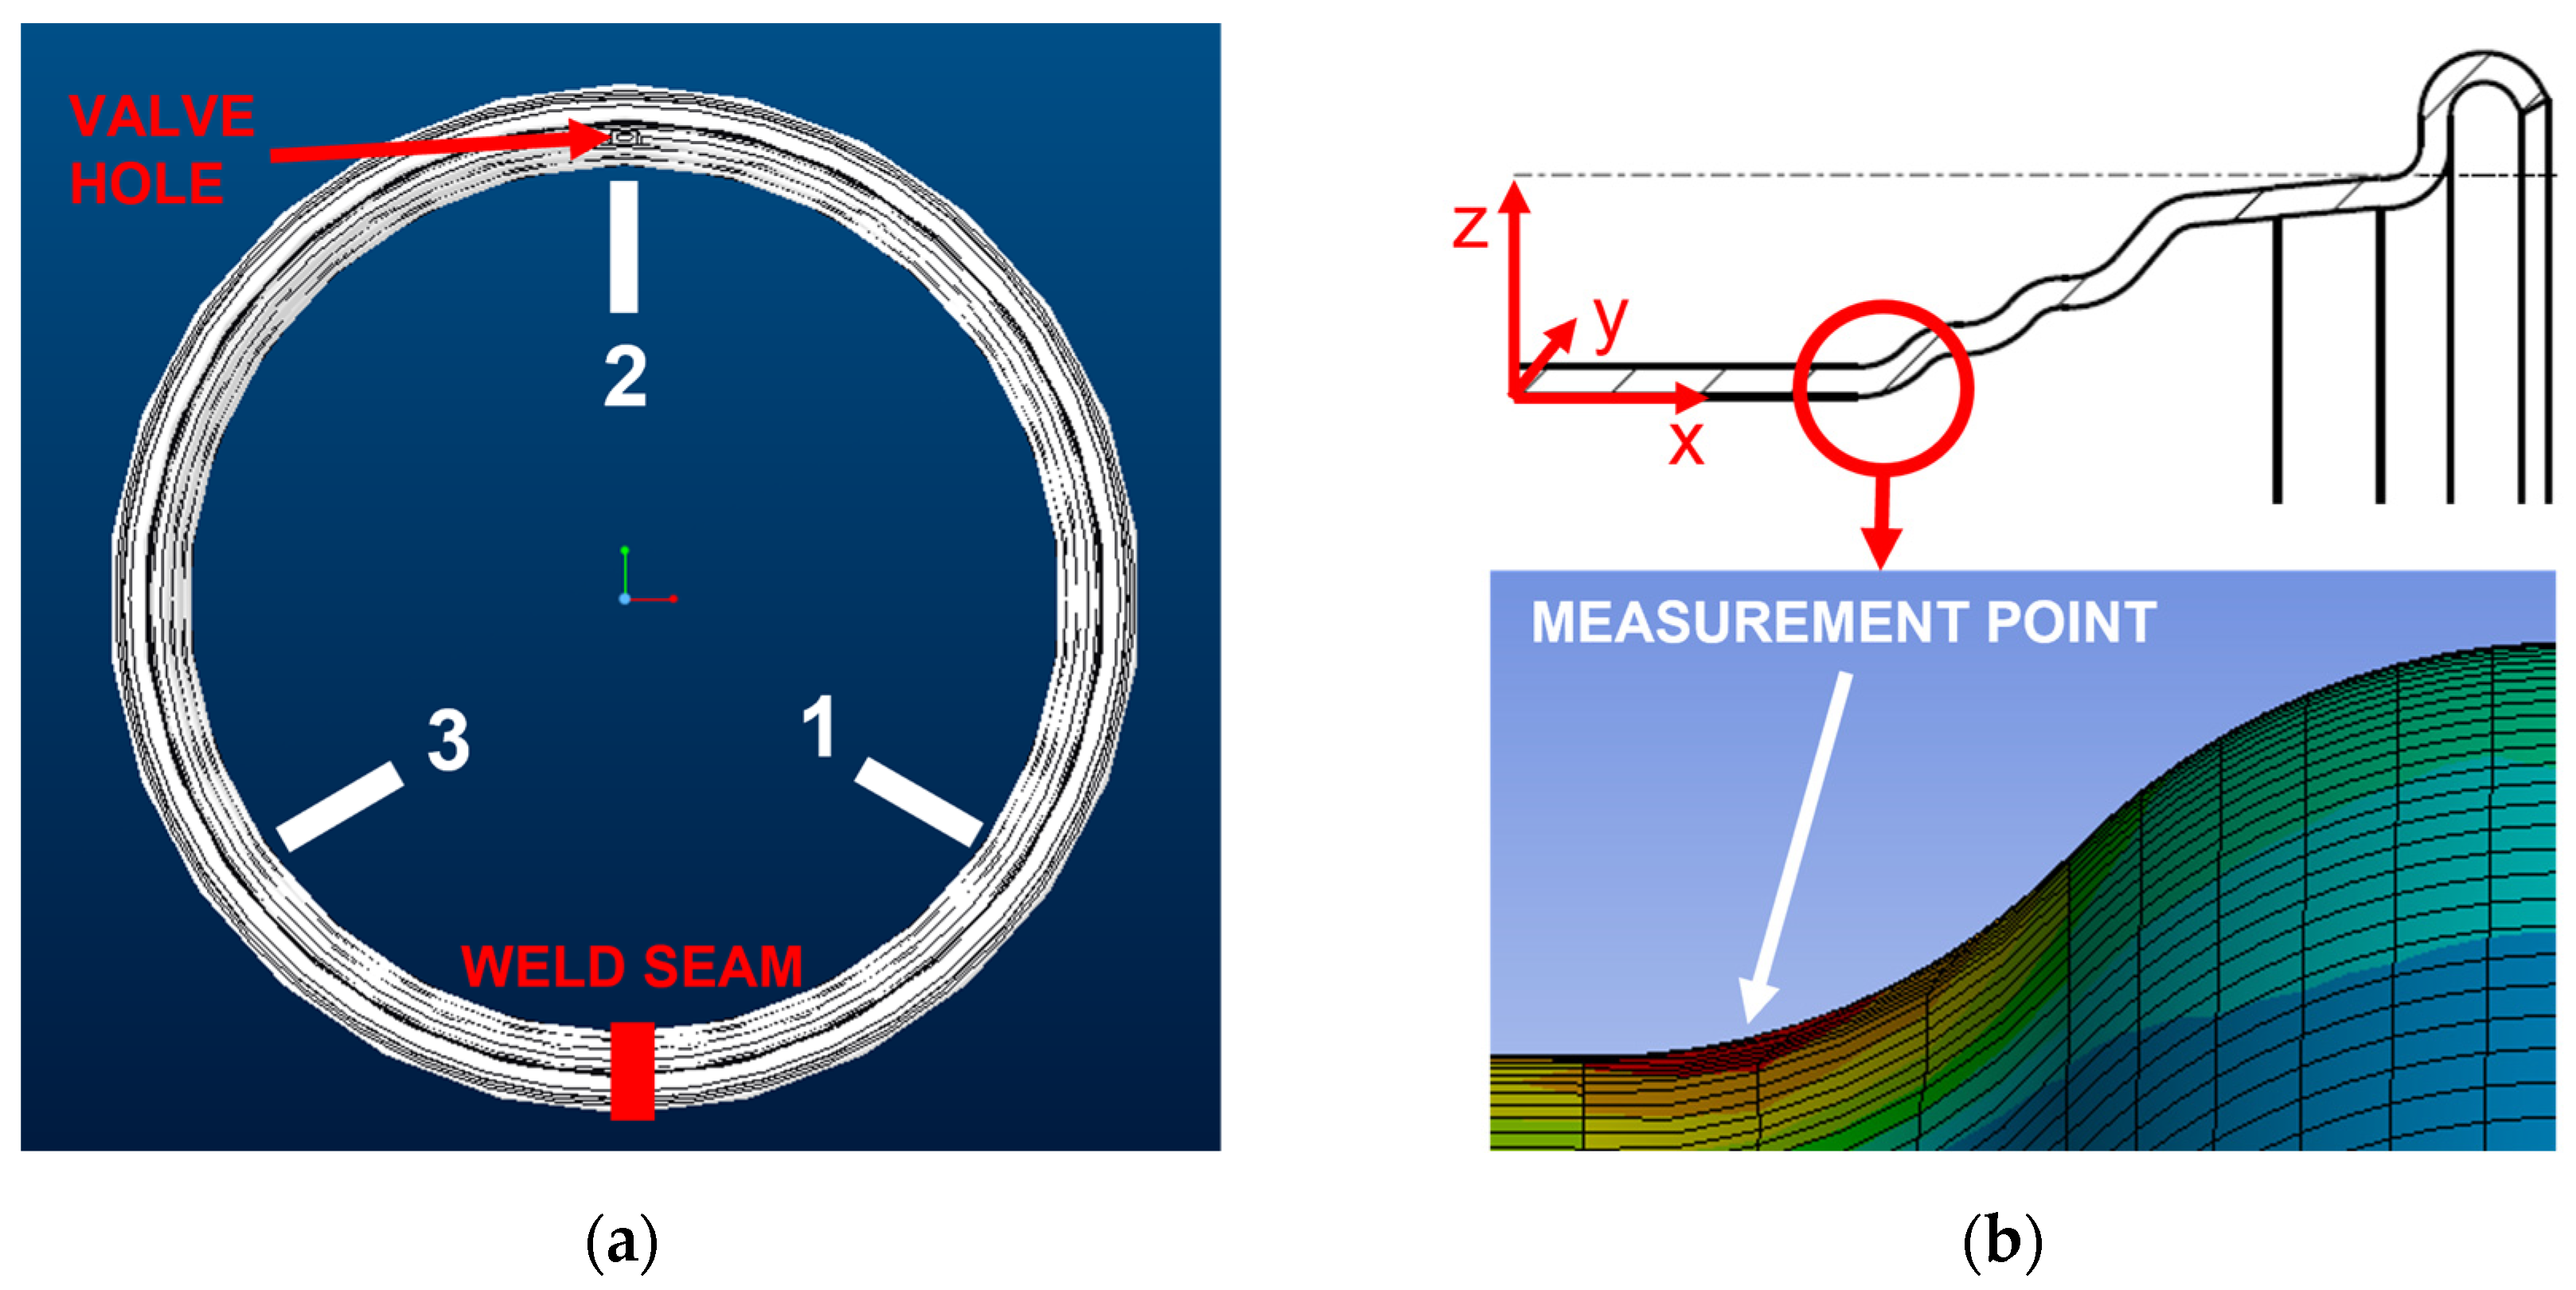
To clarify this aspect, first, residual stress measurements were made on six points of a new rim in the same manufacturing conditions as the ones previously tested. Following that, the same points were measured again on rim section specimens obtained from that rim.
A scheme representing the location of the measurement points on the complete rim is shown in Figure 19. The points are located approximately 120° from each other along the rim circumference, on both sides of the rim.
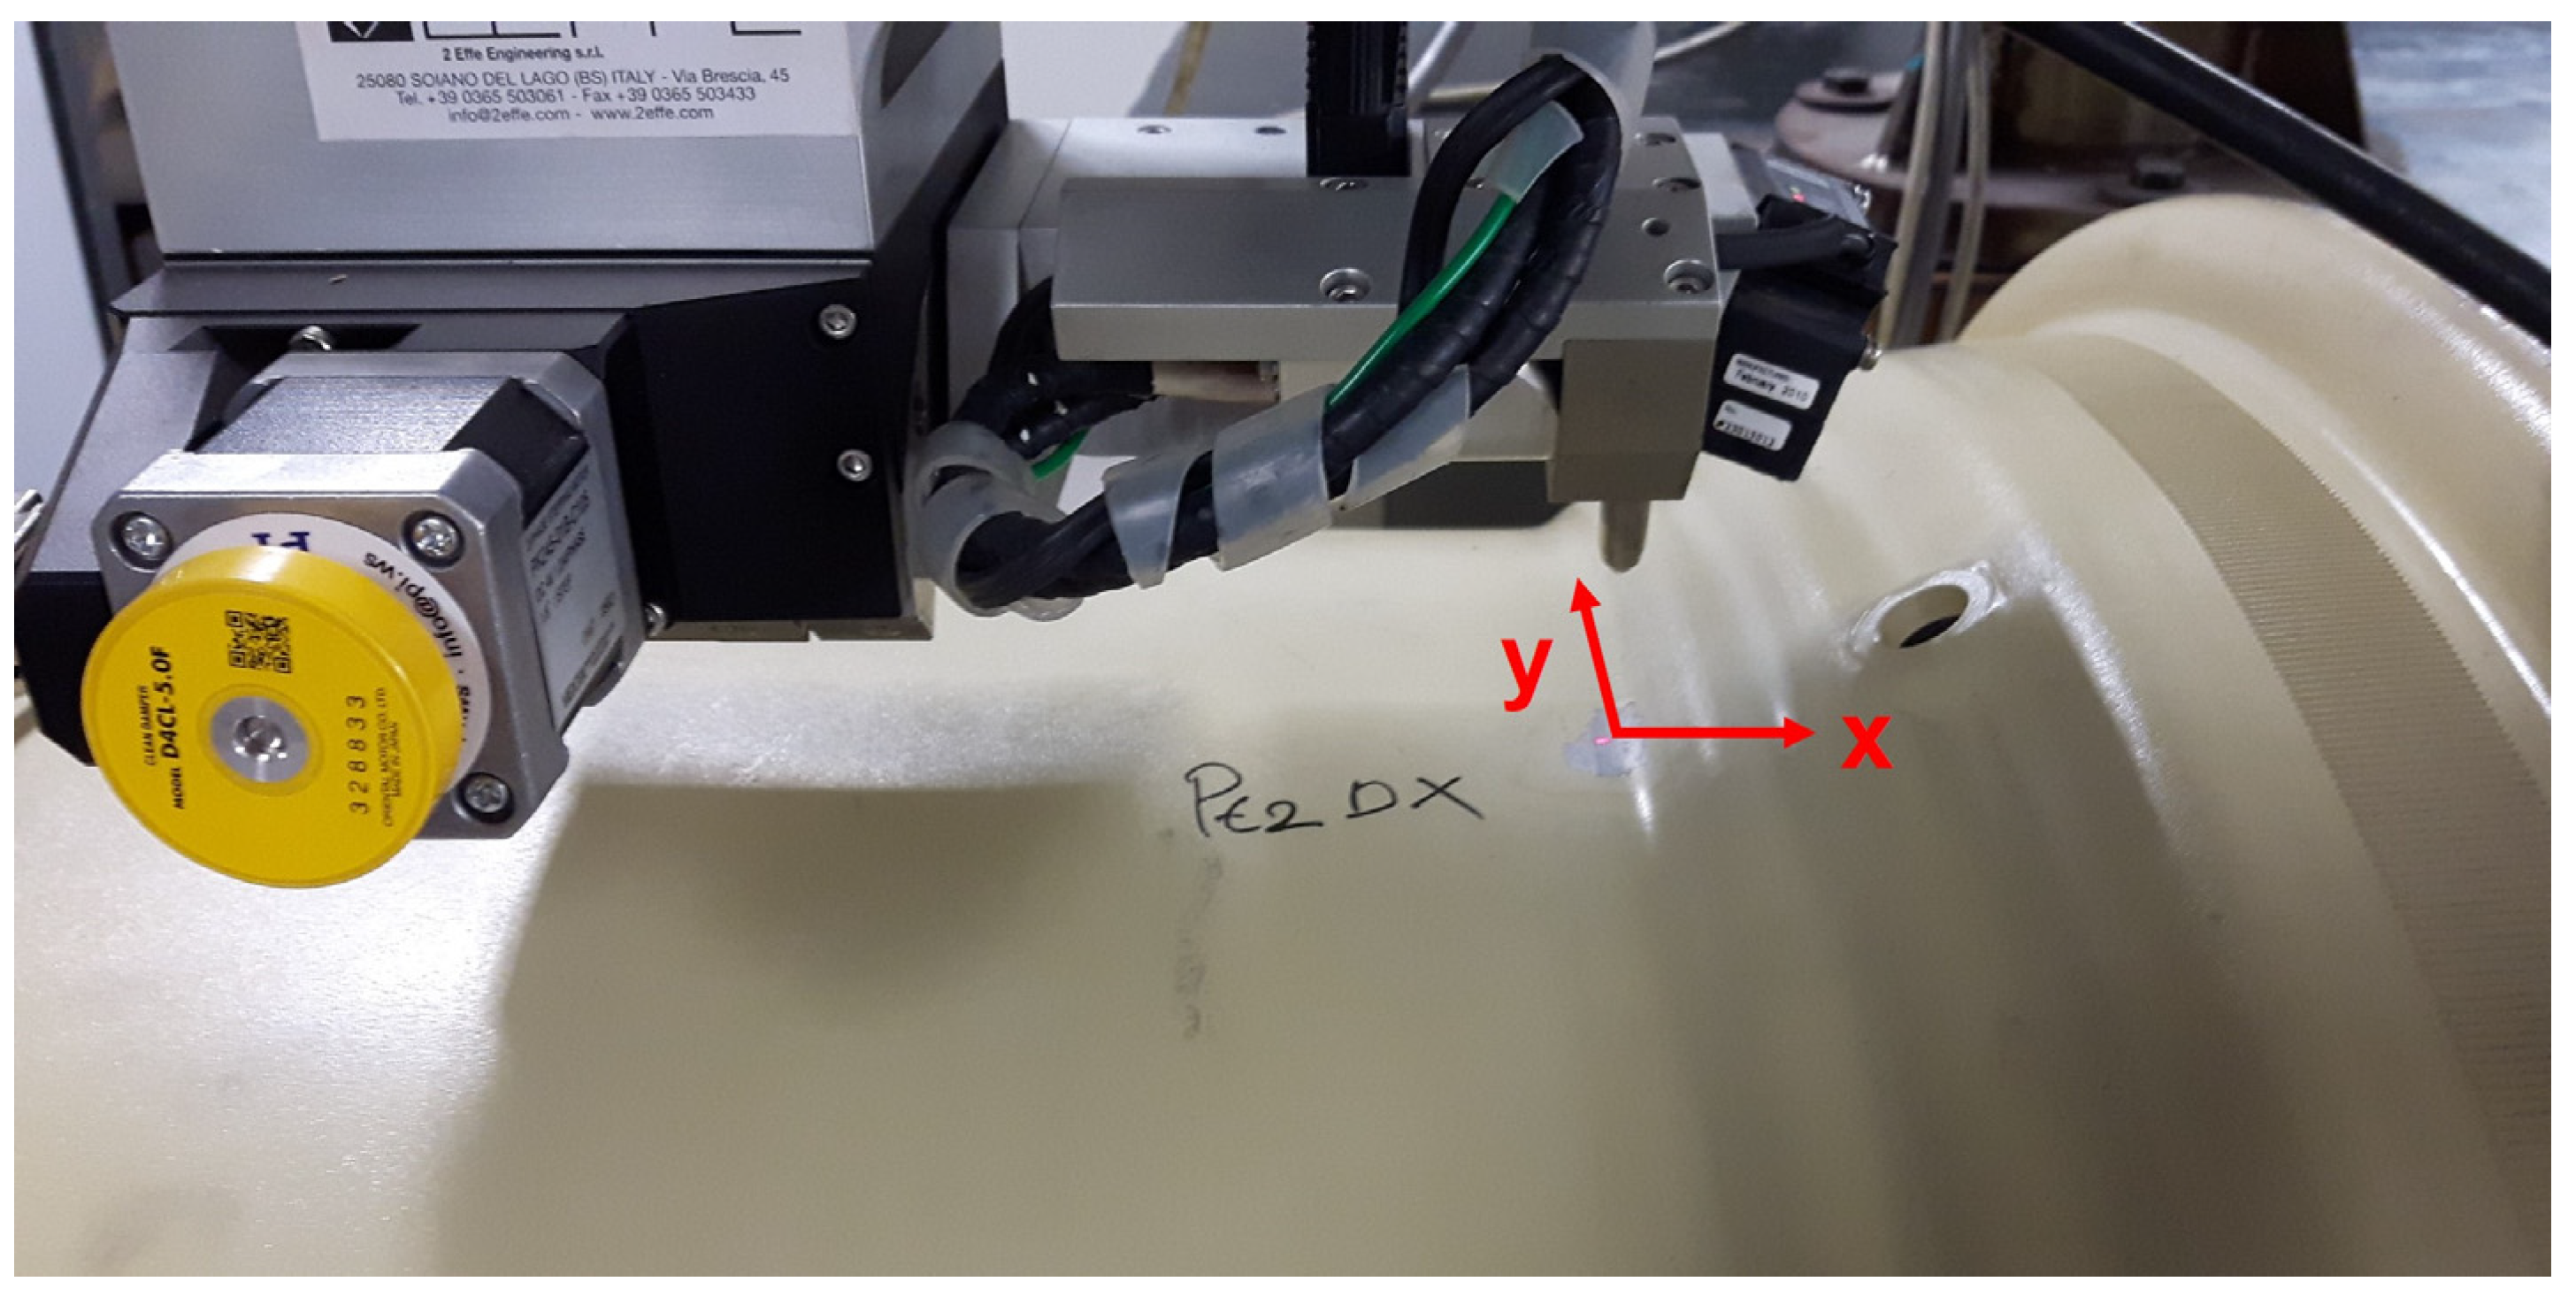
The residual stresses were measured using X-ray diffraction. This is one of the most used non-destructive techniques [28,29], which allows for repeating the measurement in the same point without affecting the local properties of the material. This was fundamental to verify the residual stresses of the specimens after the cutting operation of the original rim.
The residual stresses were measured along two directions, as shown in Figure 20:
  • The rim axial direction, named as x;
  • The rim circumferential direction, named as y.
As already underlined, the rim axial direction (x) is the most important one. In fact, it is the principal direction of the stress acting in that specific rim radius both in service and fatigue testing conditions. This is proven by the crack development paths experienced in field use on similar components [14], which are perpendicular to that direction.
The value of the residual stresses for the complete rim and for the rim section specimens are shown, respectively, in Table 3 and Table 4.
Analyzing the results of Table 3, it is interesting to notice how the residual stress along the axial direction is mainly compressive, with maximum values up to −96 MPa in point 1B and −158 MPa in point 2A. It is known that compressive residual stresses are usually beneficial to the fatigue life of the components, and, for that reason, they are sometimes induced on purpose [30]. Therefore, an overall state of compressive residual stress along the axial direction may lead to better fatigue life results of the rim in service, if compared to the fatigue data of the base material. However, point 3 shows a slight tensile stress along the same direction. This aspect needs further investigations into the production process, especially in relation to the rim rolling stage, to assess the uniformity and repeatability of its effect on the material properties.
The residual stress state along the circumferential direction is mainly tensile. However, the stress induced on rims by standard loads in service is very low in that direction, if compared to the axial one, whose effect is predominant for the durability of the component. For example, in [14], the stress range, Δε, along the circumferential direction was three times lower than the axial one, with also compressive average values due to the effect of tyre pressure. That is the reason why, as a first step, this research focused on the stress along the rim axial direction.
The measurements of the rim section specimens in Table 4, instead, show a complete relaxation of the compressive residual stress along the axial direction. Therefore, the section test approach seems not appropriate to consider that aspect, as regards this case study. However, the same approach could be used in experiments to assess the relaxation of residual stresses under different fatigue loads, which is a phenomenon that has been under investigation for many years [31,32,33,34,35,36]. In fact, it has been proven that compressive residual stresses are present in rims after the production process, as suggested by the results of Table 3, and it would be interesting to verify whether, and to what extent, they relax in service conditions. However, planning a series of traditional dynamic radial fatigue tests would be very difficult and time-consuming for the industry standard. A more effective solution might be represented by the rim section fatigue testing, with different loads and duration applied to specimens with compressive residual stresses previously induced by proper process such as, for example, shot peening.

3.4. Surface Hardness Measurement

Surface hardness measurements were made on the rim section specimens of Section 3.1 to assess if the plastic deformation induced by the rolling process contributed to the improvement of the material fatigue properties due to strain-hardening effects. It must be noted that the fatigue results of the base material, discussed in Section 3.2, are mainly related to its elastic properties, since the stress levels used were below the yield strength of Table 2. Also, the fatigue results of rim section testing are all located in the high-cycle fatigue region, which is usually considered for life longer than 105 cycles. Here, the material elastic properties prevail. Therefore, the linear elastic model was used to convert the initial strain values recorded by the strain gauge to the corresponding stress levels, as a valid approximation solution. The results indicated an improvement of the mechanical characteristics of the material after the production process, as already discussed by other authors. For example, in [8,23], a similar low-carbon steel was proven to show better fatigue properties after plastic deformation, comparable to the ones of 30% cold work sheet metals subjected to conventional fully reversed bending. For those 30% cold work specimens, both the tensile strength and the yield strength were highly increased if compared to the base material. In that case, the total deformation of the zone tested was higher than the case study presented in this paper due to a different geometry of the rim.
If noticeable plasticity phenomena were experienced using the fatigue testing approach proposed in this study, more extensive constitutive models of the material should be considered and analyzed [37].
The surface hardness values of the rim section specimens are shown in Table 5. Hardness was measured according to Rockwell B scale (HRB) on four different specimens: two specimens from Rim 1 and two specimens from Rim 2. They are referred to as A, B (Rim 1) and C, D (Rim 2). For each specimen, two different zones were measured:
  • Zone 1: at minimum 3 cm-distance from the radius, along the axial direction. Here the deformation is negligible. This zone is named as “flat”, henceforth;
  • Zone 2: the radius under investigation, where plastic deformation is present.
Values of Table 5 are averaged from three different measurements for each zone, with negligible scattering.
In Table 6, the hardness values are converted to tensile strength (Rm), according to the conversion table from ASTM A370 [38] for non-austenitic steels. These values must be assumed just as an approximation, because, currently, there is no general method of accurately converting the hardness numbers determined on one scale to tensile strength values.
Considering that approximation, the values measured in the flat area of the specimens are in line with the tensile strength of the base material of Table 2, which is 391 MPa. In the radius zone the hardness tends to increase, with slightly higher converted values of tensile strength. That is an indication of improved local material characteristics and confirms the importance of testing structural components as near as possible to their final condition. This is one of the main purposes for which the section test approach was developed.
Another interesting aspect that can be noticed from Table 6 is that, on average, the converted values of tensile strength in the radius of specimens from Rim 1 are higher than those from Rim 2. That could also explain the fatigue test results of Figure 16, where Rim 1 showed slightly better results.

4. Conclusions

The section test approach for the fatigue life evaluation of structural components was applied to wheel rims for off-highway applications. Additional aspects related to the production process of the component were also considered. The following conclusions can be drawn:
  • The rim section test approach was confirmed to be a valid approach which can be used in fatigue testing when standard dynamic radial tests on the complete wheel are not feasible. Customized specimen geometry was studied by FEA and specimens were subjected to bending fatigue tests. The target of creating a S-N curve for the component in the most critical area was achieved. Specimens from two different rims showed slightly different fatigue strength at 2 × 10⁶ cycles. As a result, further investigations are planned to improve the knowledge about the influence of the production process parameters on the fatigue properties of this component;
  • Bending test results of rim section specimens were compared to traction test results of hourglass specimens obtained from the base material. The comparison was made to consider the shortcomings that can be derived from the improper use of standard fatigue data from the technical literature. The results show a ratio between 1.36 and 1.5 between the fatigue strength of rim section specimens and the hourglass specimens from the base material. This is due not only to the different load condition but also to the effects of the production process on the final surface condition of the material. Therefore, the section test approach seems more appropriate to consider the local geometry of the component and its surface condition;
  • The residual stress state of the component after the production process was investigated, both on the complete rim and on section specimens obtained from the same rim. The results show the presence of mainly compressive residual stresses along the axial direction for the complete rim. They should be beneficial for the fatigue strength of the component in service conditions. However, the compressive residual stresses were released after the manufacturing of the rim section specimens. Therefore, it seems that this aspect is not considered properly by the section test approach;
  • Surface hardness was measured on four specimens to assess the effect of the local plastic deformation on the material properties. The results show a slight increase of the hardness in the radius, where plastic deformation occurs, leading to increased material strength in that area. This was confirmed by the fatigue test results of Section 3.1. Also, on average, the results are better for specimens from Rim 1, which, in fact, had better fatigue life results. More extensive hardness measurements are planned to investigate this aspect further;
  • The section test approach, here investigated to compensate the shortcomings of standard fatigue testing for off-highway wheels, could also be tailored to different components subjected to fatigue in service.
As a future development of this research, the rim section test approach should be applied to a specific case where the fatigue failure of the complete wheel is easily achievable through standard fatigue tests. The related fatigue data should be compared to those resulting from the section test approach, to verify if a scale factor exists, due to the highest probability of encountering microstructural defects in the biggest volume of the rim subjected to the maximum stress.

Author Contributions

Conceptualization, L.S. and A.M.; methodology, L.S. and A.M.; validation, L.S. and A.M.; investigation, L.S. and A.M.; data curation, L.S. and A.M.; writing—original draft preparation, L.S. and A.M.; writing—review and editing, L.S.; visualization, L.S. and A.M. All authors have read and agreed to the published version of the manuscript.

Funding

This research received no external funding.

Institutional Review Board Statement

Not applicable.

Informed Consent Statement

Not applicable.

Data Availability Statement

Data are contained within the article.

Acknowledgments

The authors would like to thank: Gianpietro Bramè, of the company moveero, for the information provided during the development of this study; Gianpaolo Marconi and Daniele Maestrini, of the company 2 Effe Engineering, for the residual stress measurements of the components.

Conflicts of Interest

The authors declare no conflict of interest.

References

  1. Solazzi, L. Wheel rims for industrial vehicles: Comparative experimental analyses. Int. J. Heavy Veh. Syst. 2011, 18, 214–225. [Google Scholar] [CrossRef]
  2. EUWA. Association of European Wheel Manufacturers. 2023. Available online: https://www.euwa.org (accessed on 8 November 2022).
  3. SAE International. Society of Automotive Engineers. 2023. Available online: https://www.sae.org (accessed on 8 November 2022).
  4. Solazzi, L.; Mazzoni, A.; Cima, M. Development of an innovative test machine for tyre, wheel and suspension systems for automotive and industrial vehicles. UPjeng 2023, 9, 102–120. [Google Scholar] [CrossRef]
  5. Kocabicak, U.; Firat, M. Numerical analysis of wheel cornering fatigue tests. Eng. Fail. Anal. 2001, 8, 339–354. [Google Scholar] [CrossRef]
  6. Grubisic, V.; Fischer, G. Automotive Wheels, Method and Procedure for Optimal Design and Testing; SAE Technical Paper 830135; SAE International: Warrendale, PA, USA, 1983. [Google Scholar] [CrossRef]
  7. Wheel Standards Committee. Biaxial Wheel Fatigue Test; SAE International: Warrendale, PA, USA, 2016. [Google Scholar] [CrossRef]
  8. Kinstler, J. The Science and Methodology of SAE Wheel Fatigue Test Specifications. SAE Trans. 2005, 114, 816–826. [Google Scholar]
  9. Firat, M.; Kozan, R.; Ozsoy, M.; Mete, O.H. Numerical modeling and simulation of wheel radial fatigue tests. Eng. Fail. Anal. 2009, 16, 1533–1541. [Google Scholar] [CrossRef]
  10. Cheng, L.; Nianzu, R.; Qingsong, Y.; Chao, C.; Cheng, T.; Zhengguo, L. Stress State Measurement and Result Analysis of Car Wheels. IOP Conf. Ser. Mater. Sci. Eng 2020, 784, 012021. [Google Scholar] [CrossRef]
  11. Topaç, M.M.; Ercan, S.; Kuralay, N.S. Fatigue life prediction of a heavy vehicle steel wheel under radial loads by using finite element analysis. Eng. Fail. Anal. 2012, 20, 67–79. [Google Scholar] [CrossRef]
  12. Loi, C.Y.; Choy, H.Y. Modelling and Fatigue Analysis of Automobile Wheel Rim. In Proceedings of the 2019 5th International Conference on Control, Automation and Robotics (ICCAR), Beijing, China, 19–22 April 2019; pp. 696–701. [Google Scholar] [CrossRef]
  13. Sonsino, C.M.; Breitenberger, M.; Krause, I.; Pötter, K.; Schröder, S.; Jürgens, K. Required Fatigue Strength (RFS) for evaluating of spectrum loaded components by the example of cast-aluminium passenger car wheels. Int. J. Fatigue 2021, 145, 105975. [Google Scholar] [CrossRef]
  14. Mazzoni, A.; Solazzi, L. Experimental field test on a multipiece steel wheel and influence of the material properties on its fatigue life evaluation. Eng. Fail. Anal. 2022, 135, 106106. [Google Scholar] [CrossRef]
  15. Cima, M.; Solazzi, L. Experimental and analytical study of random fatigue, in time and frequencies domain, on an industrial wheel. Eng. Fail. Anal. 2021, 120, 105029. [Google Scholar] [CrossRef]
  16. Marques, J.M.E.; Solazzi, L.; Benasciutti, D. Fatigue Analysis of Nonstationary Random Loadings Measured in an Industrial Vehicle Wheel: Uncertainty of Fatigue Damage. Metals 2022, 12, 616. [Google Scholar] [CrossRef]
  17. Das, B.; Paul, S.K.; Singh, A.; Arora, K.S.; Shome, M. The effect of thickness variation and pre-strain on the cornering fatigue life prediction of a DP600 steel wheel disc. Int. J. Fatigue 2020, 139, 105799. [Google Scholar] [CrossRef]
  18. McGrath, P.J. An Investigation of Residual Stresses Induced by Forming Processes on the Fatigue Resistance of Automotive Wheels. Ph.D. Thesis, University of Plymouth, Plymouth, UK, 2001. [Google Scholar]
  19. McGrath, P.J.; Hattingh, D.G.; James, M.N.; Els-Botes, A. Effects of Forming Process on Fatigue Performance of Wheel Centre Disc. In Proceedings of the ECF13: European Conference on Fracture: Fracture Mechanics: Applications and Challenges, San Sebastian, Spain, 6–9 September 2000. [Google Scholar]
  20. Shang, D.; Liu, X.; Shan, Y.; Jiang, E. Research on the stamping residual stress of steel wheel disc and its effect on the fatigue life of wheel. Int. J. Fatigue 2016, 93, 173–183. [Google Scholar] [CrossRef]
  21. Jiang, Q.; Zhao, Z.; Xu, Z.; Sun, J.; Chen, X.; Su, B.; Zhao, Z.; Jiang, W. Effect of Residual Stresses on Wheel Fatigue Life and Experimental Validation. Machines 2022, 10, 924. [Google Scholar] [CrossRef]
  22. Solazzi, L. Applied Research for Weight Reduction of an Industrial Trailer. FME Trans. 2012, 40, 57–62. [Google Scholar]
  23. Wei, D.C. Rim Section Fatigue Results of Aluminum and Steel Wheels. SAE Trans. 1982, 91, 1296–1304. [Google Scholar]
  24. ISO 377:2017; Steel and Steel Products—Location and Preparation of Samples and Test Pieces for Mechanical Testing. International Organization for Standardization (ISO): Geneva, Switzerland, 2017.
  25. ASTM E739-23; Standard Guide for Statistical Analysis of Linear or Linearized Stress-Life (S-N) and Strain-Life (ε-N) Fatigue Data. American Society for Testing and Materials (ASTM): West Conshohocken, PA, USA, 2023.
  26. Nakazawa, H.; Kodama, S. Statistical S-N testing method with 14 specimens: JSME standard method for determination of S-N curves. Stat. Res. Fatigue Fract. 1987, 2, 59–69. [Google Scholar]
  27. Palin-Luc, T.; Lasserre, S. An energy based criterion for high cycle multiaxial fatigue. Eur. J. Mech.-A/Solids 1998, 17, 237–251. [Google Scholar] [CrossRef] [Green Version]
  28. Withers, P.J.; Bhadeshia, H.K.D.H. Residual stress. Part 1—Measurement techniques. Mater. Sci. Technol. 2001, 17, 355–365. [Google Scholar] [CrossRef]
  29. Withers, P.J.; Bhadeshia, H.K.D.H. Residual stress. Part 2—Nature and origins. Mater. Sci. Technol. 2001, 17, 366–375. [Google Scholar] [CrossRef]
  30. Donzella, G.; Pola, A.; Solazzi, L.; Marconi, G. Effect of shot peening on carburized surfaces. Int. J. Mater. Prod. Technol. 2000, 15, 17–130. [Google Scholar] [CrossRef]
  31. Morrow, J.; Ross, A.S.; Sinclair, G.M. Relaxation of Residual Stresses due to Fatigue Loading; SAE International: Warrendale, PA, USA, 1960; p. 600008. [Google Scholar] [CrossRef]
  32. Zhuang, W.Z.; Halford, G.R. Investigation of residual stress relaxation under cyclic load. Int. J. Fatigue 2001, 23, 31–37. [Google Scholar] [CrossRef]
  33. Capello, E.; Davoli, P.; Filippini, M.; Foletti, S. Relaxation of residual stresses induced by turning and shot peening on steels. J. Strain Anal. Eng. Des. 2004, 39, 285–290. [Google Scholar] [CrossRef]
  34. McCLUNG, R.C. A literature survey on the stability and significance of residual stresses during fatigue. Fatigue Fract. Eng. Mater. Struct. 2007, 30, 173–205. [Google Scholar] [CrossRef]
  35. De Giorgi, M. Residual stress evolution in cold-rolled steels. Int. J. Fatigue 2011, 33, 507–512. [Google Scholar] [CrossRef]
  36. Dattoma, V.; De Giorgi, M.; Nobile, R. An experimental study on residual stress relaxation in low-cycle fatigue of Inconel 718Plus. Fatigue Fract. Eng. Mater. Struct. 2023, 46, 310–324. [Google Scholar] [CrossRef]
  37. Goswami, M.; Goyal, S.; Kumar, A.; Harmain, G.A.; Albert, S.K. Effect of Triaxial State of Stress on Tensile Behavior of Modified 9Cr-1Mo Steel. J. Mater. Eng. Perform. 2020, 29, 1579–1588. [Google Scholar] [CrossRef]
  38. ASTM A370-22; Standard Test Methods and Definitions for Mechanical Testing of Steel Products. American Society for Testing and Materials (ASTM): West Conshohocken, PA, USA, 2022.
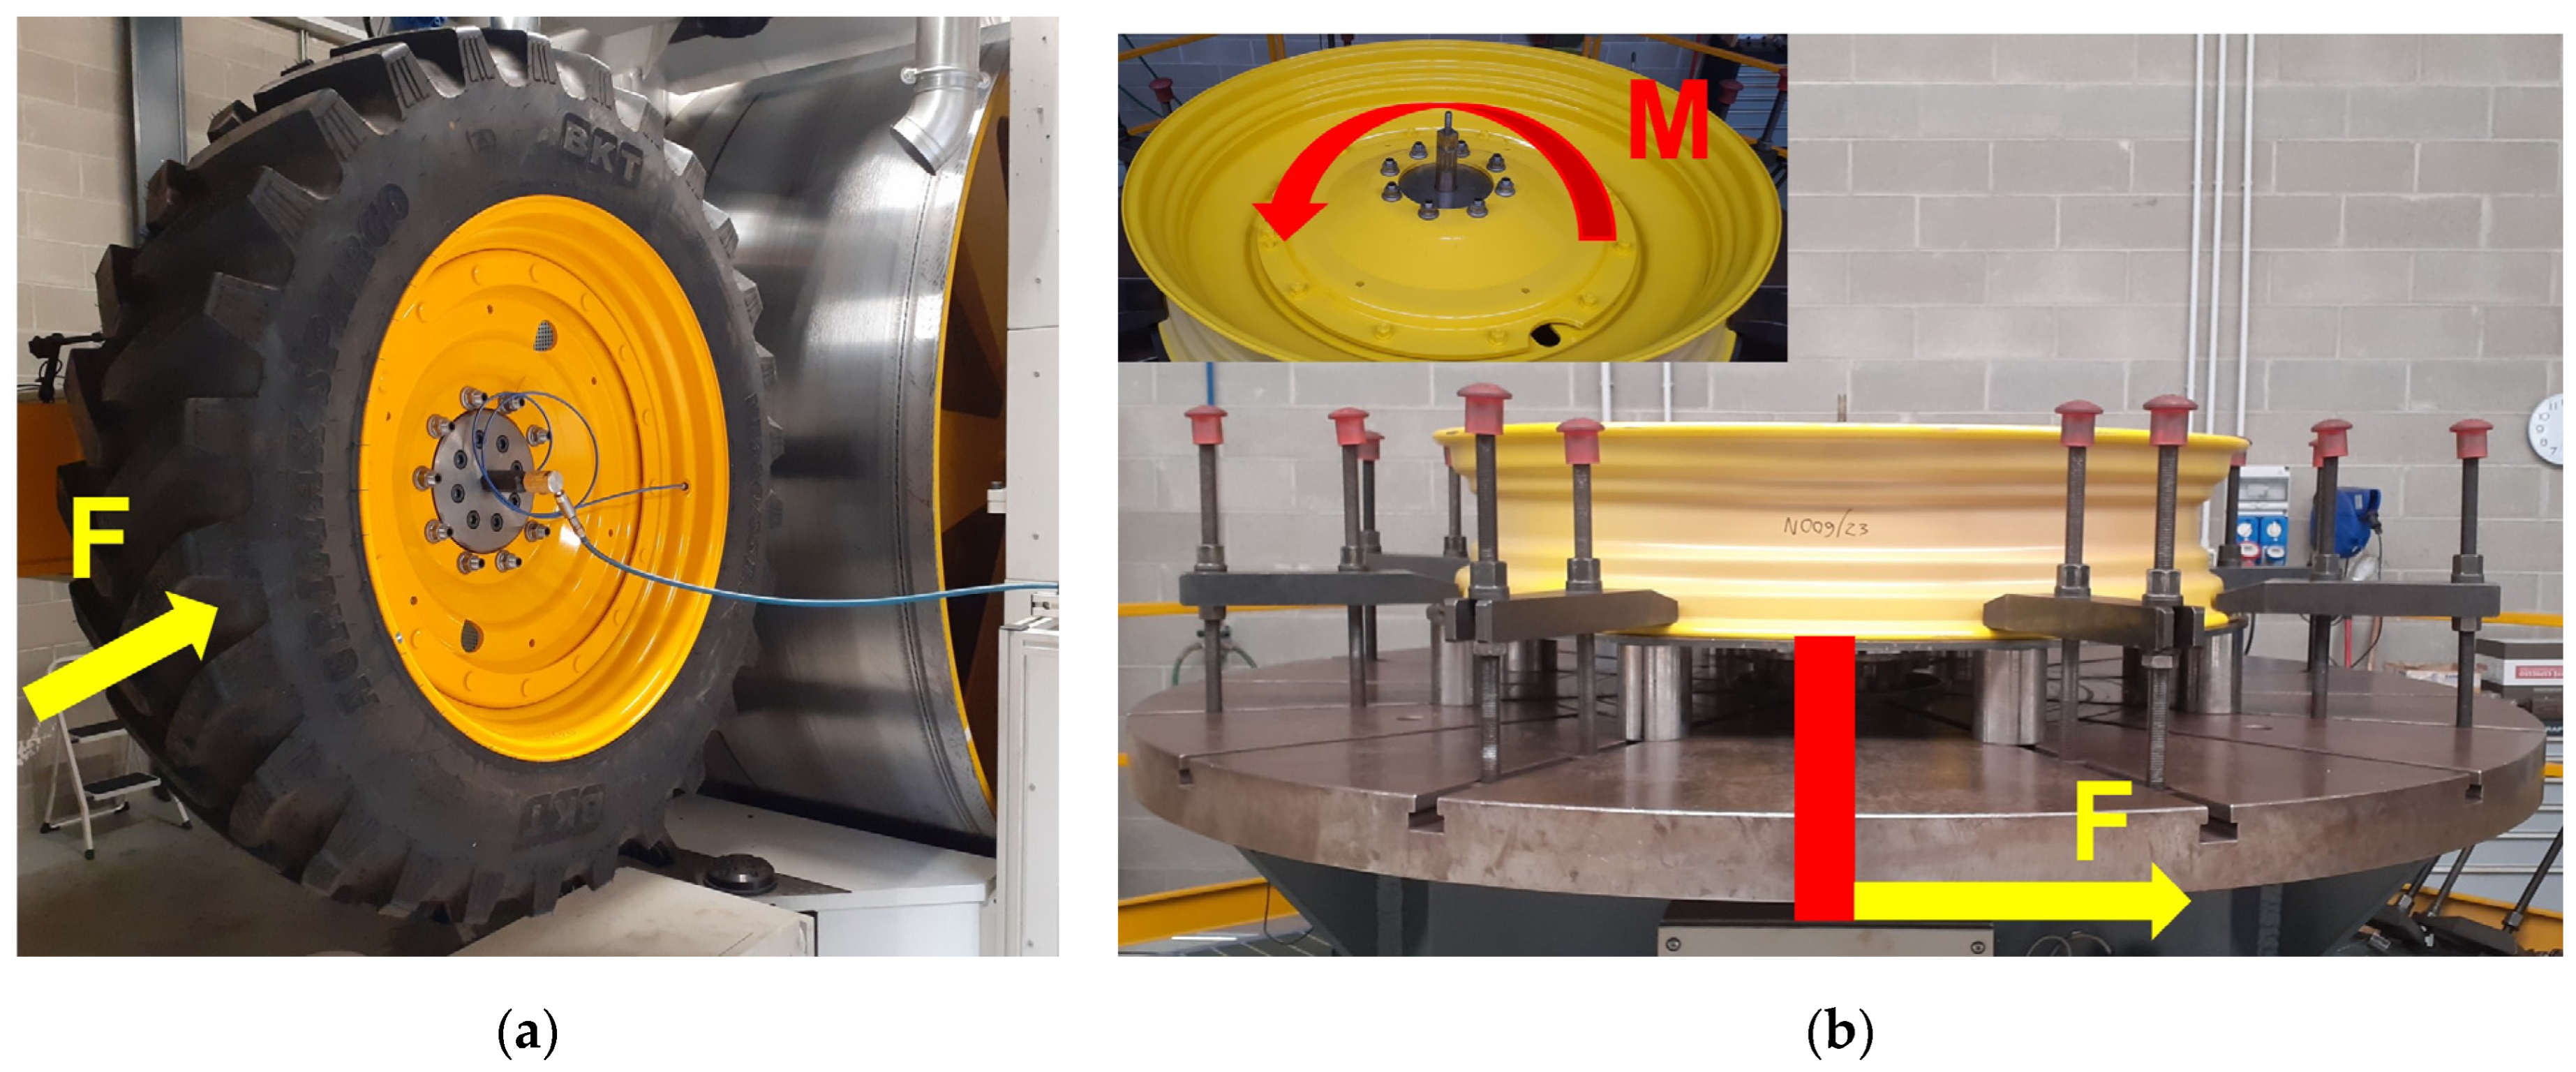
Figure 1. Example of dynamic radial fatigue test (a) and dynamic cornering fatigue test (b) for off-highway wheels.
Applsci 13 09119 g001
Figure 2. Example of wheel TW27×38″ (a) and rim profile section with dimensions in unit [mm] (b).
Applsci 13 09119 g002
Figure 3. Example of rim rolling operation.
Applsci 13 09119 g003
Figure 4. Most stressed areas of the rim that were subjected to service load conditions.
Applsci 13 09119 g004
Figure 5. Section test machine (a) and detail of the rim section specimen test setup (b).
Applsci 13 09119 g005
Figure 6. Example of the load function used for the rim section fatigue testing.
Applsci 13 09119 g006
Figure 7. Geometry of the specimen used for rim section fatigue testing. Dimensions in unit [mm].
Applsci 13 09119 g007
Figure 8. Finite element model of the optimized specimen.
Applsci 13 09119 g008
Figure 9. Preliminary mesh sensitivity analysis of the finite element model of the specimen. The axial stress distribution is measured on the outer surface of the specimen, along its centerline.
Applsci 13 09119 g009
Figure 10. Resonant test machine (a) and details of the uniaxial fatigue test setup (b).
Applsci 13 09119 g010
Figure 11. Geometry of the specimens used for uniaxial fatigue testing (a), with specified dimensions in unit [mm] (b).
Applsci 13 09119 g011
Figure 12. Example of crack start and development from the strain range behavior analysis.
Applsci 13 09119 g012
Figure 13. Example of a rim section specimen after test (a) and detail of the fatigue crack (b).
Applsci 13 09119 g013
Figure 14. Fracture surface of the rim section specimen.
Applsci 13 09119 g014
Figure 15. S-N curve for the bending fatigue test of rim section specimens for rim size TW27×38″. Aggregated data for Rim 1 and Rim 2.
Applsci 13 09119 g015
Figure 16. S-N curve for the bending fatigue test of rim section specimens for rim size TW27×38″. Comparison between Rim 1 and Rim 2.
Applsci 13 09119 g016
Figure 17. S-N curve for the axial fatigue test of the base material DD11.
Applsci 13 09119 g017
Figure 18. S-N curve for the axial fatigue test of the base material DD11. Details of the results based on the staircase method.
Applsci 13 09119 g018
Figure 19. Location of residual stress measurement points along the rim circumference (a) and detail of the position on the rim profile section (b). Measurements were made at both sides of the rim.
Applsci 13 09119 g019
Figure 20. Residual stress measurement directions: axial (x) and circumferential (y).
Applsci 13 09119 g020
Table 1. Chemical composition of the rim material DD11 [% weight].
CMnPSSiAlCuNiCrN
0.070.420.0100.0080.050.0160.0300.0120.0200.004
Table 2. Mechanical properties of the rim material DD11 in transverse direction (T).
Rm [MPa]Rp0.2 [MPa]A50 [%]E [MPa]
39127846.5207,000
Table 3. Residual stress measurements of the complete rim.
Measurement PointStress DirectionStress [MPa]
Valve Hole Side (A)
Stress [MPa]
Opposite Side (B)
Point 1Axial (x)−38 ± 6−96 ± 16
Circumferential (y)112 ± 1187 ± 9
Point 2Axial (x)−158 ± 12−31 ± 10
Circumferential (y)15 ± 12118 ± 12
Point 3Axial (x)48 ± 1234 ± 8
Circumferential (y)51 ± 895 ± 9
Table 4. Residual stress measurements of the rim sections specimens.
Measurement PointStress DirectionStress [MPa]
Valve Hole Side (A)
Stress [MPa]
Opposite Side (B)
Point 1Axial (x)−8 ± 9−6 ± 13
Circumferential (y)185 ± 13157 ± 9
Point 2Axial (x)23 ± 14−1 ± 8
Circumferential (y)162 ± 19103 ± 17
Point 3Axial (x)40 ± 1636 ± 5
Circumferential (y)158 ± 22154 ± 23
Table 5. Hardness measurement of the rim sections specimens. Scale: Rockwell B (HRB).
Rim 1Rim 1Rim 2Rim 2
ZoneSpecimen ASpecimen BSpecimen CSpecimen D
Flat71696669
Radius73746971
Table 6. Approximate tensile strength of the rim sections specimens, in unit [MPa]. Values are converted from Rockwell B hardness scale according to ASTM A370.
Rim 1Rim 1Rim 2Rim 2
ZoneSpecimen ASpecimen BSpecimen CSpecimen D
Flat425415395415
Radius440450415425
Disclaimer/Publisher’s Note: The statements, opinions and data contained in all publications are solely those of the individual author(s) and contributor(s) and not of MDPI and/or the editor(s). MDPI and/or the editor(s) disclaim responsibility for any injury to people or property resulting from any ideas, methods, instructions or products referred to in the content.