Article

Assessment of Water Retention Capacity of Non-Ionic and Anionic Fluorinated Dust Suppressants on Coal Dust

1
School of Emergency Management and Safety Engineering, China University of Mining & Technology (Beijing), Beijing 100083, China
2
State Key Laboratory Coal Resources and Safe Mining, China University of Mining & Technology (Beijing), Beijing 100083, China
3
Beijing Key Laboratory for Precise Mining of Intergrown Energy and Resources, China University of Mining and Technology (Beijing), Beijing 100083, China
*
Author to whom correspondence should be addressed.
Appl. Sci. 2023, 13(16), 9118; https://doi.org/10.3390/app13169118
Submission received: 7 June 2023 / Revised: 27 July 2023 / Accepted: 4 August 2023 / Published: 10 August 2023

Abstract

:
Wet-spray dust reduction technology is one of the many dust control measures used to address the underground coal dust hazard. The wettability and agglomeration effects between coal dust and dust suppression solution directly affect the dust reduction efficiency. The water retention of the dust suppression solution also affects the wetting effect of coal dust and the possibility of secondary dust generation after settling.. Fluorinated solutions are known for their good thermal and chemical stability and ability to reduce interfacial tension with a small dose, while also maintaining surface activity in the solution system. This study investigated the wetting and agglomeration effects of non-ionic and anionic fluorine-containing solutions at different concentrations in conjunction with coal dust by studying the water retention of coal samples. The experimental results show that the water retention of the non-ionic fluorinated solution is significantly better than that of the anionic fluorinated solution. The lowest mass loss was 10.0909 g for FS-31 and FS-34 at 0.03% concentration. The best overall solidification state of the coal sample surface after the experiment was attained with the FS-50 solution. The surface of the coal sample was dense and crack-free, with the lowest probability of secondary dust emission.

1. Introduction

Due to the continuous improvement in mechanized mining equipment in underground coal mines, the volume of coal mining is on the rise, consequently leading to an increase in the total amount of coal dust [1,2,3,4,5]. In the absence of proper dustproof measures, the amount of coal dust in a mine surpasses the state-stipulated standard. Long-term working contact in the mine can cause a series of coal dust respiratory diseases [6,7,8,9]. High concentrations of coal dust reduce the visibility of underground mines, making it difficult for operators to see and operate instruments and greatly increasing the probability of coal mine accidents [10]. Therefore, coal mine dust control remains an urgent problem to be addressed.
Wet-spray dust removal technology is widely used in coal mine working faces due to its simple operation. Spray-in-spray dust removal technology is generally a combination of a water matrix and spray dust suppressor and can be categorized into five types: bonding, condensation, wetting, compound, and environmental protection [11,12]. Wetting dust suppressants mainly consist of surface-active agents and inorganic ions or halides, which have more applications in coal mines than other dust suppressants. In recent years, domestic and foreign scholars have conducted extensive research on the development of dust suppressors for coal dust [13,14,15,16,17]. Li used polymer POL as the main raw material to prepare a reagent with dust removal performance that can meet production requirements after the action of the dust suppression solution [18]. Li used lignosulfonate as the main raw material to prepare a dust suppression solution with acrylic acid, calcium chloride, sodium tetraborate, sodium methyl silicate, etc. The experimental results showed that it had good dust removal and waterproof effects and was non-toxic [19]. Zuo used sodium carboxymethyl cellulose and starch as raw materials, ammonium persulfate as an initiator, N,N′-methylene diacylamine as the cross-linking agent, and prepared a dust suppression solution through graft copolymerization. After experiments, it was found that the dust suppressor had functions such as wetting, bonding, water absorption, coagulation, and good dust suppression [20]. Wang synthesized a biological dust suppressor through microbial fermentation that has excellent wettability and high biodegradability [15].
The effective reduction of surface tension by fluorine-containing surfactants is manifested in the amphiphilic structure in the microscopic molecular structure of the fluorine-containing solution [21], which includes both the hydrophilic part insoluble in the organic phase and the oil-philic part soluble in the organic phase [22,23,24]. Fluorine-containing surfactants are substances that can rapidly reduce the surface tension of a solution and the surface state of a system with a very small dose to produce wetting, infiltration, condensation, and other capabilities [25,26,27]. Fluorine-containing surfactants can also be combined well with hydrocarbon surfactants [28,29]. The compound solution has good performance and can more effectively reduce the surface tension of the solution (common surfactants can reduce the surface tension of water to 30 mN/m when dissolved in water, while fluorine-containing surfactants containing CF3 or CF2 can reduce the surface tension of water to 10 mN/m) and enhance the wettability of the solution [30]. Due to its high electronegativity and small atomic radius, fluorine can form a firm carbon–fluorine bond and maintain good thermal stability under high temperatures and pressure [31,32,33,34]. The surface activity of a substance containing fluorine can be classified into four types: anionic, cationic, non-ionic, and zwitterionic. [35,36]. The key advantage of fluorine-containing surfactants lies in their unique amphiphilic structure, which encompasses both hydrophilic and oil-philic parts, enabling them to significantly reduce the surface tension of a solution with a minimal dose, leading to enhanced wetting, infiltration, and condensation capabilities. While previous research has focused on the performance of fluorinated solutions in organic systems, there is a dearth of studies investigating their specific interactions with coal dust, particularly in terms of wettability and water retention properties. To further investigate the wettability and water retention properties of fluorinated surfactants, four non-ionic fluorinated surfactants (perfluoropropyl acrylate (FS-30), perfluorooctyl acrylate (FS-31), perfluorooctylsulfonyl phenoxyethyl methacrylate (FS-34), and perfluoropropanoic acid (FS-50)) and three anionic surfactants (sodium perfluorooctanesulfonate (FS-60), perfluoroisopropyl acrylate (FS-61), and perfluorooctanesulfonate carbamate acid (FS-63)) were selected for experiments in this study.

2. Materials and Methods

2.1. Selection and Analysis of Experimental Coal Samples

The coal samples used in this study were obtained from the Hongqinghe coal mine area in Inner Mongolia, China. The selected coal samples were placed in sealed bags to prevent oxidation and were quickly sent to the laboratory to avoid weathering. In the laboratory, the coal samples were stripped, crushed, and ground from the basis of the selected coal lumps. Then, they were sieved through different apertures to obtain the experimental coal samples. The industrial analysis of the coal samples was performed following the national standard Industrial Analysis Method of Coal (GB/T 212-2008) [37], and the mass fractions of fixed carbon, ash, volatile matter, and moisture in the coal samples were determined. The results of the analysis are presented in Table 1.

2.2. Experiments on the Preparation of Fluorine-Containing Solutions

Different weights of fluorinated pharmaceuticals were measured using a balance, while distilled water solvents were measured using a measuring cylinder. The two were then mixed to prepare various concentrations (0.01%, 0.02%, 0.03%, 0.04%, 0.05%, 0.06%, 0.07%, 0.08%, 0.09%, 0.1%, 0.2%, 0.3%) of fluorinated solutions for the experiments. Table 2 displays the primary reagents utilized in the experimental procedure.

2.3. Water Retention Experiment

Coal samples with particle sizes ranging from 80 to 200 were carefully screened and positioned on weighing paper to determine their mass in the water retention experiment. Subsequently, precisely 3 g of coal samples were transferred into a glass vessel. For solution preparation, different types of weighing solutions, each measuring 15 mL, were thoughtfully selected. The weighed solutions were then poured into glass dishes containing the coal sample, stirred thoroughly, and allowed to dry naturally indoors. Regular weighing of the glass dishes was conducted every 12 h (see Figure 1).

3. Results and Discussion

3.1. Analysis of Water Retention in Anionic Fluorinated Solutions

3.1.1. Study on the Change Law of Coal Dust Weight after the Action of Anionic Fluorine-Containing Solution

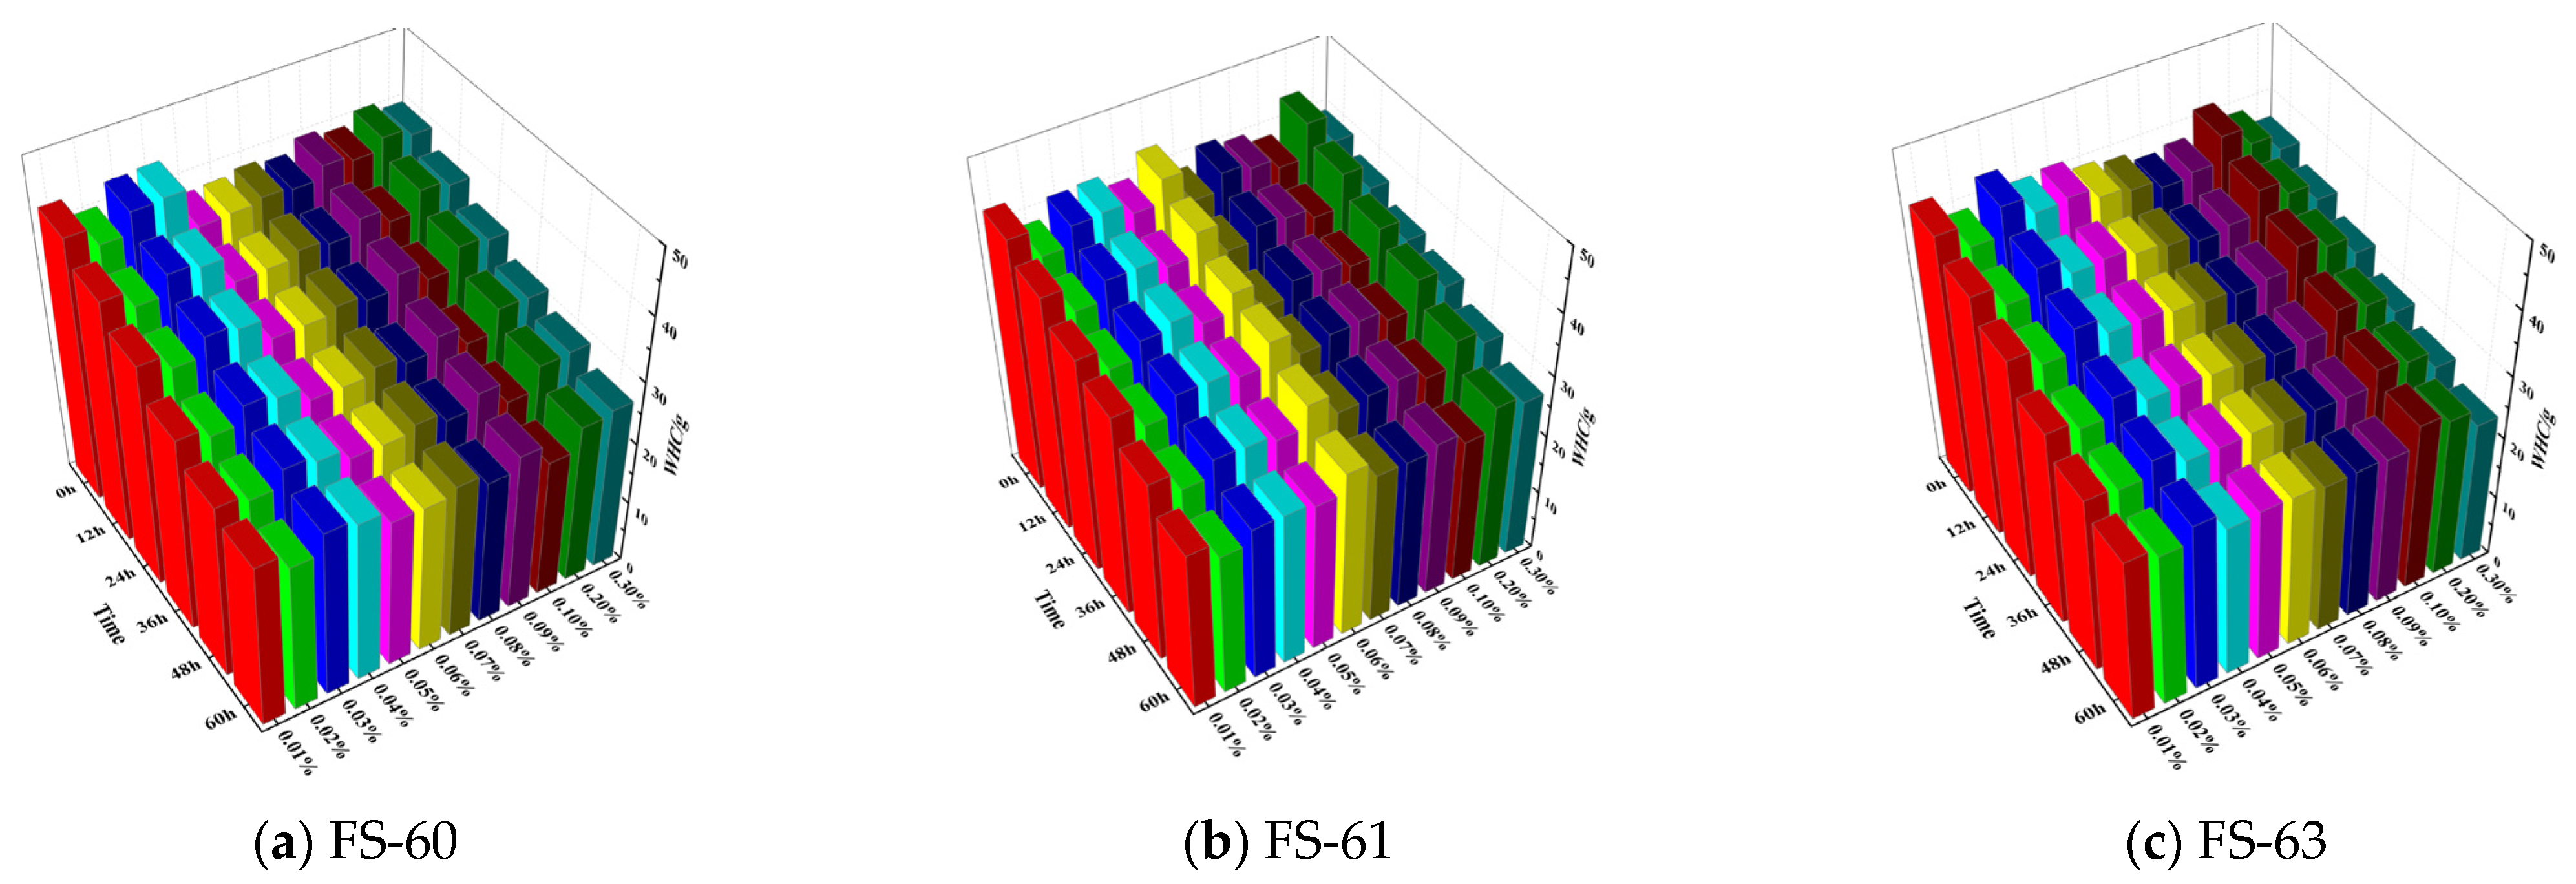
Figure 2 demonstrates a continuous decrease in water retention of the FS-60 solution with time at all concentrations. The minimum weight loss occurred at 24–36 h, followed by a rapid increase and reaching its peak at 48–60 h. The FS-61 solution exhibited considerably higher weight loss at 48–60 h compared to other solution types. For the FS-63 solution, there was an initial rise in weight loss, followed by a subsequent decline and reaching its maximum at 24–36 h. Nevertheless, for the mass fractions of 0.01% and 0.1% solutions, weight loss increased again at 48 h and beyond. This behavior indicates that the FS-63 solution undergoes certain changes or reactions during the initial hours, leading to weight loss. However, at a certain point, these reactions may slow down or reach a state of equilibrium, resulting in a decline in weight loss. The subsequent rise in weight loss at 48 h and beyond for specific mass fractions may indicate the occurrence of a different mechanism or reaction in those concentrations.

3.1.2. Analysis of Segmental Weight Loss Rate Variation of Anionic Fluorinated Solutions

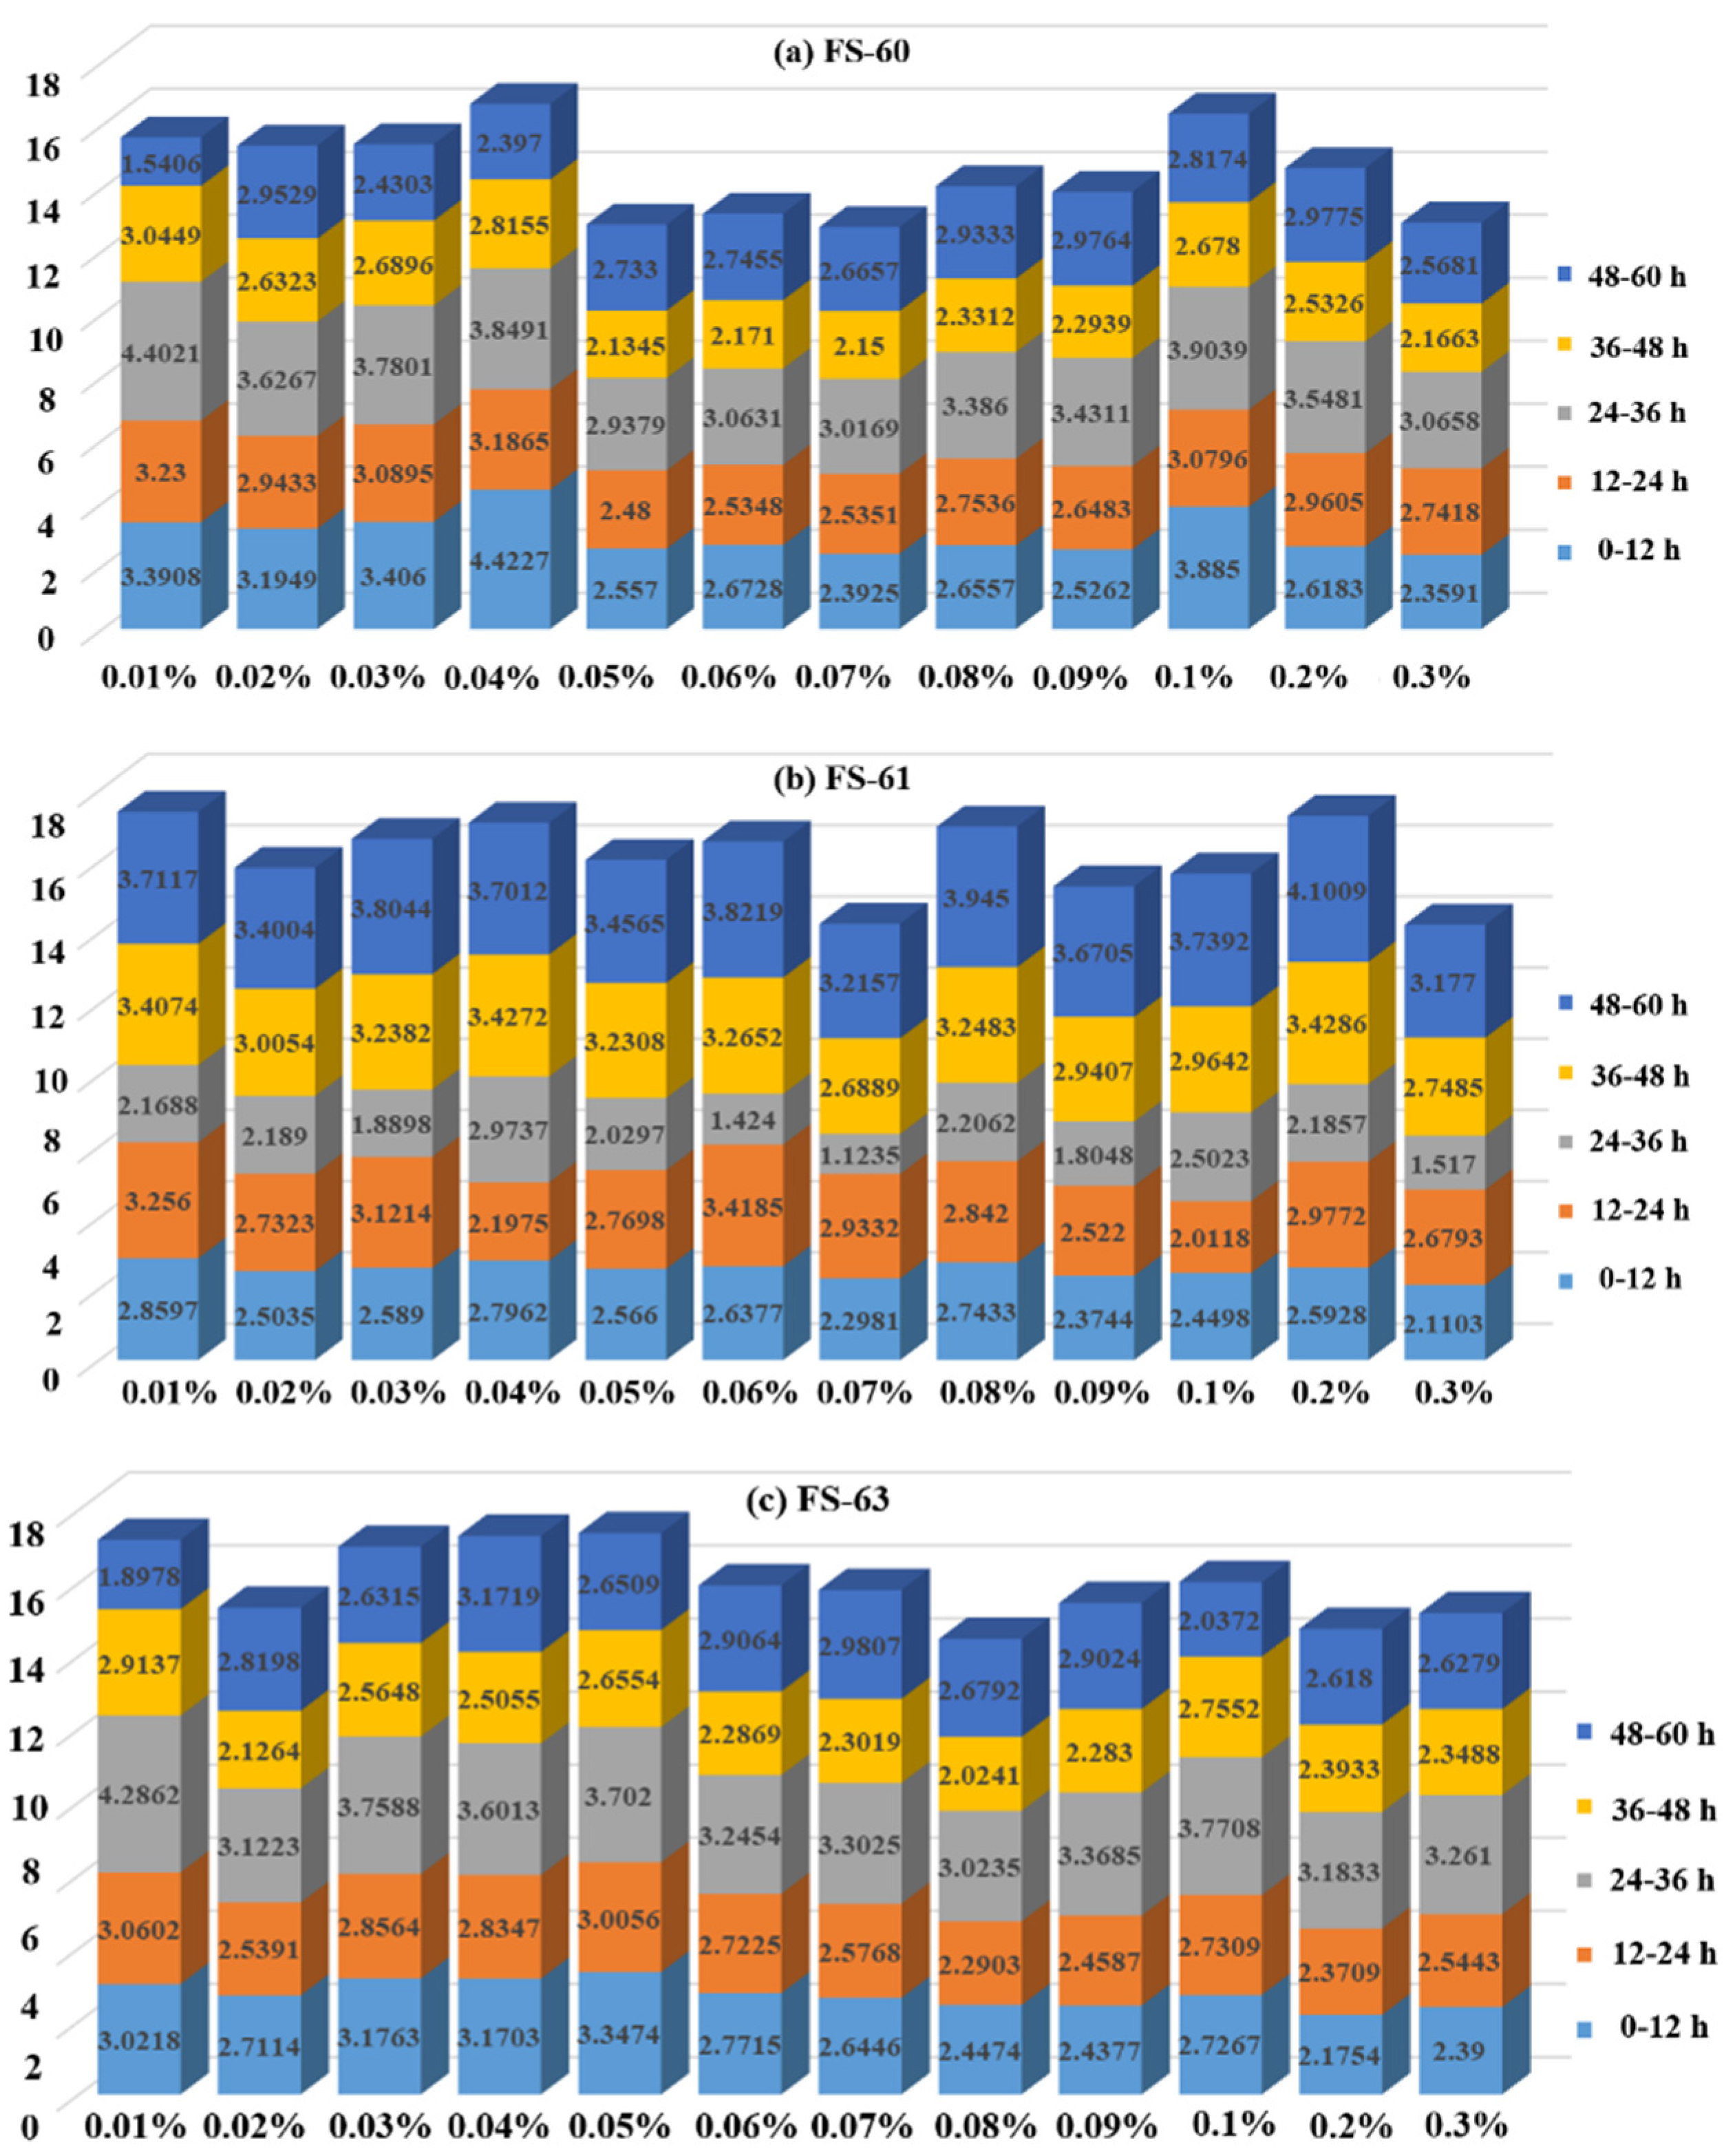
Water loss varied with different concentrations of FS-60 dust suppression solution over time. The overall water loss at 60 h increased with the concentration of the FS-60 solution. The concentrations of 0.01%, 0.02%, and 0.03% exhibited equivalent total water loss, as did the concentrations of 0.05%, 0.06%, 0.07%, and 0.3%. The solution with the highest water loss was at a concentration of 0.04%, whereas the solution with the lowest water loss was at a concentration of 0.07%. These variations in water loss can be attributed to the diverse interactions between the fluorocarbon molecules and water molecules at varying concentrations. The specific concentration of 0.07% exhibited the best water retention, signifying an optimal balance between the solution’s properties and its water-retaining capability.
The water loss patterns at different times varied among the different concentrations of FS-61 solution, as depicted in Figure 3b. The different concentrations of the FS-61 solution exhibited varying patterns of water loss at different times, with no clear trend of water loss with increasing concentration over 60 h. The solution with the highest water loss was at 0.2% concentration, while the solution with the lowest water loss was at 0.3% concentration. The variations in water loss patterns indicate the complexity of interactions between fluorocarbon molecules, water molecules, and other solution components, which are not solely dependent on concentration. The optimal concentration for water retention in the FS-61 solution was found to be 0.3%.
The water loss of the FS-63 solution varies at different concentrations and time periods. The concentration causing the highest water loss is 0.05%, resulting in approximately 15.3613 g of water loss, while the lowest concentration is 0.08%, with approximately 12.4645 g of water loss. The most concentrated solutions (except 0.05%) experience the highest water loss during the 24–36 h period. The concentration causing the highest water loss varies at different time periods: from 0 to 12 h, it is 0.05%; from 12 to 24 h, it is 0.01%; from 24 to 36 h, it is 0.01%; from 36 to 48 h, it is 0.01%; and from 48 to 60 h, it is 0.04%. The concentration of FS-63 solution that demonstrates the best water retention is 0.08%. The presence of perfluorooctanesulfonate carbamate acid in the FS-63 solution may influence the interaction between the anionic fluorocarbon molecules and water molecules. The specific chemical structure of perfluorooctanesulfonate carbamate acid may affect the solubility and solvation properties, leading to variations in water retention at different concentrations. The stability and volatility of the FS-63 solution at different concentrations can influence water loss. Concentrations that exhibit higher water loss may have higher volatility, potentially due to the presence of volatile components or the ease of evaporation of water from the solution. Based on the experimental results, the concentration of 0.08% demonstrates the best water retention among the tested concentrations. This concentration achieves a more favorable balance of stability, volatility, and molecular interactions, resulting in reduced water loss.

3.1.3. Analysis of Total Weight Loss Rate Variation of Anionic Fluorinated Solutions

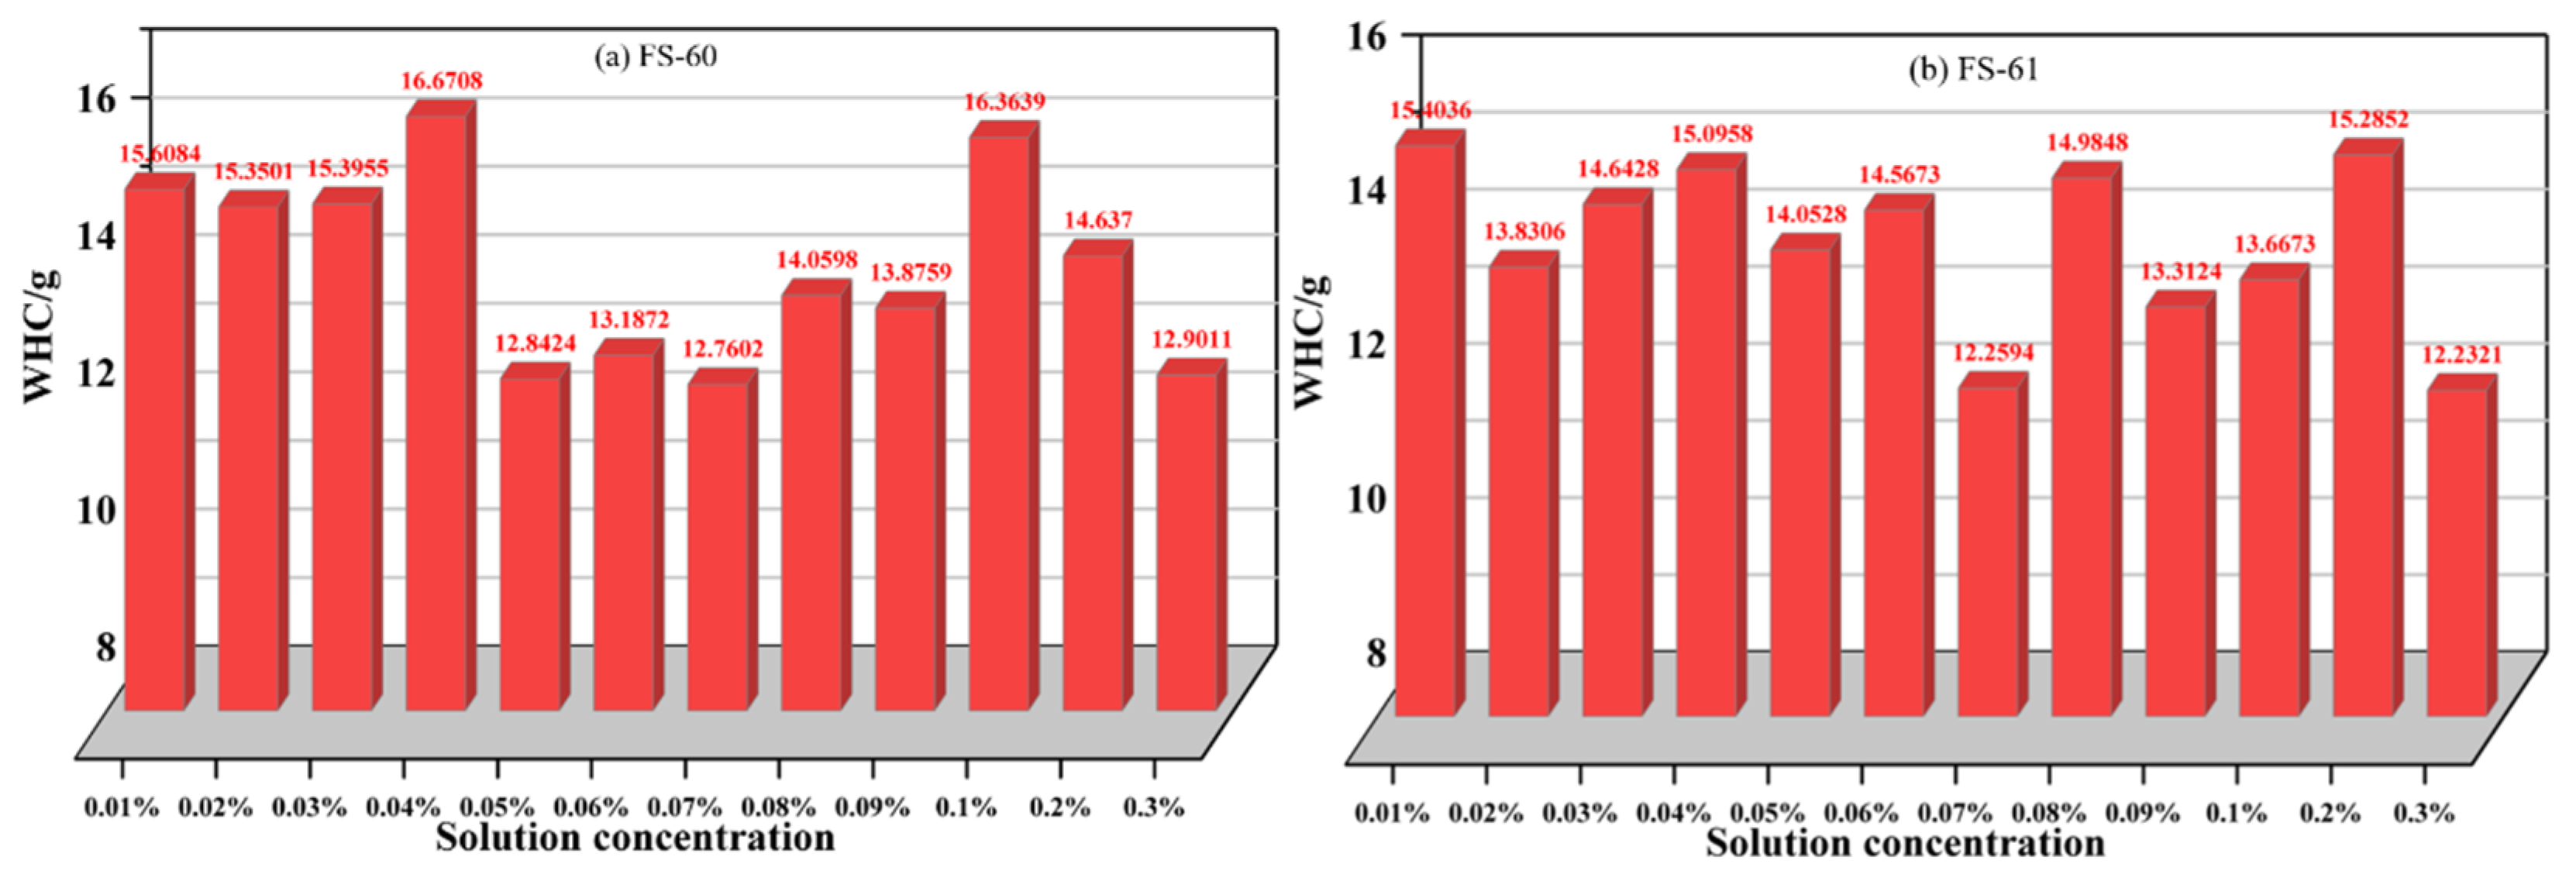
As shown in Figure 4a, the total mass lost from the solution in the water retention experiment fluctuates up and down as the concentration of the solution increases, reaching troughs at 0.05%, 0.07%, and 0.3% of the solution and peaks at 0.04% and 0.1% of the concentration. The lowest total mass lost was 12.7602 g at a solution concentration of 0.07%, followed by a total mass loss of 12.8424 g at a concentration of 0.05%, and the highest total mass lost was 16.6708 g at a solution concentration of 0.04%. At solution concentrations of 0.05% and 0.07%, the least mass is lost and water retention is the best, while at a solution concentration of 0.04%, the most mass is lost and water retention is the worst. This suggests that the interaction between FS-60 and water, as well as the stability and volatility of the solution, vary with concentration.
As can be seen in Figure 4b, there is no clear pattern in the weight loss of the FS-61 solution at different concentrations. The maximum weight loss of 15.4036 g occurred at a mass fraction of 0.01%, while the minimum weight loss of 12.2321 g occurred at a mass fraction of 0.3%, resulting in an extreme difference of 3.1715 g. When comparing the difference between adjacent concentrations, the maximum increase of 2.7254 g was observed between 0.07% and 0.08%, while the maximum decrease of 3.0531 g occurred between 0.2% and 0.3%. These findings suggest that water retention was strongest at 0.3%, followed by 0.07%, and weakest at 0.04%. The differences in weight loss between adjacent concentrations vary, suggesting that the water retention capabilities of the FS-61 solution are not consistent across concentrations.
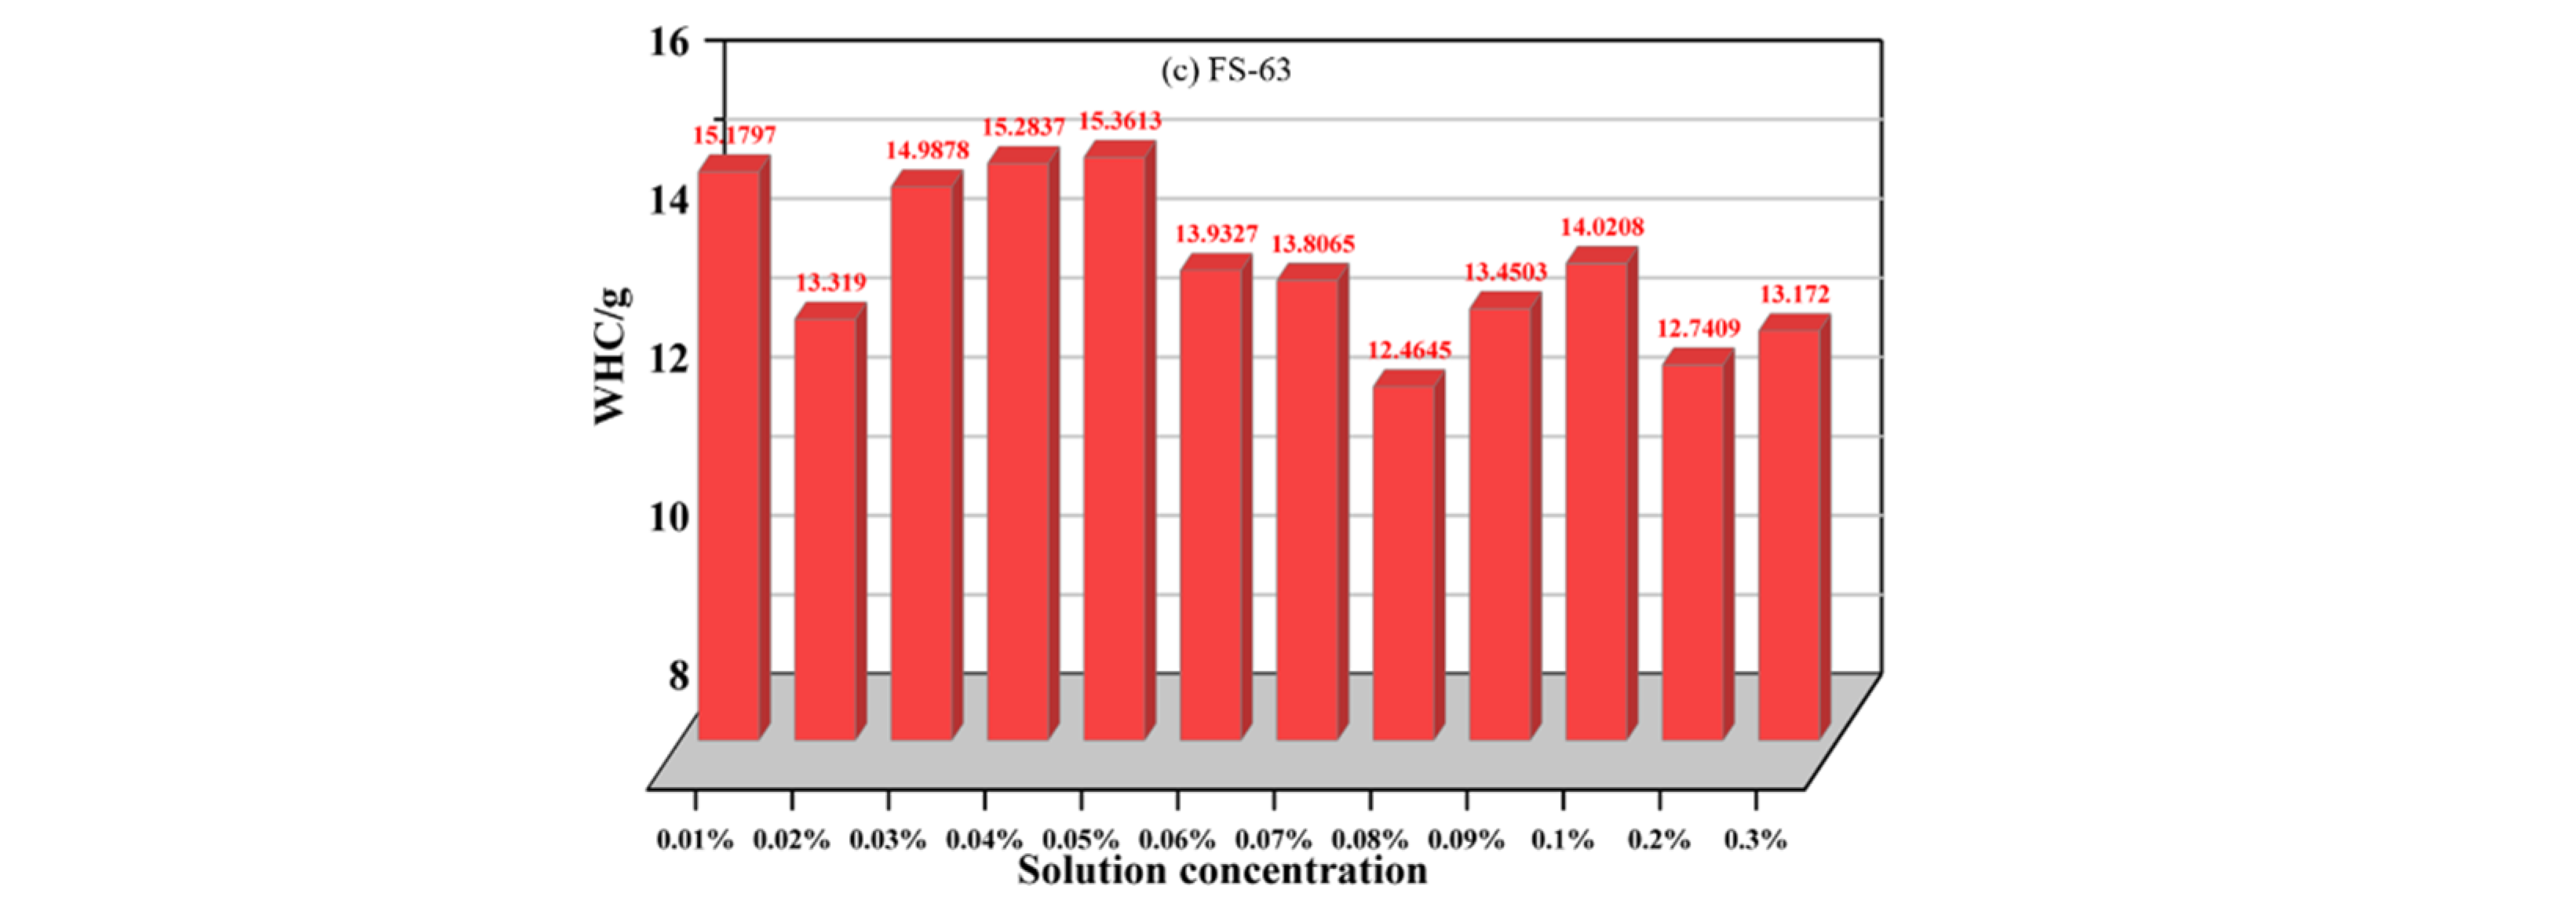
As shown in Figure 4c, there is no clear pattern in the weight loss of FS-63 solution at different concentrations. There was a maximum weight loss of 15.3613 g at a mass fraction of 0.05% and a minimum weight loss of 12.4645 g at 0.08%, with an extreme difference of 2.8968 g. Comparing the differences between adjacent concentrations, a maximum rising difference of 1.6688 g was found between 0.02% and 0.03% and a maximum falling difference of 1.4286 g between 0.05% and 0.06%. This shows that the solution retains the most water at 0.1% concentration, followed by the solution at 0.1% concentration and the weakest at 0.04% concentration. The maximum weight loss is observed at a concentration of 0.05%, while the minimum weight loss occurs at a concentration of 0.08%. The differences in weight loss between adjacent concentrations further support the inconsistency in water retention capabilities.
Overall, the interaction between anionic fluorocarbon molecules and water, along with the stability and volatility of the solutions, play crucial roles in determining the water retention capabilities at different concentrations. The specific chemical compositions and properties of each solution, including the main components mentioned, contribute to the observed variations in water loss.

3.2. Analysis of Water Retention of Non-Ionic Fluorinated Dust Suppressants

3.2.1. Study on the Change Law of Coal Dust Weight after the Action of Anionic Fluorine-Containing Solution

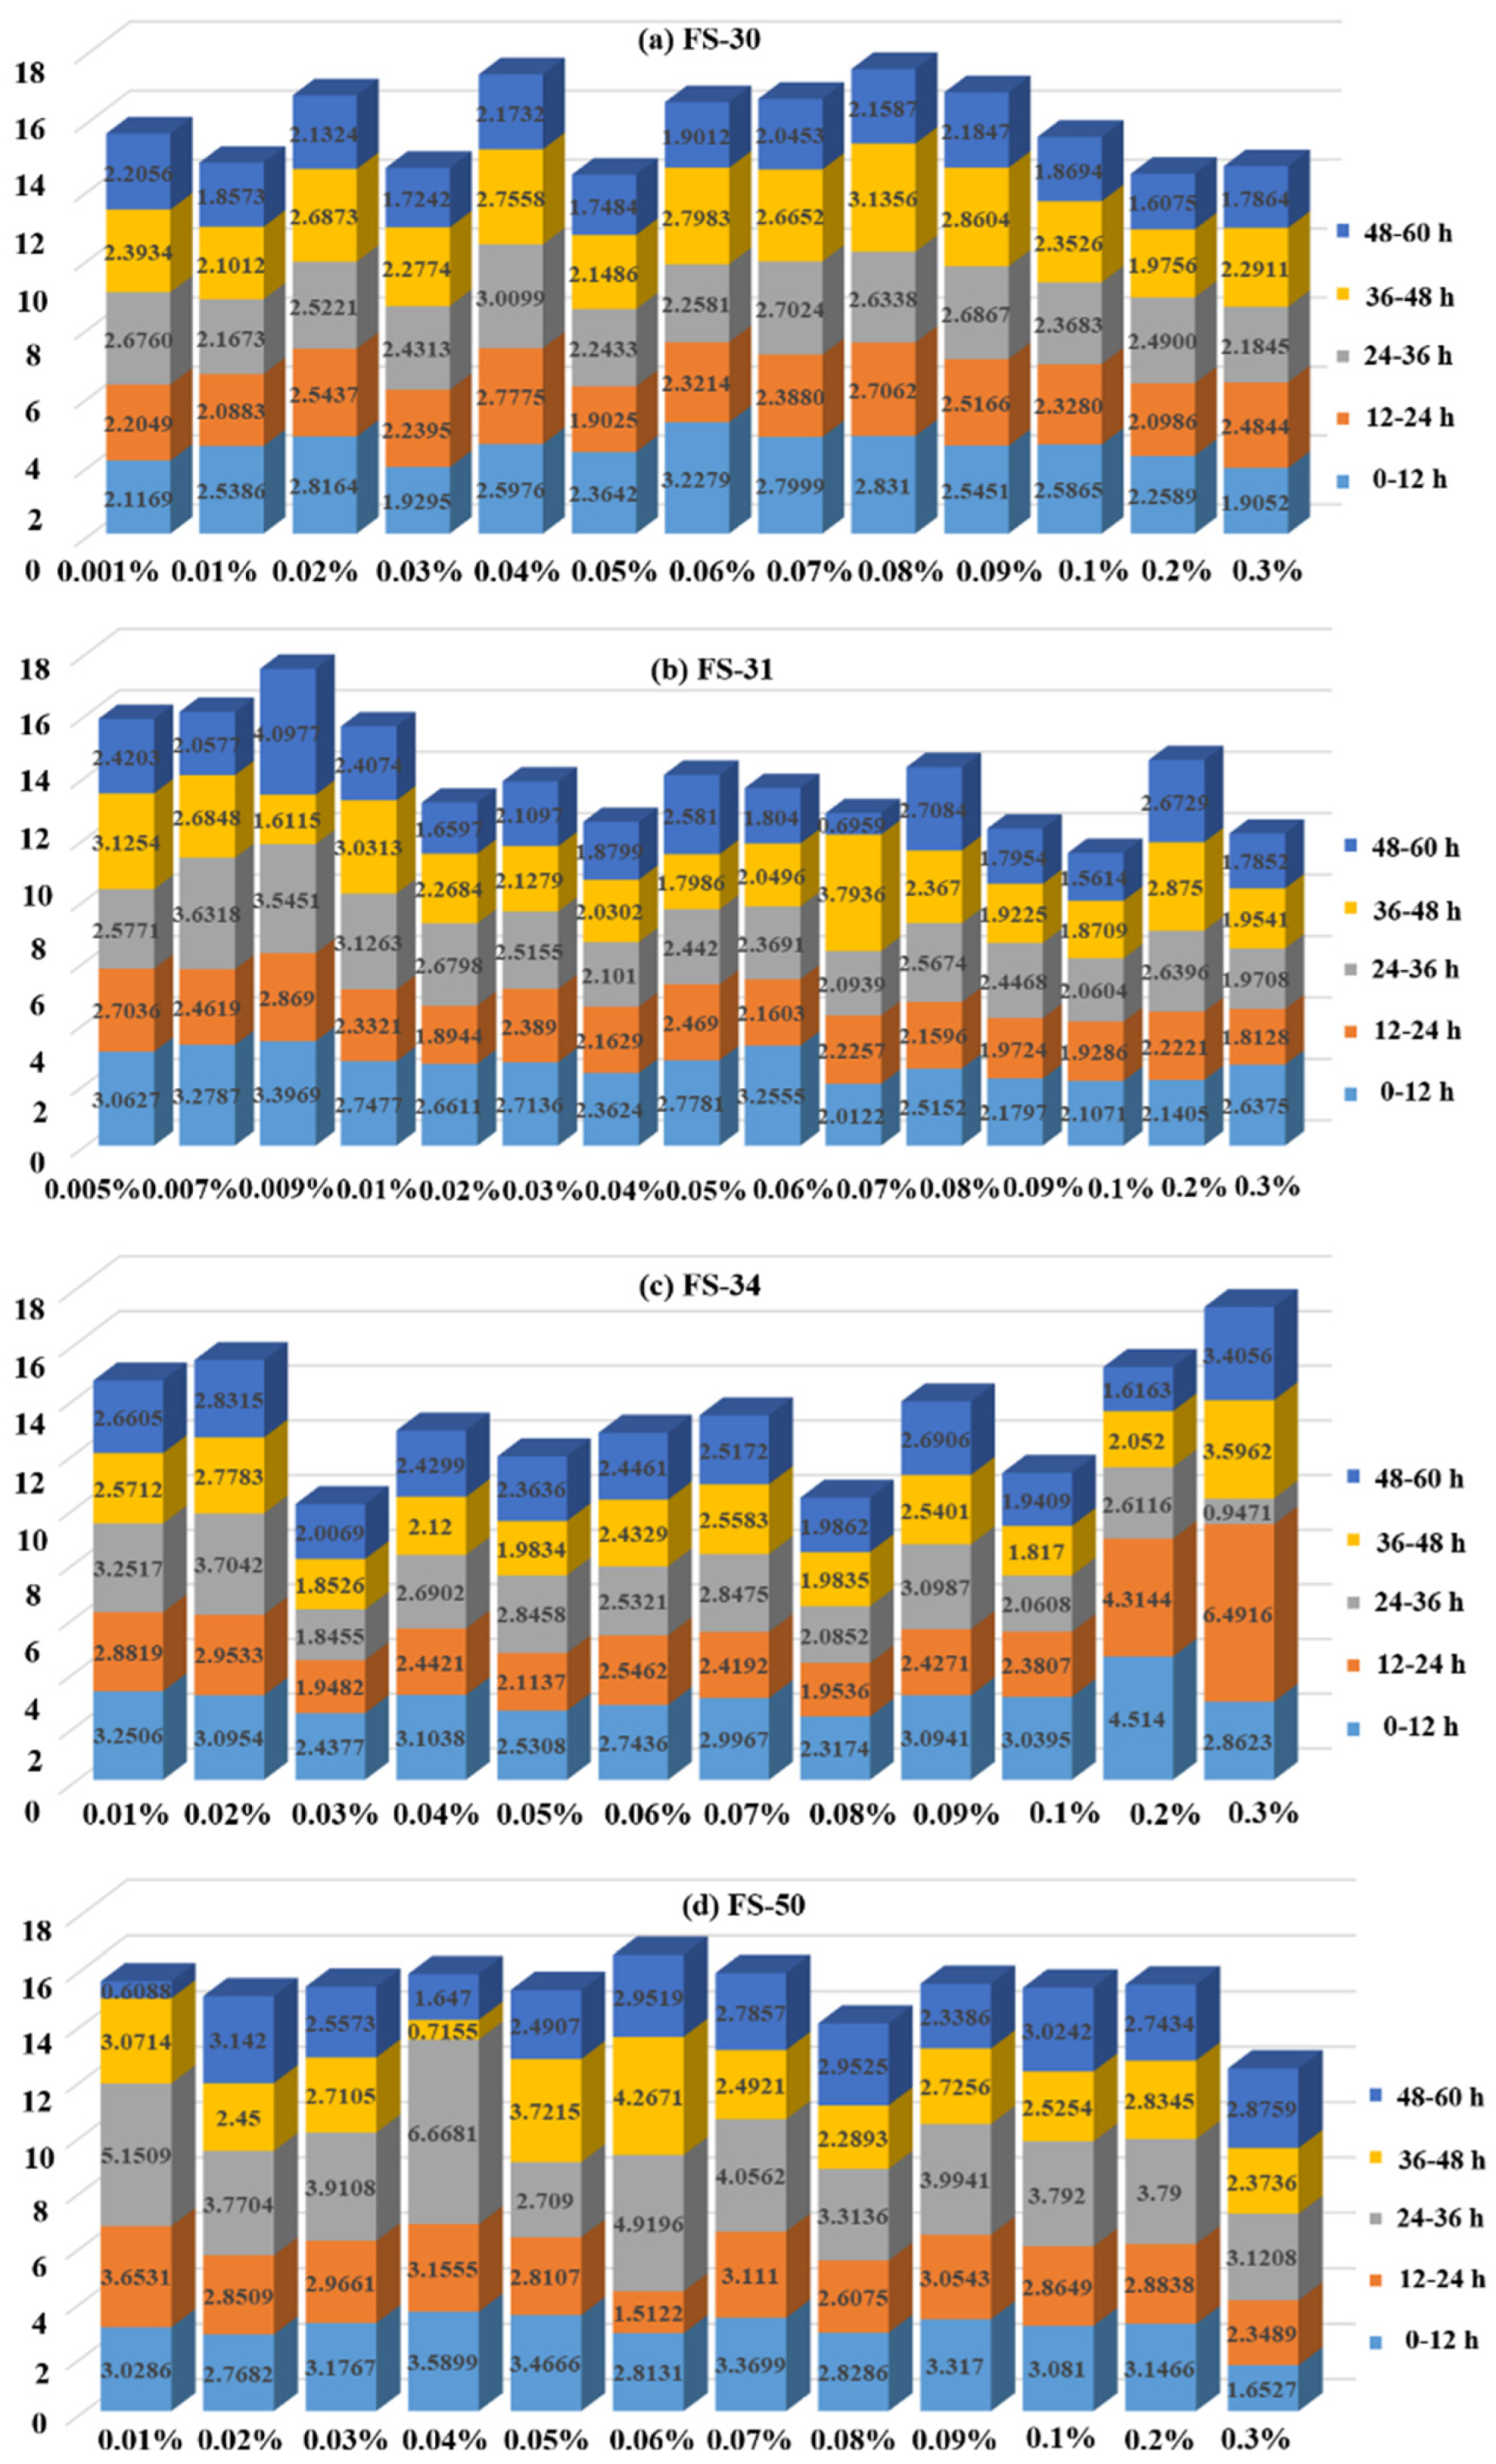
As shown in Figure 5, the weight of the samples at each concentration demonstrates an overall decreasing trend from 0 h to 60 h. The weight change between the FS-30 solutions at each concentration can be visually compared, where slower weight decrease indicates greater water retention capacity. The FS-30 solution exhibits the highest water retention at a concentration of 0.2%, followed by a concentration of 0.05%. The weight of coal dust varies at each concentration of FS-31, but all show a tendency for the weight of coal dust to decrease with time. The highest initial weight concentration is 0.009% at around 42 g, and the lowest initial weight concentration is 0.04% at around 34 g. The highest weight of coal dust at 60 h is around 33 g (0.03%), and the lowest weight is around 25 g (0.04%). The FS-34 solution shows an overall decreasing trend in sample weight from 0 h to 60 h at all concentrations, with the solution retaining the most water at a concentration of 0.3%, followed by the 0.08% solution. The FS-50 solution demonstrates a decreasing trend in water retention over time at all concentrations. At concentrations of 0.01% to 0.04%, the weight loss of the dust suppression solution roughly show a trend of decreasing, then increasing, and then decreasing again. At concentrations of 0.05% to 0.3%, all show a fluctuating trend of decreasing, then increasing, and then decreasing and increasing again. The arbitrary concentration occurs in 24–36 h, when the weight loss is the largest. Water retention is an important indicator of the performance of dust suppressants. Reasonable deployment of the concentration for the control of water retention solution plays an essential role in achieving water retention by making reasonable use of resources.

3.2.2. Analysis of Segmental Weight Loss Rate Variation of Non-Ionic Fluorinated Solutions

The results presented in Figure 6a indicate that the water loss of the FS-30 solution at varying concentrations is not uniform across different time periods. However, the overall water loss at 60 h does not exhibit a significant change with an increase in concentration. The solution with the lowest concentration of 0.05% demonstrates the least total water loss (approximately 10.4070 g), with an average water loss rate of 0.17345 g/h. The 0.2%-concentration solution has the second-lowest total water loss (approximately 10.4306 g) and an average water loss rate of 0.17384 g/h. These observations suggest that the presence of specific molecular functional groups in the solutions may favorably interact with water molecules, leading to lower water loss. The analysis of water loss in different time periods also reveals that the periods 0–12 h and 24–36 h have higher water loss than 48–60 h. The specific concentrations associated with the lowest water loss in each time period (0–12 h, 12–24 h, 24–36 h, 36–48 h, and 48–60 h) highlight the potential influence of specific molecular functional groups on water retention at different stages. The interactions between these functional groups and water molecules, such as hydrogen bonding or hydrophilic–hydrophobic interactions, can affect the stability and evaporation rate of the solution. Based on a comprehensive analysis, the optimal concentration of the FS-30 solution for water retention is found to be 0.2%.
As shown in Figure 6b, the water loss of the FS-31 solution at different concentrations varies at different time periods, and the overall water loss at 60 h does not change significantly with increasing concentration. In terms of total water loss, the solution with the lowest total water loss concentration is 0.1%, with a total water loss of about 9.5284 g and an average water loss rate of 0.15881 g/h. The solution with 0.3% concentration is the next lowest, with a total water loss of about 10.1604 g and an average water loss rate of 0.16934 g/h. Through comparative analysis of water loss in each time period, it can be seen that 12–24 h is the time period with the least water loss in the solution. The solution concentration with the least water loss from 0 to 12 h is 0.07%, the solution concentration with the least water loss from 12 to 24 h is 0.3%, the solution concentration with the least water loss from 24 to 36 h is 0.3%, the solution concentration with the least water loss from 36 to 48 h is 0.1%, and the solution concentration with the least water loss from 48 to 60 h is 0.07%. The concentration of the FS-31 solution with the best water retention is 0.3%. Moreover, the water retention time can be controlled within 24 h to ensure better water retention performance. Based on the available data, the observed phenomena suggest that certain molecular functional groups in the FS-31 solution interact favorably with water molecules, leading to better water retention at specific concentrations and time periods.
Figure 6c demonstrates that the water loss of the FS-34 solution at varying concentrations fluctuates during distinct time periods and the total water loss at 60 h does not exhibit a significant change with increasing concentration. The solution with the lowest concentration, 0.03%, has a total water loss of approximately 10.0909 g and an average water loss rate of 0.16818 g/h. In contrast, the solution with a concentration of 0.08% has the next-highest total water loss, approximately 10.3259 g, and an average water loss rate of 0.17210 g/h. These concentrations may contain molecular functional groups that interact favorably with water molecules and thus promote water retention. The lower average water loss rates for these concentrations further support their superior water retention capabilities. Analyzing water loss during each time period indicates that the time period with the least water loss in the solution is 24–48 h. This time period suggests that specific molecular functional groups in the FS-34 solution may contribute to better water retention during this interval, and may have properties that reduce evaporation or enhance water-binding interactions. Moreover, the concentration of the FS-34 solution with the best water retention is 0.03%, and the water retention time can be controlled within 48 h to ensure better water retention performance. The concentrations linked to the least water loss in each time period (0–12 h, 12–24 h, 24–36 h, 36–48 h, and 48–60 h) imply that different molecular functional groups may play roles in water retention at different stages, likely due to unique properties or interactions with water molecules that influence evaporation rates during specific time intervals. The minimum water loss concentration at 60 h is 0.2%.
The water loss of the FS-50 dust suppression solution is observed at various concentrations and time intervals. An increase in concentration does not significantly alter the overall water loss at 60 h. The maximum water loss is observed at a concentration of 0.06%, with a total water loss of approximately 16.4639 g. Conversely, the minimum water loss is observed at a concentration of 0.3%, with a total water loss of around 12.3719 g. These findings suggest that different molecular functional groups present in the FS-50 solution at varying concentrations may affect water retention properties. Specifically, the functional groups at higher concentrations may contribute to increased water loss, while those at lower concentrations may enhance water retention. Notably, most concentrations of solutions (excluding 0.05%) have the highest water loss during the 24–36 h time period. The concentration of the solution with the highest water loss varies at different time periods: 0.04% from 0 to 12 h, 0.01% from 12 to 24 h, 0.04% from 24 to 36 h, 0.06% from 36 to 48 h, and 0.02% from 48 to 60 h. Thus, different molecular functional groups may influence water retention during different stages and may have properties that promote or inhibit evaporation rates during specific time intervals. Based on a comprehensive analysis, the concentration of FS-50 solution with the best water retention is determined to be 0.3%.

3.2.3. Analysis of the Variation in Total Weight Loss Rate of Non-Ionic Fluorinated Solutions

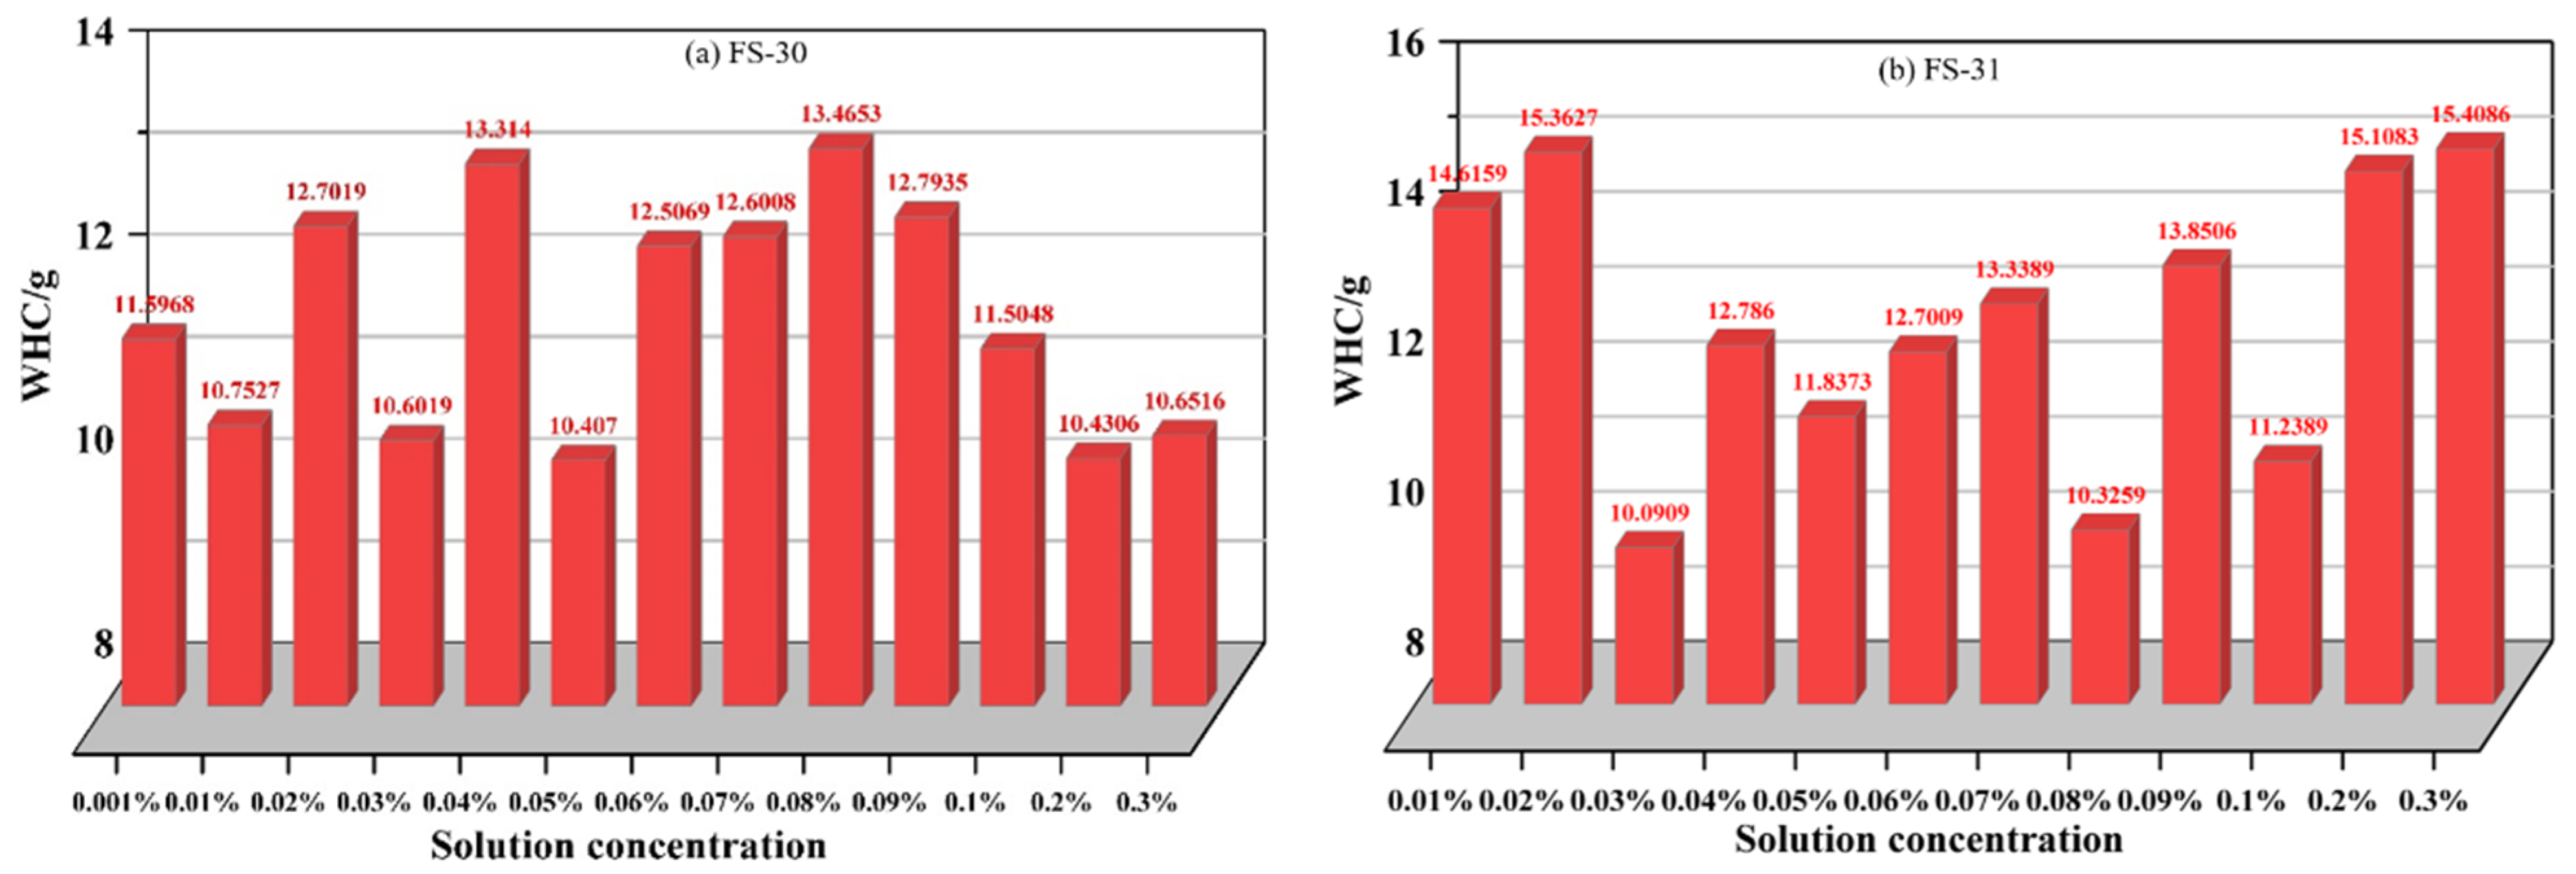
In the water retention experiments of FS-30 solution, the total mass lost by the solution fluctuates as the solution concentration increases, reaching a minimum at concentrations of 0.01%, 0.03%, 0.05%, and 0.2%. The least total mass lost is 10.407 g at a concentration of 0.05%, followed by a total mass loss of 10.4036 g at a concentration of 0.2%. The most total mass lost is 13.4653 g at a solution concentration of 0.08%. At this concentration, the hydrophobic functional groups are moderately concentrated, but not as densely packed as at 0.05% and 0.2%. As a result, the interaction between the solution molecules and water molecules is weaker compared to 0.05% and 0.2%. This weaker interaction allows for a relatively higher loss of water from the solution, resulting in the highest total mass lost among the concentrations tested. The table shows that the best water retention is achieved at solution concentrations of 0.05% and 0.2%, where the least mass is lost, while the worst water retention is achieved at a concentration of 0.08%, where the most mass is lost.
As can be seen in Figure 7, the total mass lost from the solution in the water retention experiment fluctuates up and down in the form of increasing solution concentration, reaching a trough at solution concentrations of 0.03%, 0.08% and 0.1%. Among them, when the concentration of the solution is 0.03%, the total mass lost is the least, 10.0909 g, followed by the total mass lost at the concentration of 0.08%, 10.3259 g, and at the concentration of 0.3%, the solution loses the most total mass, 15.4086 g. The least mass was lost and the best water retention was achieved at 0.03% and 0.08% solution concentrations, while the most mass was lost and the worst water retention was achieved at 0.3% solution concentration.
As can be seen in Figure 7c, the total mass lost from the solution in the water retention experiment fluctuates up and down with increasing solution concentration, reaching a trough at solution concentrations of 0.03%, 0.08%, and 0.1%. Among them, when the concentration of the solution was 0.03%, the total mass lost was the least, at 10.0909 g, followed by the total mass lost at a concentration of 0.08%, which was 10.3259 g, and at a concentration of 0.3%, the solution lost the most total mass, at 15.4086 g.
As can be seen in Figure 7d, the total mass lost from the solution in the water retention experiment fluctuates up and down as the solution concentration increases, reaching troughs at solution concentrations of 0.08% and 0.3% and peaking at a concentration of 0.06%. The total mass lost is the least at a concentration of 0.3%, with a value of 12.3719 g, followed by 13.9915 g at a concentration of 0.08%, and 16.4639 g at a concentration of 0.06%. The best water retention and the least mass lost were achieved at solution concentrations of 0.3% and 0.08%, respectively, while the worst water retention and the most mass lost were observed at a solution concentration of 0.06%.
Non-ionic fluorocarbon solutions contain hydrophobic functional groups, typically composed of carbon and fluorine atoms. These functional groups have a low affinity for water, leading to the formation of a hydrophobic environment within the solution. This hydrophobicity affects the ability of the solution to retain water. When the solution concentration is low, such as at 0.01% and 0.03%, the hydrophobic functional groups are relatively dilute. As a result, there is limited interaction between the solution molecules and water molecules. This leads to a relatively high loss of water from the solution, resulting in higher total mass lost. At concentrations of 0.05% and 0.2%, the hydrophobic functional groups become more concentrated, creating a denser hydrophobic environment. This increased concentration enhances the interaction between the solution molecules and water molecules, reducing the overall loss of water from the solution. Consequently, these concentrations exhibit better water retention, with the least mass lost compared to other concentrations tested.

3.3. Analysis of Surface Morphological Changes in Coal Dust Samples after the Experiment

3.3.1. Analysis of Coal Dust Surface Morphology after the Action of Non-Ionic Fluorine-Containing Solution

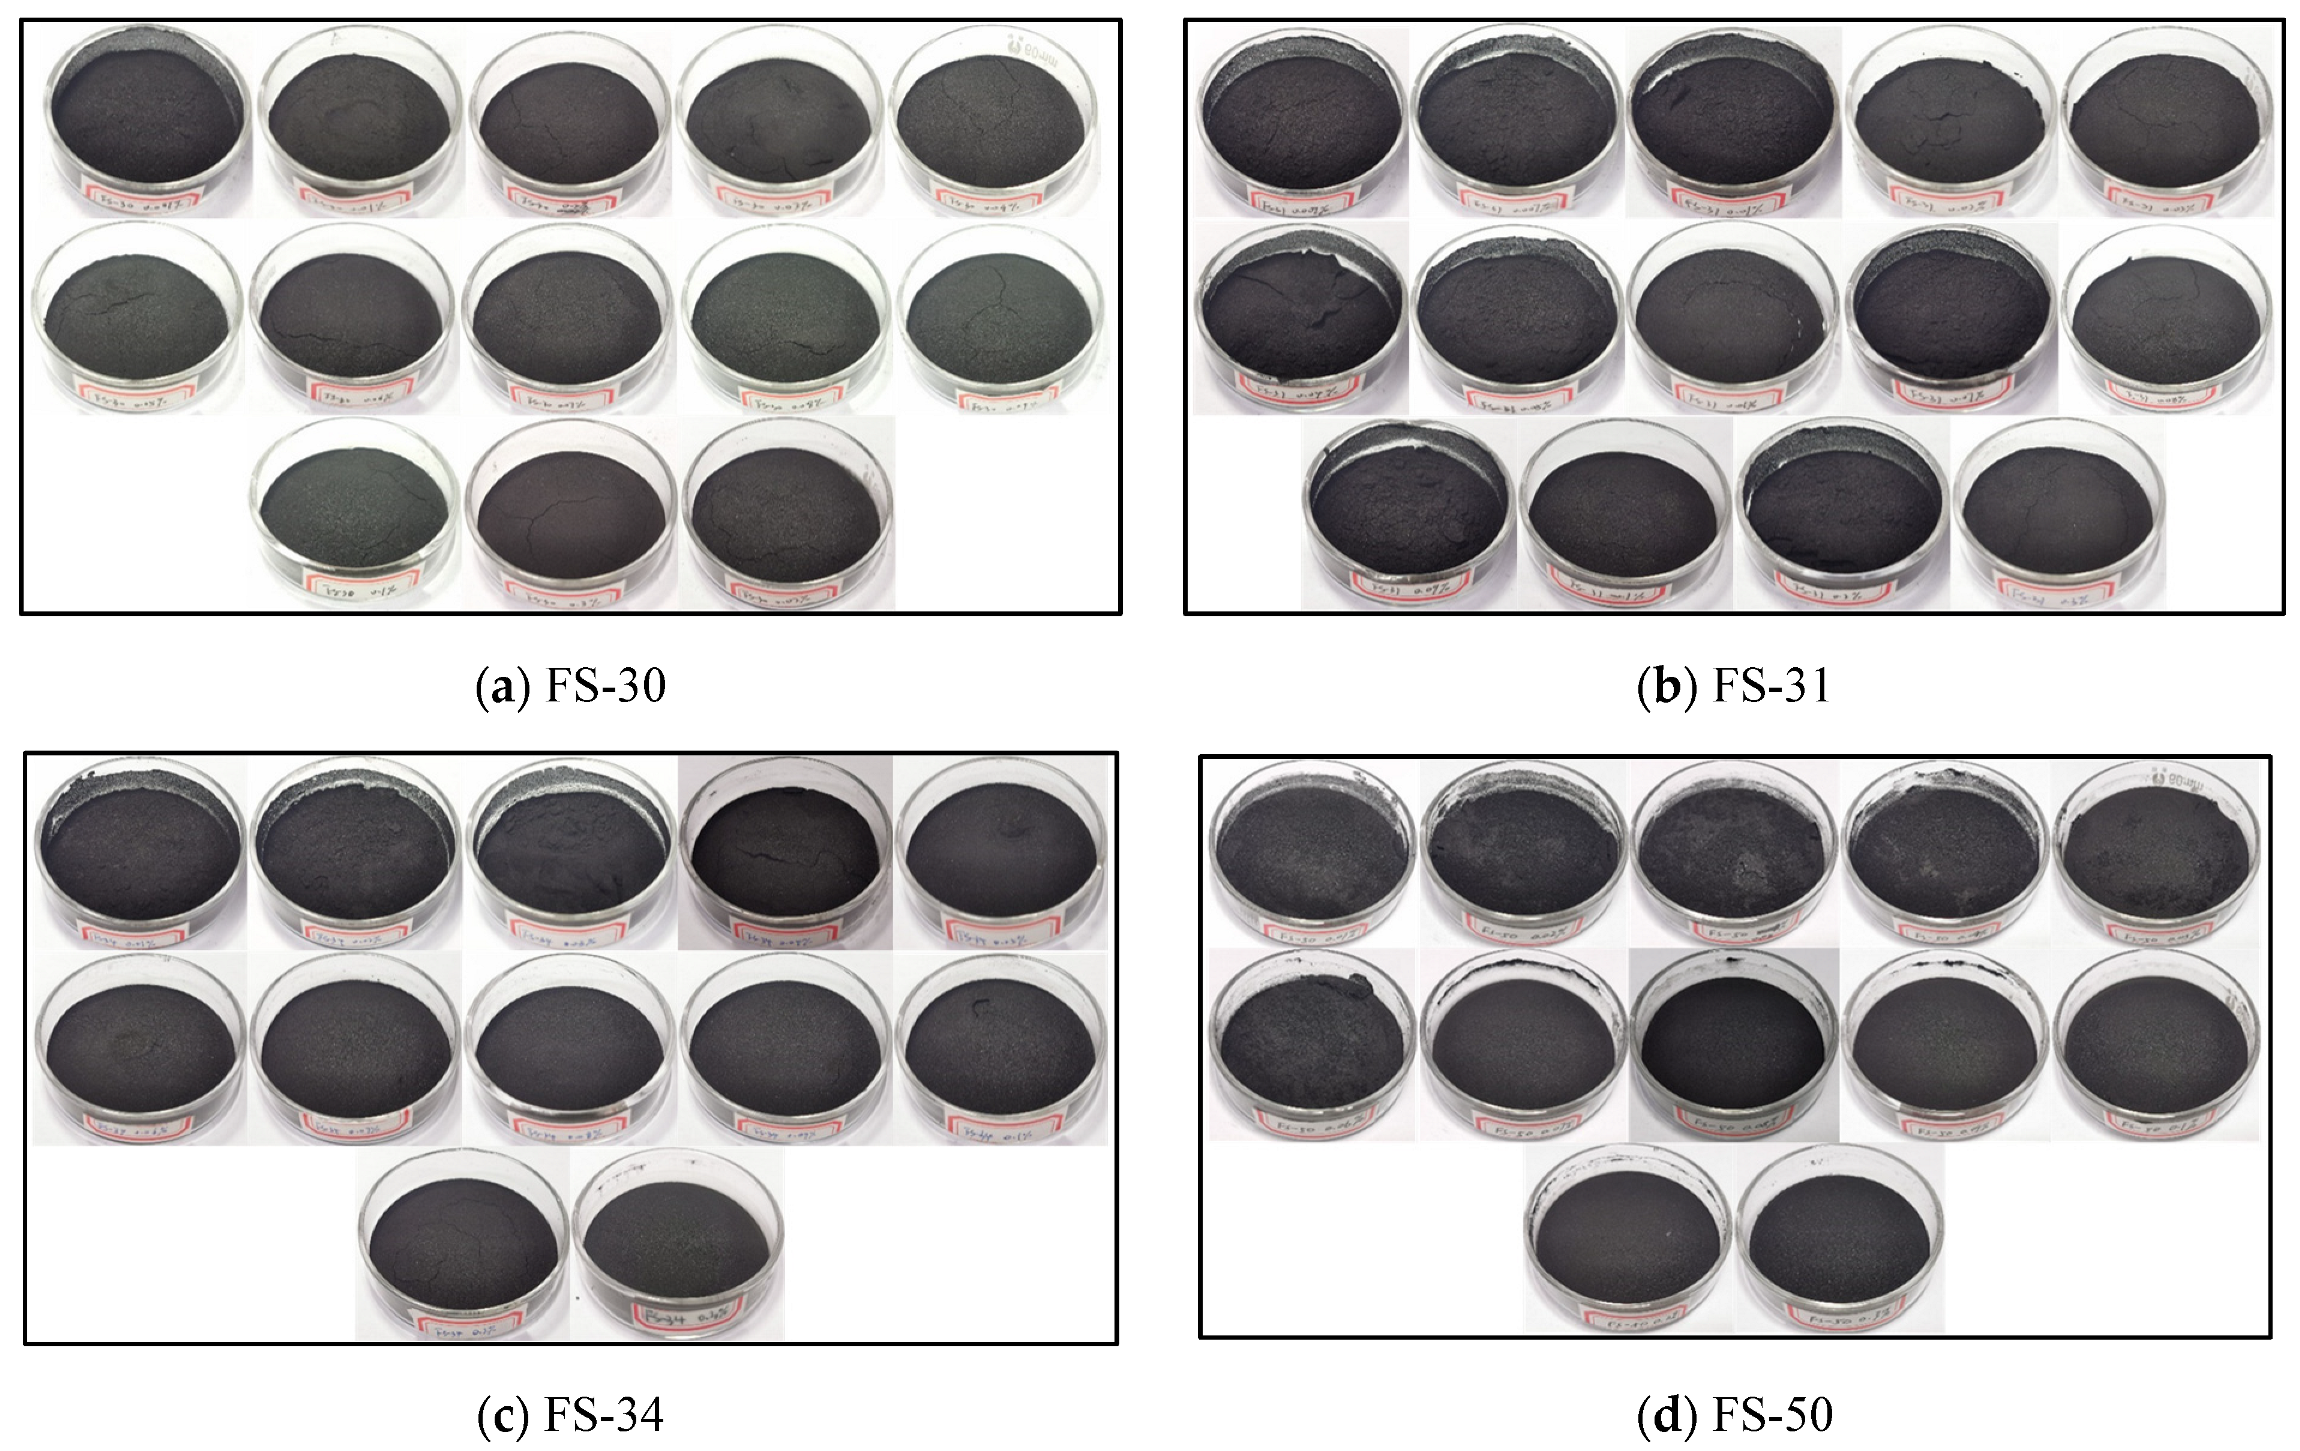
Figure 8a shows the state of the FS-30 fluorinated solution after 48 h of action on coal dust. At a concentration of 0.001%, coal dust attached to the wall of the glass dish, but this did not occur at other concentrations. The surface of the experimental coal sample still had a lot of unwetted coal dust. At a concentration of 0.01%, the surface of the coal sample still had obvious particle sensation. With the increase in concentration, no obvious loose particles were observed on the surface of coal samples, which showed a dense and uniform morphology, and all appeared as fine small cracks. Figure 8b shows the state of the FS-31 fluorine solution after 48 h of action on coal dust. Loose coal dust particles still exist on the surface of coal dust at low concentrations, but this does not occur at other concentrations. A lot of unwetted coal dust was still present on the surface of the experimental coal sample. At a concentration of 0.01%, the surface of the coal sample also had a distinct granularity. With the increase in concentration, no obvious loose particles were observed on the surface of coal samples, which showed a dense and uniform morphology, and all appeared as fine small cracks. Figure 8c shows the state of the FS-34 fluorinated solution acting on coal dust after 48 h. As shown in Figure 9, at lower concentrations of 0.01%, 0.02%, and 0.03%, coal dust attached to the wall of the glass dish, but this did not occur at other concentrations. There is more loose granular coal dust on the surface of coal dust. This indicates that at lower concentrations, the surface energy of the solution is low, making the coal dust samples fail to be completely wetted. With the increase in concentration, at a concentration of 0.04%, the surface of the coal sample obviously became denser, but a small crack appeared on the surface. With the increase in concentration, no obvious loose particles were observed on the surface of the coal sample, which showed a dense and uniform morphology, and no small cracks appeared.
In Figure 8d, at concentrations of 0.01%, 0.02%, 0.03%, and 0.04%, coal dust attached to the wall of the glass dish, but this was not obvious at other concentrations. With the increase in concentration, the surface of the six experimental coal samples between 0.07% and 0.3% were dense and homogeneous, without obvious bulk particles, and without the appearance of cracked fine lines. Collectively, it seems that the wetting and water retention of the experimental coal sample surface increased significantly with the increase in solution concentration.

3.3.2. Analysis of Coal Dust Surface Morphology after the Action of Anionic Fluorine-Containing Solution

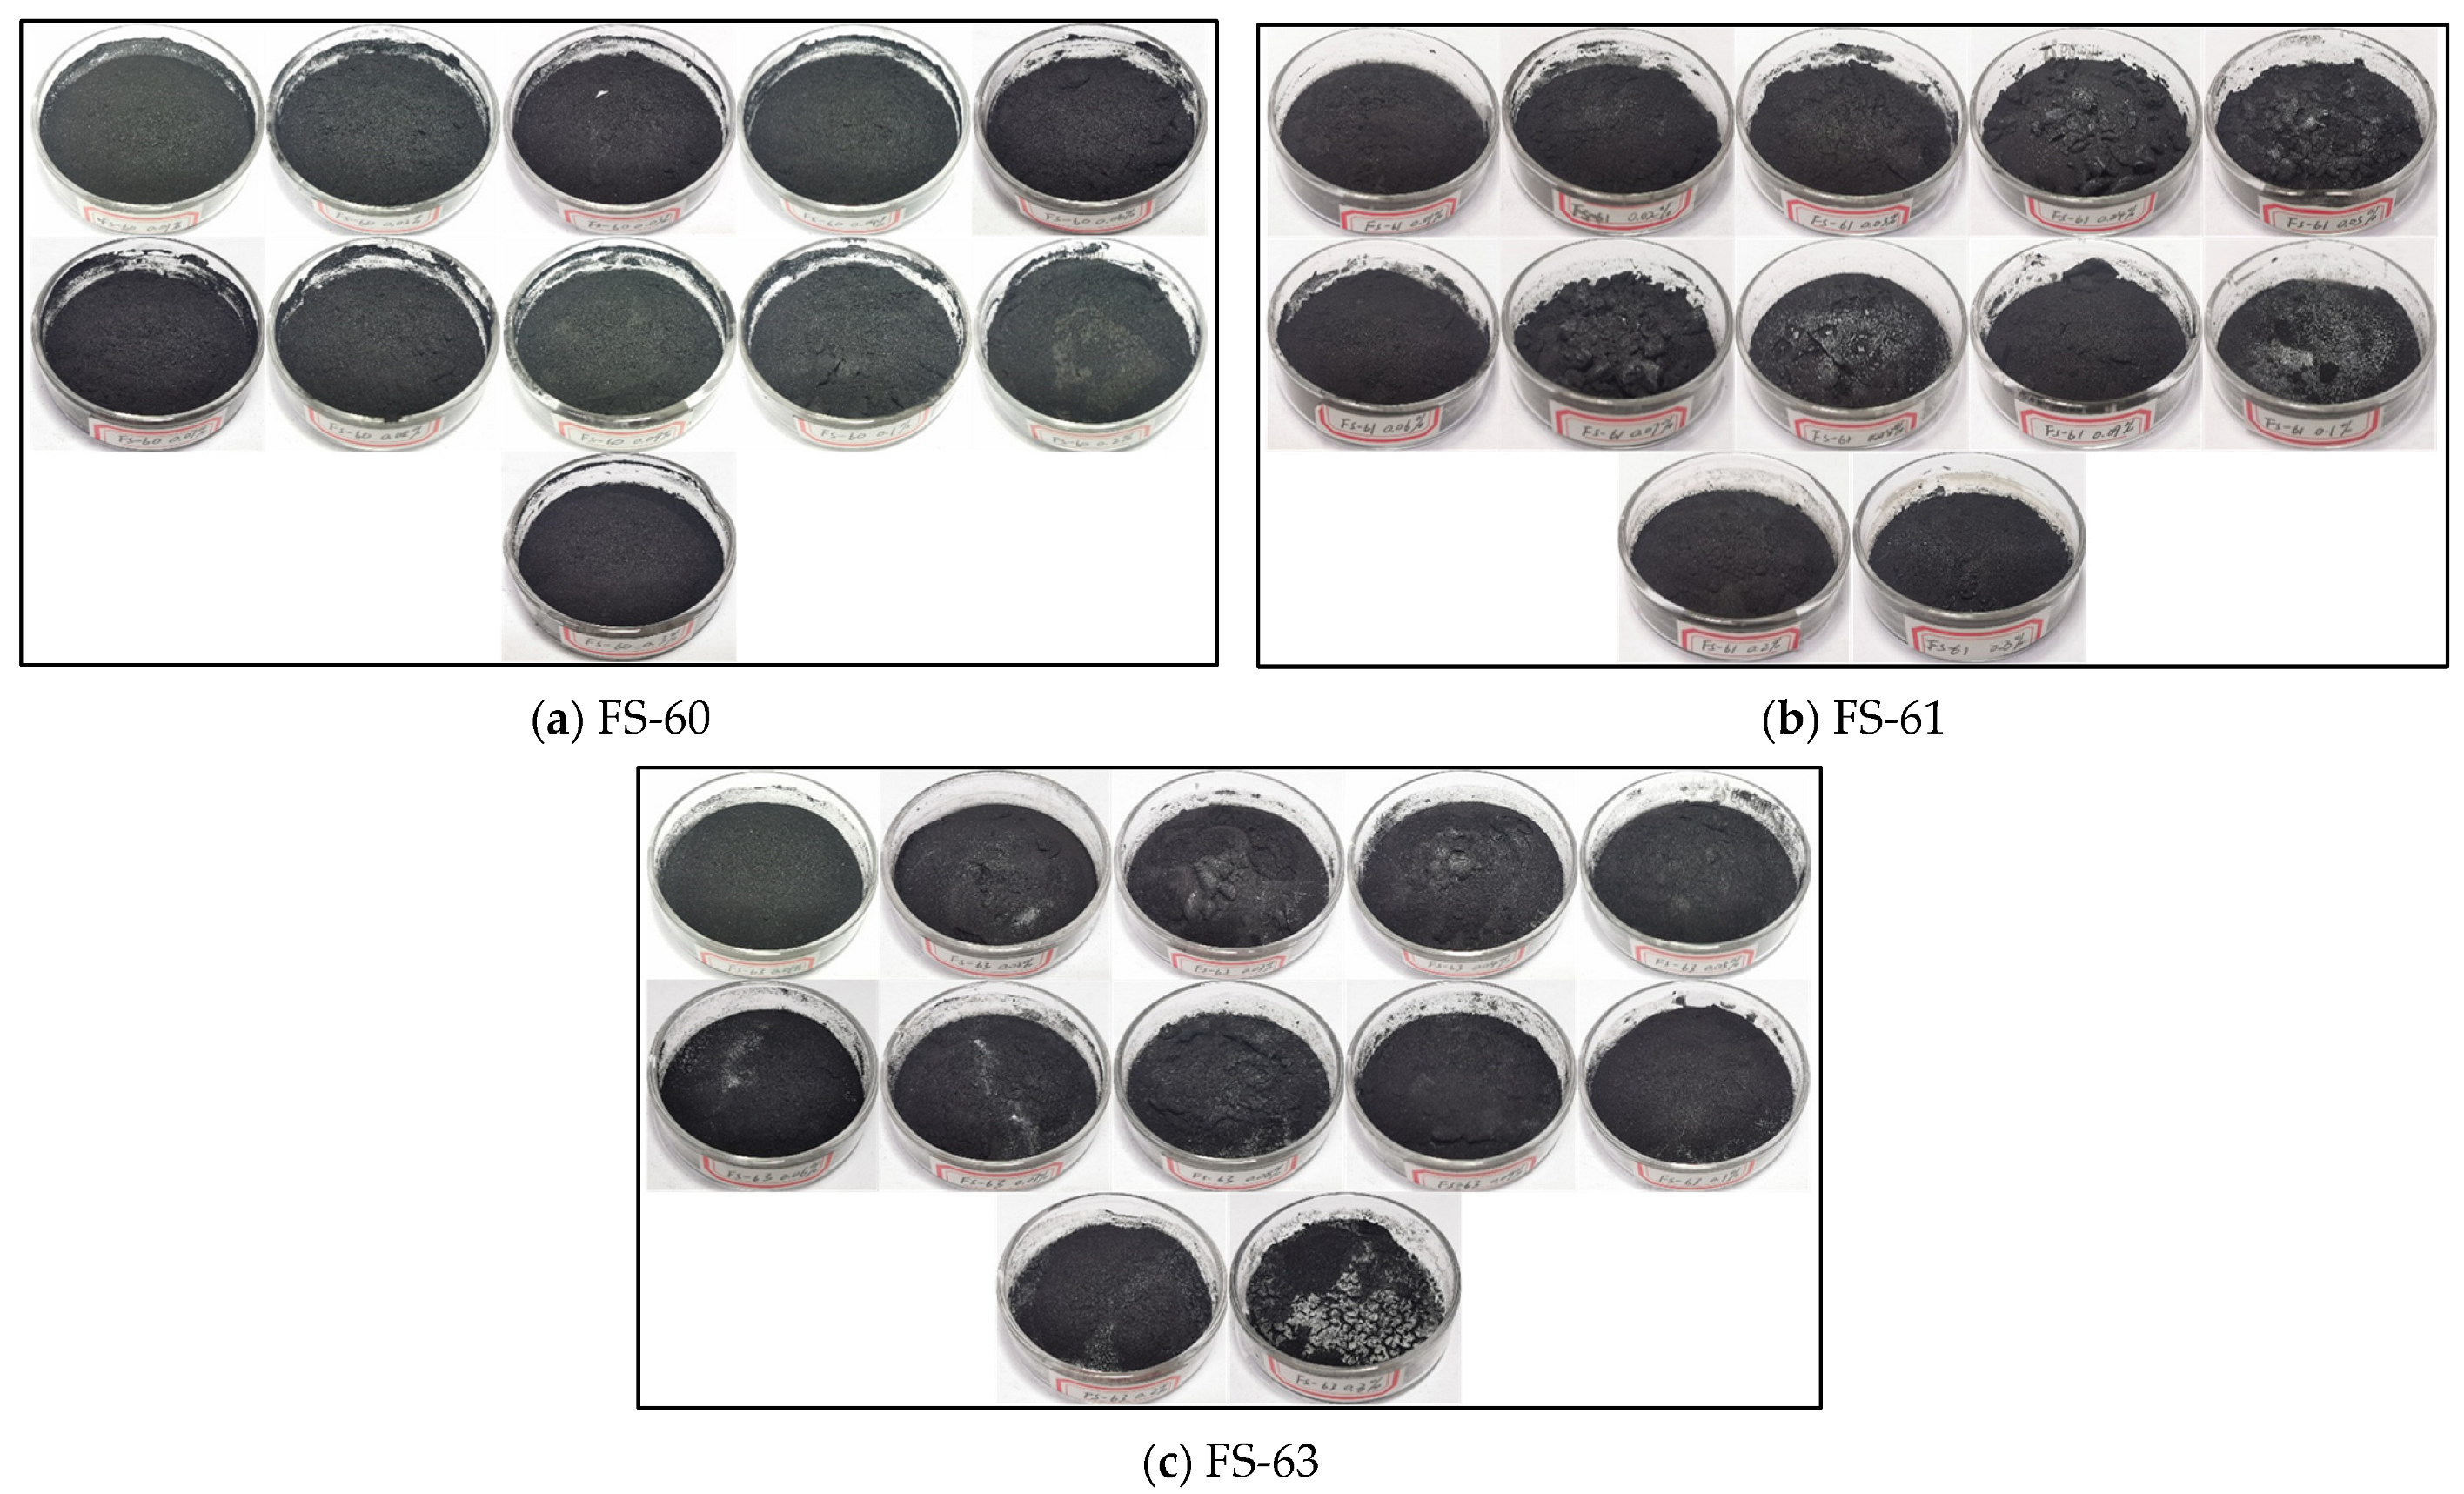
Figure 9a shows the state of FS-60 fluorinated solution acting on coal dust after 48 h. As shown in Figure 9a, coal dust was attached to the walls of the glass dishes of the coal samples at each concentration. Compared with the coal samples of other concentrations, the surface of the experimental coal samples with a concentration of 0.3% was denser and uniform, without obvious particles and cracks, and the wetting effect was better. At concentrations of 0.02%, 0.03%, 0.04%, and 0.05%, there was also an obvious sense of granularity on the surface of the coal samples, and the amount of loose coal dust particles on the surface increased significantly at the concentration of 0.1%.
Figure 9b shows the state of FS-61 fluorine solution in coal dust after 48 h. As shown in Figure 9b, at a concentration of 0.01%, the glass dish and the surface of coal dust had no obvious attachment or white material, but with the increase in concentration, the surface of coal dust had obvious white material attached to the surface of coal samples, as well as uneven lumpy particles, at concentrations of 0.04%, 0.05%, and 0.07%. This may occur because there are many undissolved flocs in the solution that are not completely wetted during the mixing process with the coal dust.
Figure 9c shows the state of FS-63 fluorinated solution acting on coal dust after 48 h. As shown in the Figure 9c, the surface consolidation of coal dust with a concentration of 0.01% is the most uniform and dense compared with other concentrations of coal samples. As the concentration increases, a slight white powder-like substance adheres to the surface of the coal dust. At a concentration of 0.3%, the white matter has the most mass, and there are many loose coal dust particles on the surface. Additionally, many unwetted and condensed coal dust bubbles are present on the surface of the experimental coal samples at concentrations of 0.03%, 0.04%, 0.08%, and 0.09%.

3.4. Analysis of Water Retention of Coal Dust by Different Fluorine-Containing Solutions

The fluorine-containing surfactants can interact with the surface of the coal dust particles through weak van der Waals forces, hydrogen bonding, and electrostatic interactions. When these surfactants are added to water, they form micelles, which are tiny clusters of molecules that can solubilize and emulsify hydrophobic substances, such as coal dust.
In the case of non-ionic fluorinated solutions, the surfactants contain hydrophobic and hydrophilic regions, allowing them to form stable micelles in water. These micelles can adsorb onto the surface of coal dust particles, reducing the surface energy and making the coal dust particles more hydrophilic. This leads to an increase in the wettability of the coal dust particles, allowing them to absorb water and retain moisture more readily. On the other hand, anionic fluorinated solutions contain surfactants that have a negative charge in water. These surfactants can also adsorb onto the surface of coal dust particles, but their negative charge can repel water molecules, leading to a decrease in wettability and water retention. This is because the negative charges on the surfactant molecules create an electrostatic barrier that prevents water molecules from interacting with the surface of the coal dust particles.

4. Conclusions

By studying the effect of water retention of fluorinated surfactant solutions, a preliminary range of optimum values of fluorinated solutions affecting the water retention of coal dust at different concentrations of different species was derived, leading to the following conclusions.
(1)
The water retention of non-ionic fluorinated solutions is significantly better than that of anionic fluorinated solutions, and water retention performance gradually increases with increasing concentration within a certain range. Among the four non-ionic fluorinated solutions, FS-30 solution has the better overall water retention, followed by FS-31 solution, FS-34 solution, and FS-50 solution.
(2)
To meet the requirements for water retention of coal dust, the optimum concentration of anionic fluoride containing solution FS-30 is preferably 0.05%, and the optimum concentration of anionic fluoride solution FS-31 is 0.03%. The optimum concentration of the anionic fluoride solution FS-34 is 0.03%. The optimum concentration of anionic fluoride solution FS-50 is 0.3%. The optimum concentration of 0.07% for non-ionic fluoride solution FS-60. The optimum concentration is 0.3% for non-ionic fluoride solution FS-61. The optimum concentration is 0.08% for non-ionic fluoride solution FS-63.
(3)
The surface morphology of the coal dust after the solution action can be analyzed, the surface of the coal dust after the action of the non-ionic fluorine solution is more compact and detailed, and with the increase in concentration, the surface of the graininess is less obvious. FS-50 solution showed a better effect among the four non-ionic fluorine solutions, the surface of the coal dust samples showing no obvious cracks or fine lines. This indicates that the wetting and agglomeration properties of the non-ionic fluoride-containing solutions are better than those of the anionic fluoride-containing solutions.
(4)
The water loss at different time periods shows that the four non-ionic fluoride solutions and the anionic fluoride solutions FS-60 and FS-63 all have the highest water loss in the 24–36 h time period, while the anionic fluoride solution FS-61 has the highest water loss in the 36–48 h time period. Therefore, to prevent the risk of secondary dusting, emphasis should be placed on timely wetting of coal dust agglomerates at 24 h and 36 h after the solution has been applied to the coal dust.
(5)
Overall, the regularity results show that the concentration and type of fluorinated solution used can significantly influence the water retention of coal dust. The non-ionic fluorinated solution FS-50 with a concentration of 0.3% appears to be the most effective at increasing water retention, likely due to the formation of stable micelles that reduce the surface energy and increase the wettability of the coal dust particles.

Author Contributions

Conceptualization, K.W. and B.Z.; data curation, M.X. and M.Y.; writing—original draft preparation, M.X. and M.Y.; writing—review and editing, M.X.; visualization, X.L.; supervision, Q.Y. All authors have read and agreed to the published version of the manuscript.

Funding

This work was supported by the Key R&D Program of Sichuan (2022YFS0529), the Key R&D Program of Jiangxi (20212BBG73010), the Fundamental Research Funds for the Central Universities (2022JCCXAAQ01), the Science and Technology Foundation of Guizhou Province ([2022]General250), the State Key Laboratory Cultivation Base for Gas Geology and Gas Control (Henan Polytechnic University (WS2021A01) and the College Students’ Innovative Entrepreneurial Training Plan Program (202212005).

Institutional Review Board Statement

Not applicable.

Informed Consent Statement

Not applicable.

Data Availability Statement

The data presented in this study are available on request from the corresponding author. The data are not publicly available due to some authors’ personal privacy and legal restrictions.

Conflicts of Interest

The authors declare no conflict of interest.

References

  1. Li, Q.; Tao, Q.; Yuan, C.; Zheng, Y.; Zhang, G.; Liu, J. Investigation on the structure evolution of pre and post explosion of coal dust using X-ray diffraction. Int. J. Heat Mass Transf. 2018, 120, 1162–1172. [Google Scholar] [CrossRef]
  2. Xi, Z.; Jin, L.; Liew, J.R.; Li, D. Characteristics of foam sol clay for controlling coal dust. Powder Technol. 2018, 335, 401–408. [Google Scholar] [CrossRef]
  3. Wang, P.; Tan, X.; Zhang, L.; Li, Y.; Liu, R. Influence of particle diameter on the wettability of coal dust and the dust suppression efficiency via spraying. Process Saf. Environ. Prot. 2019, 132, 189–199. [Google Scholar] [CrossRef]
  4. Yu, H.; Wang, C.; Pang, L.; Cui, Y.; Chen, D. Inhibiting effect of coal fly ash on minimum ignition temperature of coal dust clouds. J. Loss Prev. Process Ind. 2019, 61, 24–29. [Google Scholar] [CrossRef]
  5. Chang, P.; Zhao, Z.; Xu, G.; Ghosh, A.; Huang, J.; Yang, T. Evaluation of the coal dust suppression efficiency of different surfactants: A factorial experiment. Colloids Surf. A Physicochem. Eng. Asp. 2020, 595, 124686. [Google Scholar] [CrossRef]
  6. Xiaonan, W. Study on Synergistic Effect of Surfactant Compound on Coal Dust Wettability. Ph.D. Thesis, Anhui University of Science& Technology, Huainan, China, 2020. [Google Scholar]
  7. Liu, X.; Chang, P.; Wang, E.; Zhang, Z.; Yang, S. Numerical study of the respirable coal dust removal performance of a vortex ventilation system at an excavation face. Energies 2018, 11, 2449. [Google Scholar] [CrossRef] [Green Version]
  8. Zhou, Q.; Qin, B.; Wang, J.; Wang, H.; Wang, F. Experimental investigation on the changes of the wettability and surface characteristics of coal dust with different fractal dimensions. Colloids Surf. A Physicochem. Eng. Asp. 2018, 551, 148–157. [Google Scholar] [CrossRef]
  9. Jin, H.; Zhang, Y.; Chen, K.; Niu, K.; Wu, G.; Wei, X.; Wang, H. Preparation and characterization of a composite dust suppressant for coal mines. Polymers 2020, 12, 2942. [Google Scholar] [CrossRef]
  10. Cheng, J.; Wang, Y.; Lei, Y.; Zheng, X.; Luo, W.; Song, W.; Wang, Z.; Han, F. Study on coal dust crusting for coal pile based on a compound binder. Powder Technol. 2020, 376, 149–166. [Google Scholar] [CrossRef]
  11. Yunlong, M. Experimental Study on Compound Dust Suppressor for Mine Based on Molecular Modification Technology. Master’s Thesis, Shandong University of Science and Technology, Qingdao, China, 2019. [Google Scholar]
  12. Liang, W.J.; Lan, T.; Zhang, Z.X.; Ren, S.D.; Wang, Y.L. Preparation and application of new environmental protection coal dust suppressor. China Coal 2021, 47, 57–65. [Google Scholar] [CrossRef]
  13. Hu, J. Development and Performance of Compound Environmental Dust Suppressor. Master’s Thesis, Shandong University of Science and Technology, Qingdao, China, 2019. [Google Scholar]
  14. Tao, F. Experimental Study on Environmental Protection Molecular Modified Dust Suppressor for Mine. Master’s Thesis, Shandong University of Science and Technology, Qingdao, China, 2018. [Google Scholar]
  15. Hetang, W.; Sheng, H.; Qi, Z.; Xia, Z. Experimental study on synthesis of biological dust suppressor by microbial fermentation. J. China Coal Soc. 2021, 46, 477–488. [Google Scholar]
  16. Li, S.; Tian, J.; Xie, H.; Ma, Y.L. Study on preparation of wetting dust suppressor from paper waste and its properties. Saf. Coal Mines 2019, 50, 14–16+20. [Google Scholar] [CrossRef]
  17. Yaheng, P.; Jian, C.; Jian, W.; Chunhui, P. Preparation and properties of chitosan—Based dust suppressor. Coal Chem. Ind. 2021, 44, 123–126. [Google Scholar] [CrossRef]
  18. Li, J.; Sun, S.; Wang, Y.; Wang, Z. Experimental study on coal dust pollution law of railway tunnel. J. Lanzhou Jiaotong Univ. 2005, 24, 52–54. [Google Scholar]
  19. Li, K.; Yang, L.; Jiang, F.; Tang, Y. Preparation and study of modified lignosulfonate dust suppressor for coal. Environ. Eng. 2012, 30, 66–69. [Google Scholar] [CrossRef]
  20. Jia, Z.A.; Jihong, S.; Chao, W.; Jianglong, C. Preparation and property analysis of compound environmental dust suppressor for mine. Coal Chem. Ind. 2021, 44, 94–98. [Google Scholar] [CrossRef]
  21. Frey, F.; Weidner, E.; Pedersen, B.; Boysen, H.; Burghammer, M.; Hoelzel, M. Pyroxene from martian meteorite nwa856: Structural investigations by x-ray and neutron diffraction. Z. Für Krist. 2010, 225, 287–297. [Google Scholar] [CrossRef]
  22. Zilei, W.; Xiaoming, J. Properties of fluorinated surfactants and the effect of melon ring on their properties. Chem. Res. Appl. 2022, 34, 2114–2120. [Google Scholar]
  23. Yutang, Z.; Yujia, T.; Yong, J. Research progress in the synthesis and application of fluorinated surfactants. Leather Sci. Eng. 2020, 30, 26–32. [Google Scholar] [CrossRef]
  24. Kronlund, D.; Bergbreiter, A.; Meierjohann, A.; Kronberg, L.; Lindén, M.; Grosso, D.; Smått, J.-H. Hydrophobization of marble pore surfaces using a total immersion treatment method—Product selection and optimization of concentration and treatment time. Prog. Org. Coat. 2015, 85, 159–167. [Google Scholar] [CrossRef]
  25. Xu, Z.; Peng, S.; Zhou, H.; Guo, Y.; Zhou, G.; Xu, X. Progress in synthesis and electrowettability of fluorine-containing polymer coatings. Mater. Guide 2022, 36, 235–249. [Google Scholar]
  26. Liu, N.; Yu, Z.; Liang, Y.; Zhang, H. Effects of mixed surfactants on heat transfer performance of pulsed spray cooling. Int. J. Heat Mass Transf. 2019, 144, 118593. [Google Scholar] [CrossRef]
  27. Liu, N.; Yu, Z.; Zhu, T.; Yin, X.; Zhang, H. Effects of microstructured surface and mixed surfactants on the heat transfer performance of pulsed spray cooling. Int. J. Therm. Sci. 2020, 158, 106530. [Google Scholar] [CrossRef]
  28. Xiaoyan, L.; Fodi, W.; Yin, Z.; Quanhong, H. Structure and properties analysis of medium—Resistant liquid fluorinated elastomers. J. Compos. 2022, 39, 1592–1600. [Google Scholar] [CrossRef]
  29. Yi, M.; Hong, S.; Kim, J.-R.; Kang, H.; Lee, J.; Yu, K.; Kee, S.; Lee, W.; Lee, K. Modification of a pedot:Pss hole transport layer for printed polymer solar cells. Sol. Energy Mater. Sol. Cells 2016, 153, 117–123. [Google Scholar] [CrossRef]
  30. Chuanrong, Z.; Xiangcheng, W.; Guangyu, Z.; Xiaogang, W. Surface, interfacial activity and wettability of sulfonate fluorinated surfactants. Oilfield Chem. 2020, 37, 701–706. [Google Scholar] [CrossRef]
  31. Kun, W.; Xiaoming, J. Effect of light on surface properties of fluorinated surfactants. Image Sci. Photochem. 2021, 39, 492–496. [Google Scholar]
  32. Lei, L.; Yanling, W.; Bin, L.; Yongfei, L.; Longhao, T. Preparation of fluoropolymer emulsion and its application at solid-liquid interface. Mater. Guide 2021, 35, 586–593. [Google Scholar]
  33. Zhichao, H.; Hui, L.; Tingjian, Z.; Xiaonan, L. Research and application progress of waterborne fluorine-containing coatings. Yunnan Chem. Ind. 2021, 48, 21–26. [Google Scholar]
  34. Goryeo, W.; Rui, J.X.; Yunzi, L. Applications of synthetic biology in the production of fluorine-containing compounds. Synth. Biol. 2020, 1, 358–371. [Google Scholar]
  35. Yichao, S.; Xiaoling, Z.; Yong, J. Progress in synthesis and application of nonionic fluorinated surfactants. Leather Sci. Eng. 2018, 28, 24–31. [Google Scholar] [CrossRef]
  36. Lu, Z.; Lei, Z.; Zafar, M.N. Synthesis and performance characterization of an efficient environmental-friendly sapindus mukorossi saponins based hybrid coal dust suppressant. J. Clean. Prod. 2021, 306, 127261. [Google Scholar] [CrossRef]
  37. GB/T 212-2008; Proximate Analysis of Coal. China Coal Industry Association: Beijing, China, 2019.
Figure 1. Water retention test procedure.
Applsci 13 09118 g001
Figure 2. Trend of coal dust weight with time under the action of non-ionic fluorinated solution.
Applsci 13 09118 g002
Figure 3. Water loss of FS-60, FS-61, FS-63 solution at different concentrations and different time periods.
Applsci 13 09118 g003
Figure 4. Total water loss of FS-60, FS-61, FS-63 solution at different concentrations.
Applsci 13 09118 g004aApplsci 13 09118 g004b
Figure 5. Weight variation of coal dust at different concentrations and times in the presence of anionic fluorinated solutions.
Applsci 13 09118 g005
Figure 6. Water loss of FS-30, FS-31, FS-34, FS-50 solution at different concentrations and different time periods.
Applsci 13 09118 g006
Figure 7. Total water loss of FS-30, FS-31, FS-34, FS-50 solution at different concentrations.
Applsci 13 09118 g007aApplsci 13 09118 g007b
Figure 8. Consolidation of coal dust surface with FS-30, FS-31, FS-34, FS-50 solution at different concentrations.
Applsci 13 09118 g008
Figure 9. Consolidation of coal dust surface after experiments with FS-60, FS-61, FS-63 solution at different concentrations.
Applsci 13 09118 g009
Table 1. Industrial analysis of coal samples.
Mad/%Ad/%Vd/%Cdaf/%
8.057.1728.2056.59
Table 2. Experimental fluorinated surfactants.
Experimental ReagentsShort FormActive ComponentMolecular FormulaType
Perfluoropropyl acrylateFS-3024–26%CH2=CHC(O)OC3F7Non-ionic
Perfluorooctyl acrylateFS-3124–26%CH2=CHC(O)OC8F17Non-ionic
Perfluorooctylsulfonyl phenoxyethyl methacrylateFS-3424–26%C8F17SO2OC6H4OHNon-ionic
Perfluoropropanoic acidFS-5026–28%CF3CF2COOHNon-ionic
Sodium perfluorooctanesulfonateFS-60 a39–41%C8F17SO3NaAnionic
Perfluoroisopropyl acrylateFS-6113–15%C4F9COOCH3Anionic
Perfluorooctanesulfonate carbamate acidFS-63 b34–36%C9H6F17NO2SAnionic
a: 15% isopropyl alcohol; b: 20% isopropyl alcohol.
Disclaimer/Publisher’s Note: The statements, opinions and data contained in all publications are solely those of the individual author(s) and contributor(s) and not of MDPI and/or the editor(s). MDPI and/or the editor(s) disclaim responsibility for any injury to people or property resulting from any ideas, methods, instructions or products referred to in the content.