Abstract
Aviation significantly contributes to anthropogenic radiative forcing with both CO and non-CO emissions. In contrast to technical advancements to mitigate the climate impact, operational measures can benefit from short implementation times and thus are expected to be of high relevance in the near future. This study evaluates the climate mitigation potential of nine operational improvements, covering both in-flight and ground operations. For this purpose, an innovative approach is presented to compare the results of measure-specific case studies, despite the wide differences in the underlying modeling assumptions and boundary conditions. To this end, a selection of KPIs is identified to estimate the impact of the studied operational improvements on both climate and the stakeholders of the air transport system. This article presents a comparative method to scale the results of the individual studies to a comparable reference, considering differences in traffic sample size as well as CO and non-CO climate effects. A quantitative comparison is performed for operational improvements belonging to the same category, i.e., trajectory-related, network-related, and ground-related measures, and a qualitative comparison is carried out among all considered operational improvements. Results show that the in-flight operational improvements are more effective in mitigating the impact on climate with respect to ground operations. However, the latter generally have a weaker impact on the aviation industry and a higher maturity level. Further research could expand this study by assessing the effects of implementation enablers, such as actions at the regulatory level, to facilitate the acceptance of the studied measures in the aviation industry.
1. Introduction
Anthropogenic contribution to greenhouse gases in the atmosphere has increased significantly in the last century leading to a rise in radiative forcing (RF). Consequently, a raise in the global surface temperatures results in a variety of changes in the climate system, including, e.g., sea level rise, modifications in the precipitation patterns, and more frequent extreme weather events [1,2]. In this context, aviation plays an important role in emitting carbon dioxide (CO) and non-CO species such as nitrogen oxides (NO) and water vapor (HO) into the atmosphere. The effects resulting from non-CO emissions such as NO-induced ozone (O) and methane (CH) changes or contrail-induced cirrus (CiC) are estimated to contribute to the majority of the total RF of aviation emissions [3,4]. Hence, ambitious goals have been set for the aviation industry to increase fuel efficiency and to reduce the climate impact from both CO and non-CO emissions [5,6,7]. Nevertheless, previous analyses have shown that current regulations and measures from the aviation sector do not suffice to comply with the goals that have been defined by the Paris agreement [8]. Thus, the realization of an extensive set of additional measures from the technical, operational, and regulatory sides will be required.
Technical climate mitigation measures typically aim to enhance fuel efficiency, e.g., through lower weights, higher lift-to-drag ratios, or improvements of thrust-specific fuel consumption [9,10]. More radical approaches target innovative engine concepts, e.g., hydrogen or battery-electric propulsion, as well as sustainable alternative fuels [9,11]. However, radically innovative technical measures are not expected to enter into service on a larger scale in the next decade. In addition, technical approaches mostly aim for a reduction in fuel burn as well as associated CO emissions and might neglect significant non-CO effects [12,13], as these non-CO effects are not necessarily proportional to fuel consumption but also influenced by emission location and time [3,4]. In contrast to technical approaches, operational measures can be implemented without major adjustments to the current air transport fleet and thus benefit from short realization times. Also, non-CO effects can directly be addressed by such operational measures. Hence, operational climate mitigation measures are expected to play an important role in the short term to reach the defined climate goals before technical innovations can be implemented on a large scale [5,7].
The current state of literature comprises various studies on individual operational measures to reduce the climate impact of aviation, e.g., [14,15,16,17,18,19,20], which can be categorized into three types of measures:
- Trajectory optimization including in-flight measures that reduce the climate effect along trajectories by re-routing or improving procedures without changing the investigated flight network itself. The climate impact can directly be related to one individual mission. Exemplary measures are weather-optimized flight planning [21,22], climate-optimized trajectories [17,23,24], flying at reduced altitudes and speeds [14,25,26], direct or wind-optimal routing [21,27], continuous climb and descent operations [21,28], and routing optimization for contrail avoidance [16,29].
- Climate-optimized operation of airline networks comprising in-flight measures that affect the network for example by changes in the network flight schedule, where reduction in the climate impact is not directly related to one individual mission. This includes approaches such as Formation flight [19], Intermediate Stop Operations (ISO) [15,30] and climate-aware network design and planning [31,32,33], e.g., by merging or separating flights, reassigning aircraft, frequencies, and creating optimal hub-and-spokes or point-to-point operations.
- Operational measures on-ground being implemented at the airport both air- and land-side including, for instance, the upgrade of existing airport infrastructure according to energy-efficiency criteria [34], sustainable taxi operations, e.g., by switching to single-engine, electric, or hybrid solutions [21,35,36], electrification of ground vehicles [37,38], or producing renewable energy at airports [39].
Typically, the results from different individual studies in terms of climate mitigation potentials are not directly comparable to each other. This is due to different definitions of the reference system used in the modeling process regarding spatial and temporal scope, considered fleet and airports, incorporated missions and atmospheric boundary conditions as well as varying modeling assumptions. However, a direct comparison is required to identify the most effective mitigation measures, to support their implementation, and to realize their potential to reduce the climate impact of aviation. The development of adequate regulations and policies to implement such mitigation measures and to achieve the defined climate goals also calls for a comparative assessment of the different mitigation approaches. Furthermore, an efficiency assessment of the different measures combining ecological and economic consequences is required from an operator’s perspective for a reasonable implementation. While previous studies have already presented a detailed quantitative comparison of two operational measures based on similar boundary conditions and modeling assumptions, e.g., [16,25], analyses including several mitigation approaches have typically focused on a sole qualitative comparison of measures so far, e.g., [10,40,41]. Further work of research has looked at possible mitigation scenarios and pathways aggregating different mitigation measures but lacks a direct comparison of individual improvement means, e.g., [8,42].
This study presents a comparison of different operational measures to reduce the climate impact of aviation. Our goal is to identify especially effective and efficient approaches from a set of in-flight and ground-related improvements. We contribute to the current state of research, first, by summarizing mitigation potentials of different measures in a comparable way, second, by providing a comparative method to scale obtained results from individual measures to one common reference and, finally, by comparing different promising measures regarding their effectiveness and efficiency to mitigate the climate impact of aviation also considering the effects on the aviation stakeholders. For this purpose, the paper is organized as follows: Subsequent to this introduction (Section 1), we explain the applied methodology for comparing the different measures and describe the method application for different types of improvements in Section 2. The achieved results are presented in Section 3, before these are discussed with regards to comparability, the underlying uncertainties, and the measures’ applicability (Section 4). Section 5 summarizes the results and concludes with an outlook on further research.
This work is part of the EU Horizon 2020 Project on ‘Climate assessment of innovative mitigation strategies towards operational improvements in aviation (ClimOP)’, which aims to define promising mitigation strategies and regulatory recommendations based on a comprehensive climate assessment of different operational measures in aviation. In this context, both in-flight and on-ground operational measures are investigated and compared considering implementation on a European scale.
2. Comparative Method
A comparative method is developed to make mitigation potentials from different measure-specific studies comparable with one another. For this purpose, first, we identify promising measures to be compared (Section 2.1) and select the assessment metrics to be investigated (Section 2.2). Second, we present approaches to generalize and scale measure potentials to a comparable base (Section 2.3.1 and Section 2.3.2, respectively) and explain the utilized data and the application in the selected case studies (Section 2.4).
2.1. Operational Improvements to Be Compared
With the overall project goal to develop harmonized implementation strategies for different operational climate mitigation measures, a set of promising operational improvements (OIs) for the aviation sector is identified from the current state of literature. In an expert assessment in course of the ClimOP project, candidate OIs have been rated according to the following criteria [43]:
- Mitigation potential of the OI to significantly reduce the climate impact of aviation in terms of CO and non-CO emissions.
- Scientific relevance, i.e., the OI is discussed and considered promising in the specialized literature on climate change and aviation.
- Technological readiness, which directly affects the timescale of implementation in everyday operations and a low cost/benefit ratio of the implementation to facilitate the measures realization.
- Coverage of all areas of operations, namely the airport operations, the aircraft ground operations, and the aircraft operations at network and trajectory levels.
- Modeling feasibility, capability and expertise of involved parties of the project including the ability to model changes of the relevant operations, and to quantify the impact on the climate and the stakeholders.
Based on a long list of 25 operational climate mitigation measures, the expert rating led to the selection of 9 OIs of different types, which are investigated individually (selection details in [43,44]), before being compared to each other on a set of defined climate and non-climate key performance indicators (KPIs). The types of OIs, the specifically selected OIs, and their respective assessment approach are displayed in Table 1.

Table 1.
Overview on considered operational improvements per type.
Trajectory-related improvements are performed with different degrees of freedom, including reduced cruise altitudes and speeds (LOSL), free routing (FREE), wind-optimal flight planning (WIND) incorporating different objective functions, and climate-optimized trajectories (CLIM) integrating a four-dimensional optimization of trajectories. As these improvements significantly depend on day-specific mission characteristics and meteorological boundary conditions, a sample of representative days is investigated. Network-related improvements comprise strategic network optimization (NETW) with different objective functions and climate-optimized Intermediate stop operations (ISOC). As these OIs do not focus on individual flight missions, an aggregated approach is selected, where a yearly European network is analyzed based on climatological mean values. Among ground-related OIs, we consider sustainable taxi operations (SETX), electrification of ground vehicles (ELEC), and an upgrade of airport infrastructure (INFR) assessed for European airports for the reference year. Details on the OI assessments, the included operational changes, and the detailed results are provided in Appendix A.
2.2. Selected Metrics for Comparison
The assessment of different OIs and their comparison focuses on the climate mitigation potential, as well as resulting impacts on the stakeholders of the air transportation system. Hence, suitable KPIs need to be identified.
For the climate impact assessment, the corresponding climate metric, time horizon and emission scenario are determined [52]. Possible climate metrics include the quantity of emissions, which causes changes in atmospheric concentrations of greenhouse gases (GHG), resulting RF, global warming potential (GWP), global temperature potential (GTP), and average temperature response (ATR) [2,52,53,54,55]. While emission quantities deal as a first indicator directly related to fuel consumption, RF indicates radiation changes caused by concentration changes in the atmosphere and is influenced by background emissions as well as reference time. GWP and GTP link to a chosen time horizon (e.g., 20, 50, 100 years) and summarize the impact on radiation or temperature changes, respectively. ATR describes the mean future temperature development over a period up to the chosen time horizon [52]. Relevant advantages and disadvantages of different climate metrics are summarized in Table 2 [56,57]. In the following, the comparison of climate effects is focused on ATR over a time horizon of 100 years (ATR100) incorporating a future-emission background scenario (F-ATR) as defined by the business-as-usual scenario (BAU) in Grewe et al. [8]. This metric, widespread in literature, e.g., [14,15,55], reduces the dependency on the time horizon and is directly related to climate impact, in other words, near-surface temperature change. The 100 year time horizon is typically used in policy making and enables a proper consideration of long-lived species such as CO [57].
Table 2.
Overview of different climate metrics [56].
The climate mitigation potential of an OI is defined in the following as the reduction in ATR100 caused by the implementation of an OI with respect to the reference case without implementation of the OI.
Non-climate KPIs describe the different measures’ effects on operations and the air transportation system. These parameters can be further differentiated into technical, operational, economic, and acceptance KPIs. Technical KPIs are directly related to the efficiency and performance of the aircraft and can primarily be described by fuel consumption or fuel efficiency. Operational KPIs relate to the tactical and strategic operations of the involved parties, for instance, described by aircraft utilization or number of landing–take-off (LTO) cycles per time period. Airline networks can further be characterized by their available seat kilometers (ASK). Consequences for air navigation service providers (ANSP) can be described by the number of aircraft movements in an airspace sector, the routing efficiency, i.e., the divergence from the optimum route for a flight, and the added flight distance or time. Economic effects of implementing in-flight OIs can be analyzed by changes in direct operating cost (DOC) combining variable and fixed operating costs and summarizing changes in fuel consumption, flight time, flight distance, and LTO cycles performed on a monetary basis [58,59,60,61]. Changing airline networks may also lead to profit and revenue changes. Moreover, impact on airports can be described by changes in the number of LTO cycles. When implementing changes to the ground processes, fuel and energy consumption are relevant as they are directly related to operational costs. Furthermore, the implementation of OIs typically requires a substantial initial investment. In addition, acceptance of measures can be qualitatively analyzed by investigating community, market, and socio-political acceptance [62].
While a variety of different non-climate KPIs has been assessed in the OI-individual studies, we select DOC, profit, and initial investments as central non-climate KPIs for a quantitative comparison as they summarize possible obstacles to the implementation of the selected OIs from an economic perspective. A qualitative comparison of the non-climate effects is based on economic and operational consequences per stakeholder.
2.3. Scaling Approach
The portfolio of studied OIs (Table 1) is associated with a wide variability of modeling approaches to estimate the climate mitigation potential as well as different definitions of the underlying reference cases (see Appendix A). Hence, a direct comparison between the individual study results is limited so that a comparative assessment method is required. For this purpose, we differentiate into the scaling of in-flight and on-ground effects (Figure 1), which is required due to substantial differences in the related effects: In-flight aviation emissions comprise CO and non-CO species such as HO, NO or aerosols [3]. The resulting climate effect is, among others, strongly dependent on the emission altitude. For instance, HO-induced effects (either directly or indirectly through the formation of CiC) are significant around the tropopause and comparably negligible at lower altitudes [14,63]. The same holds true for NO-induced climate effects as the concentration of NO emissions in the upper troposphere is significantly lower than in urban regions. Hence, relatively small amounts of aircraft emissions have notable effects in higher altitudes [3,63,64]. In other words, near-ground NO-induced climate effects are negligible compared to effects from in-flight emissions. Moreover, non-CO gases and particles are associated with relatively short atmospheric residence times, leading to a more heterogeneous distribution in the atmosphere compared to CO emissions, whose climate effect can be considered independent of emission location and time of release [3,65]. Consequently, scaling of climate mitigation potentials for in-flight measures requires to account for both different traffic sample sizes, directly related to CO climate effects, and non-CO-induced effects. Traffic sample size scaling and associated fuel consumption are approximated with covered ASK per flight plan, while the location- and time-dependent non-CO effect is estimated via route-specific CO equivalents (CO-Eq), as for instance introduced by Dahlmann et al. [66]. CO-Eqs deal as a proxy for the non-CO climate effects as they represent the total climate impact along a route relative to the CO climate impact. Conversely, mitigation potentials of on-ground measures at the airport can be limited to an analysis of CO emissions and effects, hence do not necessarily require the inclusion of emission location. The consideration of local air quality is excluded from this study. The climate impact is scaled according to the traffic volume at an airport indicated by the number of movements.
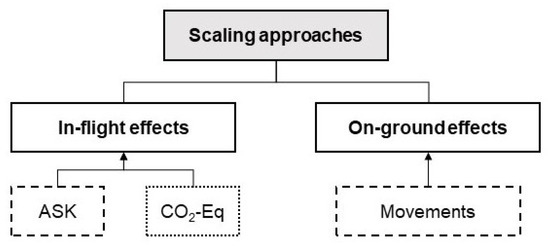
Figure 1.
Applied proxies for scaling of mitigation potentials (dashed line: traffic size proxy, dotted line: required scaling parameter for in-flight non-CO effects).
2.3.1. Comparing Climate Mitigation Potentials for Different In-Flight OIs
Each in-flight OI’s climate mitigation potential is assessed for a reference flight plan defined by the study scope, e.g., representative missions or a specific airline network. Our goal is to extend these estimates to a target flight plan which corresponds to the overall missions of interest for the comparison. The applied scaling approach of climate effects is schematically described in Figure 2.
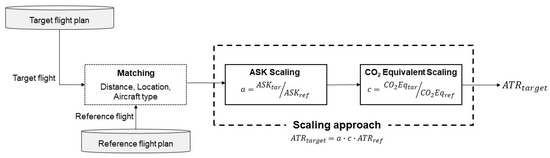
Figure 2.
Schematic illustration of scaling approach for in-flight OIs incorporating differences in traffic size and non-CO effects between reference and target flight plan.
First, the traffic-size-related scaling is performed to consider effects from different flight frequencies, aircraft types and the associated fuel consumption as well as CO effects. This effect is modeled with the ASK-related scaling factor a calculated as
where defines the sum of ASK for the target flight plan for which the climate impact is to be estimated based on the reference flight plan with .
Second, CO-Eq-related scaling is performed to incorporate the mission-specific dependency between CO and non-CO effects, which are defined by:
To avoid computationally extensive calculations, a simple approach to estimate route-specific CO-Eq can be applied as presented by Dahlmann et al. [66]. The authors introduce a regression model to calculate CO-Eq for non-CO emission in dependence of flight distance and average latitude from origin and destination airports per mission as follows:
with as the climate impact in CO equivalents of ATR100 for a specific route with a distance of D and latitude of origin and destination airport described by and , respectively. A detailed description of the functions per climate species (, , and ) can be found in Dahlmann et al. [66]. Alternatively, the CO-Eq of a reference or target flight plan can also directly be derived from detailed calculations, if the reference case results are available for the target flight plan. It needs to be considered that the method to estimate route-specific CO-Eq also determines if seasonal differences can be considered or annually aggregated mean values are included. Subsequent to the CO-Eq calculation, the respective scaling factor c can be determined as follows:
where defines the average CO-Eq for target flight plan for which the climate impact is to be estimated based on the reference flight plan with a CO-Eq of .
Finally, both scaling aspects can be combined to estimate for the target flight plan by applying the previously calculated scaling factors:
The scaling approach of climate effects can further be improved with flight matching in a pre-processing step. The goal of the matching approach is to find the best suitable reference flight for every selected target flight used for scaling. Selection criteria can be determined by differences in flight distance, origin, and destination airport location, or aircraft type.
Validation of the introduced scaling approach is performed based on the individual assessment of the results from the ISOC study, presented in Appendix B. The above-described approach is not only applicable to scale results obtained for a limited reference case to a broader flight plan incorporating fleet distribution, spatial expansion, and mission length, but also links the mitigation potential of an OI obtained for a certain scope (e.g., a limited geographic area) to a broader scale. However, we observe that sample size and composition of the available reference flight plan influence the accuracy and limit significance for flight plans of smaller sample size.
2.3.2. Comparing Climate Mitigation Potentials for Different On-Ground OIs
In contrast to the in-flight related OIs, on-ground climate effects are assumed to be independent of airport location. Hence, scaling emission quantities from a reference airport, for which a detailed study has been performed, towards the set of target airports to be considered is based on aircraft traffic movements alone. The resulting climate mitigation potential can be determined in a final conversion step.
Figure 3 schematically illustrates the generalization strategy adopted by the ground-related OIs with three levels of generalization, including the associated modeling detail and comparability levels. Within the detailed assessment per reference airport, the emissions are estimated for a unit source, which can, for instance, be represented by different aircraft, ground vehicles, or building types. In a second step of the reference airport study, this specific data per unit source is generalized to the implementation of the OI at the considered reference airport, e.g., based on the aircraft operating at this airport or the respective ground vehicle fleet. To scale the OI results obtained for a reference airport to the target airports, the number of flight operations at the airports is used as a proxy to scale fuel and energy consumption as well as corresponding emissions. On this basis, ATR100 as the selected climate metric can be assessed.
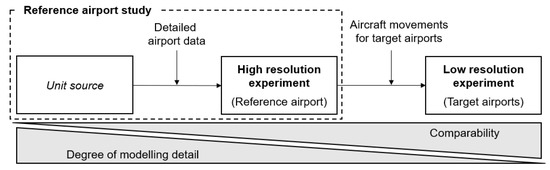
Figure 3.
Schematic illustration of scaling and generalization approach for on-ground OIs incorporating different levels of detail.
2.4. Data and Application of the Scaling Approaches
To avoid including COVID-19 pandemic effects, the selected OIs are assessed for implementation in 2018. The geographic target scope is restricted to the European area, i.e., flights starting or landing in the area of the European Civil Aviation Conference (ECAC), European airlines, or airports located in the ECAC area. This is explained by the fact that recommendations for regulations and policies are derived for European operations in the project context. The scaling method described in Section 2.3 is applied to the OI-specific case study results. To this end, we utilize flight plan data provided by Sabre Market Intelligence Database as well as atmospheric reanalysis data provided by ECMWF for the in-flight related OIs and airport data provided by SEA as a consortium partner in the project. A detailed quantitative comparison within the same measure type, namely trajectory-related, network-related, and ground-related, is performed based on relative and absolute changes in climate and non-climate KPIs. On this basis, a semi-quantitative comparison of all considered measures can be derived in a final step.
2.4.1. Application for In-Flight-Related OIs
Trajectory-related OIs have been investigated by incorporating day-specific weather situations and atmospheric boundary conditions for one to four selected representative days. As only one comparable representative day is considered in all four studies, the detailed comparison is thus limited to this day. The target flight plan is defined by all flights originating or departing from the ECAC area performed with Airbus or Boeing passenger aircraft and with a distance of at least 500 km. This covers 25.3% of the global flight plan ASK on the selected day and 87.8% of all European flights. Reference flight plans vary significantly for the individual studies (see Appendix A). KPIs of the comparison are set to F-ATR100, which is derived from ATR20 by applying conversion factors determined in Dietmüller et al. [67], and DOC. Since the considered mission adjustments are limited to the flight itself without changing aircraft assignments or OD pairs, we assume that passenger capacities and ticket prices do not change with the OI implementation. The scaling is performed as follows: Based on the measure-specific reference flight plan, climate mitigation potentials in terms of ATR100 are scaled to the target flight plan of the selected representative day. CO-Eqs for the selected representative day are estimated with algorithmic climate change functions (aCCFs) [67,68], which have been assessed for the full target flight plan. On this basis, different application scopes of the investigated OIs can be modeled, e.g., an application of LOSL for all long-range flights to or from the ECAC area or an application of CLIM for North Atlantic flights only. However, an implementation of LOSL is assumed to be suitable for long-distance flights only as shorter Intra-European missions are typically performed at lower flight altitudes and are expected to be addressed by optimized routing concepts as covered by the OIs FREE and WIND. Resulting changes in DOC are scaled based on the traffic size, namely ASK.
The comparison of network-related OIs is performed based on all flights covered by European airlines, annually aggregated for 2018. The results from the individual case studies are scaled to a target flight plan consisting of all flights performed by these airlines focusing on three airline types, namely primary hub-and-spoke (H&S) airlines, secondary H&S airlines, and low-cost carriers (LCC). Regional airlines are excluded from the considerations. The resulting target flight plan covers 19.6% of all global ASK in 2018 and 69.4% of all flights from and to Europe. As NETW has been assessed individually for one representative airline per category, scaling is performed in two steps: First, mitigation potentials per representative airline are scaled to all airlines of the same category in accordance with their respective fleet size. By doing so, we assume that the bigger an airline fleet is, the higher optimization potentials can be achieved. Second, the climate mitigation potential per airline type is scaled according to the respective ASK and average CO-Eq per airline type. By contrast, an individual scaling for the ISOC results is performed, including a matching based on flight characteristics. CO-Eqs are calculated with the regression formulas provided by Dahlmann et al. [66]. To assess the stakeholder impact, DOC and profit are considered. The consideration of profits is required for the NETW OI as network adjustments lead to changes in served missions, frequencies, and payloads thus influencing captured demand and revenue. The stakeholder analysis of ISOC is focused on DOC, while resulting changes in profit can only be indicated qualitatively due to limited data availability.
2.4.2. Application for Ground-Related OIs
According to Section 2.3.2, the climate mitigation potential of the ground-related OIs is estimated based on the fuel, energy, and emission savings per unit source as part of the reference airport study. In the case of SETX, the unit source is an aircraft type. In the case of ELEC, it is a vehicle class, and in the case of INFR, it is a conceptual office building. The resulting changes in KPIs per OI are then assessed in detail at the selected reference airport Milan Malpensa Airport (MXP), for which detailed data were available to the project consortium. For this purpose, the airport-specific flight schedule with its exact taxi times leads to emission decreases due to the implementation of SETX. The effects from ELEC at MXP are modeled based on the detailed ground support equipment (GSE) fleet composition and the respective mileage to obtain changes in GHG emissions. Under consideration of the climate conditions at MXP, energy savings for the conceptual office building are scaled to the airport level. Required investments and possible investment amortization times can also be assessed for MXP as a reference airport in this context.
Finally, changes in fuel and energy consumption as well as emission savings are generalized from MXP airport to all airports in the ECAC area (target airports) based on the number of airport movements. Thereby, the following assumptions are considered:
- SETX: We estimate the taxi times at the different airports based on average taxi times at Europe’s most frequented airports for one representative aircraft type.
- ELEC: We assume an equal distribution of ground fleet vehicle categories regarding vehicle sizes and mileages, while the fleet size itself is expected to scale with the annual air traffic at the considered airports.
- INFR: We incorporate the climate zones corresponding to the airport location as this is expected to significantly influence the efficacy of the selected energy-efficiency measures.
Conclusively, the generalized emissions are converted to ATR100 following the approach presented by Sausen & Schumann [69]. Further details on the individual studies and the applied approach can be found in Appendix A.3.
3. Results: Comparing Different Operational Mitigation Measures in Aviation
Individual measure results are summarized and limitations to their comparability are illustrated in Section 3.1. Based on the varying boundary conditions and underlying reference cases, the comparative method as described in Section 2 is applied to quantitatively compare OIs of the same type for a common baseline (Section 3.2) before a qualitative comparison is finally performed across the different measures types in Section 3.3.
3.1. Mitigation Potential from Assessment of Individual OIs
The results of the individual measures are presented per type in the following. A detailed explanation of the underlying measure-specific assessment process and results can be found in Appendix A.
3.1.1. Individual Mitigation Potential of Trajectory-Related OIs
The individual study on LOSL finds a climate mitigation potential in ATR20 of 16.1% and 11.5% in ATR100 for 11 December 2018 for a North Atlantic flight sample (−5.4% in ATR100 for the full sample of considered European long-range flights). The reduction in climate impact can be explained by an overcompensation of rising effects from CO and NO by a reduction in effects from HO and CiC. Besides the significant reduction in climate impact, an increase in fuel consumption and flight time is observed, leading to a higher operating cost of approximately 1.7% on the selected case study day in December [45,70]. By contrast, the OIs FREE and WIND show a substantial reduction potential in fuel consumption, CO as well as non-CO emissions, and climate impact. These concepts result in an overall reduction potential between 7 and 9% in fuel consumption and CO emissions, between 26 and 31% in NO emissions, and a climate mitigation potential between 20% and 24% in ATR100 in the focused airspace. Reduction in flight time and fuel costs result in a DOC decrease of up to 4.3%. Nevertheless, travel time and air traffic control (ATC) complexity increase with wind-optimized trajectory planning [47]. Moreover, the analysis of CLIM for four transatlantic night flights shows route-individual climate mitigation potentials between 9% and 15% for ATR20 (8–13% in ATR100) associated with fuel penalties between 2% and 6% [48,71]. An overview of the mitigation potentials is given in Figure 4, and further details on the results are described in Appendix A.1.
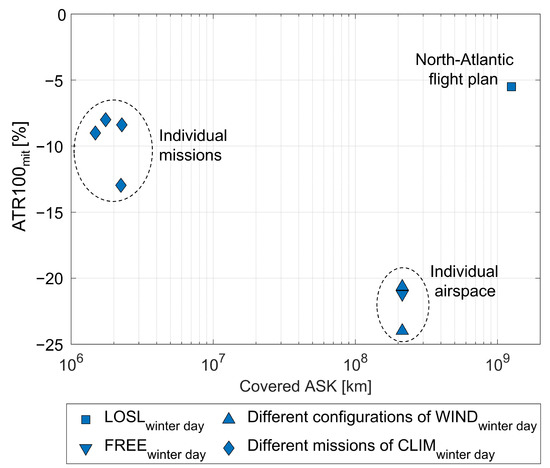
Figure 4.
Results from individual trajectory-related studies and respective covered ASK for different case studies of the investigated OIs.
Although all trajectory-related measures are based on an assessment of individual flight missions on 11 December 2018, different assumptions are made for the reference case. Therefore, an additional adjustment and scaling of the results is required before comparing the individual studies’ results. Different sizes of the considered scope are illustrated in Figure 4 by covered ASK in the reference case. For instance, the size of the flight plan (large sample of North Atlantic flights for LOSL in comparison to selected flights for CLIM or flights in a defined airspace for FREE and WIND) and the considered aircraft types (wide-body or narrow-body aircraft) explain large differences in covered ASK per reference flight plan, which requires scaling of the individual results to a comparable scope. In this context, it needs to be considered that results for all trajectory-related OIs are only comparable for the investigated winter day and cannot directly be extrapolated to one year. Figure 5 illustrates the regional climate sensitivity as indicated by the merged aCCF for two representative days, one for winter and one for summer 2018, that have been analyzed in the LOSL study [45]. We observe significant differences in ATR100 per fuel burnt. In particular, regions of contrail formation are expected to significantly influence the location of highly climate-sensitive areas. Obviously, the location of areas with high climate impact varies for the displayed days, e.g., when looking at the focused airspace in studies on FREE and WIND. This influences the mitigation potentials of trajectory-related measures in general and the scaling accuracy for the investigated reference airspace in FREE and WIND in particular.
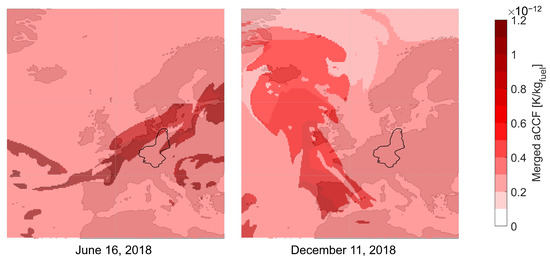
Figure 5.
Merged aCCFs illustrating the climate effect in terms of ATR100 relative to fuel consumption for the European region as well as the investigated airspace of FREE and WIND; Visualization is exemplary for pressure level at 225 hPa at 00:00UTC.
3.1.2. Individual Mitigation Potential of Network-Related OIs
The network optimization including climate effects as performed in the OI NETW shows mitigation potentials between 1 and 13% in ATR100 for the different selected representative airlines. This is associated with a drop in profit of up to 7% on an airline level, although DOC even decreases marginally. Observed network changes are primarily characterized by flying on shorter routes rather than medium or long-haul missions [31,71]. Furthermore, ISOC study results show that implementation of climate-optimized ISO on the network of European long-haul flights comes with a climate mitigation potential of approximately 40% in ATR100 for the considered flight plan. Nevertheless, flight time and fuel consumption increase significantly due to additional starts and landings, detours to reach the required refueling airport as well as a reduction of flight altitudes, which yields a DOC rise of 20.9% [20].
The results achieved for the network-related OIs cannot directly be compared to one another as ISOC results have been calculated for long-range missions from or to the ECAC area, because the concept is not applicable to shorter flights. Moreover, results for NETW are given for three individual airlines and need to be scaled to the full sample of all European airline flights. Variations of associated study scopes and mitigation potentials obtained for the OI-individual case studies are displayed in Figure 6. Details on the individual case studies and their results can be found in Appendix A.2.
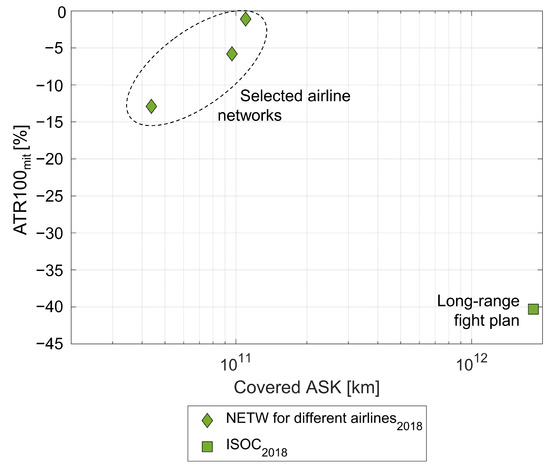
Figure 6.
Results from individual network-related studies and respective covered ASK for different case studies of the investigated OIs.
3.1.3. Individual Mitigation Potential of Ground-Related OIs
In the first step, the emission savings per ground-related OI are assessed per unit source, namely aircraft category (SETX), ground vehicle class (ELEC), and a conceptual office building (INFR). Individual case studies on the considered OIs lead to a reduction in fuel consumption and savings in CO emissions of on average 75% compared to the reference case for SETX and between 18% and 32% energy savings INFR depending on the climate zone of interest [49,51]. An extrapolation of results to the case study airport of MXP shows climate mitigation potentials in terms of ATR100 of 54% for SETX, 84% for ELEC, and 21% for INFR, associated with significant required investments between 5 and 113 million euros at MXP. Further details on the individual studies can be found in Appendix A.3. An extrapolation of the achieved results to the target of all European airports is reported in the following subsection.
3.2. Generalization and Comparison within Measure Types
Based on the individual results achieved in the measure-specific case studies, a comparison is prepared by applying the comparative method (Section 2.4) investigating climate mitigation potential and associated stakeholder effects caused by the selected OIs.
3.2.1. Comparison of Trajectory-Related OIs
Scaling of the LOSL results to the European target flight plan can be performed for different application scopes. We find a mitigation potential of 1.3% in ATR100 for implementation of LOSL on all North Atlantic flights of the target sample of European flights (associated with 0.4% increase in DOC). Scaling the results to implementation on all long-range flights from and to Europe, we observe a reduction potential in ATR100 by 1.8% (+1.0% in DOC) for the European target flight plan. In general, we see higher mitigation potentials for North Atlantic flights compared to other long-distance flights from or to the ECAC area caused by the specific weather situation on the considered day.
Implementation of FREE or WIND in the considered airspace only leads to limited mitigation potentials in relation to the target flight plan (between 0.3% and 0.4% depending on the selected objective function, associated with a slight DOC decrease of 0.1%). However, it can also be assumed that the concept can be expanded to further European airspaces. The reports by Functional Airspace Block Europe Central (FABEC) [72,73,74] show that the overall routing inefficiency defined by comparing the great-circle distances and planned flight distances is around 5.8% in FABEC airspaces in 2021, and it is around 5.6–5.9% in the investigated German Airspace between 2018 and 2021. Therefore, obtained results can be considered representative of the European region in terms of efficiency and fuel-saving potential. Nevertheless, the representativity of the found climate mitigation potentials is limited due to the specific meteorological conditions in this airspace on the investigated day. For this example, almost no CiC are expected to form in the considered temporal and spatial scope. For the target sample, we observe a significantly higher non-CO climate impact for the target flight plan compared to the individual airspace reference (CO-Eq of 4.87 compared to 2.65), which is among other effects explained by limited climate impact from CiC in the selected airspace (contribution of 11.5% to ATR100 for the target flight plan compared to 0.6% in the selected airspace). Therefore, we expect a smaller mitigation potential when scaling FREE and WIND concepts to a broader scale.
Modeling climate-optimized trajectories (CLIM) on average shows large mitigation potentials of 9.9% in the North Atlantic region while keeping cost increase below 4.4% for the investigated reference flights. If these mitigation potentials can be transferred to all North Atlantic flights, we find a climate mitigation potential of 1.1% and a climate mitigation potential of 3.3% when implementing climate-optimized flight planning for all European long-haul flights (+1.1% and +2.7% in DOC, respectively) for the overall target flight plan.
Figure 7 combines the obtained mitigation potentials for different trajectory-related OIs and different OI application scopes. Obviously, we find the highest mitigation potential by implementing CLIM as it incorporates four dimensions in trajectory optimization. On average, approximately one-third of the mitigation potentials of CLIM can be achieved with LOSL, though associated with relatively high changes in DOC. The mitigation potentials of FREE and WIND are found to strongly depend on the selected airspace and the implementation scope. We estimate the mitigation potentials to be between the potentials observed for LOSL and CLIM. In contrast to other OIs, a reduction of routing inefficiencies due to the implementation of FREE/WIND is associated with a decrease in operating cost. However, the obtained results have been achieved for the selected winter day of 11 December 2018 only. In comparison to other day-specific case studies, e.g., [45,75], we see that mitigation potentials for this day are found to be higher, especially in the North Atlantic region, which needs to be considered when extrapolating the results to annual potentials.
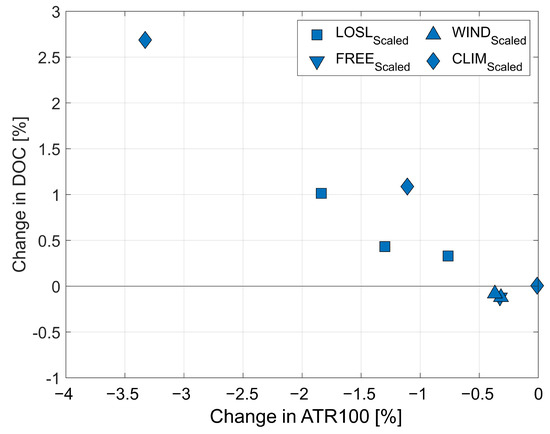
Figure 7.
Comparison of climate mitigation potentials resulting from different trajectory-related OIs in relation to the resulting change in DOC.
3.2.2. Comparison of Network-Related OIs
In the case of NETW, we find a mitigation potential of approx. 8% by implementing climate-optimized network planning for all European airlines according to the described two-step generalization (Section 2.3.1). As the number of flights is slightly reduced (up to 1% for LCC), DOC drops by 2.1%. However, profits per airline are reduced by 5.8% on average as routes, load factors, frequencies, ticket sales, and thus revenue changes.
A generalization of ISOC results in the full European target flight plan leads to a mitigation potential of 25.8% in terms of ATR100. While ASK of the considered long-range reference flight plan represent approximately 44% of the full target sample of European long-range flights, CO-Eq are higher for the observed long-range flights. The climate mitigation potentials are opposed by an increase in DOC of 8.8%. Changes in revenue and profit are expected to be significant as the implementation of ISO would still require changes to the affected airline networks as flight and turnaround times increase, possibly leading to a smaller route network than can be covered by the same fleet.
As illustrated in Figure 8, we see that both measures lead to significant climate mitigation potentials, and potentials of ISOC are found to be higher compared to the NETW optimization. Whereas ISOC is associated with a high increase in DOC and a crucial operational impact due to the intermediate refueling stop, we find that implementation of NETW even slightly reduces operating cost. However, we expect disadvantages regarding profit for both OIs with a higher impact for ISOC compared to NETW.
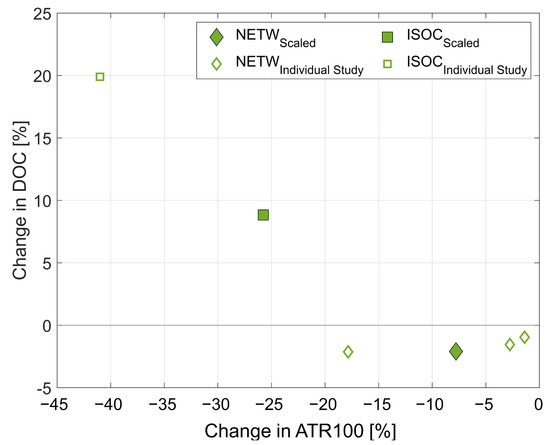
Figure 8.
Comparison of climate mitigation potentials resulting from different network-related OIs in relation to the resulting change in DOC.
In extension to the comparison of both approaches, a combination of the two OIs is also possible. Noorafza et al. [31] assess this by incorporating ISO into the network optimization and find that ISO is being implemented on approximately 10% of the flights for exemplary primary and secondary H&S airlines. By doing so, climate mitigation potentials can be increased to 26–44% associated with a profit decrease between 10 and 25% [31].
3.2.3. Comparison of Ground-Related OIs
Figure 9 shows the results for the comparison between the considered ground-related OIs for an application at all airports in the ECAC area.
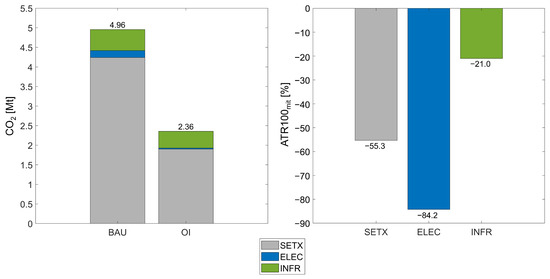
Figure 9.
Absolute CO emissions and their reduction by implementing the different OIs (left) and climate mitigation potential (ATR100) per considered ground-related OI (right) generalized for all airports in the ECAC area.
The highest relative mitigation potential can be achieved by electrifying the ground fleet (85%), followed by electric towing (55%) and infrastructural updates to the airport buildings (21%). Furthermore, we find that approximately 89% of the emissions related to ground operations and infrastructure come from taxiing operations, leading to the highest absolute reduction in CO emissions and associated climate impact, respectively. Approximately two-thirds of the remaining emissions are related to the generation of energy necessary for the heating, cooling, and illumination of the airport office buildings, and one-third for the GSE and ground handling operations.
The impact on stakeholders is analyzed by considering the required initial investments needed to implement the considered ground-related OIs and the associated time to reach break-even due to the potential savings in operations. The analysis has been performed for Malpensa airport in detail (see Appendix A.3). In general, we observe the highest initial investments for ELEC, which is almost 10 times higher compared to SETX and 20 times higher compared to INFR. However, due to yearly fuel and energy savings, the OIs are expected to recoup their investments and reach break-even after long time horizons of 50 to 60 years.
3.3. Comparison across Measure Types
Figure 10 displays a final qualitative comparison of the results with respect to the mitigation potentials, stakeholder impacts, and maturities of the investigated OIs. In this context, economic and operational effects for the air transport system are divided by impacted stakeholders, including airlines, airports, ANSPs and passengers. Indirect effects, such as increasing prices for airlines due to higher costs for airports or increased ticket prices for passengers due to higher costs for airlines, are excluded from this analysis.
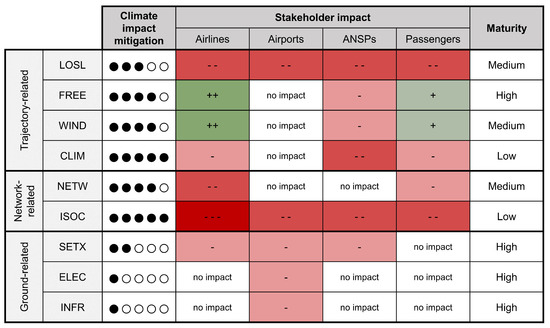
Figure 10.
Overview and comparison of achieved results for individual OIs. Climate mitigation potential is indicated semi-quantitatively from very high ( ) to very low (
 ) absolute climate mitigation potentials. Stakeholder impact is given as strongly negative (- - -), negative (- -), slightly negative (-), slightly positive (+), and positive (+ +).
) to very low () absolute climate mitigation potentials. Stakeholder impact is given as strongly negative (- - -), negative (- -), slightly negative (-), slightly positive (+), and positive (+ +).
A direct quantitative comparison is so far only possible within similar categories as different assessment methods and boundary conditions have been applied per category. For the semi-qualitative comparison of all considered OIs, we need to differentiate between relative and absolute mitigation potentials. On the one hand, we see very high relative mitigation potentials for ground-related OIs in comparison to the in-flight OIs. Also, we observe high mitigation potentials for climate-optimized routing and climate-optimized ISO, whereas we find lower relative potentials for free- and wind-optimized routing and strategic network planning incorporating climate effects. On the other hand, the absolute reduction of climate effects in ATR100 is significantly higher for in-flight measures compared to on-ground improvements. This can be illustrated by the CO emissions caused by the different target flight plans and target airports: We observe 150–200 Gt of CO emissions for the annual flight plan of the network-related OIs and 440 Mt of CO for the target flight plan of the selected December day investigated for the trajectory-related OIs. In comparison, the overall CO emissions of all European airports resulting from taxiing, ground transport, and buildings are estimated to be 5 Mt annually. Moreover, we see average CO-Eq between 3 and 4 for the in-flight climate impact, thus we estimate absolute mitigation potentials of in-flight OIs to be significantly larger.
Implementation of OIs is limited through the associated impact on the different stakeholders of the air transport system. For instance, as OIs FREE and WIND increase efficiency, cost for operators and travel times for passengers can be reduced. However, an upgraded infrastructure for advanced wind and weather services and ATC modernization will be required, associated with additional investments. ATC workload is expected to increase in the context of wind-optimized flight planning, possibly influencing delays and air navigation charges. In addition, LOSL and CLIM are associated with longer flight times and increased fuel consumption leading to higher DOC. Passenger acceptance is expected to decrease due to longer travel times [76]. The same holds true for network-related OIs: deviation from economically efficient operations towards more climate-friendly concepts increases costs and reduces profits for airlines. Potentially longer detours, travel times, more intermediate stops, and number of flights needed for the same OD combination result in reduced passenger acceptance [76]. Moreover, higher fuel consumption, flight times, additional starts, and landings as well as adjusted frequencies affect the operating cost and profit of the operators. Also, changes to the ground infrastructure would be required to accommodate additional intermediate stops or route changes [20]. By contrast, on-ground improvements typically aim for a reduction of CO emissions due to reduced energy or fuel consumption. Hence, these measures generally reduce operating cost, thus are expected to reach break-even following a significant initial investment. In addition, deploying the three measures requires changes to the airport infrastructure. For instance, electric towing leads to a rise in the number of terminal maneuvering area movements, thus an increased workload for the tower controllers. Charging for electric vehicles and tow trucks will be required leading to additional movements. In this context, the organization of airport ground infrastructure also requires redesigning, e.g., to include areas for coupling and decoupling the tugs and charging processes.
The investigated OIs are associated with different levels of maturity. The main limitations to the ground-related OIs SETX, ELEC, and INFR are not technical, as the three measures are based on mature technology, but rather economic and operational. By contrast, in-flight-related measures are generally associated with lower levels of maturity. For instance, airport infrastructures and capacities are currently not designed to handle a significant amount of intermediate refueling stops. Moreover, wind or climate-optimized routings require an upgraded infrastructure for advanced wind and weather services and ATC modernization. Furthermore, the high uncertainties in non-CO climate effects in general and CiC in particular [3] affect the reliability of climate-optimized flight planning or network design and require further research.
4. Discussion
For the first time, we compare a broad set of different operational measures to mitigate the climate impact of aviation. By doing so, we confirm the climate mitigation potentials of in-flight operational measures of up to 25% depending on the implementation scope and associated with different levels of cost increases for the operators. On-ground measures are found to provide even larger mitigation potentials of up to 85%, but are associated with significantly lower absolute climate mitigation potentials due to the lower overall on-ground emission quantities. While the investigated on-ground OIs are based on existing technologies, in-flight OIs are at a lower degree of maturity. In this context, reliability and applicability of the achieved results need to be interpreted with care on the basis of the applied assumptions, hypotheses, and boundary conditions. Nevertheless, the developed and validated method to extrapolate case study results to a broader scale, e.g., regarding the considered flight plan, investigated airports, or geographical restrictions, enables a quantitative comparison of different operational mitigation measures. The method can also be applied to other operational improvements (e.g., continuous climb/descent operations, night-time contrail avoidance, or single-engine taxiing) as long as case study results and boundary conditions are determined.
The accuracy of the selected approach is strongly influenced by the uncertainties in the assessment process. In general, estimating the in-flight climate effects of non-CO emissions in aviation underlies large uncertainties [3]. Also, the assessment accuracy of CO-Eq for the scaling approach is determined by the assessment method. The applied aCCFs for trajectory-related OIs are currently considered prototypical and have been validated for a limited geo-temporal scope only [68]. The route-specific assessment of CO-Eq introduced by Dahlmann et al. [66] shows a relatively high mean square error (0.19) in comparison to a more detailed assessment. Moreover, these regression formulas have so far only been derived for a characteristic wide-body aircraft, namely A330, and do not provide reliable estimates for short-range missions. Furthermore, a quantitative extrapolation from individually investigated days per case study to longer time periods, e.g., aggregated results for one year, is currently not possible due to the high dependency of non-CO effects from atmospheric boundary conditions. Hence, further research will be required in this context. Validation of the in-flight scaling method (Appendix B) has shown a significant impact of the size of the reference flight plan on the accuracy of the scaling results. Therefore, we expect a higher level of confidence for the generalized results from LOSL, NETW and ISOC sub-studies whereas the assessment of the CLIM OI with only four reference flights is expected to be limited in its significance. For ground-related OIs, the scaling procedures aim to generalize information that is typically highly airport-specific. This study is based on the limited information publicly available and validated using the Malpensa airport data, hence depending on the specific characteristics of this airport. Further analysis is needed to validate the methods on a broad selection of airports.
The direct quantitative comparability between the different categories of the OIs is limited due to different modeling assumptions: While trajectory-related OIs have been assessed for particular days of the year only, network- and ground-related OIs have been assessed for one year. In this context, the different assessment approaches to the climate impact also need to be considered and are expected to influence the comparability of results. For instance, the analysis of trajectory-related OIs has incorporated specific meteorological conditions during the flight, while network-related OIs have been assessed with a climatological approach applying annual mean values [67,77]. The direct comparability between different trajectory-related OIs is further limited due to the different tools applied for the trajectory re-modeling building the basis for the following climate assessment. Nevertheless, as all applied tools incorporate BADA4 performance data and use a total-energy model for describing the aircraft state along a mission, differences have been found to be negligible (deviations below 4% for fuel flow and 2% for flight time on selected investigated routes). Furthermore, it needs to be considered that optimizations performed in CLIM and NETW have especially aimed for the minimization of ATR20, while results have been converted to ATR100 as a consistent climate metric for the comparison. Moreover, mitigation potentials in CLIM have been assessed in relation to the fuel-optimal solution, whereas FREE, WIND, and LOSL refer to the actual point profile on the selected day. NETW and ISOC assume a direct great-circle connection. In addition, ground-related OIs comprise different study scopes, namely ELEC does not take emissions from ground power units (GPU) and push-backs into consideration while INFR does not incorporate energy-intensive infrastructure such as terminal, runways and taxiways illumination. While this is due to a lack of reliable data, including them might change the relative contribution of these three OIs to the overall mitigation potential on-ground.
In addition to the modeling approach itself, the selection of KPIs also influences the conclusions. For instance, a change in background emission scenarios as well as the underlying time horizon is expected to affect the results. Evaluating the climate impact over a shorter time period of 20 or 50 years is expected to put more weight on the non-CO climate forcing. A more detailed assessment of stakeholder KPIs such as passenger and social acceptance of mitigation measures could help to include more aspects in the quantitative assessment. A passenger acceptance survey has been performed in the course of the project as a basis to facilitate further discussion [76].
5. Outlook and Conclusions
This study describes the potential of different operational changes to reduce the climate impact of aviation and presents a method to compare individual measures. The proposed method scales the mitigation potentials of the individual measures to one common reference considering differences in traffic sample size as well as different CO and non-CO climate effects, thus enabling a comparison of the climate impact of the considered operational measures. As a result, we identify significant climate mitigation potentials both in-flight and on-ground. Higher absolute potentials can be achieved with in-flight measures compared to on-ground ones considering both CO and non-CO emissions. However, in-flight mitigation measures are generally associated with lower maturity levels and a more negative impact on the involved stakeholders of the air transport system. For example, shifting trajectories to less climate-sensitive regions can potentially reduce airspace capacity, increase workload, particularly for pilots and air traffic controllers, and raise direct costs for aircraft operators. Other measures have a lower mitigation potential but can be considered ’low-hanging fruits’ as the enabling technology is mature, the operational concept is clear, and their impact on performance, human workload and operation safety is relatively small. This is, for example, the case for the electrification of the ground support equipment and operations, and the upgrade of the airport infrastructure according to energy-efficiency criteria.
In future work, this study could be expanded to further operational improvements as well as by assessing the effects of implementation enablers on the KPI changes caused by individual measures. Moreover, results need extension to a broader scope, e.g., also including regional operations or worldwide flights, to increase significance. A direct quantitative comparison of measures of different types requires higher consistency regarding reference case definition and modeling assumptions. A more detailed investigation of the stakeholder effects, in addition to investments and cost changes, is of further interest, for instance by assessing increases in airspace complexity due to the implementation of trajectory changes or changes in on-ground processes due to the implementation of airport-related improvements. Moreover, a combination of several methods as well as including technological improvements such as new aircraft concepts or sustainable fuels could enrich the achieved results.
Author Contributions
Conceptualization, Z.L.Z., S.D.G. and F.L.; methodology, Z.L.Z., F.L., M.C. and S.D.G.; software, Z.L.Z., S.D.G., M.C., B.B., M.N., P.R., E.B., M.G. and C.A.; validation, Z.L.Z. and M.C.; data curation, Z.L.Z., S.D.G., B.B., P.P., M.N., P.R., E.B., M.G. and C.A.; writing—original draft preparation, Z.L.Z., S.D.G. and C.A.; writing—review and editing, M.C., F.L., V.G., B.B., P.P., S.M., M.N., P.R. and A.T.; visualization, Z.L.Z. and S.D.G.; supervision, F.L., V.G. and S.M.; project administration, S.D.G., F.L., I.O. and A.T.; funding acquisition, F.L., I.O. and A.T. All authors have read and agreed to the published version of the manuscript.
Funding
This research is part of the project ClimOP, which is funded by the European Union’s Horizon 2020 Research and Innovation Programme under Grant Agreement number 875503.
Institutional Review Board Statement
Not applicable.
Informed Consent Statement
Not applicable.
Data Availability Statement
The data presented in this study are available on request from the corresponding author as long as they do not underlie any additional license conditions. Restrictions apply to Sabre Market Intelligence data and BADA4 aircraft performance data.
Acknowledgments
The author would like to thank the full ClimOP consortium as well as the members of the project’s advisory board for their support in preparing the achieved results and the fruitful discussions.
Conflicts of Interest
The authors declare no conflict of interest.
Abbreviations
The following abbreviations are used in this manuscript:
| aCCF | Algorithmic climate change function |
| ANSP | Air navigation service provider |
| ASHRAE | American Society of Heating, Refrigerating and Air-Conditioning Engineers |
| ASK | Available seat kilometers |
| ATR | Average temperature response |
| ATR20 | Average temperature response over 20 years |
| ATR100 | Average temperature response over 100 years |
| ATC | Air traffic control |
| ATS | Air traffic service |
| BADA4 | Base of aircraft data v.4.2 |
| BAU | Business-as-usual |
| CiC | Contrail-induced cirrus |
| CLIM | Operational improvement of climate-optimized flight planning |
| ClimOP | Climate assessment of innovative mitigation strategies towards |
| operational improvements in aviation | |
| CO | Carbon dioxide |
| CO-Eq | CO equivalents |
| CORSIA | Carbon Offsetting and Reduction Scheme for International Aviation |
| DLR | Deutsches Zentrum für Luft- und Raumfahrt e.V. (German Aerospace Centre) |
| DOC | Direct operating cost |
| ECAC | European Civil Aviation Conference |
| ECMWF | European Centre for Medium-Range Weather Forecasts |
| ELEC | Operational improvement of electrification of ground vehicles |
| ETS | European Union Emissions Trading System |
| F-ATR | Future-emission-scenario-based ATR |
| FABEC | Functional Airspace Block Europe Central |
| FREE | Operational improvement of free routing |
| GHG | Greenhouse gas |
| GPU | Ground power unit |
| GSE | Ground support equipment |
| GTP | Global temperature potential |
| GWP | Global warming potential |
| H&S | Hub-and-spoke network |
| HO | Water, water vapor |
| ICAO | International Civil Aviation Organization |
| INFR | Operational improvement of upgrade of airport infrastructure |
| ISO | Intermediate stop operations |
| ISOC | Operational improvements of climate-optimized intermediate stop operations |
| ITU | Istanbul Technical University |
| LCC | Low-cost carriers |
| LTO | Landing–take-off |
| KPI | Key performance indicator |
| LOSL | Operational improvement of reduced cruise altitudes and speed |
| MXP | Milan Malpensa airport |
| NCEP | National Centers for Environmental Prediction |
| NETW | Operational improvement of network optimization |
| NO | Nitrogen oxides |
| OI | Operational improvement |
| OD | Origin–destination |
| RedEmP | Reduced Emission Profiles |
| RF | Radiative forcing |
| SETX | Operational improvement of sustainable taxi operations |
| TCM | Trajectory Calculation Module |
| TGT | Trajectory Generation Tool |
| TOM | Trajectory Optimization Module |
| TOT | Trajectory Optimization Tool |
| WIND | Operational improvement of wind-optimal flight planning |
Appendix A. Assessment of Individual OIs
The following sections briefly describe the results of every OI-specific case study including its assessment approach and the obtained mitigation potentials, which is the basis for the comparability assessment of this study.
Appendix A.1. Trajectory-Related Measures
Since non-CO climate effects do not only depend on emission quantities or fuel consumption but also on the emission location, the time of release, and atmospheric background conditions [4,65,78], the climate impact of flight trajectories can be optimized by adjusting the routes in that regard [79]. Different degrees of freedom can be incorporated to optimize the climate mitigation potentials along the selected reference trajectories. In this context, climate mitigation potentials from reductions in cruise altitude and speed are investigated with the OI LOSL [14,25]. Moreover, the free-routing concept (FREE) allows the airspace users to plan the trajectories according to their needs without constraints by the fixed air traffic service (ATS) routes [80]. In this context, travel duration, fuel consumption, CO as well as non-CO emissions, and climate impact can be reduced by incorporating wind effects with different objective functions (WIND). By directly considering the climate impact in an overall objective function of the trajectory optimization, we are able to identify and evaluate climate-optimized trajectories analyzed in the OI CLIM [17,81].
Appendix A.1.1. Assessment Method
The goal of individually studying these trajectory-related OIs is to assess the respective climate mitigation potential in terms of ATR20, and the effects on non-climate KPIs such as fuel consumption, flight time, and DOC. The assessment approach is displayed in Figure A1.
Based on the defined reference missions, OI implementation scenarios representing the trajectory-based changes to these missions are defined, i.e., reduced cruise altitudes, adjusted speeds, or improved lateral routings. The respective trajectories are then re-modeled by applying either DLR’s Trajectory Calculation Module (TCM) as well as ITU’s Trajectory Generation Tool (TGT), or in the case of trajectory optimization, DLR’s Trajectory Optimization Module (TOM) and ITU’s Trajectory Optimization Tool (TOT) [17,46,47,82,83,84]. All above-mentioned tools rely on BADA4 aircraft performance data [85] and incorporate mission-specific wind data from weather forecast models. Results are combined with emission indices from the ICAO Engine emission data bank [86] to estimate emission quantities in accordance with fuel-flow correlation methods [87,88]. To incorporate economic effects on the stakeholders, an assessment of DOC is conducted based on fuel consumption and flight time with a model according to Thorbeck and Scholz [58,59]. To compute ATR20, an updated version of aCCFs is applied [67,68].

Figure A1.
Method to assess the climate impact of trajectory-related operational improvements.
Obviously, the definition of the reference case as well as the implementation scenario of the individual OIs vary for the different measures:
- An implementation of the OI LOSL was modeled by considering combinations of altitude shifts of 2000, 4000, and 6000 ft and speed reductions of 0, 5, and 10% in comparison to the reference case. The optimized set-up is selected based on minimum ATR20. The reference case was defined by a sample of flights on four representative days performed with two selected representative wide-body aircraft types on missions from or to the ECAC area.
- The OIs FREE and WIND have been implemented by focusing on one high-complexity en-route airspace in the ECAC area, namely EDUU, and using the flight plans and weather information on a representative winter day in 2018. Three case studies of OI implementation are evaluated to explore the mitigation potentials of the concept with different objective functions (i.e., the shortest path for FREE, the weighted sum of travel duration and fuel consumption, or prioritizing decreasing NO emissions by also considering fuel consumption and travel duration for WIND).
- The CLIM OI applies aCCFs to describe the climate impact of CO and non-CO effects in a set of trajectory optimization experiments. Therefore, the climate mitigation potential with respect to ATR20 was determined by avoiding climate-sensitive regions associated with different fuel penalties. Four city pairs with departures from the ECAC area were selected for the representative winter day.
Appendix A.1.2. Results
The OI-individual case study results and major differences are summarized in Table A1.
Appendix A.2. Network-Related Measures
The optimization of airline networks with strategic network planning or ISO can reduce the climate impact of aviation beyond a change of routing along a dedicated flight mission. The climate mitigation potential from optimizing the airline network considering ATR20 and profit simultaneously is assessed with the OI NETW [31]. ISO describes the concept of increasing fuel efficiency by shortening the stage length of a mission by performing intermediate stops for refueling. As less kerosene needs to be carried along the mission, aircraft mass and thus fuel consumption can be reduced [30]. The study in the context of ClimOP extends the concept [15,30,89] with a climate-optimization perspective so that both refueling airports and cruise altitudes are selected based on the associated change in climate impact in the ISOC case study [20,90].
Table A1.
Summary of results from individual assessment of trajectory-related OIs [45,47,48,70].
Table A1.
Summary of results from individual assessment of trajectory-related OIs [45,47,48,70].
| Climate Mitigation Potential | Change in DOC | Limitations | |
|---|---|---|---|
| LOSL [45,70] |
|
|
|
| FREE [47] | −24.4% on 11 December 2018 | −4.3% on 11 December 2018 |
|
| WIND [47] |
|
|
|
| CLIM [48] |
|
|
|
Appendix A.2.1. Assessment Method
The network-related OIs are analyzed regarding their climate mitigation potential in terms of reduction in ATR20 and ATR100. This is modeled either with an optimization of dedicated airline networks by considering not only profit but also climate impact or by splitting a mission with an intermediate stop for refueling in different scenarios (Figure A2). As those considerations typically influence long-term decisions, an aggregated climatological assessment approach is selected instead of incorporating time and weather-dependent effects on detailed missions. An annual European flight plan is investigated either with respect to certain airline types or all long-haul flights from the European network, which are suitable to ISO.
Trajectory modeling is performed with Reduced Emission Profiles (RedEmP) as derived from standardized TCM calculations applying BADA4 aircraft performance data [82,85] in combination with fuel-flow correlation methods to estimate emission quantities along standardized missions [87] for every possible combination of origin, destination, and aircraft. Climate impact assessment is performed with the climate chemistry response model AirClim [77,91] incorporating background emissions defined in a BAU scenario [8].
The modeling scenarios and the underlying flight network varies between the two investigated measures. On the one hand, airline network optimization problems involve a wide range of decisions, e.g., regarding fleet assignment, crew scheduling, route planning, and flight scheduling [92]. To address this complexity, a multi-agent optimization model is used to capture the interactions between different agents and optimize decisions for the entire network [31] incorporating factors such as weekly demand distribution or capacity constraints for the selected representative airlines KLM, TAP, and easyJet. On the other hand, the best configuration with regard to the climate impact is selected from a set of possible intermediate stop airports and preferred cruise altitudes in the course of ISOC.

Figure A2.
Method to assess the climate impact of network-related operational improvements.
Appendix A.2.2. Results
The results obtained in the individual studies and limitations to their comparability are summarized in the following Table A2.
Table A2.
Summary of results from individual assessment of network-related OIs [20,31].
Table A2.
Summary of results from individual assessment of network-related OIs [20,31].
| Change in ATR100 | Change in Profit/DOC | Limitations | |
|---|---|---|---|
| NETW [31,71] |
| Profit decrease by
|
|
| ISOC [20] | −40.3% | DOC increase by 20.9% |
|
Appendix A.3. Ground-Related Measures
In addition to operational measures in-flight, emissions and thus climate effects can be reduced on-ground. Three measures addressing different aspects of airport ground operations have been analyzed: Effects from replacing inefficient engine-powered taxiing with sustainable options, in this case electric towing (SETX), are investigated. In the project context [49,50], single-engine taxiing and autonomous eTaxi have also been studied but were excluded from this paper as their environmental impact reduction is significantly less than that of electric towing. Moreover, climate and stakeholder impacts from replacing the fuel-powered electric ground fleet with their electric equivalents (ELEC) and upgrading airport building infrastructure with energy-efficiency measures (INFR), i.e., insulation of exterior walls, optimization of windows, and introduction of LED lights, are examined.
Appendix A.3.1. Assessment Approach
Each of the selected OIs follows an individual assessment approach to obtain changes in fuel and energy consumption as well as emission quantities due to their specific characteristics, before the resulting climate effect is quantified.
For the assessment of SETX, we model the emissions on the basis of engine information and taxi times, as compared to the energy needed for towing vehicles for selected representative aircraft types (E190, A320, B738, and A350). Engine emission indices are derived from ICAO engine emissions data bank [86], while taxi-in and taxi-out times are based on recorded times for a representative selection of aircraft types on a peak day [93]. Engine warm-up and cool-down times are assumed to be 3 and 4 min. Potential fuel and resulting emission reductions are calculated considering measured taxiing times, engine-preparation times, and average fuel consumption rate for the engine in idle. The corresponding energy demand to power a fleet of electric tow trucks is calculated accordingly. Based on the assumption that approximately 80% of the values of fuel consumption and energy demand (and corresponding GHG emissions) of a peak day are representative of an average day of operations, results are extrapolated to the entire reference year 2018. The economic assessment is based on the initial investment per tow truck considering the optimal number of tow trucks at the selected airport [49,50].
To quantify the effects of ELEC, ground vehicles are classified regarding vehicle size (small-, medium-, and large-sized) and traction (petrol, diesel, and electric). The corresponding emissions are estimated as well as the emissions from the assumed European mix of electrical energy sources to fuel the electric vehicles. On this basis, emissions from petrol and diesel vehicles can be compared to their electric equivalent. Consequently, results are used to calculate the overall savings for any vehicle fleet. Based on the detailed available data at MXP on the actual ground fleet composition and average daily mileage of each vehicle, results from the OIs implementation in terms of fuel and energy consumption can be compared to the BAU reference case [49].
The assessment of INFR is performed with the EnergyPlus model (The open-source software developed by the US Department of Energy, https://energyplus.net, accessed on 2 March 2023), and focuses on the reduction of CO emissions of a conceptual office building due to the application of the selected energy-efficiency measures mentioned above. In this course, different climate zones according to the American Society of Heating, Refrigerating and Air-Conditioning Engineers (ASHRAE) classification of the geographical distribution of climate conditions are utilized to model the energy consumption of the conceptual office building at different locations. Results obtained for one conceptual office building are then scaled to the total energy consumption at the airport level through a proxy calculated as a logarithmic function of the number of aircraft movements [49,51].
Finally, the climate impact assessment for all three considered OIs is performed based on the obtained emission quantities and converted into ATR following Sausen and Schumann [69].
Appendix A.3.2. Results
Detailed results obtained for an individual assessment in the high-resolution experiment at MXP are summarized in Table A3. Combining the potentials from the individual OIs at MXP, we observe an overall climate mitigation potential of 50.1%. Moreover, investment costs at MXP are estimated between 5 and 113 million euros to implement the investigated OI associated with different time periods to reach break-even.
Table A3.
Relative changes in selected KPIs for implementation of ground-related OIs at Malpensa airport for the reference year 2018 [49]. Infinite increase for energy consumption results from zero electricity need in BAU scenario.
Table A3.
Relative changes in selected KPIs for implementation of ground-related OIs at Malpensa airport for the reference year 2018 [49]. Infinite increase for energy consumption results from zero electricity need in BAU scenario.
| Emissions | Fuel | Energy | ATR100 | Limitations | |
|---|---|---|---|---|---|
| SETX |
| −54.2% | Inf | −54.4% |
|
| ELEC |
| −100% | Inf | −84.1% |
|
| INFR |
| - | −18.5% | −21.0% |
|
Appendix B. Validation of In-Flight Scaling Approach
A validation of the above-described scaling approach (Section 2.3.1) and analysis of the resulting goodness-of-fit is performed based on the detailed assessment of the ISOC study. Further details on the study can be found in Section A.2. Based on a broader sample of long-range flights with determined climate and non-climate KPIs, we assess ATR100 for different randomly generated flight plans of different reference sample sizes (n). Results can then be related to the known ATR. Furthermore, the applicability of the approach to assess mitigation potentials from implementing the OI on a restricted flight sample (e.g., limited by geographic or fleet restrictions) is demonstrated based on the individual study results.
Figure A3 illustrates the deviation in estimated ATR100 from the originally calculated value for 100 randomly generated flight plans (n = 100) with a sample size of 500 flights (n = 500), where an aggregated scaling is performed on different available parameters. We find that the combination of ASK and CO-Eq scaling reduces deviations to values between ±4% compared to approaches based on alternative parameters.
We observe that the estimation can be improved by applying matching schemes instead of aggregated scaling. Different matching approaches can incorporate effects from flight distance, aircraft type, and geographic location. For instance, a cluster-based matching approach (CLU1) selects a sample of comparable reference flights for every target flight based on the connected origin and destination airports, which have previously been assigned to 15 global clusters. Different individual matching approaches (IND1 and IND2) identify the best matching flight from the reference sample for every target flight based on aircraft type, flight distance, and average flight latitude with different weighting factors. Figure A4 left shows larger deviations for the randomly generated flight plans (n = 100, n = 300) for the aggregated approach between +4.3% and −4.2%, while this can be reduced to values between +1.3% and −1.5% (excluding outliers) with a flight matching. The sample size of the reference flight plan has a significant influence on the accuracy of results and the related goodness-of-fit. Figure A4 right illustrates deviations in scaled and originally estimated ATR100 showing improvements with increasing n. Hence, the explanatory power of the above-described method also varies for different sample sizes and is limited for a very small sample of flights. Also, composition of the reference flight plan in terms of covered missions and aircraft types influences the accuracy of the scaling approach.

Figure A3.
Scaling results for ATR100 of the ISOC study for different parameters and in relation to the originally estimated value. The reference flight plan has randomly been generated with n = 100 and n = 500.

Figure A4.
Relative scaling results for ATR100 of the ISOC study for different matching approaches (left, n = 100, n = 300) and different sample sizes of the reference flight plan (right, n = 100, n = 5 to 1000).
The above-described method is also applicable to transfer mitigation potentials obtained for a limited scope to the mitigation potentials of a broader scale. For instance, implementation of an OI for North Atlantic flights leading to a certain mitigation potential would be reduced if considering all long-range flights to or from European destinations as a reference. For instance, an individual study of ISOC for flights crossing the North Atlantic shows a mitigation potential in terms of ATR100 of 35.6%. If this is related to the total European long-range traffic, implementation of ISO on North Atlantic flights results in a mitigation potential of 14.0%. Applying the previously described scaling method results in estimations of the impact between 13.9% and 15.3% dependent of the matching applied. We find that easy scaling approaches, e.g., considering flight plan size, flight distance, ASK, or fuel consumption, tend to overestimate the mitigation potential (estimates between 15.1% and 16.7%). By contrast, a flight plan matching improves the estimation quality to a deviation of less than 0.1% in this example.
References
- Edenhofer, O.; Pichs-Madruga, R.; Sokona, Y.; Seyboth, K.; Arvizu, D.; Bruckner, T.; Christensen, J.M.; Devarnay, J.M.; Faaij, A.; Fischedick, M.; et al. Summary for Policymakers. In IPCC Special Report on Renewable Energy Sources and Climate Change Mitigation; Edenhofer, O., Pichs-Madruga, R., Sokona, Y., Seyboth, K., Matschoss, P., Kadner, S., Zwickel, T., Eickemeier, P., Hansen, G., Schlömer, S., et al., Eds.; Cambridge University Press: Cambridge, UK, 2011. [Google Scholar]
- Fuglesvedt, J.; Berntsen, T.; Godal, O.; Sausen, R.; Shine, K.; Skodvin, T. Metrics of Climate Change: Assessing Radiative Forcing and Emission Indices. Clim. Chang. 2003, 58, 267–331. [Google Scholar] [CrossRef]
- Lee, D.; Fahey, D.; Skowron, A.; Allen, M.; Burkhardt, U.; Chen, Q.; Doherty, S.; Freeman, S.; Forster, P.; Fuglestvedt, J.; et al. The contribution of global aviation to anthropogenic climate forcing for 2000 to 2018. Atmos. Environ. 2021, 244, 117834. [Google Scholar] [CrossRef] [PubMed]
- Lee, D.; Pitari, G.; Grewe, V.; Gierens, K.; Penner, J.; Petzold, A.; Prather, M.; Schumann, U.; Bais, A.; Berntsen, T.; et al. Transport impacts on atmosphere and climate: Aviation. Atmos. Environ. 2010, 44, 4678–4734. [Google Scholar] [CrossRef] [PubMed]
- Aviation Benefits Beyond Borders (ATAG). Waypoint 2050. 2021. Available online: https://aviationbenefits.org/environmental-efficiency/climate-action/waypoint-2050/ (accessed on 5 October 2022).
- European Commission. Europe’s Vision for Sustainable Aviation—Report of the Advisory Council for Aviation Research and Innovation in Europe (ACARE). 2022. Available online: https://www.acare4europe.org/wp-content/uploads/2022/06/20220815_Fly-the-green-deal_LR-1.pdf (accessed on 28 June 2023).
- International air transport association (IATA). Net-Zero Carbon Emissions by 2050. Press Release no. 66. Available online: https://www.iata.org/en/pressroom/pressroom-archive/2021-releases/2021-10-04-03/ (accessed on 7 July 2022).
- Grewe, V.; Gangoli Rao, A.; Grönstedt, T.; Xisto, C.; Linke, F.; Melkert, J.; Middel, J.; Ohlenforst, B.; Blakey, S.; Christie, S.; et al. Evaluating the climate impact of aviation emission scenarios towards the Paris agreement including COVID-19 effects. Nat. Commun. 2021, 12, 3841. [Google Scholar] [CrossRef]
- Singh, V.; Sharma, S.K. Fuel consumption optimization in air transport: A review, classification, critique, simple meta-analysis, and future research implications. Eur. Transp. Res. Rev. 2015, 7, 12. [Google Scholar] [CrossRef]
- Green, J. Air Travel—Greener by Design mitigating the environmental impact of aviation: Opportunities and priorities—Report of the air travel—Greener by Design science and Technology Sub Group London. Aeronaut. J. 2005, 109, 361–416. [Google Scholar]
- Cabrera, E.; de Sousa, J.M.M. Use of Sustainable Fuels in Aviation—A Review. Energies 2022, 15, 2440. [Google Scholar] [CrossRef]
- Klöwer, M.; Allen, M.R.; Lee, D.S.; Proud, S.R.; Gallagher, L.; Skowron, A. Quantifying aviation’s contribution to global warming. Environ. Res. Lett. 2021, 16, 104027. [Google Scholar] [CrossRef]
- Burkhardt, U.; Bock, L.; Bier, A. Mitigating the contrail cirrus climate impact by reducing aircraft soot number emissions. npj Clim. Atmos. Sci. 2018, 1, 37. [Google Scholar] [CrossRef]
- Dahlmann, K.; Koch, A.; Linke, F.; Lührs, B.; Grewe, V.; Otten, T.; Seider, D.; Gollnick, V.; Schumann, U. Climate-Compatible Air Transport System—Climate Impact Mitigation Potential for Actual and Future Aircraft. Aerospace 2016, 3, 38. [Google Scholar] [CrossRef]
- Linke, F.; Grewe, V.; Gollnick, V. The Implications of Intermediate Stop Operations on Aviation Emissions and Climate. Meteorol. Z. 2017, 26, 697–709. [Google Scholar] [CrossRef]
- Teoh, R.; Schumann, U.; Majumdar, A.; Stettler, M.E.J. Mitigating the Climate Forcing of Aircraft Contrails by Small-Scale Diversions and Technology Adoption. Environ. Sci. Technol. 2020, 54, 2941–2950. [Google Scholar] [CrossRef] [PubMed]
- Lührs, B.; Linke, F.; Matthes, S.; Grewe, V.; Yin, F. Climate Impact Mitigation Potential of European Air Traffic in a Weather Situation with Strong Contrail Formation. Aerospace 2021, 8, 50. [Google Scholar] [CrossRef]
- Matthes, S.; Lim, L.; Burkhardt, U.; Dahlmann, K.; Dietmüller, S.; Grewe, V.; Haslerud, A.S.; Hendricks, J.; Owen, B.; Pitari, G.; et al. Mitigation of non-CO2 aviation’s climate impact by changing cruise altitudes. Aerospace 2021, 8, 36. [Google Scholar] [CrossRef]
- Marks, T.; Dahlmann, K.; Grewe, V.; Gollnick, V.; Linke, F.; Matthes, S.; Stumpf, E.; Swaid, M.; Unterstrasser, S.; Yamashita, H.; et al. Climate Impact Mitigation Potential of Formation Flight. Aerospace 2021, 8, 14. [Google Scholar] [CrossRef]
- Zengerling, Z.L.; Linke, F.; Weder, C.M.; Dahlmann, K. Climate-Optimised Intermediate Stop Operations: Mitigation Potential and Differences from Fuel-Optimised Configuration. Appl. Sci. 2022, 12, 12499. [Google Scholar] [CrossRef]
- Aviation Benefits Beyond Borders (ATAG). Aviation Climate Solutions. 2015. Available online: https://aviationbenefits.org/media/125796/Aviation-Climate-Solutions_WEB.pdf (accessed on 28 June 2023).
- Sridhar, B.; Chen, N.; Ng, H. Aircraft Trajectory Design Based on Reducing the Combined Effects of Carbon-Di-Oxide, Oxides of Nitrogen and Contrails. In Proceedings of the AIAA Modeling and Simulation Technologies Conference 2014, National Harbor, MD, USA, 13–17 January 2014. [Google Scholar] [CrossRef]
- Grewe, V.; Matthes, S.; Frömming, C.; Brinkop, S.; Jöckel, P.; Gierens, K.; Champougny, T.; Fuglestvedt, J.; Haslerud, A.; Irvine, E.; et al. Feasibility of climate-optimized air traffic routing for trans-Atlantic flights. Environ. Res. Lett. 2017, 12, 034003. [Google Scholar] [CrossRef]
- Matthes, S.; Grewe, V.; Dahlmann, K.; Frömming, C.; Irvine, E.; Lim, L.; Linke, F.; Lührs, B.; Owen, B.; Shine, K.; et al. A Concept for Multi-Criteria Environmental Assessment of Aircraft Trajectories. Aerospace 2017, 4, 42. [Google Scholar] [CrossRef]
- Koch, A. Climate Impact Mitigation Potential Given by Flight Profile and Aircraft Optimization. Ph.D. Thesis, Technische Universität Hamburg-Harburg, Hamburg, Germany, 2013. [Google Scholar] [CrossRef]
- Frömming, C.; Ponater, M.; Dahlmann, K.; Grewe, V.; Lee, D.; Sausen, R. Aviation-induced radiative forcing and surface temperature change in dependency of the emission altitude. J. Geophys. Res. Atmos. 2012, 117, D19104. [Google Scholar] [CrossRef]
- SESAR Joint Undertaking. Optimised Traffic Management to Enable Free Routing in High and Very High Complexity Environment. Available online: https://www.sesarju.eu/sesar-solutions/optimised-traffic-management-enable-free-routinghigh-and-very-high-complexity (accessed on 7 May 2020).
- SESAR Joint Undertaking. Continuous Descent Operations (CDO) Using Point Merge. Available online: https://www.sesarju.eu/sesar-solutions/continuous-descent-operationscdo-using-point-merge (accessed on 7 May 2020).
- Yin, F.; Grewe, V.; Frömming, C.; Yamashita, H. Impact on flight trajectory characteristics when avoiding the formation of persistent contrails for transatlantic flights. Transp. Res. Part D Transp. Environ. 2018, 65, 466–484. [Google Scholar] [CrossRef]
- Linke, F. The Global Fuel Saving Potential of Intermediate Stop Operations Considering Meteorological and Operational Influences. In Proceedings of the 31st Congress of the International Council of the Aeronautical Sciences (ICAS), Belo Horizonte, Brazil, 9–14 September 2018. [Google Scholar]
- Noorafza, M.; Santos, B.F.; Sharpanskykh, A.; Zengerling, Z.L.; Weder, C.M.; Linke, F.; Grewe, V. Airline Network Planning Considering Climate Impact: Assessing New Operational Improvements. Appl. Sci. 2023, 13, 6722. [Google Scholar] [CrossRef]
- Morrell, P. The potential for European aviation CO2 emissions reduction through the use of larger jet aircraft. J. Air Transp. Manag. 2009, 15, 151–157. [Google Scholar] [CrossRef]
- Braun, M.; Koch, A.; Dahlmann, K.; Grewe, V.; Gollnick, V.; Nagel, B. An Airline Network Design Approach Considering, Environmental and Economical Targets. In Proceedings of the 27th Congress of the International Council of the Aeronautical Sciences 2010 (ICAS 2010), Nice, France, 19–24 September 2010. [Google Scholar]
- Greer, F.; Rakas, J.; Horvath, A. Airports and environmental sustainability: A comprehensive review. Environ. Res. Lett. 2020, 15, 103007. [Google Scholar] [CrossRef]
- van Baaren, E.; Roling, P. The feasibility of a fully electric aircraft towing system. Master’s Thesis, Delft University of Technology, Delft, The Netherlands, 2019. Available online: http://resolver.tudelft.nl/uuid:c47a1e3e-8d3b-4eda-8b3b-134ae29f6af9 (accessed on 3 March 2023).
- Wijnterp, C.; Roling, P.; Wilde, W.; Curran, R. Electric Taxi Systems: An operations and value estimation. In Proceedings of the 14th AIAA Aviation Technology, Integration, and Operations Conference, Atlanta, GA, USA, 16–20 June 2014. [Google Scholar] [CrossRef]
- Gulan, K.; Cotilla-Sanchez, E.; Cao, Y. Charging Analysis of Ground Support Vehicles in an Electrified Airport. In Proceedings of the 2019 IEEE Transportation Electrification Conference and Expo (ITEC), Detroit, MI, USA, 19–21 June 2019; pp. 1–6. [Google Scholar] [CrossRef]
- Martins, J.; Brito, F.; Pedrosa, D.; Monteiro, V.; Afonso, J. Real-Life Comparison between Diesel and Electric Car Energy Consumption; Nova Science Publishers: Hauppauge, NY, USA, 2013. [Google Scholar]
- EASA; EUROCONTROL; EEA. European Aviation Environmental Report 2019. Environmental Report; 2019. Available online: https://www.eurocontrol.int/publication/european-aviation-environmental-report-2019 (accessed on 28 June 2023).
- Langhans, S.; Linke, F.; Gollnick, V. System Analysis for an Intermediate Stop Operations Concept on Long Range Routes. J. Aircr. 2013, 50, 29–37. [Google Scholar] [CrossRef]
- Grewe, V.; Dahlmann, K.; Flink, J.; Frömming, C.; Ghosh, R.; Gierens, K.; Heller, R.; Hendricks, J.; Jöckel, P.; Kaufmann, S.; et al. Mitigating the Climate Impact from Aviation: Achievements and Results of the DLR WeCare Project. Aerospace 2017, 4, 34. [Google Scholar] [CrossRef]
- Dray, L.; Schäfer, A.; Grobler, C.; Falter, C.; Allroggen, F.; Stettler, M.; Barrett, S. Cost and emissions pathways towards net-zero climate impacts in aviation. Nat. Clim. Chang. 2022, 12, 956–962. [Google Scholar] [CrossRef]
- ClimOp Consortium. D1.4—Report on the Selection and Review of Operational Improvements to Be Investigated. Project Report. 2020. Available online: https://www.climop-h2020.eu/portfolio-items/d1-4-report-on-the-selection-and-review-of-operational-improvements-to-be-investigated/ (accessed on 5 April 2023).
- ClimOp Consortium. D1.5—Second Iteration for the Identification, Assessment and Selection of Operational Improvements. Project Report. 2022. Available online: https://www.climop-h2020.eu/portfolio-items/d1-5-second-iteration-for-the-identification-assessment-and-selection-of-operational-improvements/ (accessed on 5 April 2023).
- Zengerling, Z.L.; Linke, F.; Weder, C.M.; Dietmüller, S.; Matthes, S.; Peter, P. Flying low and slow: Application of algorithmic climate change functions to assess the cliamte mitigation potential of reduced cruise altitudes and speeds on different days. Meteorol. Z. 2023; Submitted, under review. [Google Scholar]
- Başpinar, B.; Balakrishnan, H.; Koyuncu, E. Mission Planning and Control of Multi-Aircraft Systems With Signal Temporal Logic Specifications. IEEE Access 2019, 7, 155941–155950. [Google Scholar] [CrossRef]
- Gencoglu, Y.; Baspinar, B. Free Routing in High-Complexity Airspace: Impact Assessment for Environment and Aviation Stakeholders. J. Aerosp. Inf. Syst. 2023, 1–9. [Google Scholar] [CrossRef]
- Peter, P.; Matthes, S.; Linke, F.; Lührs, B. Sensitivity of mitigation of climate effects to strength of contrail cirrus climate effect. 2023; In preparation. [Google Scholar]
- Tomatis, L.; Abate, C.; Tedeschi, A.; Gesso, S.D.; Roling, P.; Ermis, G.; Branchini, E.; Bissossero, L.; Grampella, M. How much do ground operations contribute to global warming? In Proceedings of the TSA 2022 Summit, Toulouse, France, 18–20 October 2022. [Google Scholar]
- Roling, P.C.; Segeren, M. Cost Benefit and Environmental Impact Assessment of Operational Towing. In Proceedings of the AIAA AVIATION 2023 Forum, San Diego, CA, USA and Online, 12–16 June 2023. [Google Scholar] [CrossRef]
- Gesso, S.D. Assessment of energy efficiency investments in European airport infrastructures under climate change. 2023; In preparation. [Google Scholar]
- Grewe, V.; Dahlmann, K. How ambiguous are climate metrics? And are we prepared to assess and compare the climate impact of new air traffic technologies? Atmos. Environ. 2015, 106, 373–374. [Google Scholar] [CrossRef]
- Fuglestvedt, J.; Shine, K.; Berntsen, T.; Cook, J.; Lee, D.; Stenke, A.; Skeie, R.; Velders, G.; Waitz, I. Transport impacts on atmosphere and climate: Metrics. Transport Impacts on Atmosphere and Climate: The ATTICA Assessment Report. Atmos. Environ. 2010, 44, 4648–4677. [Google Scholar] [CrossRef]
- Shine, K.; Fuglestvedt, J.; Hailemariam, K.; Stuber, N. Alternatives to the Global Warming Potential for Comparing Climate Impacts of Emissions of Greenhouse Gases. Clim. Chang. 2005, 68, 281–302. [Google Scholar] [CrossRef]
- Dallara, E.; Kroo, I.; Waitz, I. Metric for Comparing Lifetime Average Climate Impact of Aircraft. AIAA J. 2011, 49, 1600–1613. [Google Scholar] [CrossRef]
- Dahlmann, K. Eine Methode zur Effizienten Bewertung von Maßnahmen zur Klimaoptimierung des Luftverkehrs. Ph.D. Thesis, Ludwig-Maximilians-Universität München, Munich, Germany, 2012. [Google Scholar]
- Niklaß, M.; Dahlmann, K.; Grewe, V.; Maertens, S.; Plohr, M.; Scheelhaase, J.; Schwieger, J.; Brodmann, U.; Kurzböck, C.; Repmann, M.; et al. Integration of Non-CO2 Effects of Aviation in the EU ETS and under CORSIA. Project Report, German Environment Agency. 2019. Available online: https://www.umweltbundesamt.de/sites/default/files/medien/1410/publikationen/2020-07-28_climatechange_20-2020_integrationofnonco2effects_finalreport_.pdf (accessed on 20 June 2023).
- Thorbeck, J.; Scholz, D. DOC-Assessment Method—TU Berlin—DOC Method. In Proceedings of the 3rd Symposium on Collaboration in Aircraft Design, Linköping, Sweden, 19 September 2013. [Google Scholar]
- Risse, K.; Schäfer, K.; Schültke, F.; Stumpf, E. Central Reference Aircraft data System (CeRAS) for research community. CEAS Aeronaut. J. 2016, 7, 121–133. [Google Scholar] [CrossRef]
- Pohya, A.; Wicke, K.; Hartmann, J. Comparison of Direct Operating Cost and Life Cycle Cost-Benefit Methods in Aircraft Technology Assessment. In Proceedings of the 2018 AIAA Aerospace Sciences Meeting, Kissimmee, FL, USA, 8–12 January 2018. [Google Scholar] [CrossRef]
- Bodegraven, G. Commercial aircraft DOC methods. In Proceedings of the American Institute of Aeronautics and Astronautics Aircraft Design, Systems and Operations Conference, Dayton, OH, USA, 17–19 September 1990. [Google Scholar] [CrossRef]
- Wüstenhagen, R.; Wolsink, M.; Bürer, M.J. Social acceptance of renewable energy innovation: An introduction to the concept. Energy Policy 2007, 35, 2683–2691. [Google Scholar] [CrossRef]
- Fichter, C. Climate Impact of Air Traffic Emissions in Dependency of the Emission Location and Altitude. Ph.D. Thesis, LMU München, München, Germany, 2009. [Google Scholar]
- Schumann, U. Aircraft emissions. Encycl. Glob. Environ. Chang. 2002, 3, 178–186. [Google Scholar]
- Frömming, C.; Grewe, V.; Brinkop, S.; Jöckel, P.; Haslerud, A.S.; Rosanka, S.; van Manen, J.; Matthes, S. Influence of weather situation on non-CO2 aviation climate effects: The REACT4C climate change functions. Atmos. Chem. Phys. 2021, 21, 9151–9172. [Google Scholar] [CrossRef]
- Dahlmann, K.; Volker, G.; Matthes, S.; Yamashita, H. Climate assessment of single flights: Deduction of route specific equivalent CO2 emissions. Int. J. Sustain. Transp. 2021, 17, 29–40. [Google Scholar] [CrossRef]
- Dietmüller, S.; Matthes, S.; Dahlmann, K.; Yamashita, H.; Simorgh, A.; Soler, M.; Linke, F.; Lührs, B.; Meuser, M.M.; Weder, C.; et al. A python library for computing individual and merged non-CO2 algorithmic climate change functions: CLIMaCCF V1.0. Geosci. Model Dev. Discuss. 2022, 2022, 1–33. [Google Scholar] [CrossRef]
- Yin, F.; Grewe, V.; Castino, F.; Rao, P.; Matthes, S.; Dahlmann, K.; Dietmüller, S.; Frömming, C.; Yamashita, H.; Peter, P.; et al. Predicting the climate impact of aviation for en-route emissions: The algorithmic climate change function submodel ACCF 1.0 of EMAC 2.53. Geosci. Model Dev. Discuss. 2022, 2022, 1–34. [Google Scholar] [CrossRef]
- Sausen, R.; Schumann, U. Estimates of the Climate Response to Aircraft CO2 and NOx Emissions Scenarios. Clim. Chang. 2000, 44, 27–58. [Google Scholar] [CrossRef]
- Zengerling, Z.L.; Linke, F.; Weder, C.M.; Matthes, S. Flying low and slow: Climate mitigation potential of reduced cruise altitudes and speeds in different seasons. In Proceedings of the 5th International Conference on Transport, Atmosphere and Climate (TAC), Bad Aibling, Germany, 27–30 June 2022. [Google Scholar]
- ClimOp Consortium. Report on the Climate Impact of the Second Set of Operational Improvement Options. Project Report. 2022. Available online: https://www.climop-h2020.eu/portfolio-items/d2-4-report-on-the-climate-impact-of-the-second-set-of-operational-improvement-options/ (accessed on 5 April 2023).
- Functional Airspace Block Europe Central (FABEC). Best for the Environment. Online Report. 2023. Available online: https://fabec.eu/who-we-are/optimised-performance/best-for-the-environment (accessed on 15 May 2023).
- Functional Airspace Block Europe Central (FABEC). Performance Report 2015–2019: Environment, December 2018–December 2019. Performance Report. 2023. Available online: https://www.fabec.eu/who-we-are/optimised-performance/performance-reports (accessed on 15 May 2023).
- Functional Airspace Block Europe Central (FABEC). Performance Report 2020–2024: Environment, December 2020–December 2021. Performance Report. 2023. Available online: https://www.fabec.eu/who-we-are/optimised-performance/performance-reports (accessed on 15 May 2023).
- Castino, F.; Yin, F.; Grewe, V.; Soler, M.; Simorgh, A.; Yamashita, H.; Matthes, S.; Baumann, S.; Dietmüller, S.; Linke, F.; et al. Seasonal variability of aircraft trajectories reducing NOx-climate impacts under a multitude of weather patterns. In Proceedings of the 11th SESAR Innovation Days, Virtual Event, 7–9 December 2021; Available online: https://repository.tudelft.nl/islandora/object/uuid%3A7bbf56c6-63bd-4645-b183-560002cb4190 (accessed on 15 February 2023).
- ClimOp Consortium. A Dashboard with the Air Passengers’ Opinion. Survey. 2023. Available online: https://www.climop-h2020.eu/portfolio-items/air-passengers-opinion/ (accessed on 5 April 2023).
- Dahlmann, K.; Grewe, V.; Frömming, C.; Burkhardt, U. Can we reliably assess climate mitigation options for air traffic scenarios despite large uncertainties in atmospheric processes? Transp. Res. Part D Transp. Environ. 2016, 46, 40–55. [Google Scholar] [CrossRef]
- Irvine, E.A.; Hoskins, B.J.; Shine, K.P. The dependence of contrail formation on the weather pattern and altitude in the North Atlantic. Geophys. Res. Lett. 2012, 39, L12802. [Google Scholar] [CrossRef]
- Simorgh, A.; Soler, M.; González-Arribas, D.; Matthes, S.; Grewe, V.; Dietmüller, S.; Baumann, S.; Yamashita, H.; Yin, F.; Castino, F.; et al. A Comprehensive Survey on Climate Optimal Aircraft Trajectory Planning. Aerospace 2022, 9, 146. [Google Scholar] [CrossRef]
- EUROCONTROL. The Free Route Airspace Project—Environmental Benefit Analysis; EEC/BA/ENV/Note 004/2002; EUROCONTROL: Bretigny-sur-Orge, France, 2002.
- Volker, G.; Frömming, C.; Matthes, S.; Brinkop, S.; Ponater, M.; Dietmüller, S.; Jöckel, P.; Garny, H.; Tsati, E.; Dahlmann, K.; et al. Aircraft routing with minimal climate impact: The REACT4C climate cost function modelling approach (V1.0). Geosci. Model Dev. 2014, 7, 175–201. [Google Scholar] [CrossRef]
- Linke, F. Ökologische Analyse Operationeller Lufttransportkonzepte. Ph.D. Thesis, Technische Universität Hamburg, Hamburg, Germany, 2016. [Google Scholar]
- Baspinar, B.; Uzun, M.; Guven, A.F.; Basturk, T.; Tasdelen, I.; Koyuncu, E.; Inalhan, G. A 4D trajectory generation infrastructure tool for controller working position. In Proceedings of the 2017 IEEE/AIAA 36th Digital Avionics Systems Conference (DASC), St. Petersburg, FL, USA, 17–21 September 2017; pp. 1–10. [Google Scholar] [CrossRef]
- Başpınar, B.; Balakrishnan, H.; Koyuncu, E. Optimization-Based Autonomous Air Traffic Control for Airspace Capacity Improvement. IEEE Trans. Aerosp. Electron. Syst. 2020, 56, 4814–4830. [Google Scholar] [CrossRef]
- Nuic, A.; Poles, D.; Mouillet, V. BADA: An advanced aircraft performance model for present and future ATM systems. Int. J. Adapt. Control Signal Process. 2010, 24, 850–866. [Google Scholar] [CrossRef]
- International Civil Aviation Organisaiton (ICAO). ICAO Aircraft Engine Emissions Data Bank. Available online: https://www.easa.europa.eu/domains/environment/icao-aircraft-engine-emissions-databank (accessed on 18 July 2022).
- Schäfer, M.; Bartosch, S. Overview on Fuel Flow Correlation Methods for the Calculation of NOx, CO and HC Emissions and Their Implementation into Aircraft Performance Software; Internal report IB-325-11-13; Deutsches Zentrum für Luft- und Raumfahrt: Cologne, Germany, 2013. [Google Scholar]
- DuBois, D.; Paynter, G.C. “Fuel Flow Method2” for Estimating Aircraft Emissions; SAE Technical Paper 2006-01-1987; SAE International: Warrendale, PA, USA, 2006. [Google Scholar] [CrossRef]
- Hartjes, S.; Bos, F. Evaluation of Intermediate Stop Operations in Long-haul Flights. Transp. Res. Procedia 2015, 10, 951–959. [Google Scholar] [CrossRef][Green Version]
- Zengerling, Z.L.; Linke, F.; Weder, C.M.; Dahlmann, K. A comparison of climate-optimised and fuel-optimised intermediate stop operations for selected case studies. In Proceedings of the 33rd Congress of the International Council of the Aeronautical Sciences (ICAS), Stockholm, Sweden, 4–9 September 2022. [Google Scholar]
- Grewe, V.; Stenke, A. AirClim: An efficient tool for climate evaluation of aircraft technology. Atmos. Chem. Phys. 2008, 8, 4621–4639. [Google Scholar] [CrossRef]
- Barnhart, C.; Lu, F.; Shenoi, R. Integrated Airline Schedule Planning. In Operations Research in the Airline Industry; Yu, G., Ed.; Springer: Boston, MA, USA, 1998; pp. 384–403. [Google Scholar] [CrossRef]
- EUROCONTROL. Taxi Times—Summer 2018. Technical Report; 2018. Available online: https://www.eurocontrol.int/publication/taxi-times-summer-2018 (accessed on 17 June 2023).
Disclaimer/Publisher’s Note: The statements, opinions and data contained in all publications are solely those of the individual author(s) and contributor(s) and not of MDPI and/or the editor(s). MDPI and/or the editor(s) disclaim responsibility for any injury to people or property resulting from any ideas, methods, instructions or products referred to in the content. |
© 2023 by the authors. Licensee MDPI, Basel, Switzerland. This article is an open access article distributed under the terms and conditions of the Creative Commons Attribution (CC BY) license (https://creativecommons.org/licenses/by/4.0/).