Article

Comfort Study of General Aviation Pilot Seats Based on Improved Particle Swam Algorithm (IPSO) and Support Vector Machine Regression (SVR)

1
Mechanical and Electrical Engineering College, Northeast Forestry University, Harbin 150040, China
2
Materials Science and Engineering College, Northeast Forestry University, Harbin 150040, China
*
Author to whom correspondence should be addressed.
Appl. Sci. 2023, 13(15), 9038; https://doi.org/10.3390/app13159038
Submission received: 8 July 2023 / Revised: 30 July 2023 / Accepted: 3 August 2023 / Published: 7 August 2023

Abstract

:
Little work has been carried out to predict the comfort of aircraft seats, a component in close contact with the human body during travel. In order to more accurately predict the nonlinear and complex relationship between subjective and objective evaluations of comfort, this paper proposes a prediction method based on the Improved Particle Swarm Algorithm (IPSO) and optimized Support Vector Machine Regression (SVR). Focusing on the problems of the too-fast convergence and low accuracy of the traditional particle swarm algorithm (PSO), the improved particle swarm algorithm (IPSO) is obtained by linearly decreasing the dynamic adjustments of inertia weight ω , self-learning factor c 1 , and social factor c 2 ; then, the penalty parameter C and kernel function parameter σ of SVR are optimized by the IPSO algorithm, and the comfort prediction of IPSO-SVR is established. The prediction accuracy of IPSO-SVR was 94.00%, the root mean square error RMSE was 0.37, the mean absolute value error MAE was 0.32, and the goodness of fit R2 was 0.92. The results show that the optimized IPSO-SVR prediction model can more accurately predict seat comfort under different angles and backrest tilt angles and can provide reference and research value for related industries. The results show that the optimized nonlinear prediction model of IPSO-SVR has higher accuracy, and its prediction method is feasible and generalizable, meaning it can provide a reliable basis for the prediction of seat comfort under different angles and backrest inclinations, as well as providing reference and research value for related industries.

1. Introduction

In recent years, with the development of aviation technology, aircraft have become an important means of transport, and modern aircraft are developing rapidly in the direction of low consumption, high safety, and high comfort. Aircraft seats, as objects that are in direct contact with the driver and passengers, have very high requirements for comfort. Pilots, in particular, as a special profession, work in aircraft almost every day and are subject to a variety of conditions, due to the unreasonable front-to-back distance and backrest angle of the driver’s seat, which can lead to back pain and poor blood flow over long periods of time. In a survey, it was shown that out of 566 pilots of different aircraft types, about 64% suffered from lower back pain [1]. Prolonged sitting in uncomfortable seats with improper sitting postures can lead to susceptibility to fatigue, lower back pain, and musculoskeletal disorders [2], and can have a serious impact on the human lumbar musculoskeletal and skeletal systems [3]. Smaller tilt angles are more likely to cause discomfort, pain, and deteriorations in work characterized by higher intensity [4]. Therefore, irrational seating surface designs can lead to dissatisfaction, discomfort, and fatigue in the user, which can lead to lower productivity. Similarly, less recognizable psychological disorders such as depression, anxiety, and even schizophrenia may occur [5,6], which are both physically and psychologically unfavourable.
Based on comfort assessment methods, Vanacorea et al. [7] investigated the relationship between seat comfort and users by collecting subjective data to assess passenger comfort, and concluded that their perception of comfort was related to seat floor thickness and backrest tilt angle. Wang et al. [8] used subjective evaluations and combined them with the Smith questionnaire [9,10] to conduct a questionnaire survey on discomfort as affected by seat cushion and backrest design parameters. Although subjective evaluation plays an important role in the total evaluation process, the method relies too much on user perceptions and lacks objectivity, resulting in poor accuracy in the conclusions.
Regarding the research on pressure-distribution evaluation methods, there are more studies showing that the relationship between pressure and comfort is the most obvious of all objective evaluation methods [11]. Pei et al. [12] used objective body pressure distribution experiments to score different seat materials and Body Mass Index (BMI) indices on the basis of subjective surveys, and compared the results to conclude that the contact area and pressure data between the PP cotton seat surface and the subject’s body surface were greater. The results of the objective and subjective data analyses were in good agreement. Gao et al. [13] extracted objective evaluation indicators such as mean average pressure, mean maximum pressure, and mean pressure change rate through body pressure tests, and used non-parametric statistical methods to correlate the subjective and objective indicators, showing that body pressure distribution indicators have a high correlation with comfort. Deng [14] and others established a cabin comfort prediction model based on a theoretical study related to the human–computer interaction interface and gene expression coding and improved CATIA software to establish a platform that virtually evaluates comfort.
With the deepening of ergonomics research, many scholars have applied different approaches to predictive modelling. Rysanek [15] applied supervised learning and used Bayesian logistic regression combined with the decision tree algorithm to predict comfort changes caused by climate change, a method that is useful for data-driven prediction in other fields. Zhang et al. [16] applied an improved Support Vector Machine (SVM) based on SVM and optimized the Least Squares Support Vector Machine (LSSVM) using the improved sparrow algorithm, which was a good solution to the problem of poor prediction results, optimizing relevant parameters and combining the SVM with experiments on body pressure distribution to eventually build prediction models with higher accuracy. Mariano-Hernandez [17], to predict the energy demand of users, used different machine learning and deep learning models to find the model with a better evaluation performance to meet user demands. For other prediction methods, more scholars are applying neural networks for predictions. Yu [18] proposed an improved Elman neural network based on the limitations of forward neural networks in terms of performance to make it more accurate and to build a prediction model for short-term human residential loads. Zhao et al. [19] proposed a prediction model for multilayer feedforward neural networks with the help of MATLAB to verify the actual and predicted relationships between the overall comfort indicators.
Although artificial neural networks have been shown to have a superior performance, they are prone to poor learning and generalization performance, and also suffer from drawbacks such as the network structure not being easily determined and easily falling into local minima [20]. Support vector machine regression (SVR) is a model based on statistical theory that can better solve the regression problems and has been widely used in prediction problems in different fields [21]. Wang et al. [22] proposed a comprehensive evaluation prediction model for Chinese passenger car pedals based on support vector machine regression that reasonably designed the pedal operation criteria, limits, and recommended ranges by evaluating the relevant pedal parameters and used a Back Propagation (BP) neural network for comparison and validation. The results showed that the effectiveness and reliability of support vector machine regression in predicting pedal design and performance prediction were better than those of a neural network. Chen et al. [23] established a BP neural network model and a support vector machine regression model to evaluate the sound quality of each operating state and position of tractors, used a genetic algorithm (GA) to optimize the relevant parameters of SVR, and finally concluded that the GA-SVR model predicted the sound quality with higher accuracy and stability. Sha et al. [24] used the simulated annealing algorithm to find parameters for the support vector machine regression prediction model, and based on finite element simulation, the optimal parameters and the predicted value of the optimal internal helical groove cutting force were derived, which led to an improvement in the accuracy of the SVR with a good prediction effect.
Particle swarm algorithm (PSO) has the advantages of a fast convergence speed, high efficiency, etc. However, with more in-depth research, problems such as PSO’s own slow convergence speed are gradually revealed, which affects the prediction accuracy. Therefore, many scholars have proposed optimizing the PSO in order to improve all kinds of research. Xiong [25] and others proposed an improved chaotic binary particle swarm optimization algorithm (MCBPSO) for feature selection in response to the low recognition rate of unimodal biometric features, and the classification accuracy of the kernel-extreme learning machine (KELM) was calculated as the fitness value of the particles, which was verified through experiments to improve the recognition rate. He et al. [26] combined the genetic algorithm and particle swarm algorithm to perform an adaptive search of spatial solutions in the spatial range by taking the minimum annual cost of substation planning as the fitness, effectively avoiding the local optimal solution and premature maturity problem and verifying the hybrid algorithm’s more optimal searching ability and convergence characteristics through examples.
In summary, most of the research on comfort conducted by scholars at home and abroad has focused on judging the comfort of vehicles and office seats, with less research having been conducted in the field of aviation. With the increase in air traffic, the study of the comfort of seats, as objects that people directly contact, is particularly important. In this paper, the authors propose using SVR to predict the comfort of aircraft drivers’ seats, to explore the characteristics of complexity and nonlinearity between subjective and objective evaluations. SVR has a better ability to generalize and a higher level of accuracy when fitting data and making predictions. It also avoids the problems of local minima, over-learning, and dependence on the number of samples that exist in neural networks and other methods [27]. In this paper, a linearly decreasing dynamic inertia weight value is used to improve the traditional particle swarm algorithm. ω dynamic adjustment rule of change is also set up to control the evolution of the algorithm, improve the convergence performance of the particle swarm algorithm, and keep it from falling into a local optimum. This improves the global nature of the search and convergence speed. The IPSO algorithm is used in the optimization of SVR, which makes the prediction results more accurate and consistent.

2. Methods

2.1. Support Vector Machine Regression

Support vector machine regression is proposed based on the SVM model, which is an algorithm for obtaining better generalization abilities with less information by invoking kernel functions to finding optimal solutions in high-dimensional hypersurfaces [28]. In the linearly divisible case, the optimal classification hypersurface is found for both classes of samples from the original space; in the linearly indivisible case, relaxation variables are added and samples from the low-dimensional input space are mapped to the high-dimensional space, using a nonlinear mapping to make them linearly divisible.
Suppose the sample set is {(x1,y1), (x2,y2),…,(xi,yi)}}, where xi is the input value of the ith sample as an n-dimensional column vector, yi is the response vector of the ith sample, and k is the total number of samples. The input sample space is transformed to a high-dimensional linear space by a nonlinear transformation and then entered into a regression prediction analysis with the function f(x) as the regression function, as shown in Equation (1).
f x = ω T φ x + b
where φ x denotes the nonlinear mapping from the sample space to the high-dimensional linear space, ω T is the n-dimensional row vector, and b is the bias. The precision ε , penalty factor C , loss function L ε , and relaxation variables ξ i , ξ i * , where is the balance function complexity and loss error, C > 0 . The optimization objective can be expressed as follows, in Equation (2):
m i n 1 2 ω T ω + c k i = 1 k ( ξ i + ξ i * )
s . t .   y i ω T φ x i b ε + ξ i ω T φ x i + b y i ε + ξ i * ξ i 0 , ξ i * 0 , i = 1,2 , , k
The Lagrangian multiplier α i is invoked to convert the constrained optimization problem to a pairwise problem using Lagrangian methods [29].
max a i , a i * = 1 2 i , j = 1 k a i a i * a j a j * × φ x i φ x j i = 1 k a i ε y i i = 1 k a i * ε + y i G x i , x j = φ x i φ x j
s . t .   i = 1 k a i a i * = 0 0 a i , a i * C , i = 1,2 , , k
where G x i , x j = φ x i φ x j , K x i , x j is a kernel function introduced to satisfy the Mercer condition, at which point the regression fit function is obtained as in Equation (4).
f x = i = 1 k α i α i * G x i , x + b *
b * = 1 N N S V 0 < α i < C y i x j S V α i α j * G x j , x i ε + 0 < α i * < C y i x j S V α j α j * G x j , x i + ε
where SV denotes the solution where the Lagrange multiplier is not zero, and NNSV is the number of standard support vector machines.
From Equation (3), α i and α i * can be derived, where G x j , x i is chosen as the radial basis kernel function, as in Equation (5).
G x i , x j = exp x i x j 2 2 σ 2

2.2. Principles of the Particle Swarm Algorithm

The Particle Swarm Algorithm (PSO) is a population intelligence optimization algorithm developed by Kennedy and Eberhart in 1995, inspired by the movement of flocks of birds [30]. PSO performs local and global searches by simulating the foraging behaviour of a flock of birds and exploiting the sharing of information searches by individuals to produce an evolution of the whole population problem in the solution space. The algorithm starts with a stochastic solution, where each particle flies in an n-dimensional search space and has a velocity that determines the distance and direction of its flight. Each particle is mnemonic and has a fitness value, determined by the function’s optimization, to determine how good the current position is based on iterations and produce the optimal solution [31]. Therefore, during the on-the-fly search, two extremes are identified in each generation: the optimal solution generated by each particle in the range currently being searched, called the individual extremum P b e s t , and the global optimal solution in the population, called the global extremum G b e s t . The optimal value of the solution space is determined by these two extremes. Its updated speed and position formula is provided as in Equation (6).
V i n t + 1 = ω V i n + C 1 r 1 P i n X i n + C 2 r 2 P g n X i n
X i n t + 1 = X i n t + V i n t + 1
where ω is the inertia factor; r1 and r2 are random numbers randomly distributed in the interval [0, 1]; C 1 is the learning factor; C 2 is the social factor; and C 1 = C 2 is ordered in general; V i n denotes the velocity of particle i in the nth dimension; and X i ( t ) denotes the position of particle i when it is iterated to the tth generation.

2.3. Improved Particle Swarm Algorithm to Optimize Support Vector Machines

In the particle swarm algorithm, ω is an important adjustable parameter, and a larger ω is beneficial to improving the global search ability, while a smaller ω has a strong local extreme-value-seeking ability, which can accelerate the convergence of the algorithm and enhance the local search ability of the algorithm [32]. At the early stage of evolution, the exploration ability of the desired particle is strong, while with the iteration, the exploitation ability of the desired particle is enhanced at the late stage of evolution. Therefore, this paper introduces a dynamic adjustment of the value of the weight ω , and a linear decreasing strategy of inertia weights is used.
ω = ω m a x T     ω m a x ω m i n T m a x
In Equation (7), ω m a x and ω m i n are the maximum and minimum values of the inertia factor, respectively; T m a x is the maximum number of iterations; T is the current number of iterations. Usually, the maximum value of inertia factor ω m a x and the minimum value of ω m i n are taken as 0.9 and 0.4, respectively [33].
In the basic PSO algorithm, the learning factor C 1 and the social factor C 2 usually take the same constant value. Therefore, to make up for their shortcomings in terms of the learning ability of the stronger learning factor and weaker social factor in the early evolutionary stage, and the weaker learning factor and stronger social factor in the later stage, and to improve the convergence of the algorithm, the dynamic adjustment C 1 and C 2 strategy is introduced again in this paper while adjusting the dynamic weight values. The improved learning factor adjustment formulas are shown in Equations (8) and (9).
c 1 = c 1 i + c 1 k c 1 i     T m a x T T m a x
c 2 = c 2 i + c 2 k c 2 i     T T m a x
where c 1 i and c 2 i are the initial values of C 1 and C 2 factors, respectively; c 1 k and c 2 k are the final values of C 1 and C 2 factors, respectively. Usually, c 1 i and c 2 k are taken as 2.5, and c 2 i and c 1 k are taken as 0.5 [34]. During the iteration, both factors can be adapted to the needs of the algorithm and improve its convergence speed.
Firstly, the measured data are collected and normalized to initialize the population and SVR-related parameters, and the improved particle swarm algorithm (IPSO) is obtained by using the strategy of linearly decreasing and dynamically adjusting inertia weight ω , self-learning factor c 1 , and social factor c 2 ; then, the IPSO algorithm is used to optimize penalty parameter C and the kernel function parameter σ of the SVR, and to establish the comfort of the IPSO-SVR prediction model.
Figure 1 shows the flow chart of SVR optimization using the IPSO algorithm.

2.4. Experimental Subjects

According to Kolich et al. [35], the sample size for subjective perceived comfort and peak contact pressure reached 12, and the ANOVA significance of the data was p < 0.05. Therefore, the sample size for the test in this paper was set at 27, of which 3 were in the 5th percentile, 20 were in the 50th percentile, and 4 were in the 95th percentile. The average height of the participants was 172.89 cm, the highest was 190 cm, and the shortest was 155 cm; the average weight was 66.63 kg, the largest was 88 kg, and the smallest was 44 kg. The participants were in good health and underwent no strenuous exercise or fatigue half an hour before the experiment started. The height, weight, and body mass index (BMI) of the test subjects are shown in Table 1.

2.5. Experimental Equipment

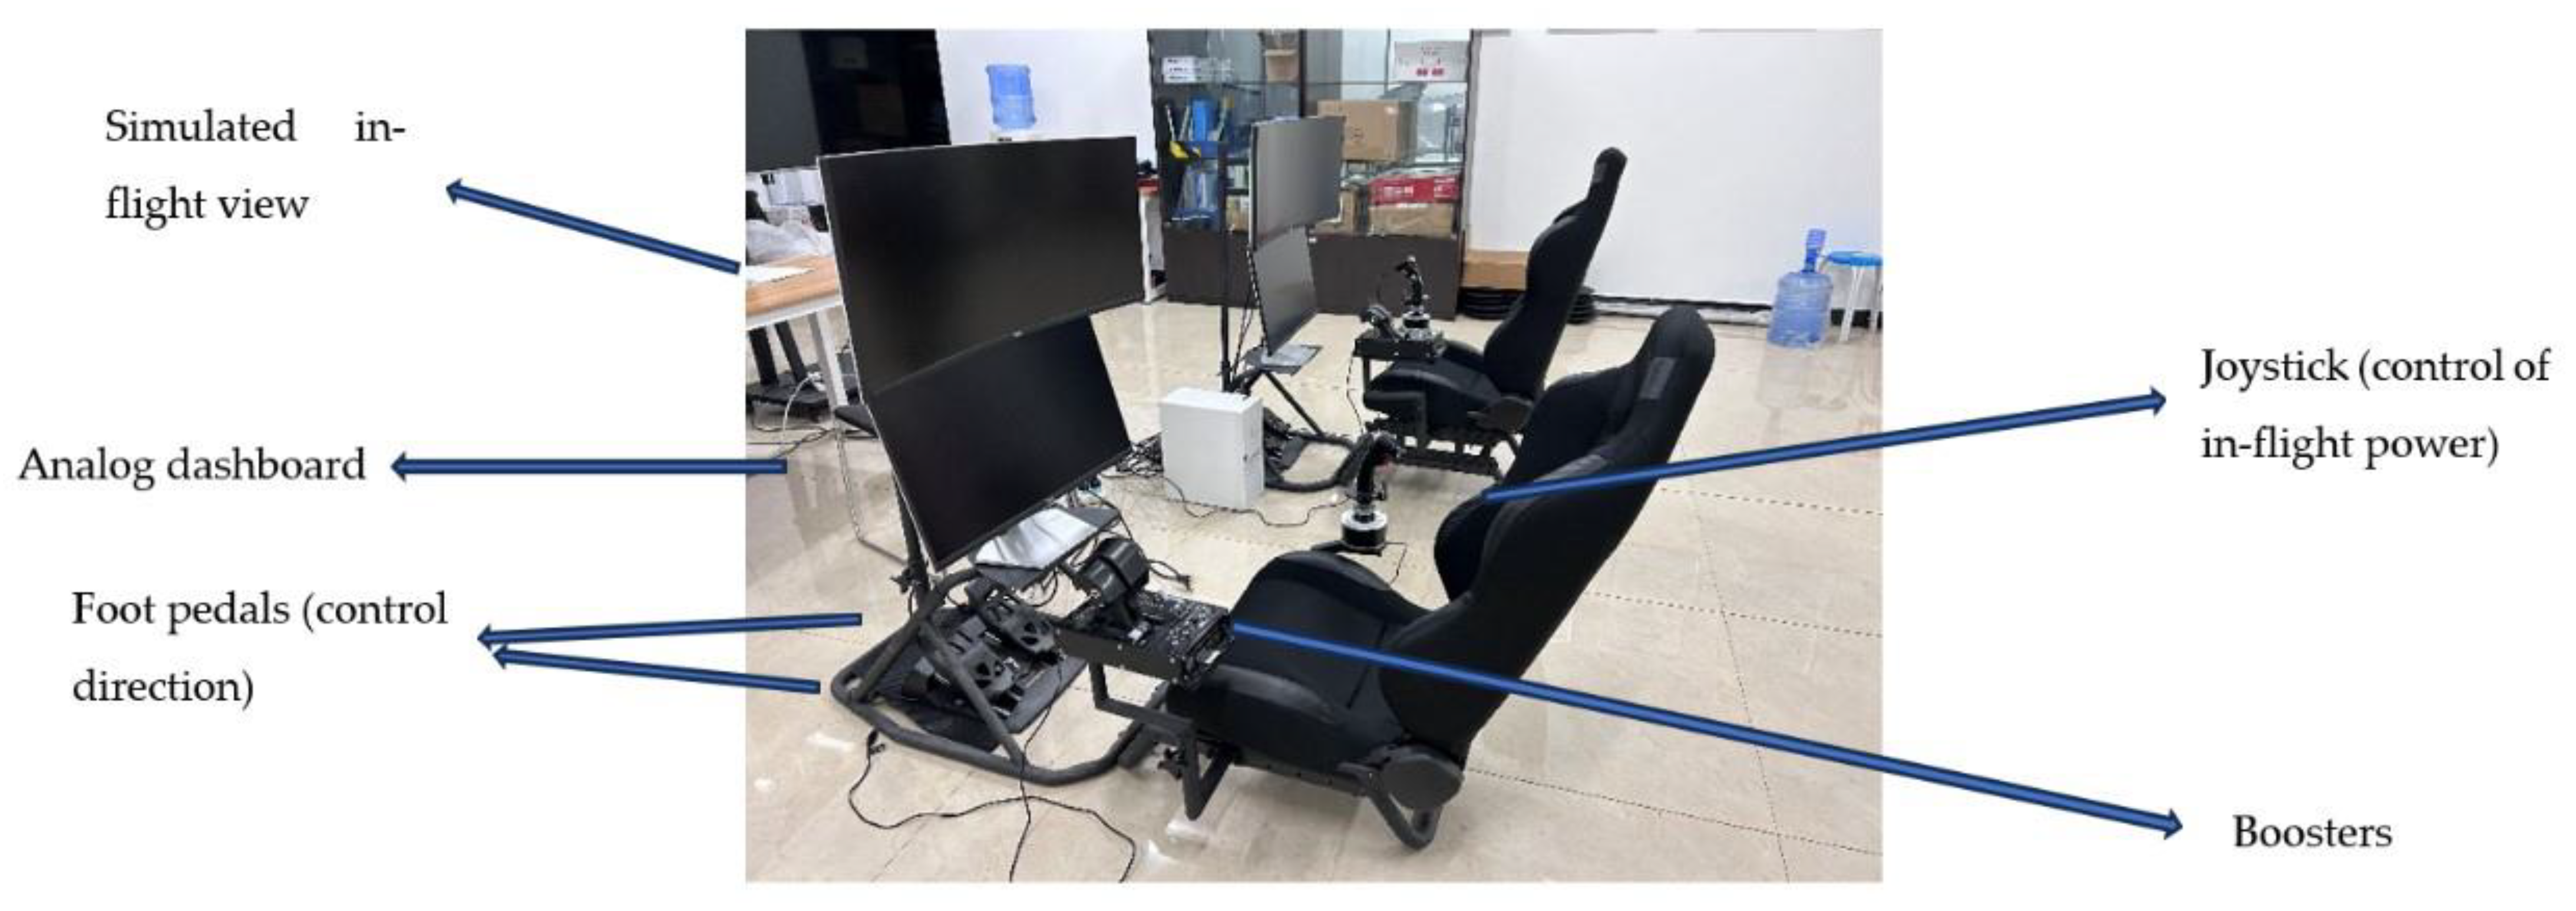
According to other references, the seats used in the tests were simulated cockpit seats and achieved good test results [36,37]. Therefore, the object of this experiment was to simulate the cockpit seat in a certain model of private aircraft, General Aviation, as shown in Figure 2.
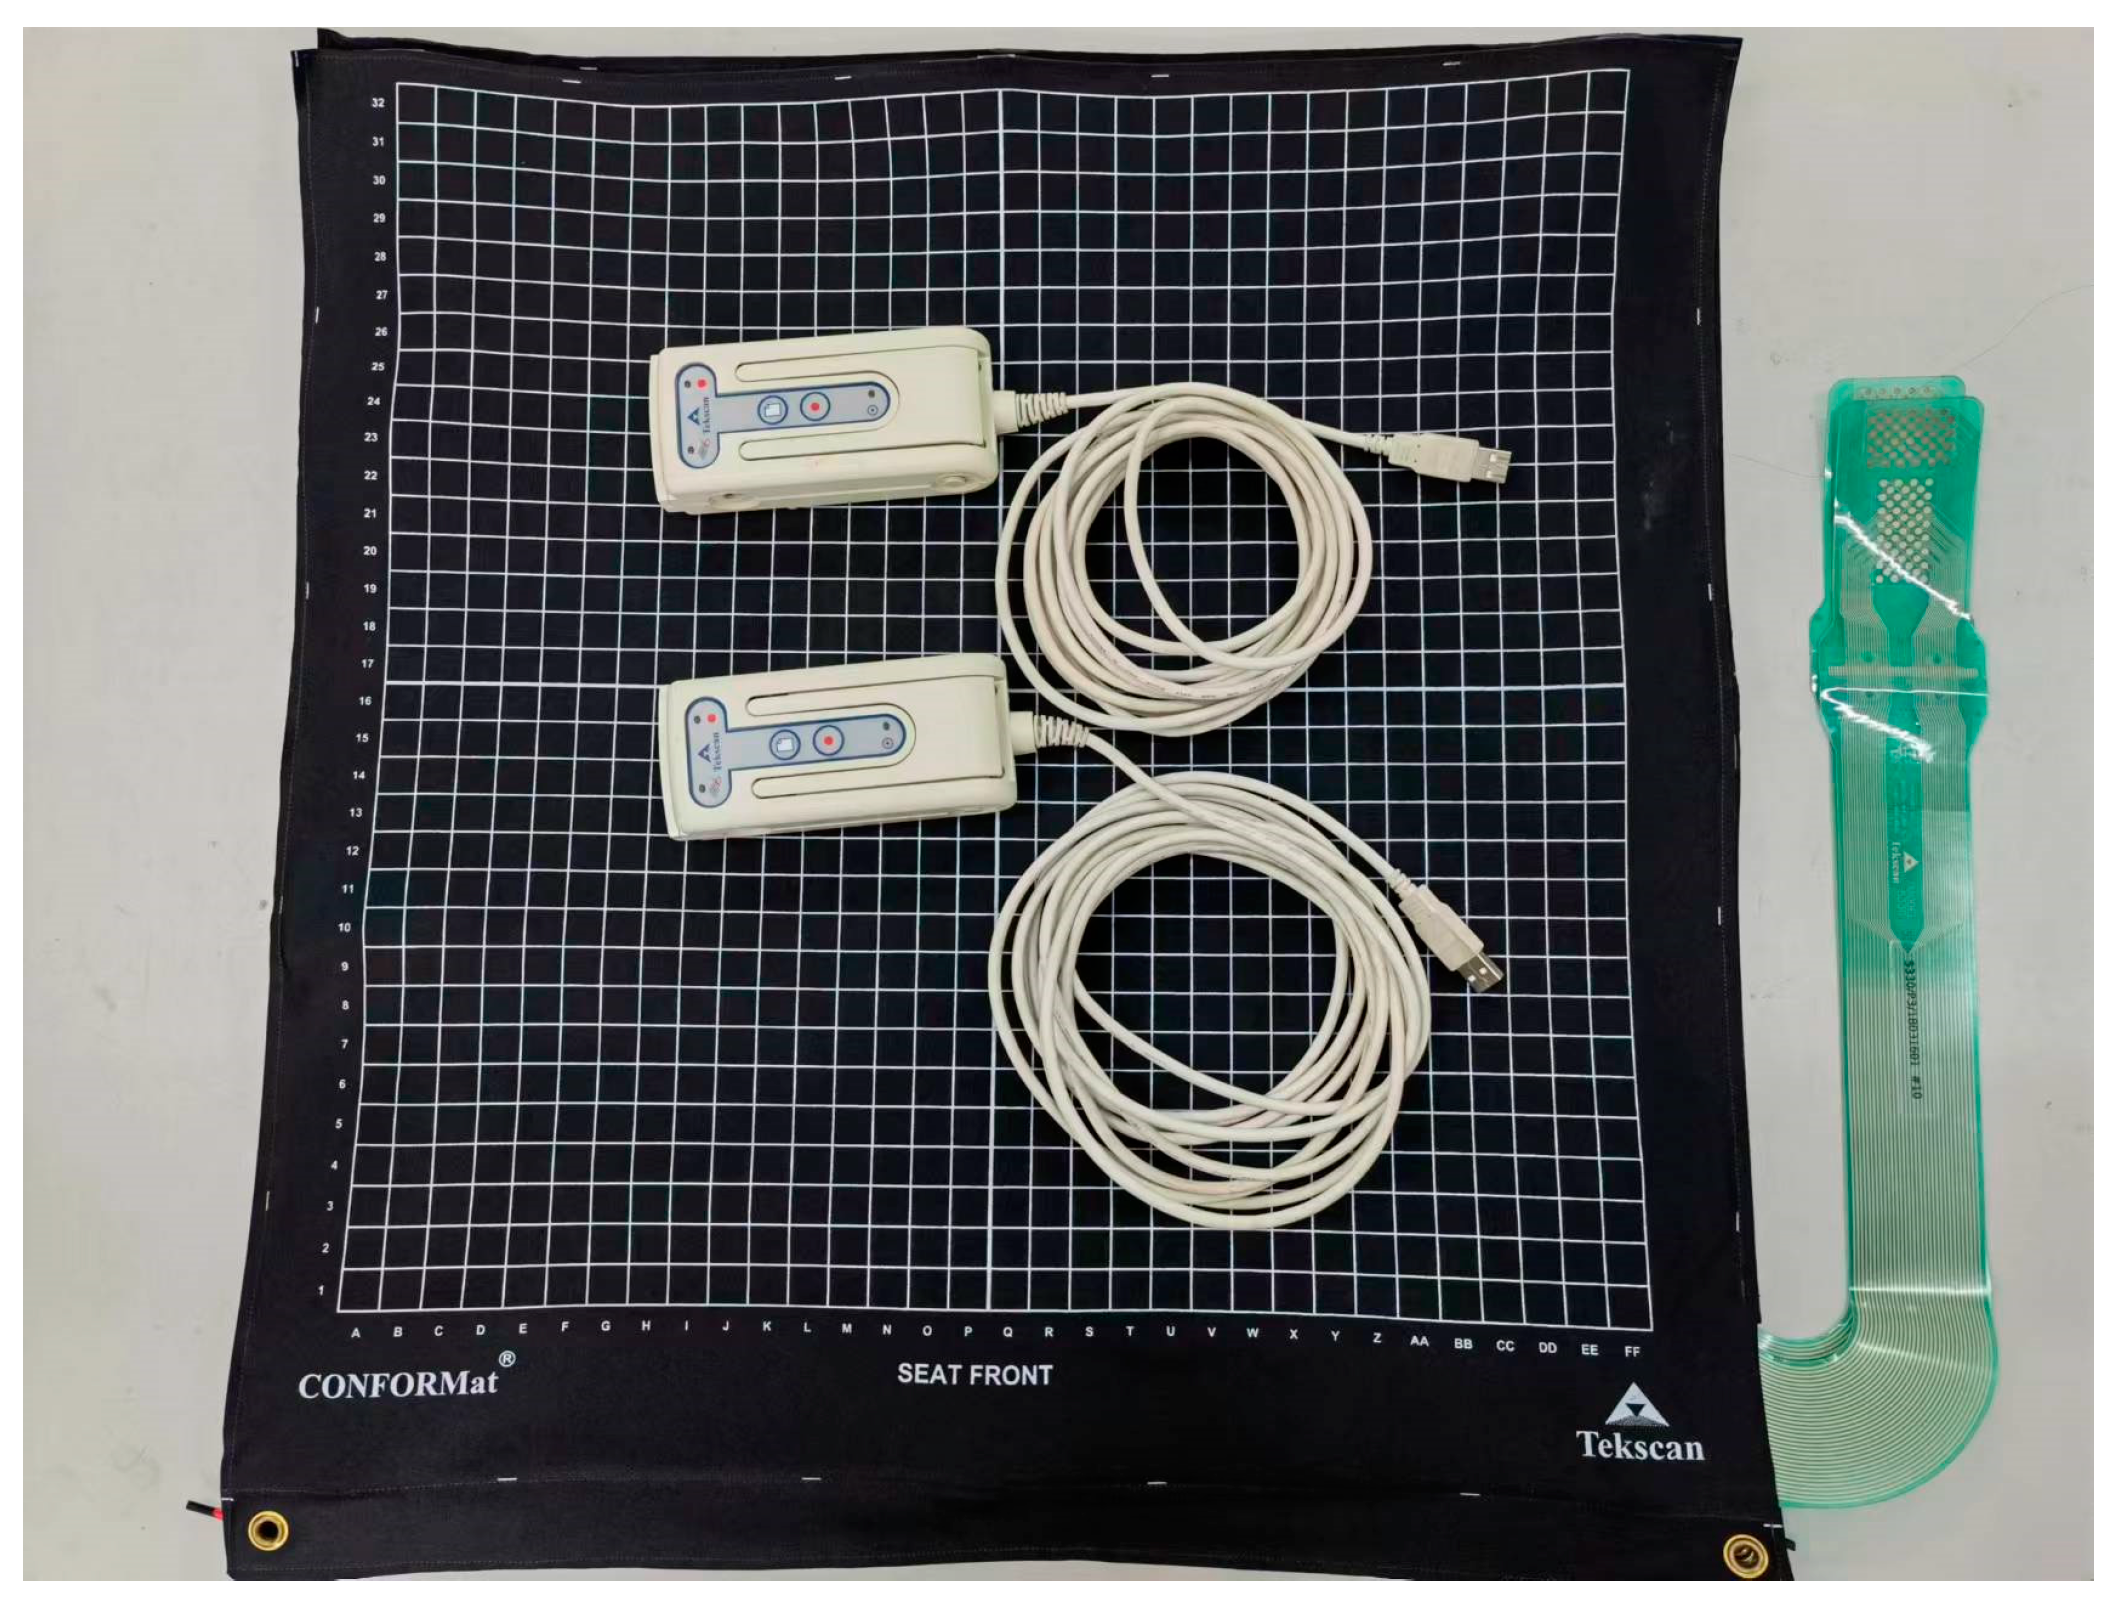
In this paper, a pressure sensor tool developed by Tekscan, Inc., Norwood, MA, USA was used for testing, and the pressure data were collected by measuring the change in pressure value at each point of the contact surface between the human body and the seat [38]. The experimental equipment is shown in Figure 3. The material of the pressure pad is a polyester film, and the pressure-sensitive semiconductor is thin as a special layer of material on its outer side, indicating the film. When external pressure is received, the resistance value of the semiconductor decreases with the increase in external pressure, showing an inverse proportional change. The device is equipped with chair pressure pads and backrest pads, each of which has 32 × 32 units, and the spacing of each sensing unit is 15 mm. According to the literature survey, the pressure distribution on most of the contact surfaces can be measured during the actual measurement process, including the evaluation pressure, peak pressure, contact area, and other basic indicators [39].

2.6. Experimental Procedure

In order to ensure the accuracy of the experiment, the experimental site must have a suitable temperature, a good line of sight, a spacious and airtight space, and strict reference to the requirements of the simulated cabin environment. The experimental site is also a flight vehicle simulation laboratory.
(1)
Thirty minutes before the experiment, the subjects had not undergone any strenuous exercise and were in good physical condition. Before the start of the experiment, the subjects were introduced to the experiment-related procedures and requirements, and their basic information was noted.
(2)
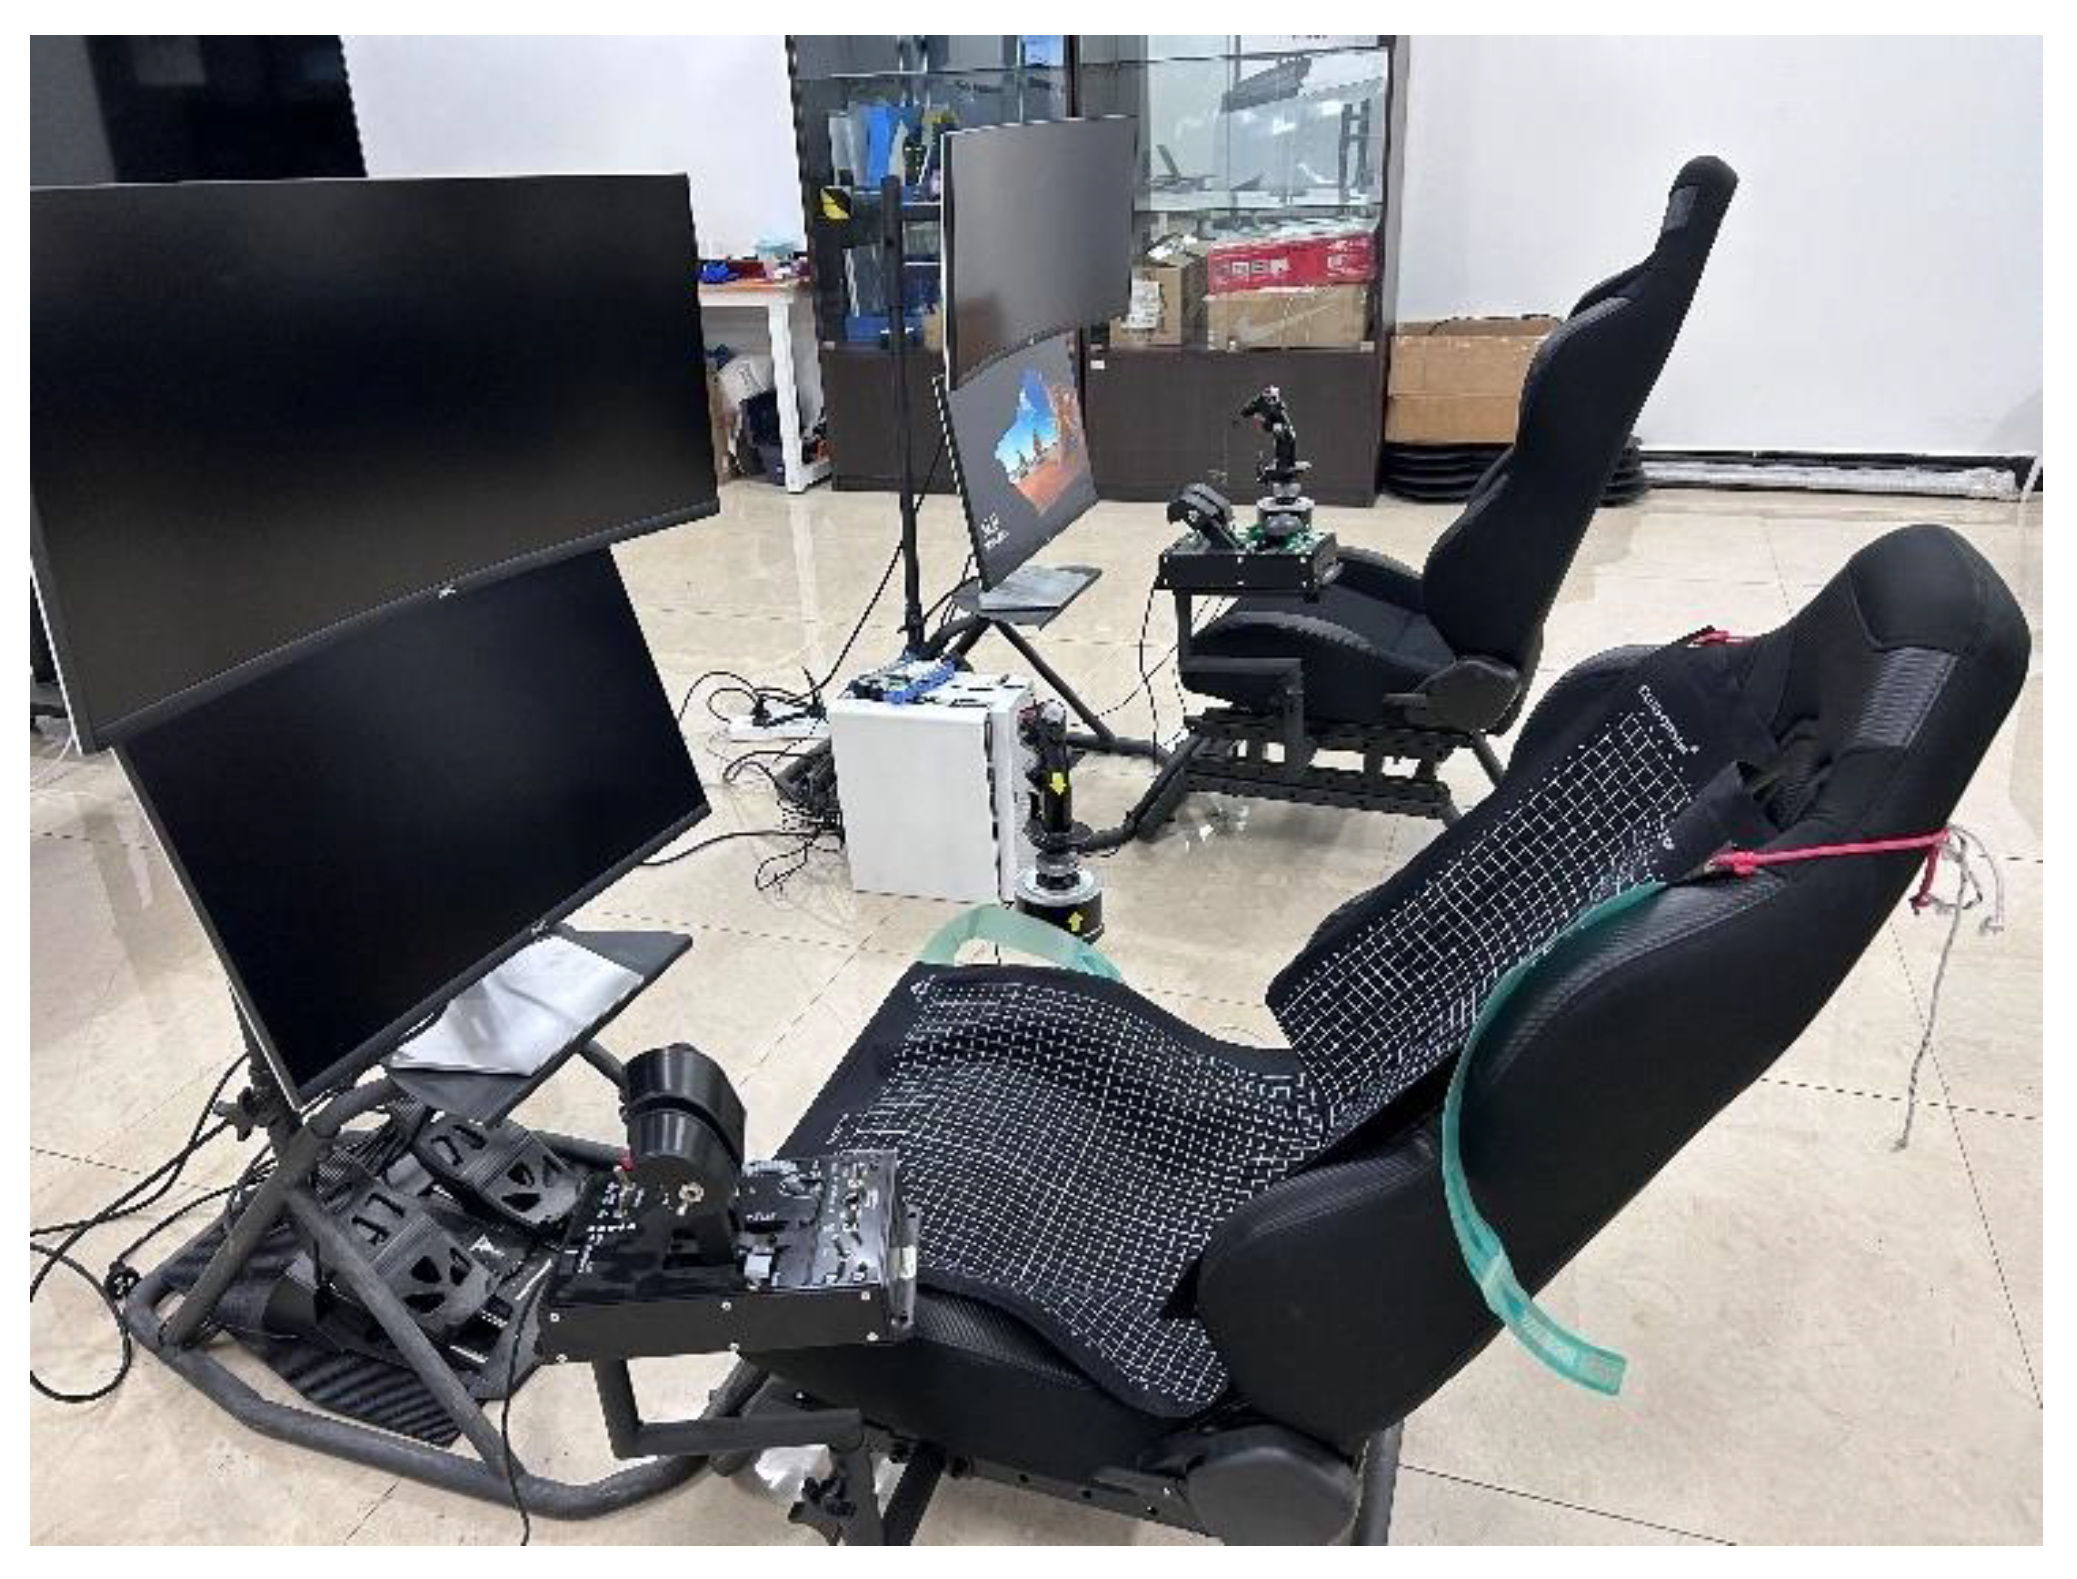
Preparation before the experiment. The pressure pad was laid flat on the chair surface and backrest, and the backrest tilt was adjusted to 140° (backrest tilt refers to the angle of presentation of the backrest and the ground); the seat pitch was adjusted to 60 cm (seat pitch refers to the frontmost of the seat and the frontmost of the footrest pitch). Proceed to the pre-experiment, as shown in Figure 4.
(3)
The subjects wore tight-fitting clothing, sat on the chair in a standard driving position with their back against the back, placed their feet on the two footrests, tried to ensure that the pressure pads were wrinkle-free, and placed their left and right hands on the handles on both sides to maintain a stable sitting position for 2 min while using BPMS Research 7.0 software to collect the data in real time and form 2D cloud maps to ensure accuracy. The data were collected in real time using BPMS Research 7.0 software to form 2D cloud maps to ensure accuracy.
(4)
The results of the pre-experiment to determine comfort suggested that there were more obvious differences between the two seat pitches and three backrest tilts, so the seat pitches were adjusted to 63 cm and 68 cm, and the backrest tilts were adjusted to 100°, 110°, and 120°. After more than 15 min of rest, the personnel performed the next experiment, until the different distance and tilt angle experiments were tested and completed. Each person participated in a total of six experiments.
(5)
Subjective comfort was scored on a 7-point Likert scale for different seat pitches and backrest inclination angles, respectively.

3. Model Development and Validation

3.1. Data Collection and Analysis

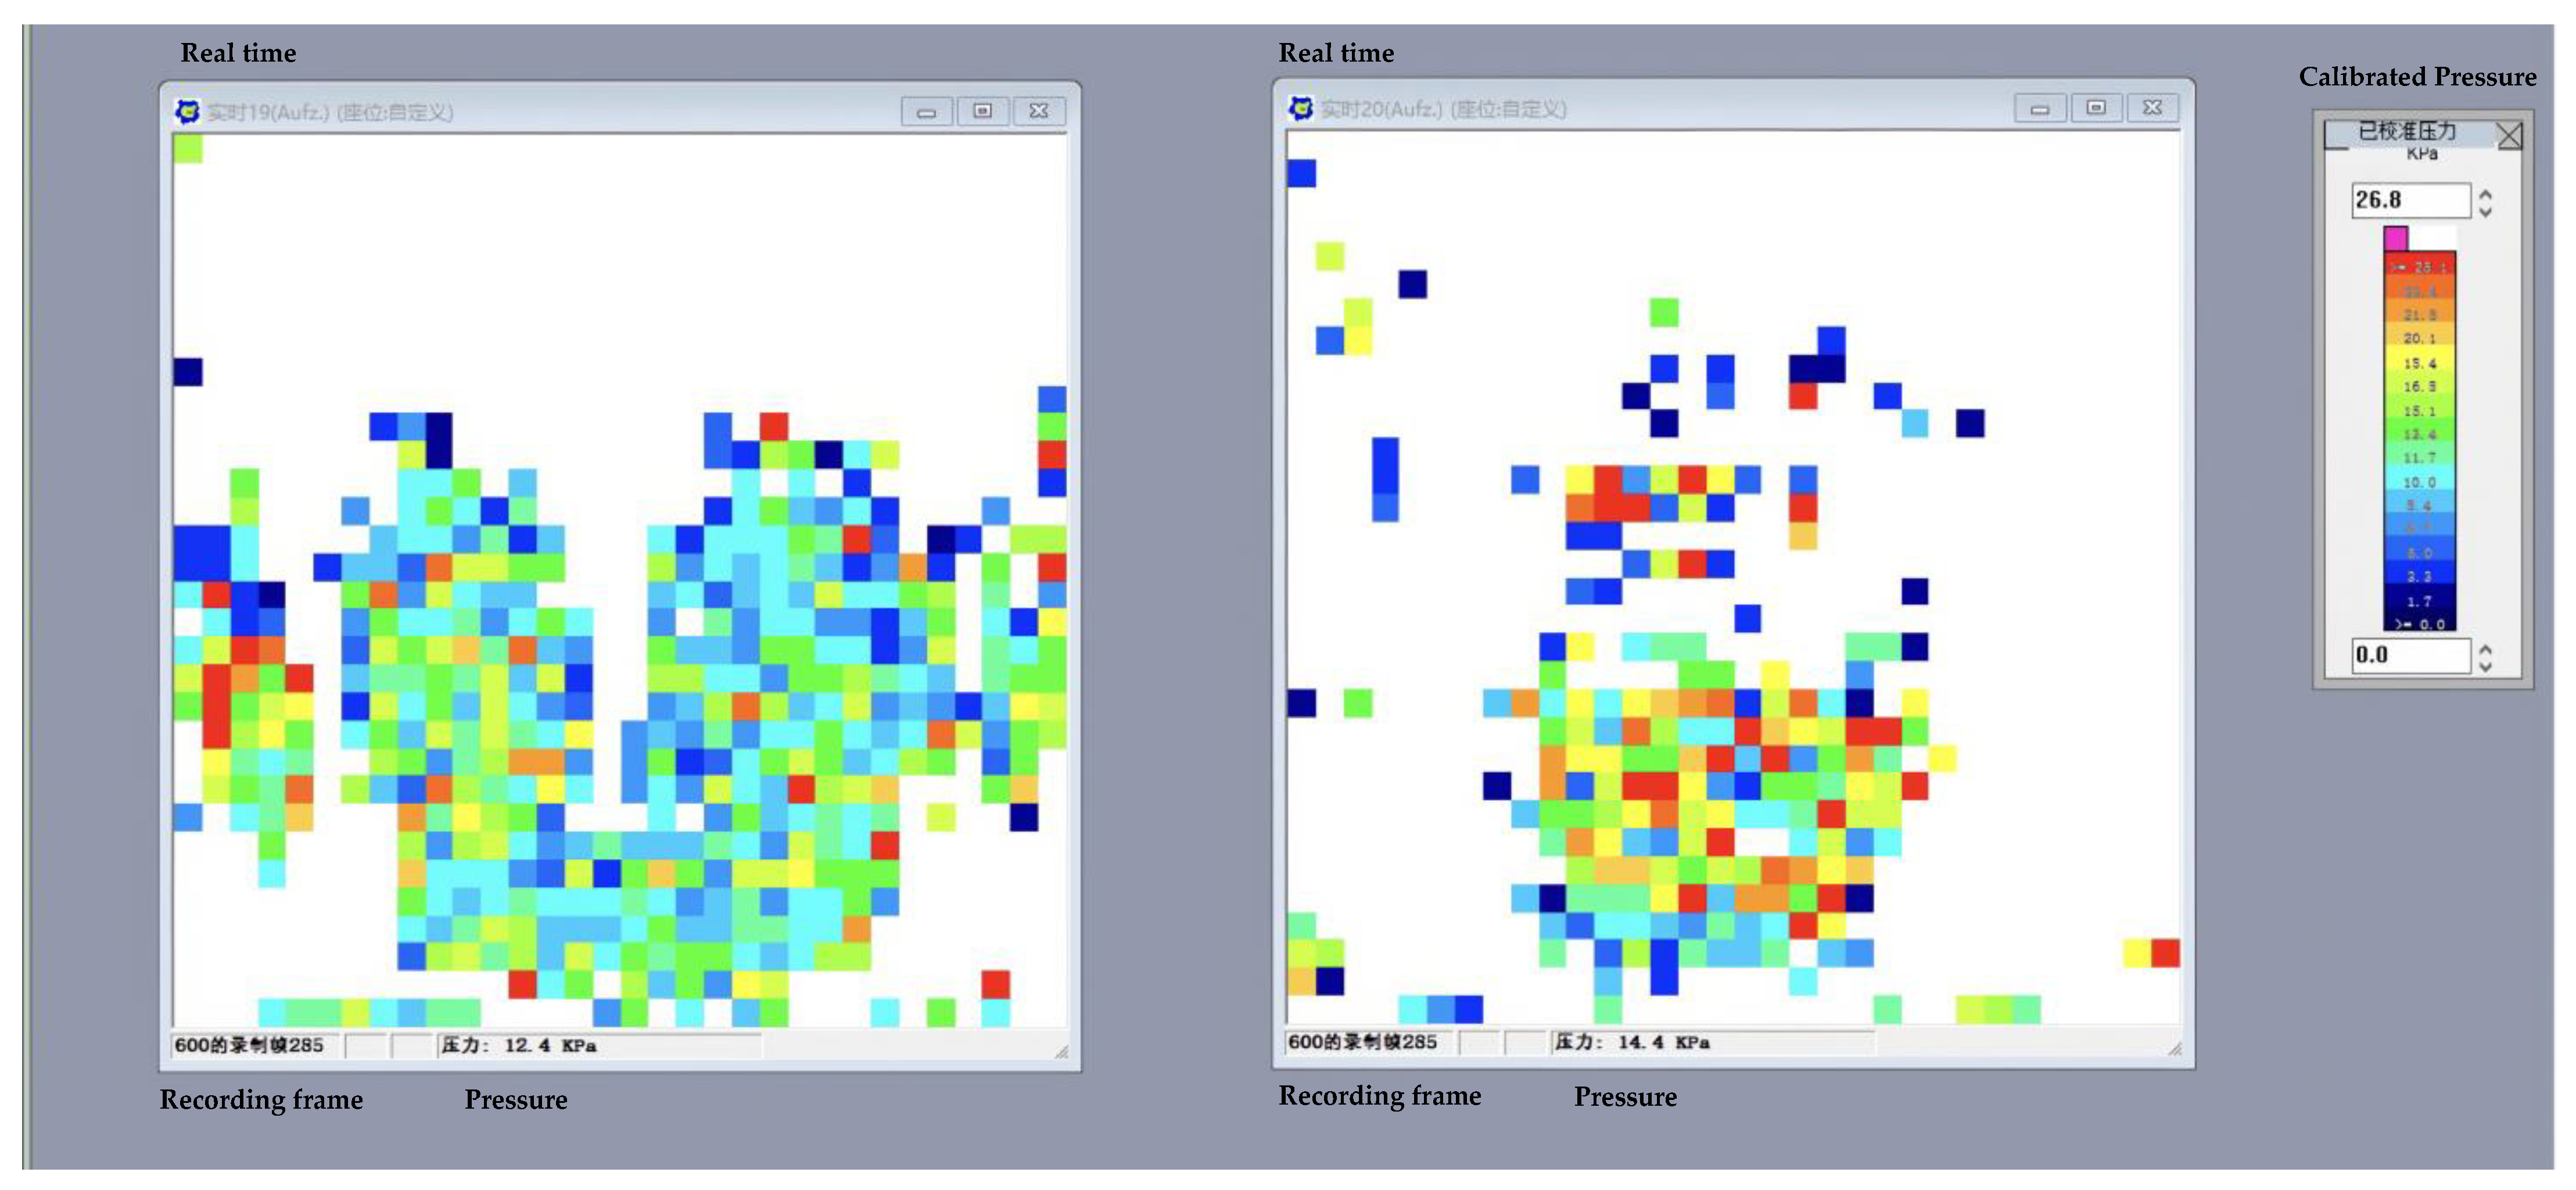
The duration of experimental data acquisition was 2 min, the experimental equipment acquisition frequency was 5 fps/s, and the total number of frames acquired in a single experiment was 600 frames. Static pressure tests were also performed in the experiment. Data screening was performed before data exportation, eliminating data incompleteness or abnormalities caused by individual factors or pressure edges caused by cushion extrusion in order to reduce the experimental error, and then calculating the average value of each parameter index. The data were opened in ASCII format and imported into an Excel document. A two-dimensional diagram of the standard cushion and backrest pressure is shown in Figure 5.

3.2. Indicator Screening Based on LASSO Regression

The data were centrally normalized to eliminate the effect of different index magnitudes [40]. Using Lasso regression, the selected gender, height, weight, back object pressure, back peak object pressure, back peak contact pressure, back peak strength, back contact area, back contact pressure, back strength, hip object pressure, hip peak object pressure, hip peak contact pressure, hip peak strength, hip contact area, hip contact pressure, hip strength, and another 17 indicators were used for parameter estimation and variable selection, with the help of Statuses 15 software. The LASSO regression coefficients are shown in Table 2.
Through the parameter estimation results of Lasso regression, gender, height and weight were selected according to the model optimum, four variables of back indexes, back peak object pressure, back peak contact pressure, back contact area and back contact pressure; two variables of hip indexes, hip contact area and hip strength, and eight variables that were not relevant to the prediction of comfort were excluded.

3.3. Data Analysis

Using IBM SPSS Statistics 20 software, the collected backrest and seat pressure data were subjected to a Kolmogorov–Smirnov normal distribution test with several related samples, such as subjective rating data. After the test, both backrest and seat pressure data were found to not obey the normal distribution situation. Therefore, this paper selected a non-parametric test to analyze the data, using the Friedman test for the mean and standard deviation of the three backrest tilt angles under the two pitches. The pressure distribution and two posterior comparisons for a seat and pedal pitch of 63 cm are shown in Table 3 and Table 4.
The body pressure distribution reflects the contact effect between the human body and the seat, which can better characterize the body pressure distribution characteristics. As shown in Table 3, when the distance between the seat and the footrest is 63 cm, the peak back object pressure is the highest when the backrest angle is 110°, at 32.81 ± 1.67 kPa; the peak back object pressure is not much different from that at 110° when the backrest is 120°, at 32.03 ± 2.16 kPa; the peak object pressure is the lowest when the backrest angle is 100°, at 30.71 ± 2.15 kPa. Back peak object pressure is the highest point or peak in the pressure distribution of the human back; the human body in different sitting, standing, or lying postures is subjected to different pressures. Measurement and analysis of the back peak object pressure can help to understand the impact of different backrest angles on the back force, especially the pressure distribution on the spine and muscles. Usually, reducing the peak object pressure on the back helps to improve the comfort of the human sitting posture. As shown in Table 4, a post hoc two-by-two comparison of the three backrest inclination angles at 63 cm spacing showed significant differences in peak back object pressure and peak hip object pressure for each of the two different angles at the 95% confidence interval.
As shown in Table 3, the peak contact pressure on the back at the seat and footrest distance of 63 cm and backrest tilt angle of 120° is the largest, 34.55 ± 2.05 kPa; the peak contact pressure at 100° is the smallest, 31.13 ± 2.13 kPa; at 110°, peak contact pressure is in the middle, 33.98 ± 2.14 kPa. Peak contact pressure is the pressure on the seat cushion and backrest. The average of the four values adjacent to the maximum value is given by this indicator, which reduces the pressure cushion surface wrinkles caused by the abnormally excessive pressure on the results. In general, the peak contact pressure shows a correlation with the subjective evaluation of overall comfort, and the larger the peak contact area, the lower the subjective comfort evaluation [35]. As shown in Table 4, a post hoc two-by-two comparison of the three backrest inclination angles at 63 cm pitch showed significant differences in peak back-contact pressure and peak hip-contact pressure at 95% confidence intervals for each of the two different angles.
As shown in Table 3, the backrest is subjected to the largest contact area of 741.99 ± 7.76 cm2 at an inclination of 120°, followed by 718.98 ± 6.48 cm2 at an inclination of 110° and 679.19 ± 5.52 cm2 at an inclination of 120°. The contact area of the buttocks is the opposite of that of the back, with the largest contact area of 741.99 ± 7.76 cm2 at an inclination of 100°, followed by 718.98 ± 6.48 cm2 at an inclination of 110°, and 679.19 ± 5.52 cm2 at an inclination of 120°. The contact area is the total area of the back or buttocks in contact with the support, and the size of this area can be used to measure the extent and condition of the body part that is in contact. Generally speaking, the larger the contact area, the lower the local pressure on the back and the better the fit of the hips to the seat. This means that the corresponding average pressure will be smaller, and comfort will be increased when using certain seat materials. However, under actual flight conditions, a too-large backrest inclination angle will affect the view angle when driving, so usually the backrest inclination angle is not too large. As shown in Table 4, a two-by-two post hoc comparison of the three backrest inclination angles at 63 cm showed significant differences in back contact area and hips at the 95% confidence interval for each of the two different angles.
There are significant differences in contact pressure for different backrest inclination angles, where 120° inclination (13.29 ± 0.29 kPa) > 100° inclination (13.13 ± 0.18 kPa) > 110° inclination (13.01 ± 0.14 kPa). Usually, reducing the discomfort caused by contact pressure can improve the comfort during human contact with the support surface, resulting in less irritation being felt by the human body. As shown in Table 4, a post hoc two-by-two comparison of the three backrest inclination angles at 63 cm showed significant differences in back-contact pressure and hip-contact pressure at 95% confidence intervals for each of the two different angles.
Hip strength refers to the strength of the force or pressure exerted in the hip region of the human body. For buttock strength, the greatest strength was found at an inclination angle of 100° at 977.39 ± 20.96 kPa, followed by 934.55 ± 17.67 kPa at an inclination angle of 110° and 902.32 ± 18.01 kPa at an inclination angle of 120°. Usually, a smaller buttock strength helps to reduce local discomfort and avoid pressure concentration on the skin and tissues. As shown in Table 4, a post hoc two-by-two comparison of the three backrest inclination angles at 63 cm showed significant differences in hip strength at 95% confidence intervals for each of the two different angles.
The significance of the pressure distribution when the seat and pedal pitch are 63 cm and a post-hoc two-by-two comparison are shown in Table 3 and Table 4.
As shown in Table 5, the peak back-object pressure was the highest at 36.66 ± 1.89 kPa at a tilt angle of 100°, followed by 36.17 ± 1.93 kPa at a tilt angle of 110° and 31.23 ± 1.48 kPa at a tilt angle of 120° for a seat and footrest pitch of 68 cm. As shown in Table 6, for the three backrest tilt angles at 68 cm pitch, a post hoc two-by-two comparison was conducted, and the peak back-object pressures for each of the two different angles were significantly different at the 95% confidence interval.
As shown in Table 5, the peak back-contact pressure at a seat-to-footrest pitch of 68 cm was the highest at an inclination angle of 100°, at 38.82 ± 2.01 kPa; followed by 37.75 ± 1.52 kPa at an inclination angle of 110°; and the lowest at an inclination angle of 120°, at 32.31 ± 1.52 kPa. As shown in Table 6, the peak back-contact pressure for a post hoc two-by-two comparison of the three backrest inclination angles at 68 cm spacing showed that the peak back-contact pressure at each of the two different angles was significantly different at the 95% confidence interval.
At a distance of 68 cm, the back-contact area was the largest at 120° backrest inclination, at 479.41 ± 13.29 cm2; the smallest at 100° back-contact area, 392.11 ± 8.76 cm2; and in the middle at 110° inclination, at 410.83 ± 11.04 cm2. Hip contact pressure is also the opposite of the back-contact pressure and is greatest when the tilt angle is 110° at 745.07 ± 10.23 cm2, followed by 730.21 ± 6.32 cm2 at 110° and 679.49 ± 8.32 cm2 at 120°. When the same seat material is used, a large contact area represents a better experience being measured. As above, for the actual driving conditions, a larger recline angle has an impact on the driving view, resulting in a restricted viewable area, so a larger recline angle is usually unsuitable for driving conditions. As shown in Table 6, a post hoc two-by-two comparison of the three recline angles at 68 cm spacing showed that the back-contact area at each of the two different angles was significantly different at the 95% confidence interval.
As shown in Table 5, for back-contact pressure at a spacing of 68 cm, the backrest inclination angle was 100° (14.58 ± 0.47 kPa) > inclination angle 110° (13.85 ± 0.29 kPa) > inclination angle 120° (13.53 ± 0.21 kPa) for back-contact pressure. As shown in Table 6, post hoc two-by-two comparisons of the three backrest inclination angles at 68 cm spacing showed significant differences in back-contact pressure and hip-contact pressure at 95% confidence intervals for each of the two different angles.
With a 68 cm pitch, the hip strength was greatest at a tilt angle of 110°, at 982.31 ± 20.22 kPa, and was similarly low at a tilt angle of 100°, at 982.31 ± 20.22 kPa, and had a tilt angle of at least 120° at 926.33 ± 19.46 kPa. As shown in Table 6, for the 68 cm pitch, the post hoc two-by-two comparison of the three backrest inclination angles under 68 cm spacing showed significant differences in hip strength at the 95% confidence interval for each of the two different angles.

3.4. Establish the IPSO-SVR Prediction Model

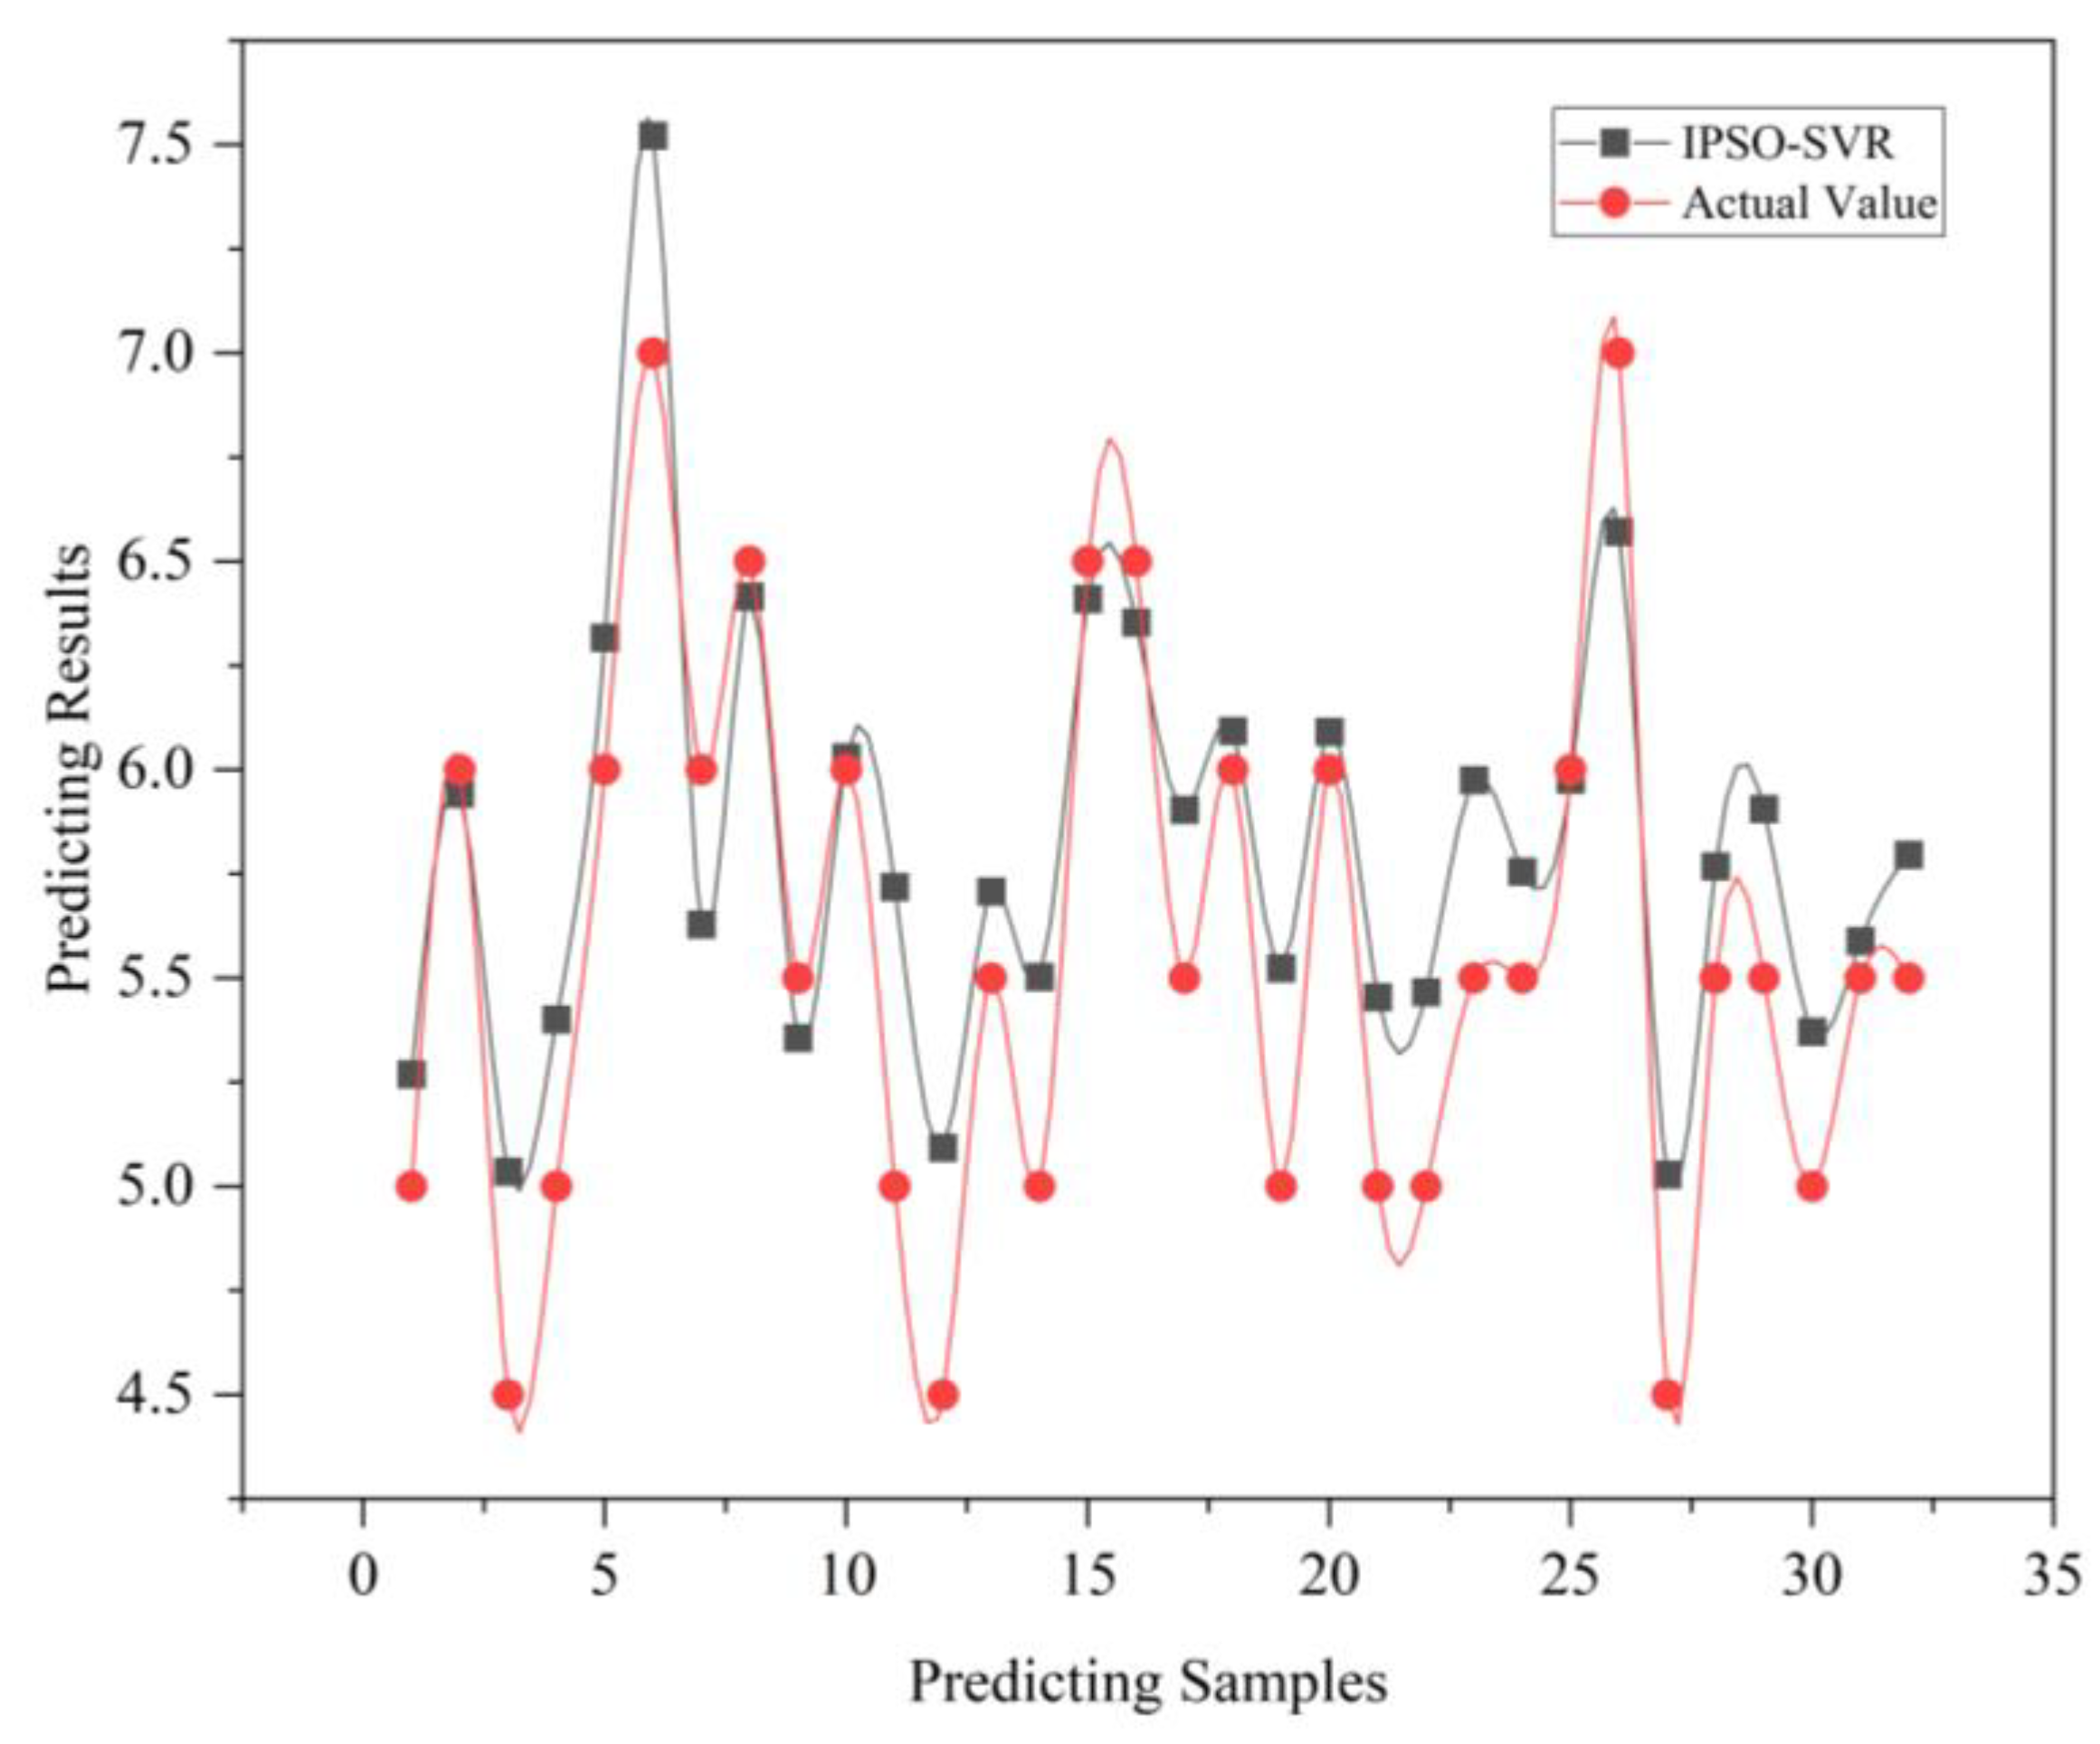
From the final 162 screened sets of data, 130 sets were selected as the training sample set, and the remaining 32 sets were used as the validation sample set. To quantify the accuracy of the prediction model, root mean square error (RMSE), mean absolute error (MAE), and goodness of fit (R2) were applied as evaluation metrics in this paper. Usually, RMSE can be used to measure the deviation between the test value and the true value, which is a common index of prediction accuracy; MAE can avoid the problem of errors cancelling each other, accurately reflecting the size of the actual prediction error; R2 can verify the extent to which the regression model fits the data and effectively prove the extent to which the validation set can be predicted by the training set. Nine variables, including gender, height, weight, back peak object pressure, back peak contact pressure, back-contact area, back-contact pressure, hip-contact area and hip strength, were set as the input layer, and the subjective evaluation score was used as the output layer. The improved particle-swarm-algorithm-optimized SVR was trained using 130 sets of training sample data to obtain the optimal parameters, the relative errors in the prediction model for the predicted and true values are shown in Table 7, and the prediction results of the established prediction model, IPSO-SVR, are shown in Figure 6.
The prediction results show that the back-prediction accuracy of IPSO-SVM is 94.00%, the root mean square error (RMSE) is 0.37, the mean absolute value error (MAE) is 0.32, and the goodness-of-fit (R2) is 0.92, indicating that optimizing the relevant parameters of the support vector machine using the improved particle swarm algorithm has obvious advantages in predicting comfort.

3.5. Model Validation

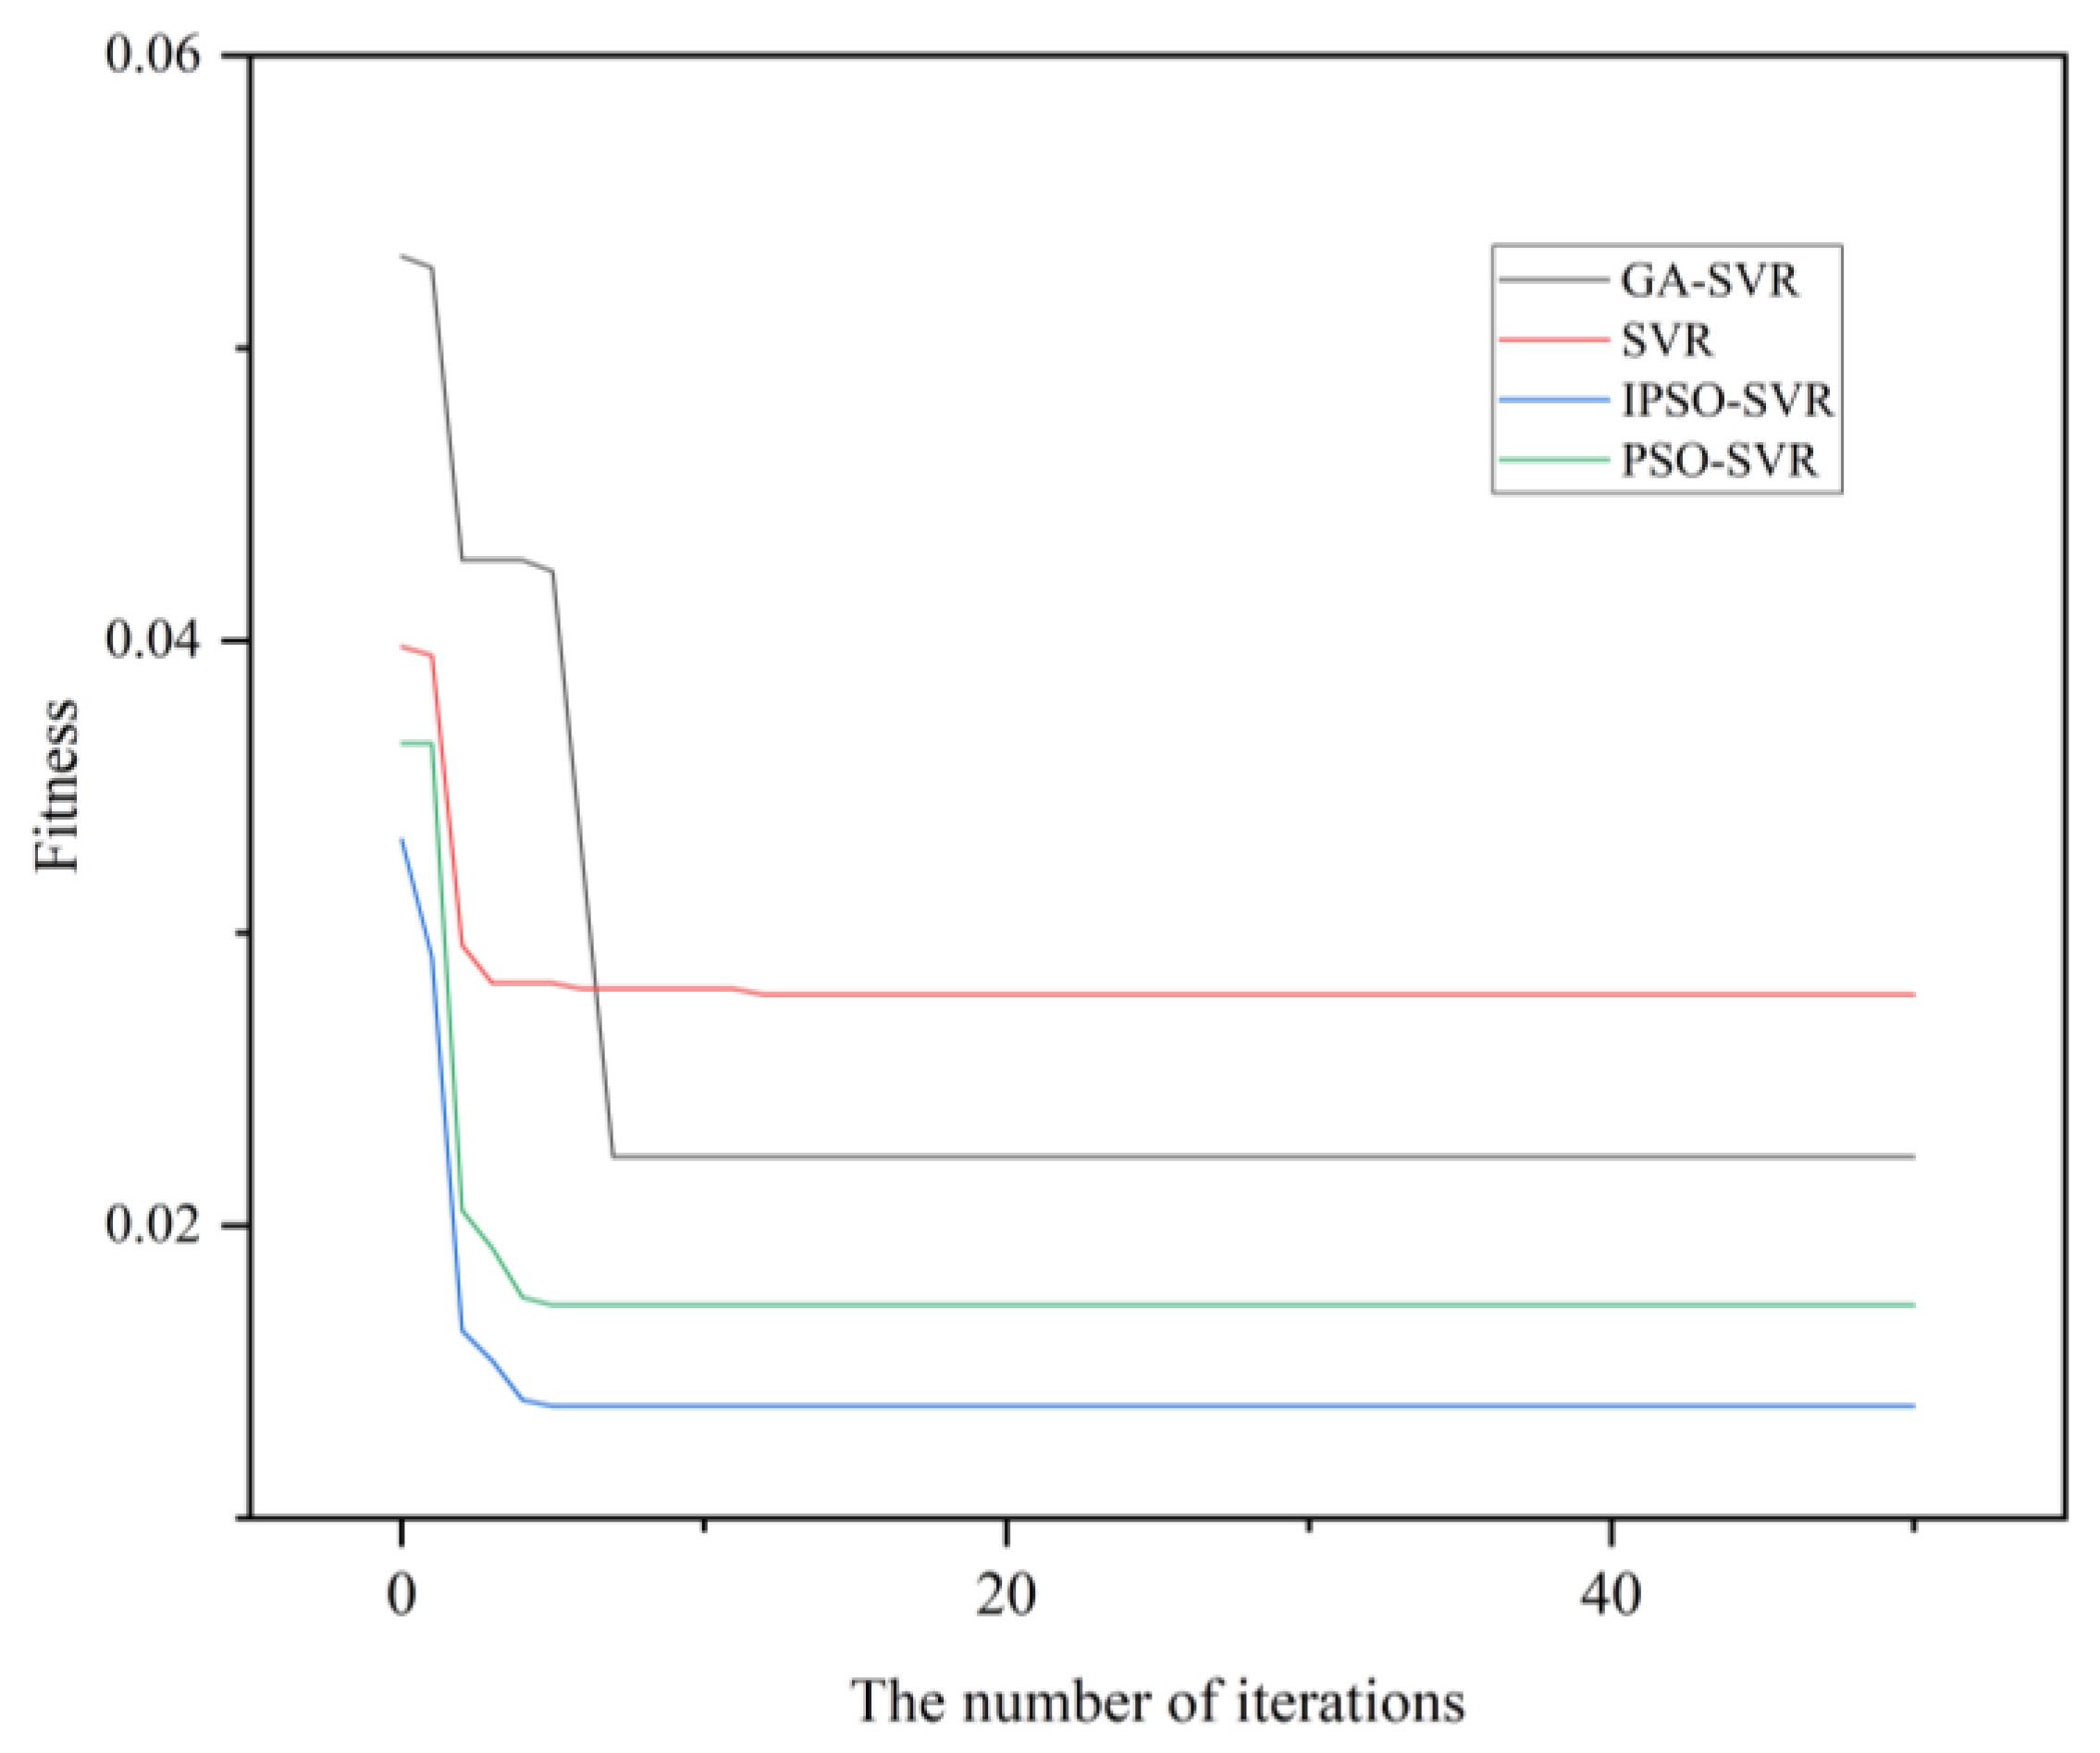
To further verify the prediction accuracy and stability of the improved particle swarm algorithm for support vector machine regression, the genetic algorithm optimized support vector machine regression (GA-SVR), particle swarm algorithm optimized support vector machine regression (PSO-SVR), and traditional support vector machine regression (SVR) were compared and verified, as shown in Figure 7.
According to Figure 6, SVR has the highest number of iterations and a large degree of adaptation, meaning that it is not a good choice. GA-SVR, although it shows some improvements over the traditional SVR algorithm in terms of the number of iterations and degree of adaptation, is still not ideal, and PSO-SVR is significantly better. IPSO-SVR ensures that the degree of adaptation is small enough while still satisfying the need for a faster convergence rate. The results show that the IPSO algorithm has a better ability to find the global optimal solution.
As can be seen from Table 8, although PSO-SVR is superior in terms of fit, it is still not as stable as the improved particle swarm algorithm, and the prediction effect is not as good as the improved particle swarm algorithm; IPSO-SVR has the highest prediction accuracy and the best model stability, 94.00% and 8.71%, respectively, and the fit superiority R2 is also higher in comparison; the prediction performance and fit effect of SVR are relatively poor, and the model is not stable, with the highest relative standard deviation (RSD) of 16.56. Generally speaking, the smaller the value of RSD, the lower the degree of dispersion of the data, and the higher the inter-data consistency and stability [41]. Therefore, by combining the calculation of different evaluation parameters, it is verified that IPSO has a good optimization effect on two important parameters of SVR and has a certain research value, indicating that the model has good stability. Comparing the prediction of aircraft seat comfort using artificial neural networks by Zhao [19] and others, the RMSE and R2 obtained in the literature were 1.21 and 78%, respectively, and it was found that, in the model using IPSO to optimize the SVR, the data were better in terms of RMSE and prediction accuracy, which indicates the superior prediction accuracy of this method. The related research on the predictive analysis of airline seat comfort is still limited compared to other industries and needs to be further explored.

4. Conclusions

Aircraft are among the most popular transportation vehicles in today’s society, and studies on the comfort of aircraft seats as a carrier with direct human contact are particularly important. In this regard, this study took the main pilot seat of a general aviation aircraft as the research object, conducted body-pressure distribution tests on three different backrest inclination angles and two seat pitches, and used subjective evaluation as the output variable for model prediction to verify the high correlation between subjective comfort and objective data. LASSO regression was used to filter the indicators, eliminate irrelevant variables, and use the remaining indicators as model inputs to optimize the penalty parameter C and kernel function parameter σ in support vector machine regression, to obtain the best model generalization ability and model performance. This paper proposes a prediction method based on improved particle cluster algorithms to optimize support for vector returns. Finally, through the model comparison and validation of IPSO-SVR with GA-SVR, PSO-SVR, and SVR, an effective comfort prediction model of IPSO-SVR is provided. The prediction method of this model can be used for, but is not limited to, the analysis of aircraft seat comfort; it can also be applied to the study of car seats, office seats, etc., and help related industries to conduct reliable methodological research. The current experiment was conducted in a simulated cockpit, and the next step will be to consider conducting related tests on a real aircraft, which will be more convincing. In the future, joint research with other related fields can also be considered, with the aim of developing more comprehensive research results.

Author Contributions

Conceptualization, M.Z.; methodology, M.Z.; software, M.Z.; validation, X.Z.; formal analysis, M.Z.; investigation, M.Z. and X.Z.; resources, M.Z.; data curation, M.Z.; writing—original draft preparation, M.Z.; writing—review and editing, M.Z.; visualization, M.Z.; supervision, M.Z.; project administration, Y.Z.; funding acquisition, S.G. All authors have read and agreed to the published version of the manuscript.

Funding

This study is funded by the National Natural Science Foundation of China [Grant No. 32071685].

Institutional Review Board Statement

The study was conducted according to the guidelines of the Declaration of Helsinki.

Informed Consent Statement

Informed consent was obtained from all subjects involved in the study.

Data Availability Statement

Not applicable.

Conflicts of Interest

The authors declare no conflict of interest.

References

  1. Xiong, K.W.; Xu, L.; Sun, J.C.; Chen, S.; Ma, J.; Hu, W.D. The role of lumbar support on lumbar muscles during simulated pilot sitting. Occup. Health 2019, 35, 743–747. [Google Scholar]
  2. Vanacore, A.; Lanzotti, A.; Percuoco, C.; Capasso, A.; Vitolo, B. A model-based approach for the analysis of aircraft seating comfort. Work 2020, 68, S251–S255. [Google Scholar] [CrossRef] [PubMed]
  3. Li, X.X.; Ding, L.; Wang, X.W.; Wei, S.H.; Zhou, Q.X.; Hu, H.M. Simulation of pilot seat cushion comfort based on Ansys. J. Beijing Univ. Aeronaut. Astronaut. 2015, 41, 241–245. [Google Scholar]
  4. Lapa, V.V.; Neverov, G.I.; Poliakov, V.V.; Solov’ev, N.N. Effect of inclination angles of supporting surfaces og aircraft seat on pilot’s working capacity in long-duration flight. Aerosp. Environ. Med. 2000, 34, 17–21. [Google Scholar]
  5. Vancampfort, D.; Firth, J.; Schuch, F.B.; Rosenbaum, S.; Mugisha, J.; Hallgren, M.; Probst, M.; Ward, P.B.; Gaughran, F.; Hert, M.D.; et al. Sedentary Behavior and Physical Activity Levels in People with Schizophrenia, Bipolar Disorder and Major Depressive Disorder: A Global Systematic Review and Meta-Analysis. World Psychiatry 2017, 16, 308–315. [Google Scholar] [CrossRef] [PubMed] [Green Version]
  6. Vancampfort, D.; Hallgren, M.; Firth, J.; Rosenbaum, S.; Schuch, F.B.; Mugisha, J.; Probst, M.; Damme, T.V.; Carvalho, A.F.; Stubbs, B. Physical Activity and Suicidal Ideation: A Systematic Review and Meta-Analysis. J. Affect. Disord. 2018, 225, 438–448. [Google Scholar] [CrossRef] [Green Version]
  7. Huo, X.; Sun, W.L.; Tao, Q.; Kang, J.S.; Li, Z.B.; Wang, S.D. Seat comfort testing and evaluation based on sitting posture analysis. J. Eng. Des. 2017, 24, 286–294. [Google Scholar]
  8. Wang, M.Y.; Lin, Q.X.; Sun, S.Y. Development and evaluation of the office computer seating comfort questionnaire. In Proceedings of the Fifteenth Annual Conference of the Ergonomics Society of Taiwan, Taiwan, China, 15 March 2008. [Google Scholar]
  9. Smith, D.R.; Andrews, D.M.; Wawrow, P.T. Development and evaluation of the automotive seating discomfort questionnaire. Int. J. Ind. Ergon. 2006, 36, 141–149. [Google Scholar] [CrossRef]
  10. Liu, Z.P.; Wang, J. Seat comfort and its evaluation theory and method. Aerosp. Med. Med. Eng. 2010, 23, 292–298. [Google Scholar]
  11. De Looze, M.P.; Kuijt-Evers, L.F.M.; Van Dieen, J.A.A.P. Sitting Comfort and Discomfort and the Relationships with Objective Measures. Ergonomics 2003, 46, 985–997. [Google Scholar] [CrossRef]
  12. Pei, H.N.; Li, Y.M.; Huang, X.G.; Yang, Y.Y.; Lou, Z.H.; Zhang, S.Y. Optimization study of seat surface material comfort based on pressure distribution measurement system. Aerosp. Med. Med. Eng. 2020, 33, 432–439. [Google Scholar]
  13. Gao, K.Z.; Luo, Q.; Zhang, Z.F.; Xu, Z.M. Evaluation of vibration comfort of automotive seats based on body pressure distribution. Automot. Eng. 2022, 44, 1936–1943, 1963. [Google Scholar]
  14. Deng, L.; Wang, G.; Chen, B. Operating Comfort Prediction Model of Human-Machine Interface Layout for Cabin Based on GEP. Comput. Intell. Neurosci. 2015, 2015, 92. [Google Scholar] [CrossRef] [Green Version]
  15. Rysanek, A.; Nuttall, R.; McCarty, J. Forecasting the impact of climate change on thermal comfort using a weighted ensemble of supervised learning models. Build. Environ. 2020, 190, 107522. [Google Scholar] [CrossRef]
  16. Zhang, X.; Cheng, Z.; Zhang, M.; Zhu, X.; Zhang, X. Comfort Prediction of Office Chair Surface Material Based on the Issa-Lssvm. Sensors 2022, 22, 9822. [Google Scholar] [CrossRef]
  17. Mariano-Hernández, D.; Hernández-Callejo, L.; Solís, M.; Zorita-Lamadrid, A.; Duque-Perez, O.; Gonzalez-Morales, L.; Santos-García, F. A Data-Driven Forecasting Strategy to Predict Continuous Hourly Energy Demand in Smart Buildings. Appl. Sci. 2021, 11, 7886. [Google Scholar] [CrossRef]
  18. Yu, Y.; Wang, X.; Bründlinger, R. Improved Elman Neural Network Short-Term Residents Load Forecasting Considering Human Comfort Index. J. Electr. Eng. Technol. 2019, 14, 2315–2322. [Google Scholar] [CrossRef]
  19. Zhao, C.; Yu, S.H.; Miller, C.; Ghulam, M.; Li, W.H.; Wang, L. Predicting Aircraft Seat Comfort Using an Artificial Neural Network. Hum. Factors Ergon. Manuf. Serv. Ind. 2019, 29, 154–162. [Google Scholar] [CrossRef]
  20. Zhang, W.L.; Li, Y.L.; Yang, D.Z.; Xie, Q.H.; Yin, Y.Y.; Chen, D. SVR-based gasoline engine transition air flow prediction study. Automot. Engines 2023, 1, 44–51. [Google Scholar]
  21. Li, Z.D.; Zeng, J.; Wu, H.Q. A construction safety accident prediction model integrating GWO and SVR. J. Saf. Environ. 1–10.
  22. Wang, M.; Miao, W.; Tan, Y.; Wu, K.; Li, X.; Gu, Y.; Chen, L. Evaluation and Prediction Method of Automotive Electronic Accelerator Pedal Based on Support Vector Regression. Proc. Inst. Mech. Eng. Part D J. Automob. Eng. 2022, in press. [Google Scholar] [CrossRef]
  23. Chen, P.; Xu, L.; Tang, Q.; Shang, L.; Liu, W. Research on Prediction Model of Tractor Sound Quality Based on Genetic Algorithm. Appl. Acoust. 2022, 185, 108411. [Google Scholar] [CrossRef]
  24. Sha, Y.D.; Guan, S.X.; Zhao, H.; Liu, Y.; Liu, G.E. Prediction of internal helical groove cutting force by support vector regression machine based on simulated annealing algorithm optimization. Tool Technol. 2023, 57, 100–105. [Google Scholar]
  25. Xiong, Q.; Zhang, X.; Xu, X.; He, S. A modified chaotic binary particle swarm optimization scheme and its application in face-iris multimodal biometric identification. Electronics 2021, 10, 217. [Google Scholar] [CrossRef]
  26. He, Y.Q.; Liu, G.S.; Xiao, Y.Y.; Zhang, Z. Optimization of substation siting based on improved GA-PSO hybrid algorithm. Power Syst. Prot. Control. 2017, 45, 143–150. [Google Scholar]
  27. Koboyashi, T.; Simon, D.L. Hybrid neural network genetic-algorithm technique for aircraft engine performance diagnostics. J. Propuls. Power 2005, 21, 751–758. [Google Scholar] [CrossRef]
  28. Zhu, B.H.; Zheng, B.Y.; Dai, Y.J.; Liu, C. Prediction of coal and gas protrusion hazard in tunnel based on nonlinear support vector machine. Mod. Tunn. Technol. 2020, 57, 20–25. [Google Scholar]
  29. Zhao, X.; Gu, W.H. Tunnel collapse risk prediction based on artificial swarm optimization support vector machine regression. Sci. Technol. Eng. 2023, 23, 3997–4003. [Google Scholar]
  30. Peng, S.W.; Liang, K.; Pan, L.; Zhao, J.; Feng, Q.; Ding, S. Time-optimal trajectory planning of robotic arm based on improved particle swarm algorithm. Comb. Mach. Tools Autom. Mach. Technol. 2023, 6, 31–34. [Google Scholar]
  31. Zhou, Y.J.; Zhao, M.; Fu, J.W.; Long, Z.Q. Design of rocket anti-lightning reinforcement based on particle swarm algorithm. J. Arms Equip. Eng. 2023, 44, 281–287. [Google Scholar]
  32. Miao, J.J.; Li, D.B.; Li, H.J.; Jue, Z.B.; Chen, Z.H.; Chen, Z.L.; Feng, Y.X. Status and prospect of improved particle swarm algorithm in coal-fired power plants. Environ. Eng. 2023, 41, 354–362. [Google Scholar]
  33. Feng, Y.M.; Li, C.J.; Zhang, M. Research on medium and long-term reservoir scheduling function based on improved particle swarm algorithm. Hydropower 2008, 34, 94–97. [Google Scholar]
  34. Tong, Q.J.; Li, M.; Zhao, Q. An improved particle swarm optimization algorithm based on classification idea. Mod. Electron. Technol. 2019, 42, 11–14. [Google Scholar]
  35. Pei, H.N. Study on Evaluation Method of Comfort for Civil Aircraft Cabin Based on Ergonomic Exposure. Ph.D. Thesis, North-Western Polytechnical University, Xi’an, China, 2017. [Google Scholar]
  36. Zhang, F.; Li, K.X.; Zhou, J.B. Research on the evaluation of human vibration comfort of cabin seat of a certain type of airplane. Strength Environ. 2019, 46, 59–63. [Google Scholar]
  37. Kokorikou, A.; Vinka, P.; de Pauw, I.C.; Braca, A. Exploring the design of a lightweight, sustainable and comfortable aircraft seat. Work J. Prev. Assess. Rehabil. 2016, 64, 941–954. [Google Scholar] [CrossRef]
  38. Zhong, Q.; Guo, G.; Pei, X.S.; Xu, N. An improved BP neural network-based office seating comfort evaluation method. Packag. Eng. 2018, 39, 155–158. [Google Scholar]
  39. Zhao, C.; Yu, S.H.; Wang, L.; Li, W.H. Characteristics of body pressure distribution under different sampling densities. J. Zhejiang Univ. (Eng. Ed.) 2019, 53, 268–274. [Google Scholar]
  40. Yu, S.H.; Gong, S.H. Grain price forecasting based on Lasso and support vector machine. J. Hunan Univ. (Soc. Sci. Ed.) 2016, 30, 71–75. [Google Scholar]
  41. Li, G.N.; Shi, J.K.; Chen, X.M.; Gao, C.; Jiang, X.J.; Cui, C.J.; Zhu, Q.; Hou, S.C.; Zhou, W.H. Research on overfocus scanning microscopy measurement method based on machine learning. Chin. Opt. 2022, 15, 703–711. [Google Scholar]
Figure 1. IPSO-optimized SVR flow chart.
Applsci 13 09038 g001
Figure 2. Aeroplane simulator cockpit seat.
Applsci 13 09038 g002
Figure 3. Experimental equipment.
Applsci 13 09038 g003
Figure 4. Seat with 140° seat tilt angle.
Applsci 13 09038 g004
Figure 5. Standard cushion and backrest pressure two-dimensional diagram.
Applsci 13 09038 g005
Figure 6. IPSO-SVR model prediction results.
Applsci 13 09038 g006
Figure 7. Iteration process of each optimization algorithm.
Applsci 13 09038 g007
Table 1. Basic information of the test persons.
AgeHeight (cm)Weight (kg)Number
Male26.67 ± 8.8178.44 ± 4.8674.38 ± 8.7716
Female25.55 ± 7.4164.82 ± 5.2055.36 ± 8.8811
Sum26.08 ± 8.2172.89 ± 8.3566.63 ± 12.8427
Table 2. LASSO regression coefficients.
VariablesRegression CoefficientVariablesRegression Coefficient
Gender−0.107988Hip object pressure0
Height0.087529Hip peak object pressure0
Weight0.0647327Hip peak contact pressure0
Back object pressure0Hip peak strength0
Back peak object pressure−0.0054094Hip contact area0.0211677
Back peak contact pressure−0.0058324Hip contact pressure0
Back peak strength0Hip strength0.8117908
Back contact area0.0042048
Back contact pressure0.3892448
Back strength0
Table 3. Pressure distribution at a spacing of 63 cm.
ParametersDifferent Backrest AnglesCardinal ValuesSignificance
(p)
100°110°120°
Back peak object pressure30.71 ± 2.1532.81 ± 1.6732.03 ± 2.16588.203<0.01 **
Back peak contact pressure31.13 ± 2.1333.98 ± 2.1434.55 ± 2.05798.623<0.01 **
Back contact area382.03 ± 7.98411.99 ± 11.26463.28 ± 10.871200<0.01 **
Back contact pressure13.82 ± 0.3513.59 ± 0.2313.29 ± 0.291014.514<0.01 **
Hip contact area741.99 ± 7.76718.98 ± 6.48679.19 ± 5.521200<0.01 **
Hip strength977.39 ± 20.96934.55 ± 17.67902.32 ± 18.011200<0.01 **
The symbol “**” denotes a statistically significant difference at the 95% confidence level.
Table 4. Post hoc two-by-two comparison of different backrest angles at a spacing of 63 cm.
ParametersDifferent Backrest Angles
100–110°100–120°110–120°
ZSigZSigZSig
Back peak object pressure−20.654<0.01 **−18.423<0.01 **−11.139<0.01 **
Back peak contact pressure−21.092<0.01 **−21.039<0.01 **−5.643<0.01 **
Back contact area−21.222<0.01 **−21.222<0.01 **−21.222<0.01 **
Back contact pressure−19.327<0.01 **−21.222<0.01 **−20.654<0.01 **
Hip contact area−21.222<0.01 **−21.222<0.01 **−21.222<0.01 **
Hip strength−21.222<0.01 **−21.222<0.01 **−21.222<0.01 **
Table 5. Pressure distribution at a spacing of 68 cm.
ParametersDifferent Backrest AnglesCardinal ValuesSignificance
(p)
100°110°120°
Back peak object pressure36.66 ± 1.8936.17 ± 1.9331.23 ± 1.48920.28<0.01 **
Back peak contact pressure38.82 ± 2.0137.75 ± 1.5232.31 ± 1.52924.753<0.01 **
Back contact area392.11 ± 8.76410.83 ± 11.04479.41 ± 13.291188.12<0.01 **
Back contact pressure14.58 ± 0.4713.85 ± 0.2913.53 ± 0.211088.813<0.01 **
Hip contact area745.07 ± 10.23730.21 ± 6.32679.49 ± 8.321178.403<0.01 **
Hip strength977.24 ± 29.26982.31 ± 20.22926.33 ± 19.46911.213<0.01 **
The symbol “**” denotes a statistically significant difference at the 95% confidence level.
Table 6. Post hoc two-by-two comparison of different backrest angles at 68 cm interval.
ParametersDifferent Backrest Angles
100–110°100–120°110–120°
ZSigZSigZSig
Back peak object pressure−6.159<0.01 **−21.222<0.01 **−21.222<0.01 **
Back peak contact pressure−11.06<0.01 **−21.222<0.01 **−21.222<0.01 **
Back contact area−21.21<0.01 **−21.222<0.01 **−21.222<0.01 **
Back contact pressure−21.222<0.01 **−21.222<0.01 **−20.215<0.01 **
Hip contact area−21.181<0.01 **−21.222<0.01 **−21.222<0.01 **
Hip strength−7.675<0.01 **−21.222<0.01 **−21.222<0.01 **
Table 7. Relative error between predicted and true values.
SamplePredicted ValueTrue ValueRelative Error
15.26890550.053781
25.94243160.009595
35.0357164.50.119048
45.40076950.080154
56.31699760.052833
67.52247270.074639
75.62843660.061927
305.3711450.074228
315.5887555.50.016137
325.7955785.50.053742
Table 8. Comparison of IPSO-SVR with other prediction models.
Prediction ModelRMSEMAER2RSDPrediction Accuracy
IPSO-SVR0.370.320.928.71%94.00%
PSO-SVR0.410.550.8810.33%90.39%
SVR0.520.720.7316.56%71.17%
GA-SVR0.480.590.8413.91%84.63%
Disclaimer/Publisher’s Note: The statements, opinions and data contained in all publications are solely those of the individual author(s) and contributor(s) and not of MDPI and/or the editor(s). MDPI and/or the editor(s) disclaim responsibility for any injury to people or property resulting from any ideas, methods, instructions or products referred to in the content.