Article

Comparative Grain Size Analysis of Modern Flood Sediments Based on Graphic and Moment Methods in the Lower Yellow River (Huang He), China

1
School of Geography and Resources, Guizhou Education University, Guiyang 550018, China
2
Guizhou Provincial Key Laboratory of Geographic State Monitoring of Watershed, Guizhou Education University, Guiyang 550018, China
3
College of Geography and Environment, Shandong Normal University, Jinan 250358, China
4
Department of Hydrological Information, Shandong Provincial Center of Hydrology, Jinan 250014, China
5
Institute of Jiangsu Coastal Development, Yancheng Teachers University, Yancheng 224002, China
*
Authors to whom correspondence should be addressed.
Appl. Sci. 2023, 13(15), 8934; https://doi.org/10.3390/app13158934
Submission received: 14 June 2023 / Revised: 29 July 2023 / Accepted: 2 August 2023 / Published: 3 August 2023

Abstract

:
Grain size analysis of flood sediments is a key method for understanding the sedimentary environments of rivers worldwide; however, there is limited knowledge of how to effectively reflect the sedimentary environment of lower Yellow River (Huang He) flood events using grain size parameters. In this study, two widely used grain size analysis methods, the graphic method (GM) and moment method (MM), were compared, and their applicability to flood sediment analysis in the lower Yellow River was evaluated. Modern flood sediments (n = 143) in the lower Yellow River featured a fine-grained texture and were classified as silty sand (4.95 ≤ Φ ≤ 5.03) characterized by an inadequate sorting ability. The grain size distribution patterns obtained using the GM and MM revealed positive and extremely positive deviations with sharp and flat peaks, respectively. A strong correlation (0.6966 ≤ R2 ≤ 0.9961) was observed between the mean grain size and the sorting coefficient obtained using the GM and MM. Thus, both methods were deemed suitable and could be used interchangeably. Our results indicate that the MM should be applied to assess skewness because it provided comprehensive information regarding flood sediments in the lower Yellow River, whereas the GM is recommended for kurtosis analysis, as it highlighted the primary sedimentary dynamics during flood events. Methods must be selected based on the sedimentary environment when analyzing grain size parameters.

1. Introduction

Sediments in diverse environments serve as critical agents for recording environmental evolution [1,2]. Therefore, studying sediment grain size parameters and their variations is fundamental for evaluating changes in sedimentary environments and exploring environmental evolution [1,2,3,4,5,6,7].
Grain size parameter analysis is key to understanding sedimentary environments and has received substantial attention from sedimentologists and geomorphologists. The graphic method (GM) and moment method (MM) are widely used to analyze sediment grain size parameters in diverse sedimentary environments [1,8,9,10]. Based on statistical methods, the GM allows for the calculation of grain size parameters by taking the grain size at a specific cumulative percentage on the accumulation curve as a variable [1]. This method is straightforward and allows the analysis results to be compared with the grain size accumulation curve [11]. In contrast, the MM involves the calculation of the percentage of all grain sizes and provides insights into the characteristics of the sediment grain size distribution [8]. The MM’s computation process is relatively intricate, and its analysis outcomes can be matched with the natural grain size distribution curve [10,12]. Therefore, the GM and MM have different emphases when characterizing sediment grain size parameters. Consequently, conclusions drawn from the same sedimentary environment information may yield inconsistent results when the aforementioned methods are utilized.
Previous studies have suggested considerable variations in grain size characteristics across diverse environments [12,13,14,15]. The GM and MM possess unique advantages and limitations when applied. For example, the mean grain size of tidal flat sediments has shown minimal differences when determined using these two methods [12,16]. However, the sorting coefficient has exhibited discrepancies, and the skewness and kurtosis have exhibited substantial variations [12]. Similar findings have been reported for aeolian sediments, such as Luochuan loess and Qin’an red clay [17,18]. In contrast, in the analysis of bay and lagoon sediments, the GM is more advantageous than the MM for analyzing grain size parameters owing to the sorting coefficient [19,20,21]. Furthermore, comparative analyses of the GM and MM have been conducted using samples from lakes [22]. However, knowledge of the differences in the grain sizes of river flood sediments obtained using the GM and MM is limited. The Yellow River (Huang He) delivers a large amount of terrigenous sediment (with a median grain size of approximately 18 μm between 1964 and 2020) to its lower reaches and delta area [23]. Some of these sediments are deposited in the lower Yellow River and are classified as fine-grained [23]. It is important to determine which method can effectively reflect the grain size of lower Yellow River flood sediments, as such knowledge is of great importance for identifying paleo-flood sediments and investigating changes in paleo-sedimentary environments.
Considering the above, a detailed investigation was conducted using 143 modern flood sediment samples collected from the Shandong reach of the lower Yellow River. The main objectives of this study were as follows: (1) to examine the grain size characteristics of modern flood sediments in the lower Yellow River and (2) to assess the applicability of the GM and MM in analyzing the grain size parameters of flood sediments.

2. Materials and Methods
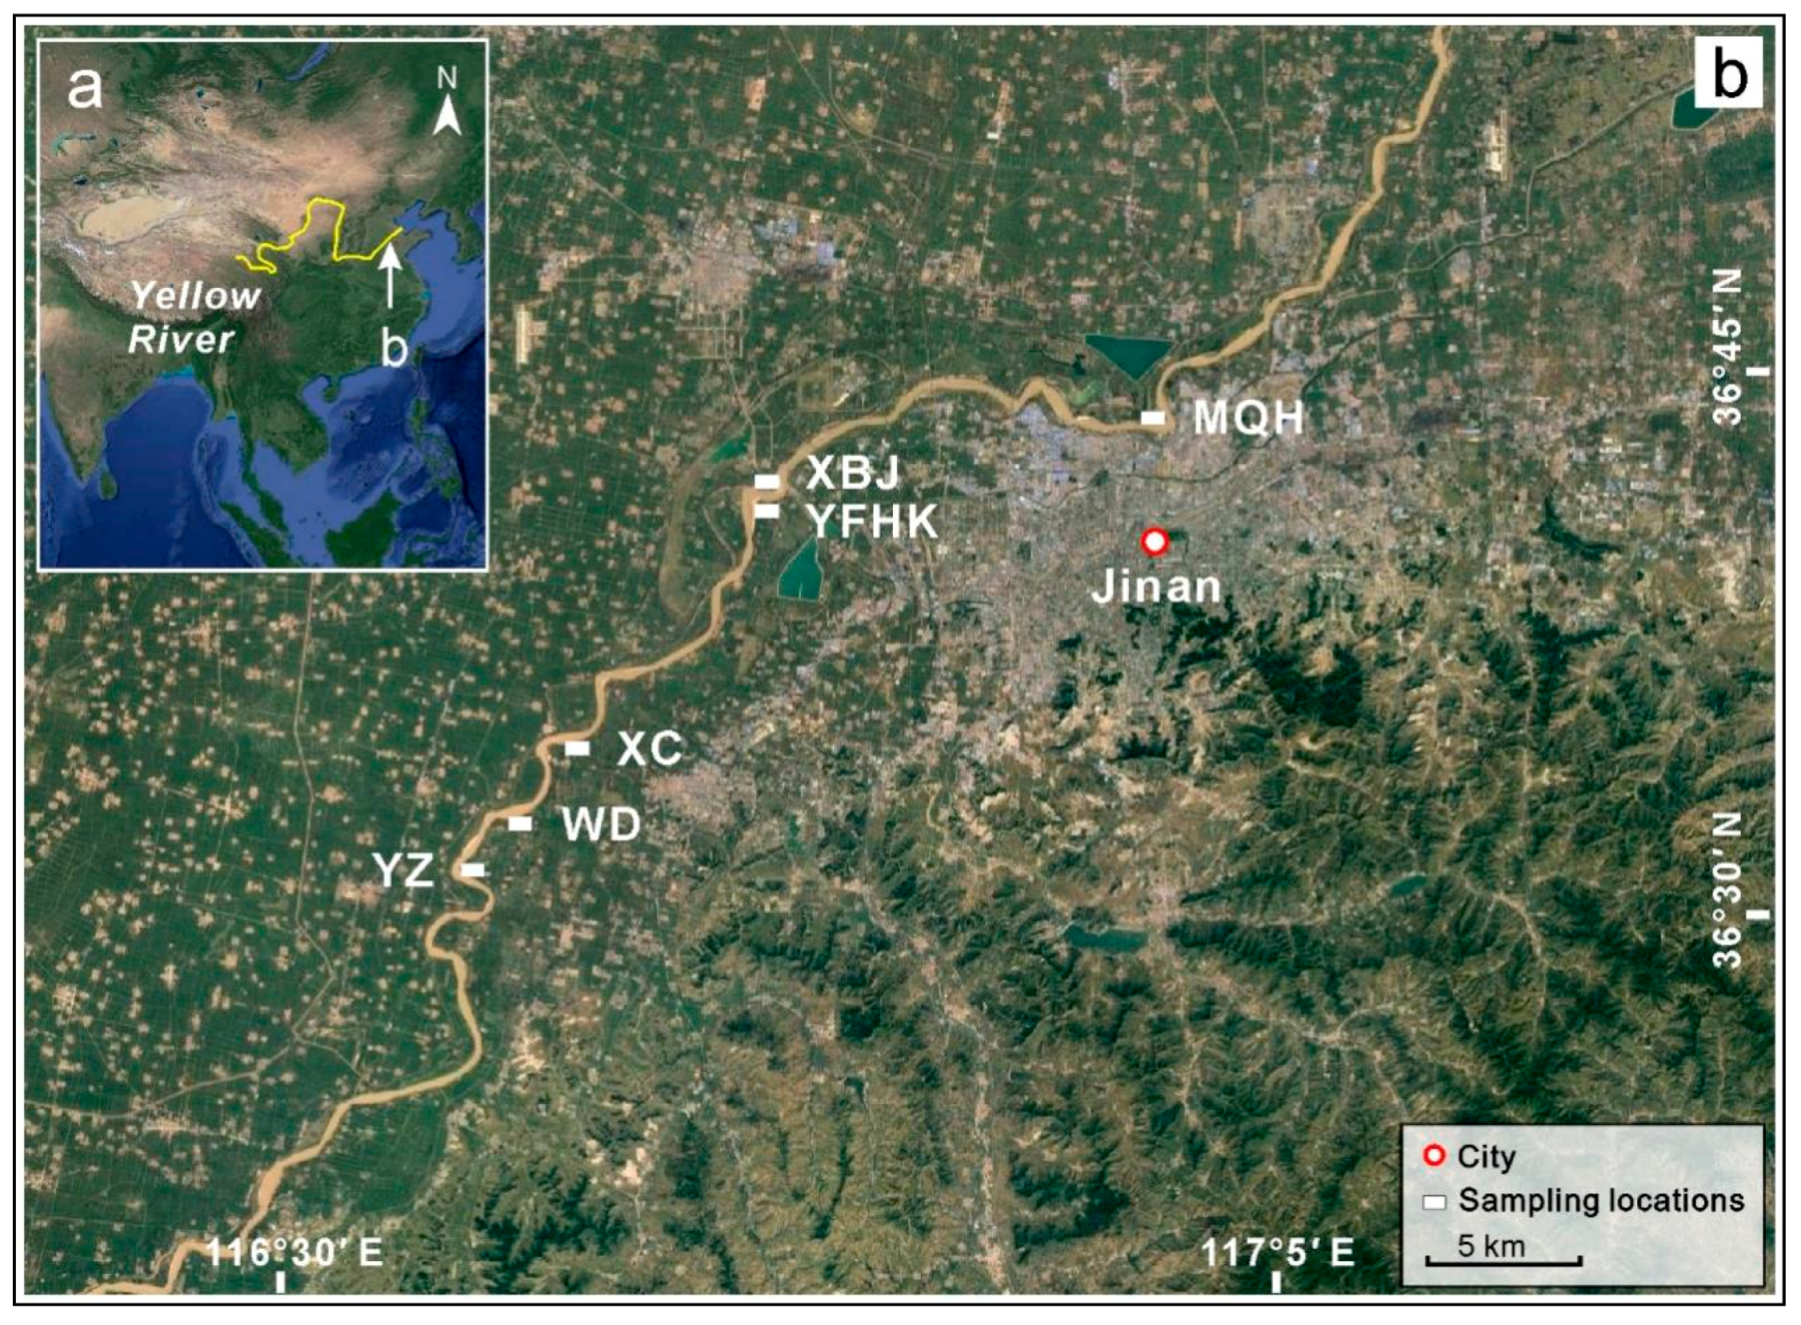
2.1. The Study Area

The Yellow River originates in the Qinghai–Tibet Plateau and is the second-longest river in China. Its main stream is approximately 5464 km long (Figure 1a) [24]. The upper Yellow River extends from its source in Qinghai Province to Hekou Town in the Inner Mongolia Autonomous Region, with a total length of approximately 3472 km. This section is the primary source of runoff, contributing approximately 58% of the total river discharge flowing into the ocean [24]. The middle Yellow River stretches approximately 1206 km from Hekou Town to Taohuayu Town in Henan Province and is the main source of the river’s sediment, accounting for approximately 90% of the total volume flowing into the ocean [24]. The lower reaches of the Yellow River are located downstream of Taohuayu, stretching approximately 786 km. This segment is one of the main regions of sediment deposition and forms the “suspended” river, with a length of approximately 340 km [24]. Meanwhile, the huge sediment load has shaped the Yellow River Delta, with an area of 5500 km2 [25]. The Shandong section of the lower Yellow River has a temperate continental monsoon climate with four distinct seasons. The spring is dry, with minimal rainfall, and the summer is warm with abundant precipitation. The study area is located within the uppermost section of the Shandong segment, with a length of approximately 90 km (116°11′–117°44′ E, 36°01′–37°32′ N; Figure 1b). This section is situated in the alluvial plain region of the Yellow River and features artificial embankments on both sides. The flow of the river is constrained within the channel, featuring a narrow water surface and a relatively concentrated flow. Floodplains are common within the embankments, and their morphologies tend to vary substantially from year to year.

2.2. Samples Recovered from Modern Flood Sediments

In September 2021, a detailed field investigation was conducted along the lower Yellow River within the Shandong reach. Sampling of fresh flood sediments was performed at locations with favorable sedimentary conditions for flood deposits [26]. The selection criteria for these sampling sites were high river floodplains with relatively even or slightly sloping surfaces. The selected sampling locations included the Yanzhuang site (YZ), Wudu site (WD), Xicang site (XC), Yufuhekou site (YFHK), Xibeijie site (XBJ), and Muqinhe park site (MQH), with coordinates ranging from 116°22′01″ to 117°04′13″ E and from 36°18′54″ to 36°52′46″ N (Figure 1b).
To ensure a comprehensive and precise reflection of the grain size characteristics of the modern flood sediment samples that were collected, debris, such as branches and leaves, was removed prior to sampling. The study samples were taken from fresh floodplains because these were the deposits least affected by external factors. Sampling was performed while considering variations in the thickness and lamination characteristics of the sediment. As this study focused on a single flood event, homogeneous mixing was performed during sampling at locations featuring thicker sediment layers closer to the river. Thinner sediment layers, especially those at the apex, were sampled while avoiding the sediment below the lamination. Equidistant sampling was primarily performed, with 143 samples collected, including 12, 37, 47, 18, 21, and 8 samples collected from YZ, WD, XC, YFHK, XBJ, and MQH, respectively (Figure 1b).

2.3. Grain Size Analysis

The collected samples were dried at 40 °C by placing them in an oven. Approximately 0.2 g of each dried sample was then transferred to designated beakers. All samples were treated with HCl (10%) to remove carbonates and H2O2 (10%) to remove humic acids. The samples were then rinsed with pure water until a neutral pH was achieved. Subsequently, an ultrasonic disperser was used to oscillate the samples with 5 mL of a 5% sodium hexametaphosphate solution for 10 min. Finally, the grain size frequency distributions were determined using a Mastersizer 3000 laser particle analyzer (Malvern, UK), which had a measurement range of 0.01 to 3500 μm. All experimental pretreatments and measurements were conducted at Shandong Normal University, Jinan City, China.

2.4. The Calculation Methods of Grain Size Parameters

The grain size frequency distributions of each sample were analyzed using the GM and MM. The grain size parameters were determined using the GM by identifying the corresponding grain sizes at 5%, 16%, 25%, 50%, 75%, 84%, and 95% on the cumulative frequency curve, which were then transformed into Φ values, as specified by Formula (1). The grain size parameters were subsequently calculated according to the formulas proposed by Folk and Ward (Formulas (2)–(5)) [1].
Φ = log 2 d
M z = φ 16 + φ 50 + φ 84 3
σ 1 = φ 84 φ 16 4 + φ 95 φ 5 6.6
S k 1 = φ 16 + φ 84 2 φ 50 2 ( φ 84 φ 16 ) + φ 5 + φ 95 2 φ 50 2 ( φ 95 φ 5 )
K G = φ 95 φ 5 2.44 ( φ 75 φ 25 )
where Mz, δ1, Sk1, and KG are the mean grain size, sorting coefficient, skewness, and kurtosis, respectively.
When determining the grain size parameters, the MM allows for the consideration of the entire grain size distribution and the calculation of the central moments of various orders of the variable. To streamline this process, the grouping method proposed by McManus (Formulas (6)–(10)) [9] was employed in this study.
Φ = log 2 ( d d 0 )
M z = i = 1 n X i f i 100
σ i = i = 1 n ( X i X ¯ ) 2 f i 100
S k 1 = i = 1 n ( X i X ¯ ) 3 f i 100 3
K G = i = 1 n ( X i X ¯ ) 4 f i 100 4
where d refers to the size of the sediment grain (mm), d0 is set to 1 mm, X indicates the mean grain size, Xi represents the grain size observed in the sample, fi denotes the percentage of the grain size component present at Xi in the sample, and n indicates the total number of grain size groups observed in the samples.

3. Results

3.1. Quantitative Characteristics and Analysis of Grain Size Parameters

The grain size distribution of modern flood sediments in the lower Yellow River exhibited the following characteristics: According to the GM, the sediment grain sizes were relatively fine, with the mean grain size ranging from 3.74 to 6.25 Φ, a mean value of 5.03 Φ, and a standard deviation of 0.45 (Table 1), indicating that the sediments were silty sand. The sorting coefficient ranged from 1.22 to 1.81, with a mean value of 1.34 and a standard deviation of 0.46, suggesting poor sorting. The skewness ranged from 0 to 0.61, with a mean value of 0.30 and a standard deviation of 0.08, indicating positive skewness. The kurtosis values ranged from 0.84 to 2.06, with a mean value of 1.33 and a standard deviation of 0.19, suggesting the existence of a sharp peak. According to the MM, the sediment grain size was relatively fine, characterized by an average grain size between 3.52 and 6.26 Φ (Table 1), a mean value of 4.95 Φ, and a standard deviation of 0.46, indicating that the sediments were silty sand. The sorting coefficient ranged from 0.92 to 1.75, with a mean value of 1.28 and a standard deviation of 0.15, suggesting poor sorting. The skewness ranged from 0.91 to 2.07, with a mean value of 1.39 and a standard deviation of 0.18, indicating significant positive skewness. Additionally, the kurtosis ranged from 1.58 to 2.61, with a mean value of 1.95 and a standard deviation of 0.17, indicating a flat peak.
The sedimentological characteristics of modern flood sediments in the lower Yellow River were studied, revealing that they had a fine grain size and could be classified as poorly sorted silty sand. However, the results obtained using the two methods differed. Specifically, the skewness obtained using the GM was positive, whereas that obtained using the MM was extremely positive. Furthermore, the kurtosis obtained by the GM was sharp, whereas that obtained using the MM was flat.
A linear regression analysis was performed on the data obtained from the GM and MM (Figure 2). The mean grain size regression exhibited a strong correlation, with a slope of 0.9769 and a coefficient of determination (R2) of 0.9961 (Figure 2a). In contrast, the sorting coefficient results showed a significant correlation between the two methods, with a slope of 0.5555 and a coefficient of determination of 0.6966 (Figure 2b). Similarly, the correlation between the two methods for skewness was also significant, with a coefficient of determination of 0.6371 and a slope of 0.3617 (Figure 2c). Conversely, the correlation between the two methods for kurtosis was weak, with a coefficient of determination of 0.0577 and a slope of 0.2597, indicating a poor correlation or no correlation between them (Figure 2d).

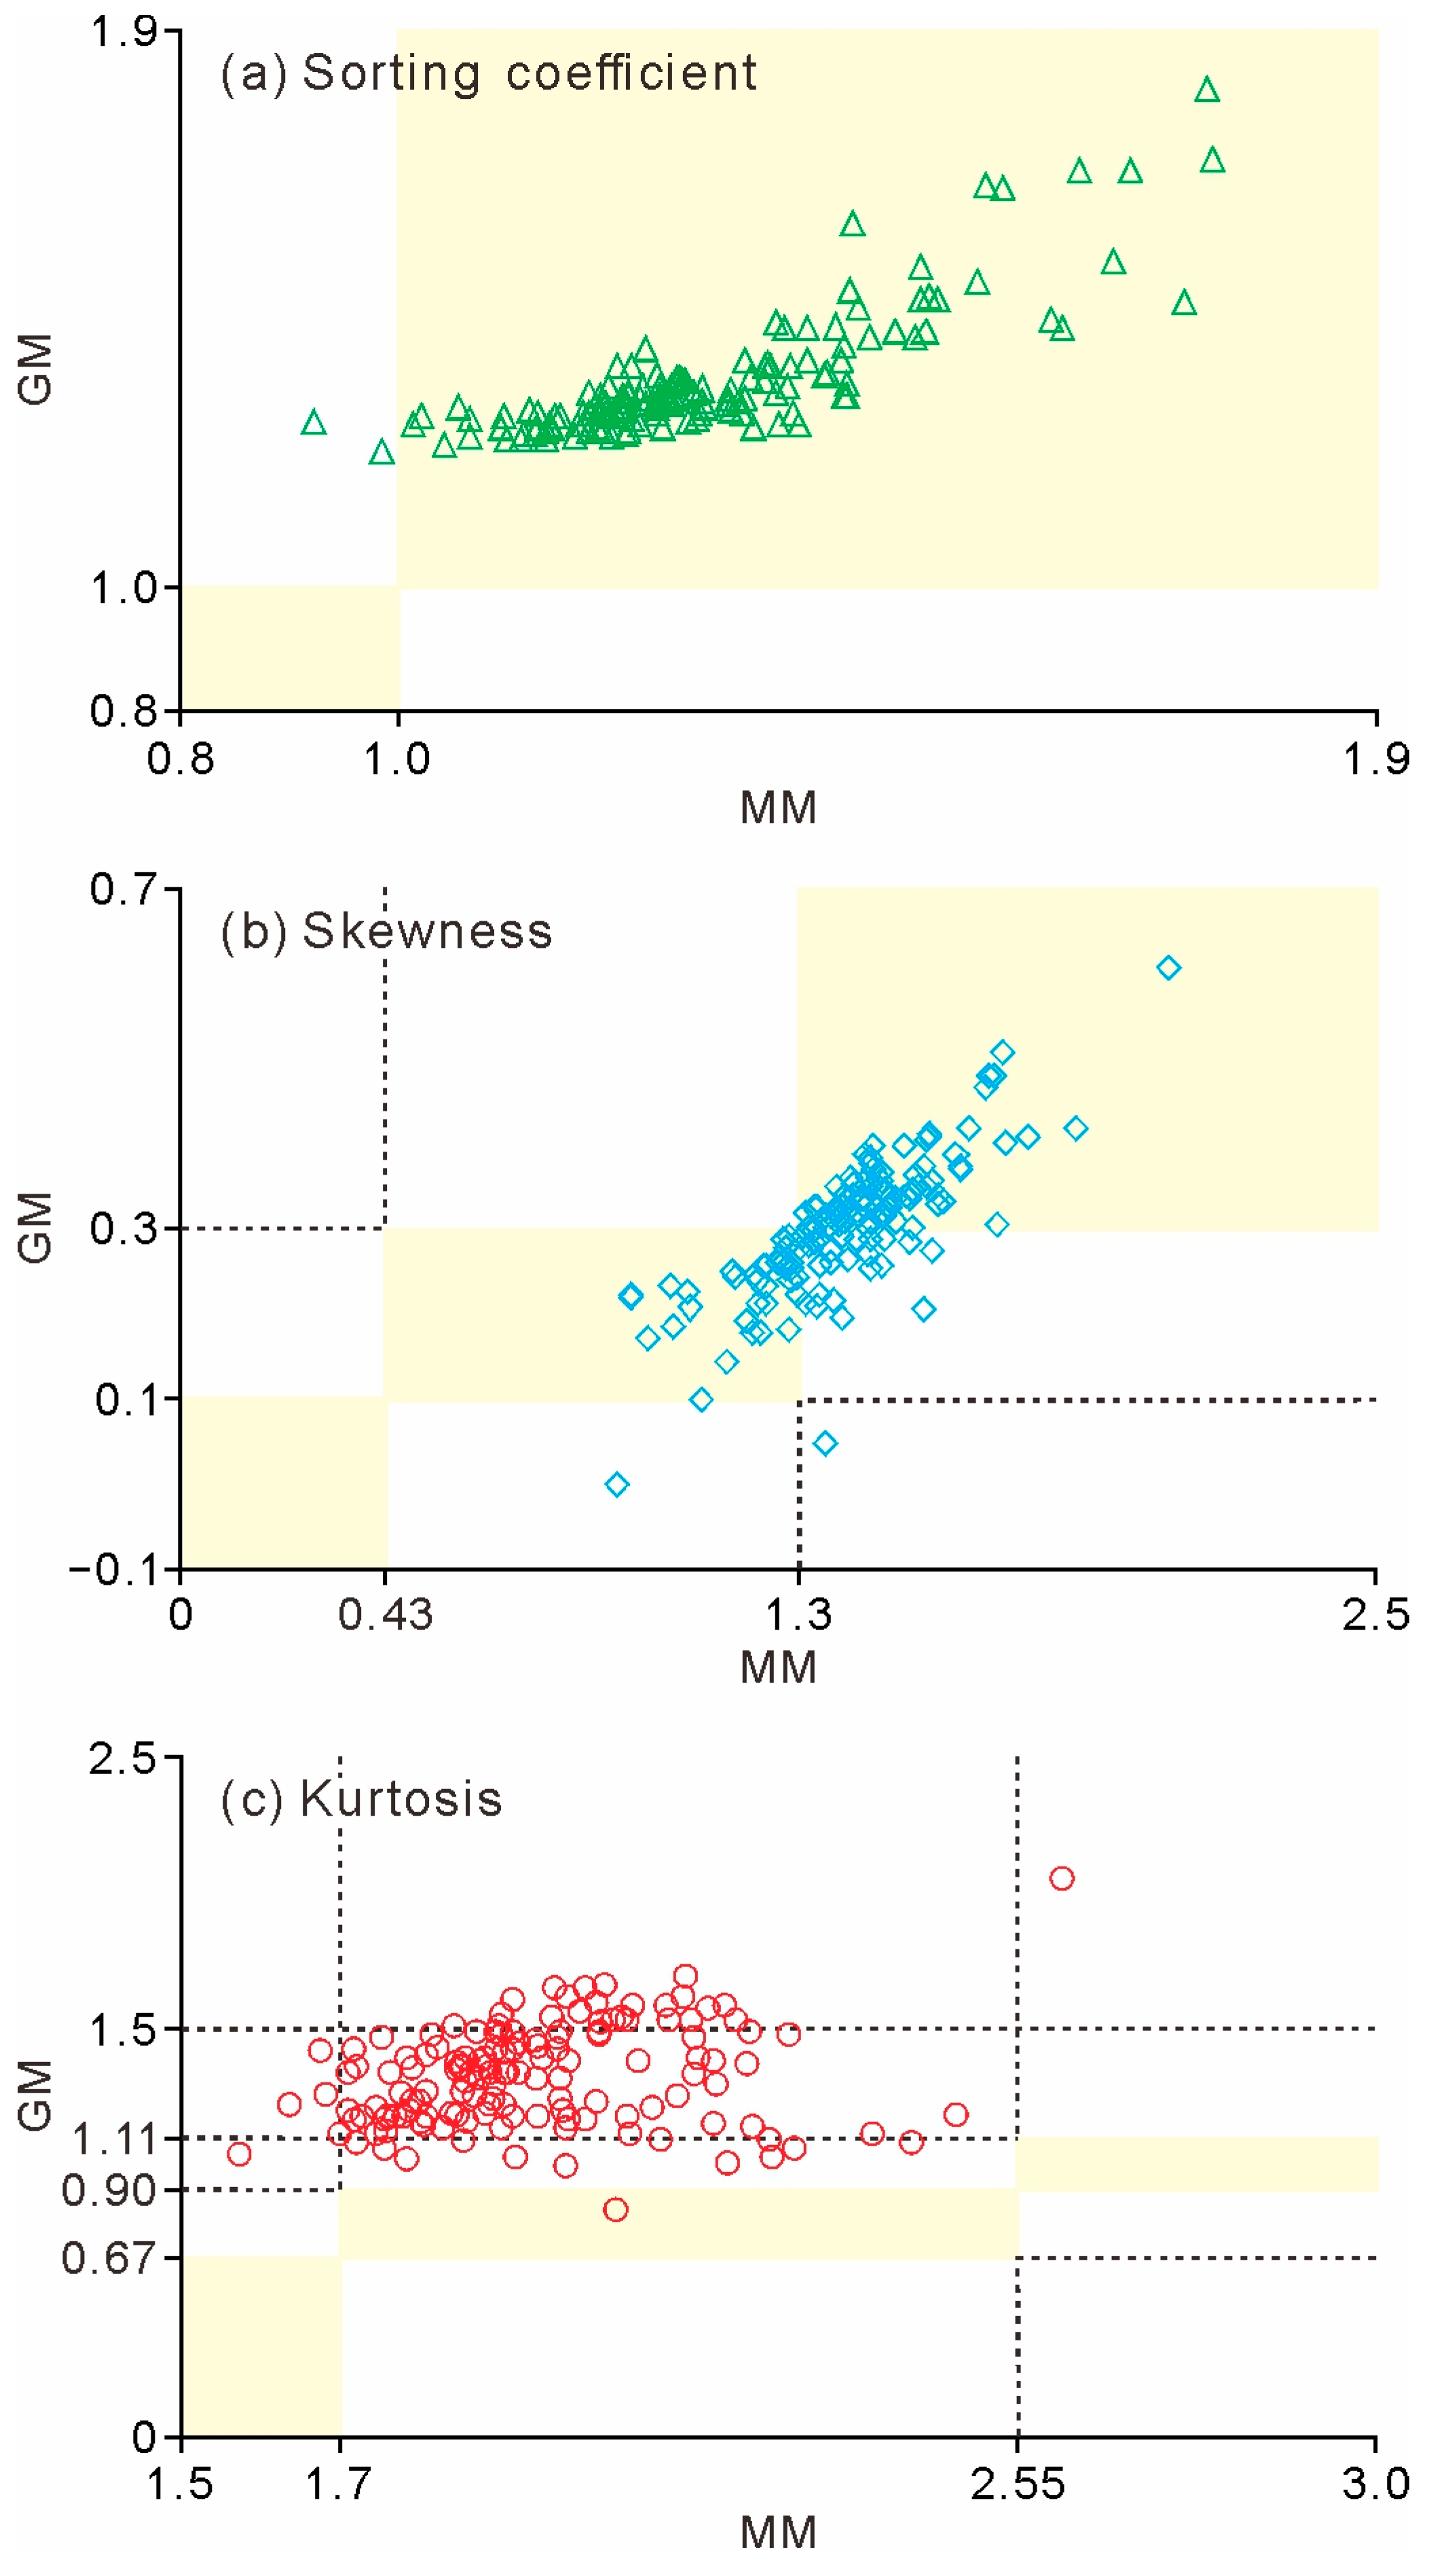
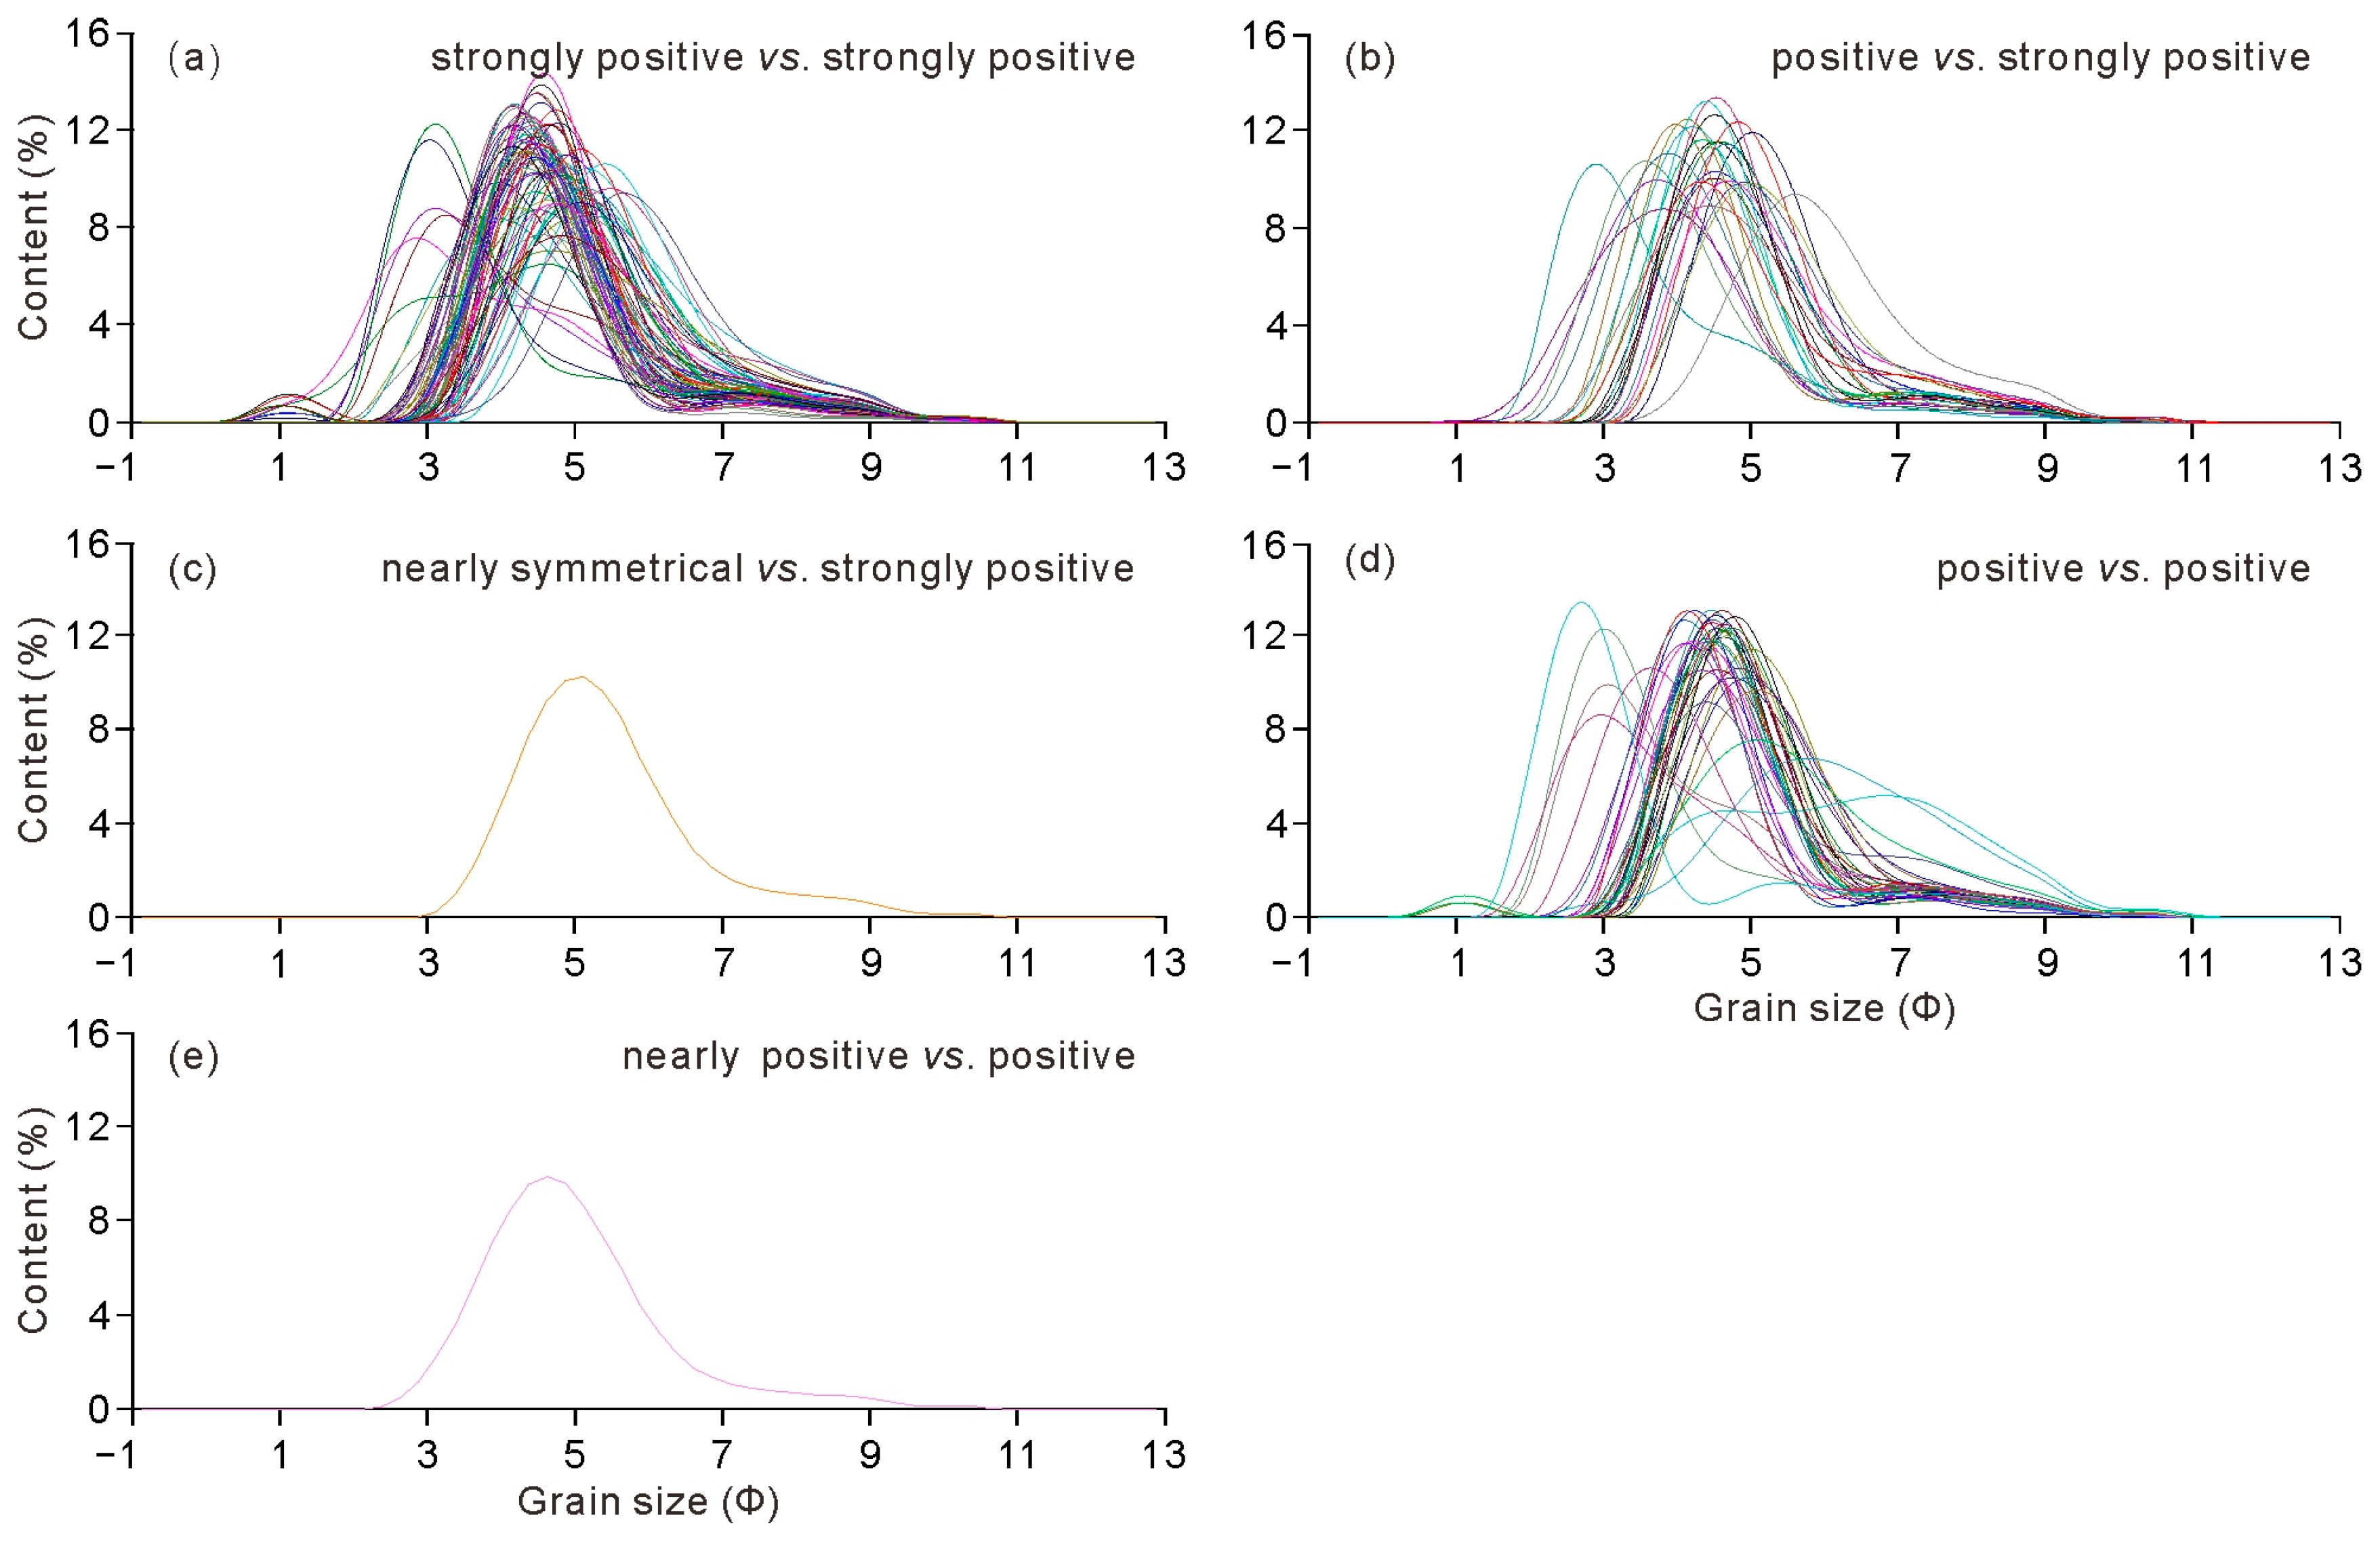
3.2. Qualitative Analysis of Grain Size Parameters

To further understand the similarities and discrepancies between the two methods, we analyzed the consistency of the results in terms of the qualitative descriptions of the sorting coefficient, skewness, and kurtosis (Figure 3). Among the 143 samples analyzed for the sorting coefficient, 141 and 2 exhibited consistent (shown in the yellow area) and inconsistent results, respectively, yielding a consistency rate of 98.61% (Figure 3a). Similarly, among the 143 samples analyzed for skewness, 114 exhibited consistent outcomes and 29 were inconsistent, yielding a consistency rate of 79.17% (Figure 3b). In contrast, only one of the 143 samples analyzed for kurtosis produced consistent results and 142 out of 143 samples presented as inconsistent, yielding a consistency rate of 0.70% (Figure 3c).
Therefore, among the qualitative descriptive term results determined according to the two methods, the sorting coefficient was consistent, whereas the skewness and kurtosis demonstrated evident differences.

4. Discussions

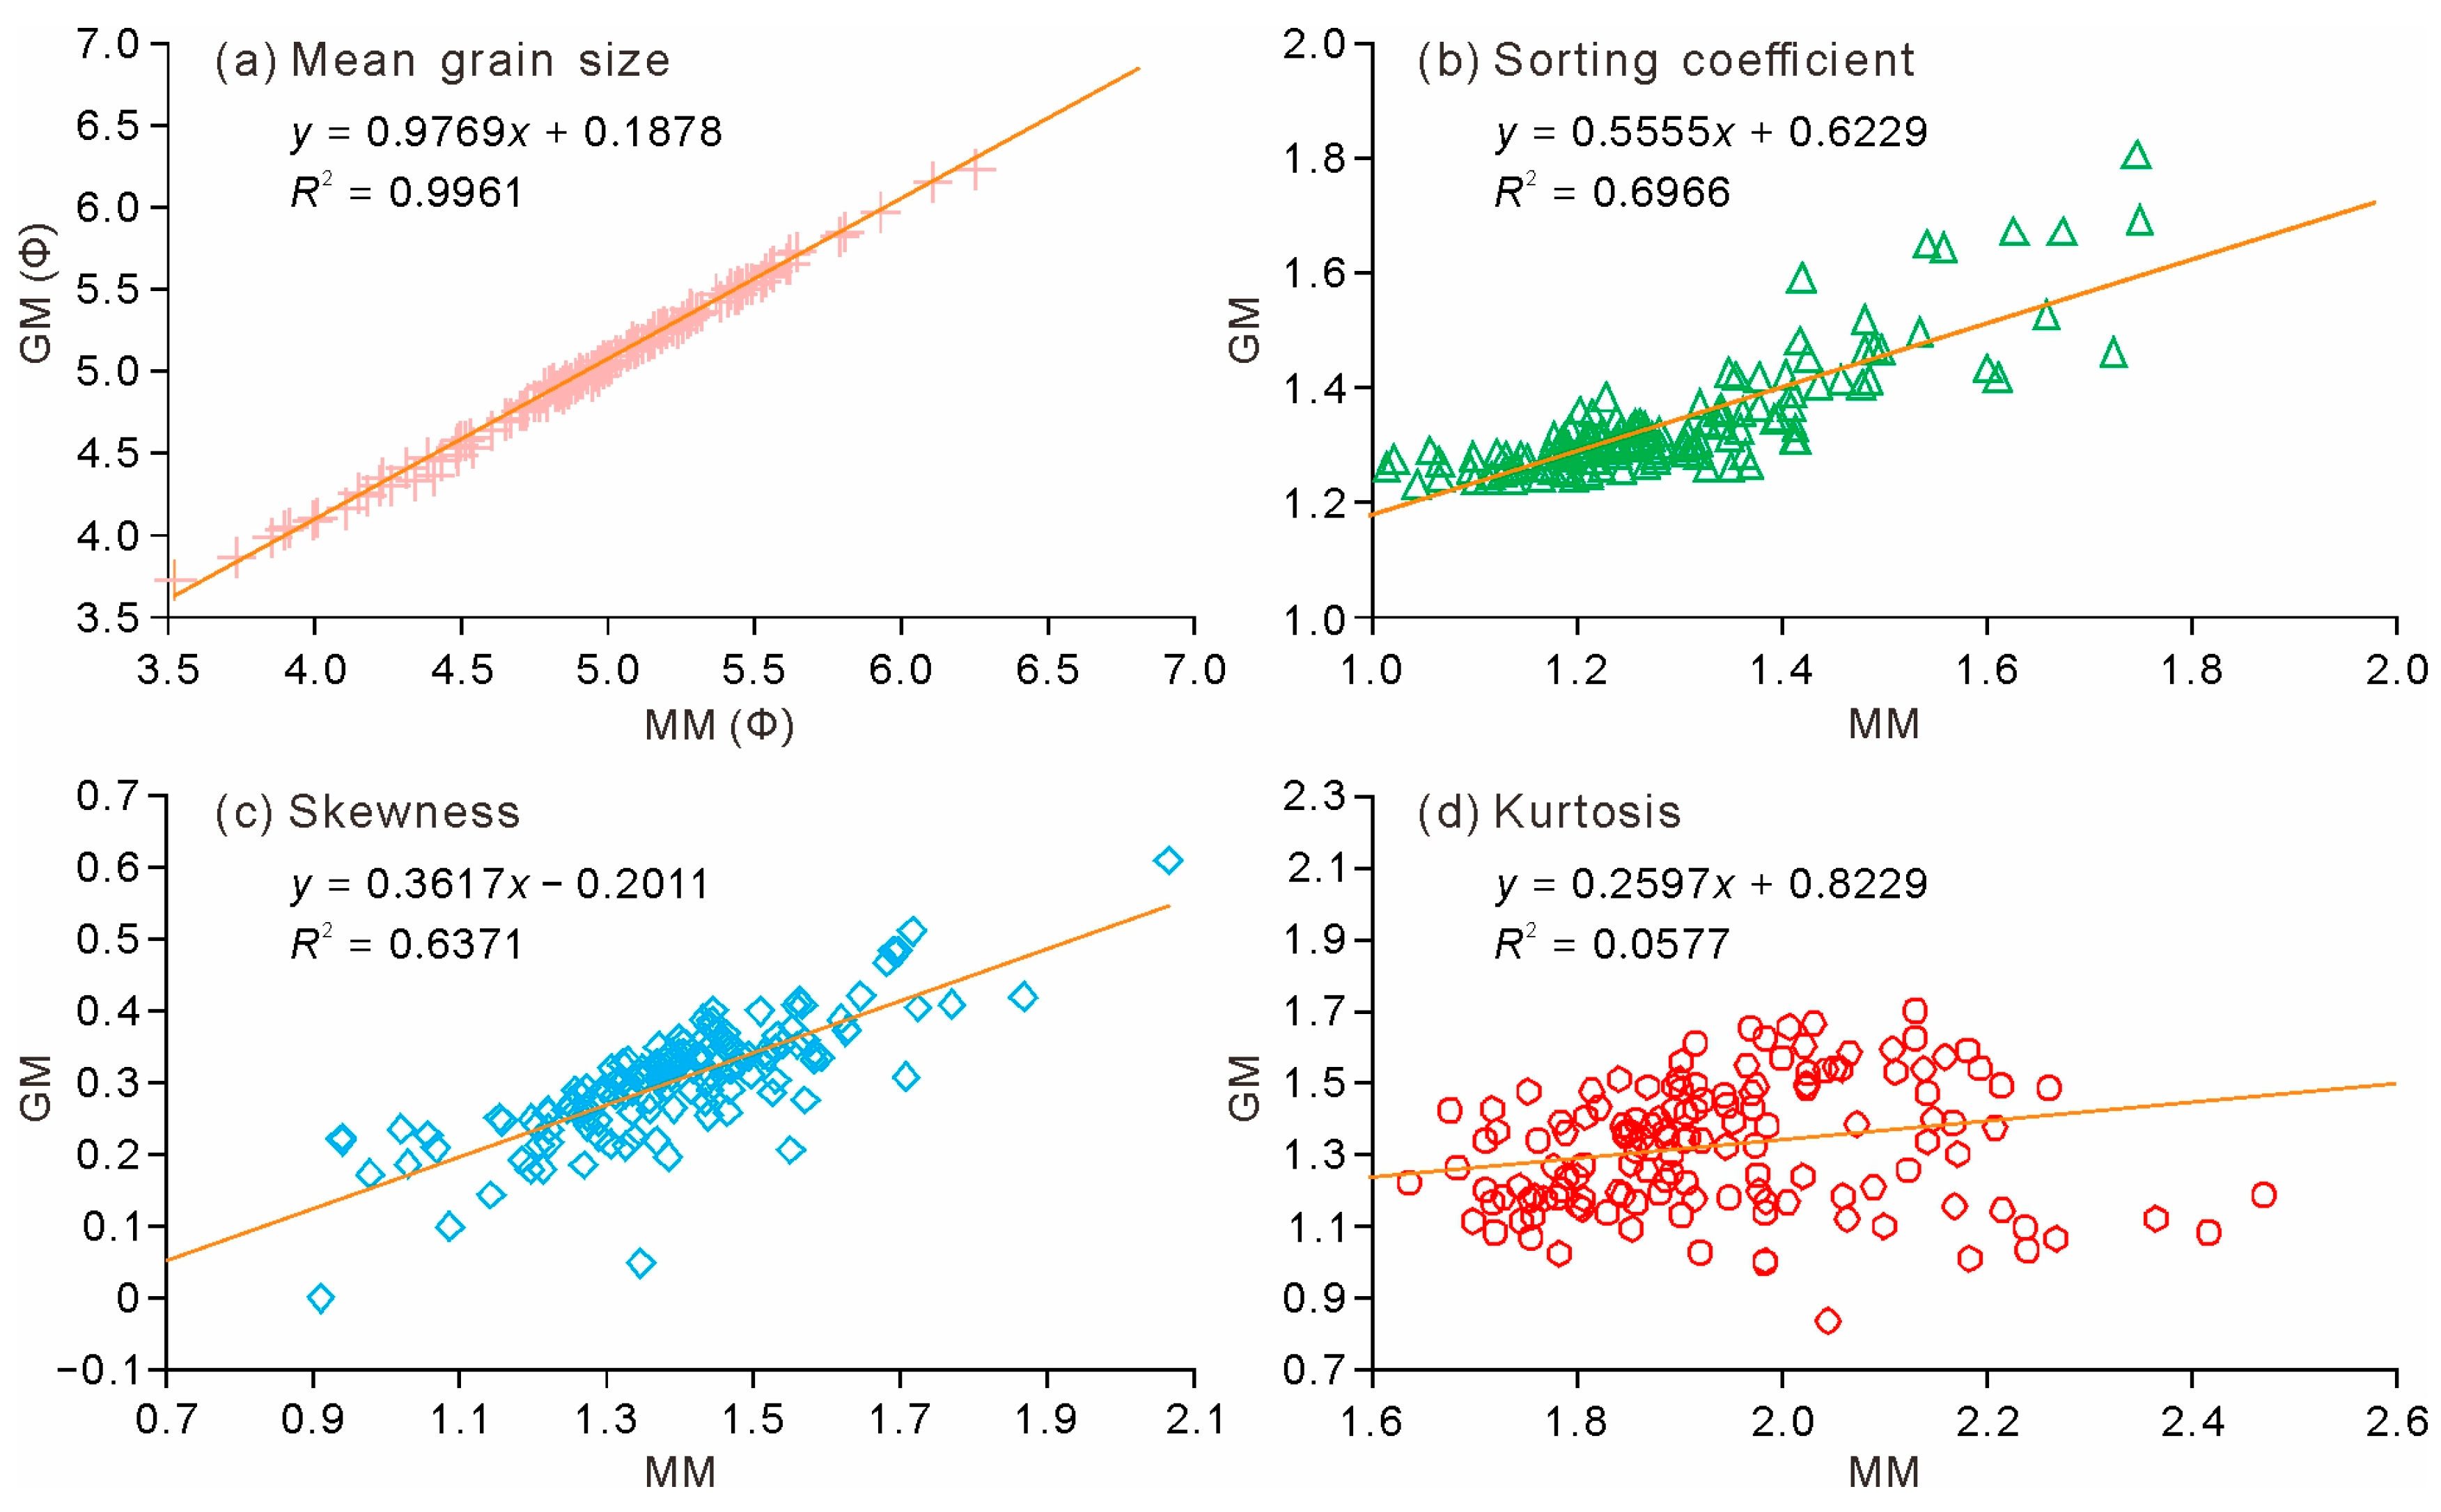
4.1. The Differences between the Results of the Graphic Method (GM) and Moment Method (MM)

Numerous studies have investigated the differences between the GM and MM, focusing on estuarine, coastal beach, and marine sediments [12,15,27,28]. However, our understanding of how to effectively reflect the grain size parameters of flood events in the lower Yellow River using the GM and MM is limited. To resolve this, we compared and analyzed 143 fresh flood sediment samples collected from six sites in the Shandong section of the lower Yellow River using the GM and MM and evaluated their applicability for analyzing flood sediments. The results indicated a remarkable correlation between the mean grain size and sorting coefficient (Figure 2 and Figure 3), whereas significant differences were observed in the skewness and kurtosis values (Figure 3).
The differences between the two methods were intrinsically linked to the calculation formulas employed [12,27]. The GM considers seven specific grain sizes (D5, D16, D25, D50, D75, D84, and D95) when computing grain size parameters [29], whereas the MM performs calculations for all grain sizes [8]. Although both methods consider grain sizes in the range of 5–95% of the cumulative probability curve, the MM not only accounts for the influences of grain sizes ranging from 5% to 95% but also for the influences of grain sizes <5% and >95% on the curve, resulting in more accurate and comprehensive characterizations of differences between sediments than the GM [15]. If a sediment grain size frequency distribution curve conforms to a standard normal distribution, a strong correlation can be observed between the results obtained using the GM and MM. However, if the distribution curve does not follow a normal distribution, the difference between the two methods increases with an increase in the number of moments. Hence, the MM is more sensitive to grain size components both below 5% and above 95% [12,27,30].
The skewness of the 143 samples was calculated using the GM and MM. The results can be classified into five categories: strongly positive vs. strongly positive, positive vs. strongly positive, nearly symmetrical vs. strongly positive, positive vs. positive, and nearly symmetrical vs. positive (the former and latter refer to the results obtained using the GM and MM, respectively, as shown in Figure 4). For most of the samples analyzed, the qualitative outcomes were consistent, achieving 79.17% agreement (Figure 3b and Figure 4a,c). However, 30 samples exhibited inconsistent results, with 28 (19.44%) showing positive outcomes using the GM and strongly positive outcomes using the MM (Figure 4b), indicating that the MM’s results were more strongly positive than those based on the GM. Similarly, one sample exhibited nearly symmetrical vs. strongly positive outcomes, and one sample exhibited nearly symmetrical vs. positive outcomes (Figure 4c,e), and the results based on the MM were more positive or more strongly positive than those obtained using the GM. In the natural distribution curves of the samples, all samples exhibited a visible tail (Figure 4), leading to the MM producing more positive or more strongly positive results, as it could comprehensively and accurately reflect the grain size information.
Similarly, the kurtosis of the 143 samples was calculated using the GM and MM. The results could be classified into seven categories: very sharp vs. moderate, very sharp vs. flat, sharp vs. flat, moderate vs. flat, flat vs. flat, sharp vs. very flat, and moderate vs. very flat (the former and latter denote the outcomes of the GM and MM, respectively, as illustrated in Figure 5). The results indicated that most of the samples analyzed (97.9%) yielded inconsistent outcomes, with the MM tending to classify the samples as moderate, flat, or very flat. On the other hand, the GM generated sharper kurtosis results than the MM and was better able to highlight the dynamic sedimentary information of flood events.

4.2. Comparison and Selection of Grain Size Information Extraction between Graphic and Moment Methods for Flood Sediments

The GM and MM use calculation equations and terminology descriptors to obtain quantitative and qualitative grain size parameters. However, the different methods had differing sensitivities to changes in the sediment particle size curves, which led to differences between the GM and MM in determining effective sediment information [3]. The mean grain size serves as an indicator of the central tendency of the grain size frequency distribution and can be utilized to reflect the strength of the hydrodynamic force, thereby holding significance in identifying flood sediments [3,14]. Previous studies reported a very strong correlation between the GM and MM when estimating mean grain sizes, and the two methods produced nearly identical outcomes [14,16,17,31,32,33]. Thus, the differences in the GM and MM calculation methods did not affect the extraction of mean grain size information. The sorting coefficient indicates the dynamic process of separating particles with similar characteristics from complex environments. Owing to the powerful hydrodynamic forces of floods, sediment sorting tends to be poor. Previous studies have reported that if the linear correlation between the GM and MM is less than one, the GM provides greater sensitivity, whereas if it exceeds one, the MM is more sensitive [14,33]. In this study, the regression equation slope of the sorting coefficient line between the GM and MM was 0.5555 (less than 1). These results indicate that the GM is more sensitive when the features of flood sediments in the lower Yellow River are highlighted using the sorting coefficient. Skewness can be used to describe the asymmetry of the grain size frequency curve and reflect dynamic changes during sedimentation [12,13,27,30]. Kurtosis is used to describe the peak of the frequency curve and reflects the main sedimentation driving force [34,35]. The MM considers both the head and tail grain sizes when assessing skewness and thus considers the overall grain size distribution curve information of flood sediments. Accordingly, we recommend using the MM to evaluate flood sediments in the lower Yellow River. Conversely, the GM emphasizes the peak position when assessing kurtosis, highlighting the primary dynamic characteristics of flood sediments during sedimentation. Therefore, it is recommended to use the GM to analyze the dynamic characteristics of flood sediments in the lower Yellow River.

4.3. Implications

The above discussion indicates that the mean grain size and sorting coefficient obtained using the GM and MM differed slightly (Figure 2 and Figure 3). Furthermore, there were significant differences in the skewness and kurtosis (Figure 4 and Figure 5). Therefore, it is necessary to consider the differences in the skewness and kurtosis when analyzing sediments with sedimentary environments similar to those of the Yellow River flood sediments. Similar sedimentary environments exist in rivers with high suspended sediment contents, such as the Ganges, Amazon, Yangtze, and Mississippi Rivers [36,37,38,39]. It is worth noting that the MM tends to highlight the overall grain size distribution curve using the skewness parameter, whereas the GM can highlight the primary dynamic characteristics using the kurtosis parameter.
River terraces are important carriers for long-term paleoenvironmental studies worldwide. Sedimentary strata usually undergo complex sedimentary dynamic processes, including flood deposition, residual/slope deposition, and eolian deposition. The formation of different layers in the sedimentary strata represents a change in sedimentary dynamics. Thus, the differences in the skewness and kurtosis parameters obtained using the GM and MM can be used to identify different sediments with different dynamics in the strata. Therefore, future studies should consider the following: (1) analyzing the relationship between the grain size parameters of the GM and MM in different sediment layers of river terraces and (2) constructing the typical grain size parameter characteristics of different sediment layers based on the GM and MM.

5. Conclusions

A grain size analysis was conducted using 143 modern flood sediment samples from six sections of the lower Yellow River in Jinan City, Shandong Province, and calculations of grain size parameters using the GM and MM were compared. The primary conclusions drawn from this study are as follows:
  • The modern flood sediments observed in the lower Yellow River primarily consisted of fine particles with a mean grain size of 3.52–6.26 Φ (as computed by the MM), denoting silty sand, and sorting coefficients that ranged from 1.22 to 1.81, indicating poor sorting. The skewness values ranged from 0.91 to 2.07, with an average of 1.39, indicating extremely positive skewness. Meanwhile, the kurtosis values varied from 0.84 to 2.06, with an average of 1.33, suggesting sharp peaks.
  • The mean grain sizes calculated using both the GM and MM exhibited a strong correlation; therefore, both methods can be used to distinguish the grain size characteristics of flood sediment in the lower Yellow River. Furthermore, the sorting coefficient between the two methods was strongly correlated, reinforcing their consistency when providing qualitative sample descriptions.
  • The skewness and kurtosis parameters computed using the GM and MM exhibited moderate correlations and no correlations, respectively. Considering this, from a theoretical standpoint, it is recommended to utilize the MM to analyze the skewness of flood sediments in the lower Yellow River, as it would more accurately reflect the overall sediment grain size information. Moreover, the GM should be employed to analyze the kurtosis parameters, as this method emphasizes the principal dynamic characteristics of flood sediment deposition. The above understanding also has important reference significance for the grain size analysis of fine-grained flood sediments in other rivers of the world.

Author Contributions

Conceptualization, L.T.; methodology, H.W.; software, W.Z.; validation, S.Z. and W.Z.; formal analysis, L.T., S.Z. and W.Z.; investigation, L.T. and S.Z.; resources, H.W.; data curation, S.Z.; writing—original draft preparation, L.T.; writing—review and editing, L.T., S.Z., H.W. and W.Z; visualization, L.T. and W.Z.; supervision, H.W.; project administration, L.T. and S.Z.; funding acquisition, L.T. and S.Z. All authors have read and agreed to the published version of the manuscript.

Funding

This research was funded by the Science and Technology Program of Guizhou Province (Basic Research on Guizhou Science and Technology-ZK [2022] General 333), the Natural Science Foundation of Shandong Province (Grant No. ZR2020QD083), the Shandong Normal University Undergraduate Fund (BKJJ2022079), and the Doctoral Fund of Guizhou Education University (Grant No. X2021007).

Institutional Review Board Statement

Not applicable.

Informed Consent Statement

Not applicable.

Data Availability Statement

The data that support the findings of this study are available on request from the corresponding author (W.Z.).

Acknowledgments

We are grateful to Sun, X., Zhang, N. and Li, G. for their help with the field sampling. We also thank Wu, X. (The University of Hull, UK) for English language editing. Two anonymous reviewers are thanked for their critical comments on the original manuscript.

Conflicts of Interest

The authors declare no conflict of interest.

References

  1. Folk, R.L.; Ward, W.C. Brazos river bar: A study in the significance of grain size parameters. J. Sediment. Res. 1957, 27, 3–26. [Google Scholar] [CrossRef]
  2. Hartmann, D.; Flemming, B. From particle size to sediment dynamics: An introduction. Sediment. Geol. 2007, 202, 333–336. [Google Scholar] [CrossRef]
  3. Folk, R.L. A review of grain size parameters. Sedimentology 1966, 6, 73–97. [Google Scholar] [CrossRef]
  4. Pye, K. Aeolian Dust and Dust Deposits; Academic Press: Cambridge, MA, USA, 1987; p. 68. [Google Scholar]
  5. Prins, M.A.; Postma, G.; Weltje, G.J. Controls on terrigenous sediment supply to the arabian sea during the late quaternary: The makran continental slope. Mar. Geol. 2000, 169, 351–371. [Google Scholar] [CrossRef]
  6. Chen, F.; Feng, Z.; Zhang, J. Loess particle size data indicative of stable winter monsoons during the last interglacial in the western part of the chinese loess plateau. Catena 2000, 39, 233–244. [Google Scholar] [CrossRef]
  7. Michael, N.A.; Zühlke, R. Source-to-sink: Regional grain size trends to reconstruct sediment budgets and catchment areas. Basin Res. 2022, 34, 393–410. [Google Scholar] [CrossRef]
  8. Friedman, G.M.; Sanders, J.E. Principles of Sedimentolog; Wiley: New York, NY, USA, 1978; pp. 78–80. [Google Scholar]
  9. McManus, J. Grain size determination and interpretation. In Techniques in Sedimentology; Blackwell: Oxford, UK, 1988; pp. 63–85. [Google Scholar]
  10. Blott, S.J.; Pye, K. GRADISTAT: A grain size distribution and statistics package for the analysis of unconsolidated sediments. Earth Surf. Process. Landf. 2001, 26, 1237–1248. [Google Scholar] [CrossRef]
  11. Chen, Q.; Tang, W.; Xue, C.; Yang, Y.; Gao, W.; Yang, J.; Jia, J. The Φ Value Expresses Granularity and the Unit Problem of the Sorting Coefficient. Acta Sedimentol. Sin. 2023. (In Chinese) [Google Scholar] [CrossRef]
  12. Jia, J.; Gao, S.; Xue, Y. Grain-size parameters derived from graphic and moment methods: A comparative study. Oceanol. Et Limnol. Sin. 2002, 33, 577–582. (In Chinese) [Google Scholar]
  13. Wang, Z.; Yu, D.; Luo, F.; Yang, H. Comparison of grain size parameters from graphical and moment methods for surface sediments in Quanzhou Bay. Mar. Geol. Front. 2016, 32, 19–27. (In Chinese) [Google Scholar]
  14. Li, G.; Du, R.; Tang, J.; Li, Z.; Xia, Q.; Shi, B.; Zhou, L.; Yang, Y.; Zhang, W. Comparison of the graphic and moment methods for analyzing grain-size distributions: A case study for the Chinese inner continental shelf seas. Int. J. Sediment Res. 2022, 37, 729–736. [Google Scholar] [CrossRef]
  15. Li, G.; Liang, R.; Tong, C.; Wang, H.; Xia, Q.; Li, Z.; Tang, J. Qualitative comparative analysis on grain-size parameters of derived from graphic and moment methods: A case study of the surficial sediment of coastal beaches of Qiongzhou Strait. Haiyang Xuebao 2023, 45, 98–109. (In Chinese) [Google Scholar]
  16. Cai, G.; Fan, D.; Shang, S.; Wu, Y.; Shao, L. Difference in grain-size parameters of tidal deposits derived form the graphic and its potential causes. Mar. Geol. Quat. Geol. 2014, 34, 195–204. (In Chinese) [Google Scholar]
  17. Dai, J.; Zhang, P. Comparison and its significance of grain-size parameters of several of sediments with graphic method and moment method. J. Geol. 2017, 41, 239–244. (In Chinese) [Google Scholar]
  18. Rea, D.K.; Janecek, T.R. Late cenozoic changes in atmospheric circulation deduced from north pacific eolian sediments. Mar. Geol. 1982, 49, 149–167. [Google Scholar] [CrossRef] [Green Version]
  19. Yang, Y.; Gao, S.; Zhou, L.; Wang, Y.W.; Li, G.C.; Wang, Y.P.; Han, Z.C.; Jia, P.H. Classifying the sedimentary environments of the Xincun Lagoon, Hainan Island, by system cluster and principal component analyses. Acta Oceanol. Sin. 2017, 36, 64–71. [Google Scholar] [CrossRef]
  20. Zhou, L.; Gao, S.; Yang, Y.; Zhao, Y.; Han, Z.; Li, G.; Jia, P.; Yin, Y. Typhoon events recorded in coastal lagoon deposits, southeastern Hainan Island. Acta Oceanol. Sin. 2017, 36, 37–45. [Google Scholar] [CrossRef]
  21. Yuan, P.; Wang, H.J.; Wu, X.; Bi, N.S. Grain-size distribution of surface sediments in the Bohai sea and the northern yellow sea: Sediment supply and hydrodynamics. J. Ocean Univ. China 2020, 19, 589–600. [Google Scholar] [CrossRef]
  22. Sun, Q.; Zhou, J.; Xiao, J. Grain-size characteristics of lake Daihai sediments and its paleaoenvironment significance. Mar. Geol. Quat. Geol. 2001, 21, 93–95. (In Chinese) [Google Scholar]
  23. Yellow River Conservancy Commission of the Ministry of Water Resources. Yellow River Sediment Bulletin. 2021. Available online: http://www.yrcc.gov.cn/ (accessed on 22 May 2023).
  24. Ministry of Water Resources of the People’s Republic of China. Chinese River Sediment Bulletin (Yangze River, Yellow River, 2000). Available online: http://www.mwr.gov.cn/sj/tjgb/zghlnsgb/201612/t20161222_776055.html (accessed on 22 May 2023).
  25. Fan, Y.; Yu, S.; Wang, J.; Li, P.; Chen, S.; Ji, H.; Li, P.; Dou, S. Changes of Inundation Frequency in the Yellow River Delta and Its Response to Wetland Vegetation. Land 2022, 11, 1647. [Google Scholar] [CrossRef]
  26. Baker, V.R. Palaeoflood hydrology in a global context. Catena 2006, 66, 161–168. [Google Scholar] [CrossRef]
  27. Swan, D.; Clague, J.J.; Luternauer, J.L. Grain-size statistics II: Evaluation of grouped moment measures. J. Sediment. Petrol. 1979, 49, 487–500. [Google Scholar]
  28. Zhao, Z. Comparison of calculating methods for grain-size distribution parameters of sediments in South Yellow Sea. Mar. Geol. Quat. Geol. 1992, 12, 95–107. (In Chinese) [Google Scholar]
  29. Chiverrell, R.C.; Sear, D.A.; Warburton, J.; Macdonald, N.; Bradley, J. Using lake sediment archives to improve understanding of flood magnitude and frequency: Recent extreme flooding in northwest UK. Earth Surf. Process. Landf. 2019, 44, 2366–2376. [Google Scholar] [CrossRef] [Green Version]
  30. Liu, Z.; Long, H. Comparing study on the grain-size parameters estimated from the graphical method and the moment method of the sediments from South China Sea. Period. Ocean Univ. China 2009, 39, 313–316+336. (In Chinese) [Google Scholar]
  31. Liu, Z.J.; Gong, Y.F.; Zhou, S.W.; Yu, J.; Liu, Y.G.; Yin, R.G.; Cheng, Y.S. A comparative study on the grain-size parameters of marine sediments derived from three different computing methods. Acta Oceanol. Sin. 2013, 35, 179–188. (In Chinese) [Google Scholar]
  32. Xu, X.Y.; Yi, L.; Yu, H.J.; Li, N.S.; Shi, X.F. The differences of grain-size parameters estimated with graphic and moment methods in coastal sediments. Acta Oceanol. Sin. 2010, 32, 80–86. (In Chinese) [Google Scholar]
  33. Li, G.; Li, Z.; Zhu, S.; Zhang, H.; Zeng, C. Comparative Study on Grain-size Parameters of Marine Sediment Derived from Graphic and Moment Methods. J. Guangdong Ocean Univ. 2020, 40, 96–101. (In Chinese) [Google Scholar]
  34. Yang, D.; Ge, Y.; Xie, Y.; Zhan, D.; Li, Z. Sedimentary records of large Holocene floods from the middle reaches of the Yellow River, China. Geomorphology 2000, 33, 73–88. [Google Scholar] [CrossRef]
  35. Huang, C.C.; Pang, J.; Zha, X.; Zhou, H. Holocene Palaeoflood Events recorded by slackwater deposits along the Lower Jinghe River Valley, Middle Yellow River Basin, China. J. Quat. Sci. 2012, 27, 485–493. [Google Scholar] [CrossRef]
  36. Meade, R.H.; Dunne, T.; Richey, J.E.; Santos, U.D.M.; Salati, E. Storage and Remobilization of Suspended Sediment in the Lower Amazon River of Brazil. Science 1985, 228, 488–490. [Google Scholar] [CrossRef] [Green Version]
  37. Heimann, D.C.; Sprague, L.A.; Blevins, D.W. Trends in suspended-sediment loads and concentrations in the Mississippi River Basin, 1950–2009. In Scientific Investigations Report; USGS: Reston, VA, USA, 2011. [Google Scholar]
  38. Yang, Y.; Li, Y.; Sun, Z.; Fan, Y. Trends and causes of suspended sediment concentration variation in the turbidity maximum zone at the Yangtze River Estuary. Acta Geogr. Sin. 2013, 68, 1240–1250. (In Chinese) [Google Scholar]
  39. Darby, S.E.; Dunn, F.E.; Nicholls, R.J.; Rahman, M.; Riddy, L. A first look at the influence of anthropogenic climate change on the future delivery of fluvial sediment to the Ganges-Brahmaputra-Meghna delta. Environ. Sci. Process. Impacts 2015, 17, 1587–1600. [Google Scholar] [CrossRef] [Green Version]
Figure 1. Map of the Yellow River: (a) location of the study area and (b) the locations of the six sampling sites, indicated by white rectangles (YZ, Yanzhuang site; WD, Wudu site; XC, Xicang site; YFHK, Yufuhekou site; XBJ, Xibeijie site; MQH, Muqinhe park site).
Applsci 13 08934 g001
Figure 2. Numerical values and regression equations for the grain size parameters calculated using the graphic method (GM) and moment method (MM).
Applsci 13 08934 g002
Figure 3. Comparison of the physically descriptive terms obtained using the graphic method (GM) and moment method (MM). (ac) Relationships of the sorting coefficient, skewness, and kurtosis between the GM and MM (The yellow rectangles are result agreement area, and others are inconsistent).
Applsci 13 08934 g003
Figure 4. Grain size distribution curves of the different skewness descriptive terms (GM results vs. MM results. Different color curves indicate grain size distribution curves for different samples. (a,d) indicate consistent by GM and MM, but (b,c,e) exist discrepancy).
Applsci 13 08934 g004
Figure 5. Grain size distribution curves of the different kurtosis descriptive terms (GM results vs. MM results. (e) indicate consistent results using GM and MM, whereas (ad,f,g) are inconsistent).
Applsci 13 08934 g005
Table 1. Characteristic grain size parameter values obtained via the graphic method (GM) and moment method (MM).
Grain Size ParametersCalculation MethodMin.Max.AverageStandard Deviation
Mean grain sizeGM3.746.255.030.45
MM3.526.264.950.46
Sorting coefficientGM1.221.811.340.10
MM0.921.751.280.15
SkewnessGM00.610.300.08
MM0.912.071.390.18
KurtosisGM0.842.061.330.19
MM1.582.611.950.17
Disclaimer/Publisher’s Note: The statements, opinions and data contained in all publications are solely those of the individual author(s) and contributor(s) and not of MDPI and/or the editor(s). MDPI and/or the editor(s) disclaim responsibility for any injury to people or property resulting from any ideas, methods, instructions or products referred to in the content.

