
Quantifying of the Best Model for Prediction of Greenhouse Gas Emission, Quality, and Thermal Property Values during Drying Using RSM (Case Study: Carrot)


Abstract
1. Introduction
2. Materials and Methods
2.1. Carrot Sample
2.2. Ultrasonication and Blanching Pretreatments
2.3. Microwave Dryer
2.4. Effective Moisture Diffusivity
2.5. Specific Energy Consumption
2.6. Greenhouse Gas Emission
2.7. Color
2.8. Shrinkage
2.9. RSM
3. Results and Discussion
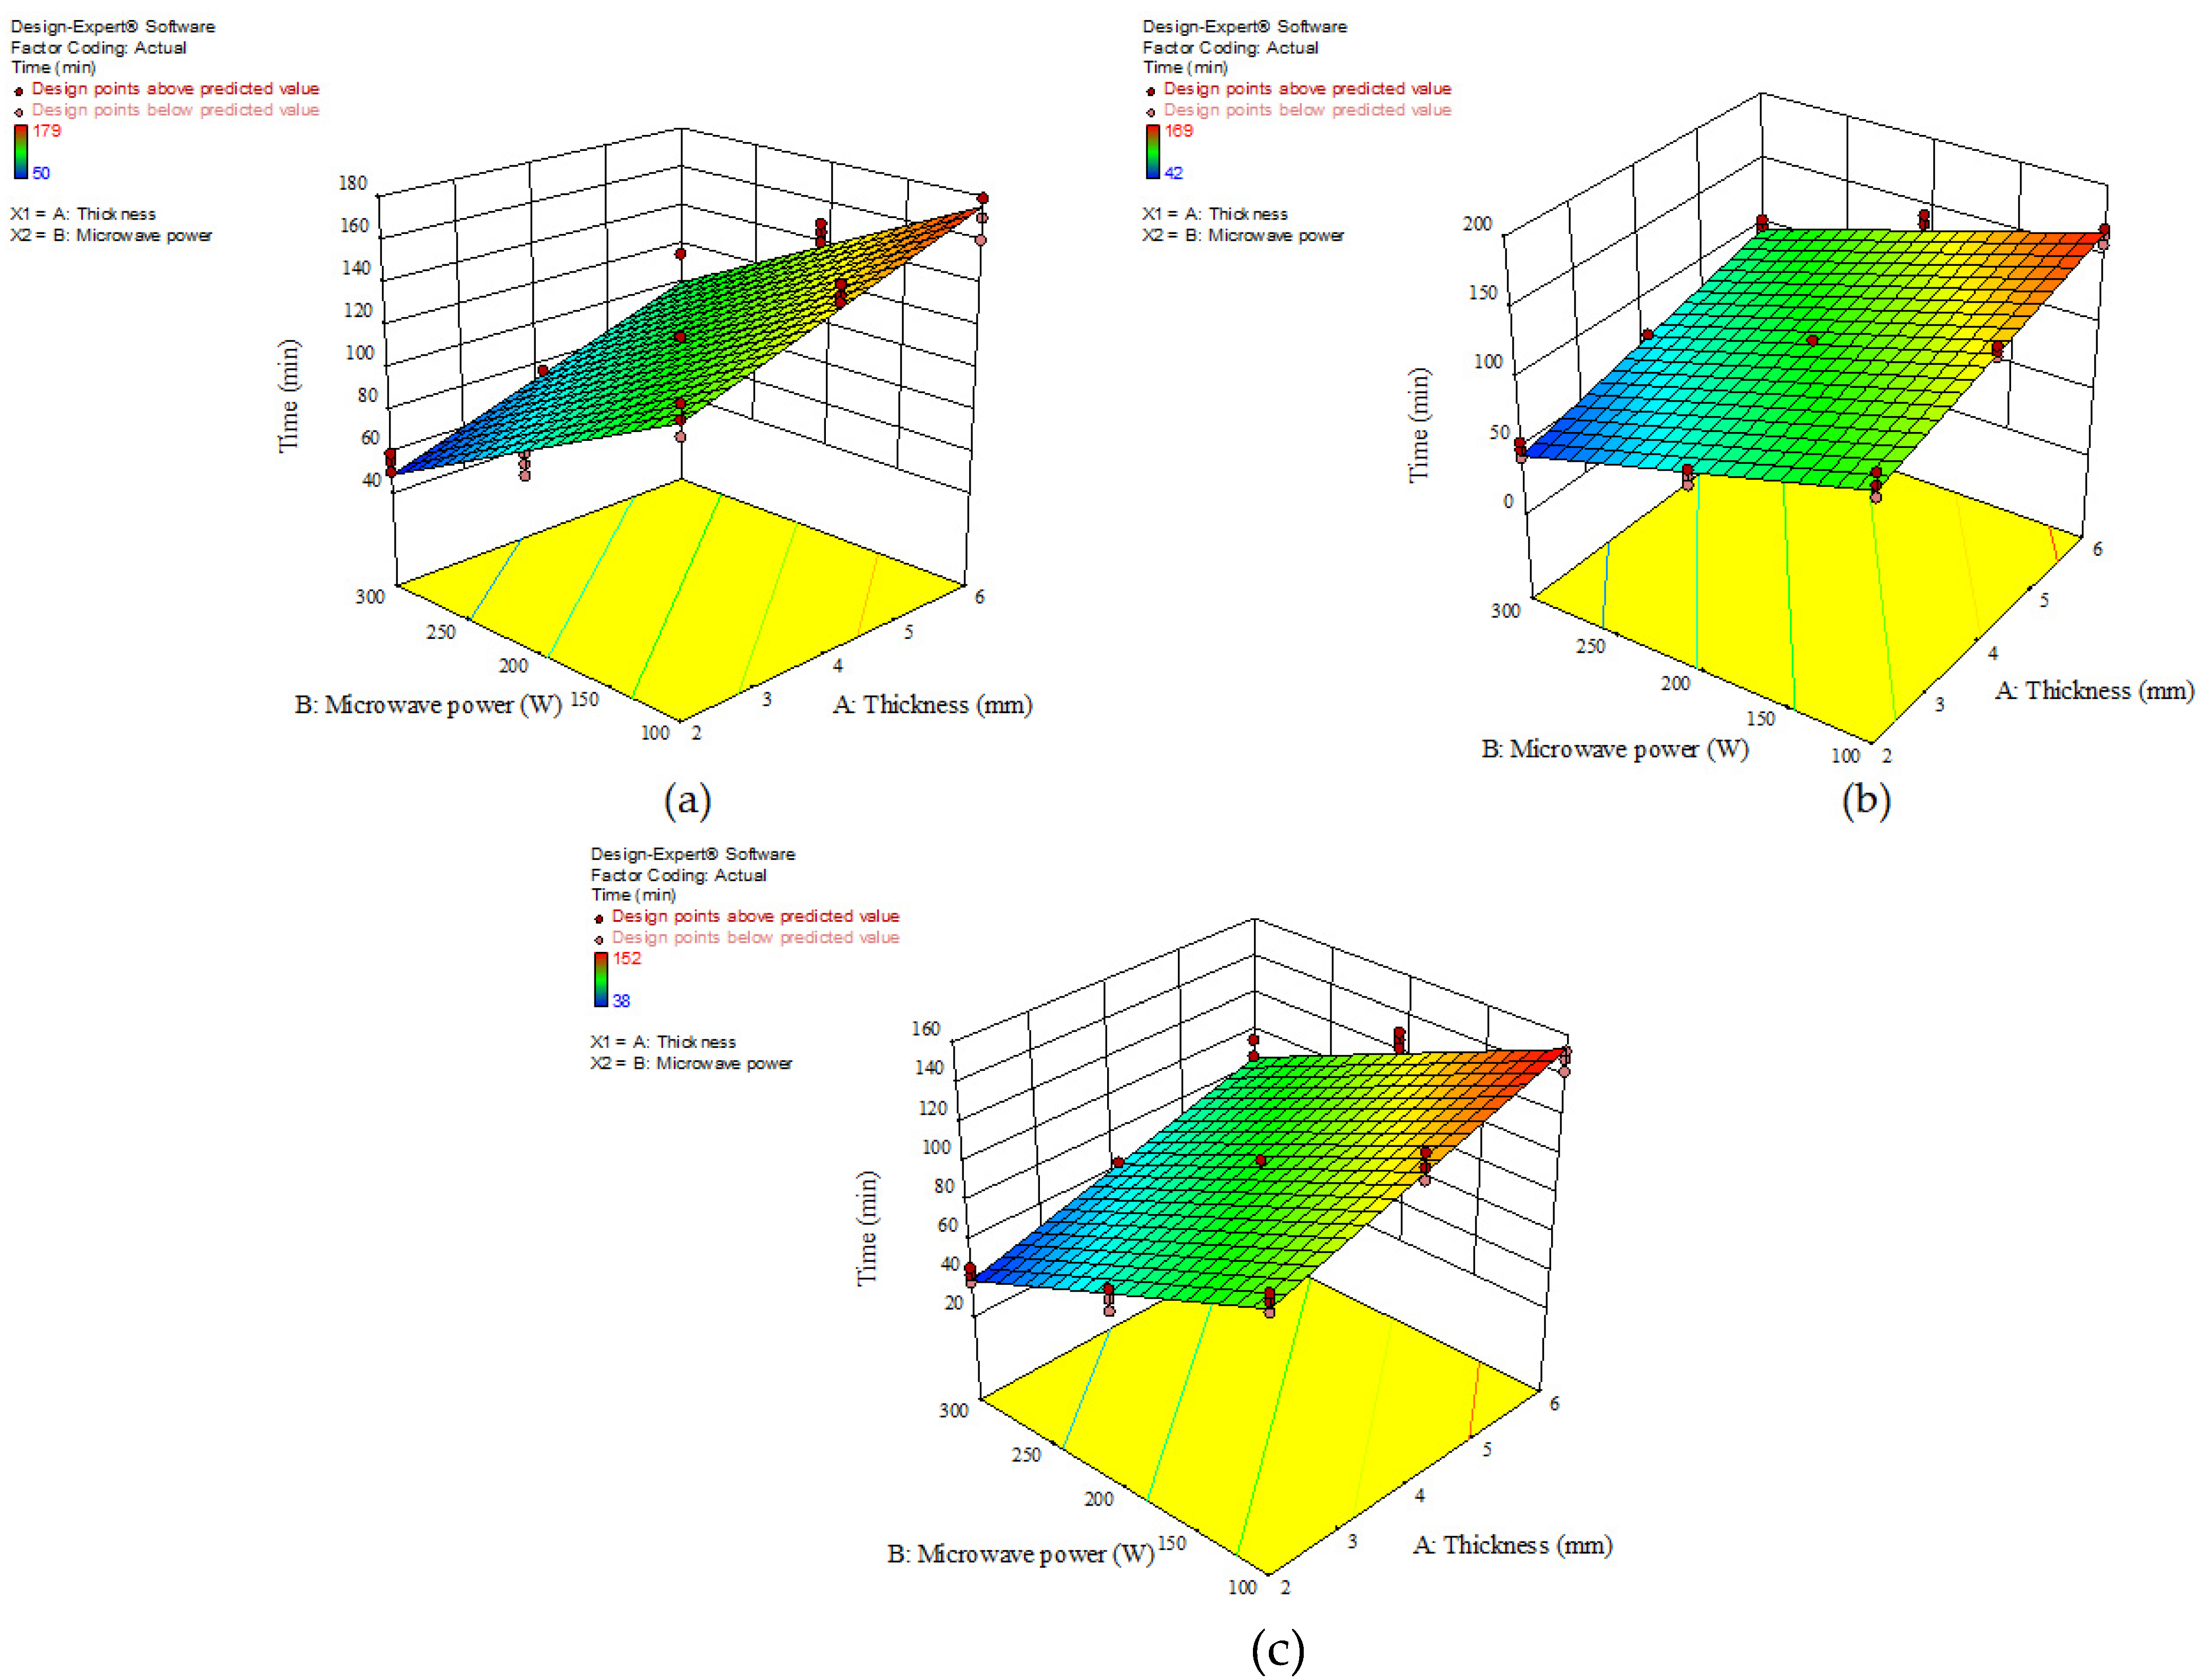
3.1. Drying Time (Dt)
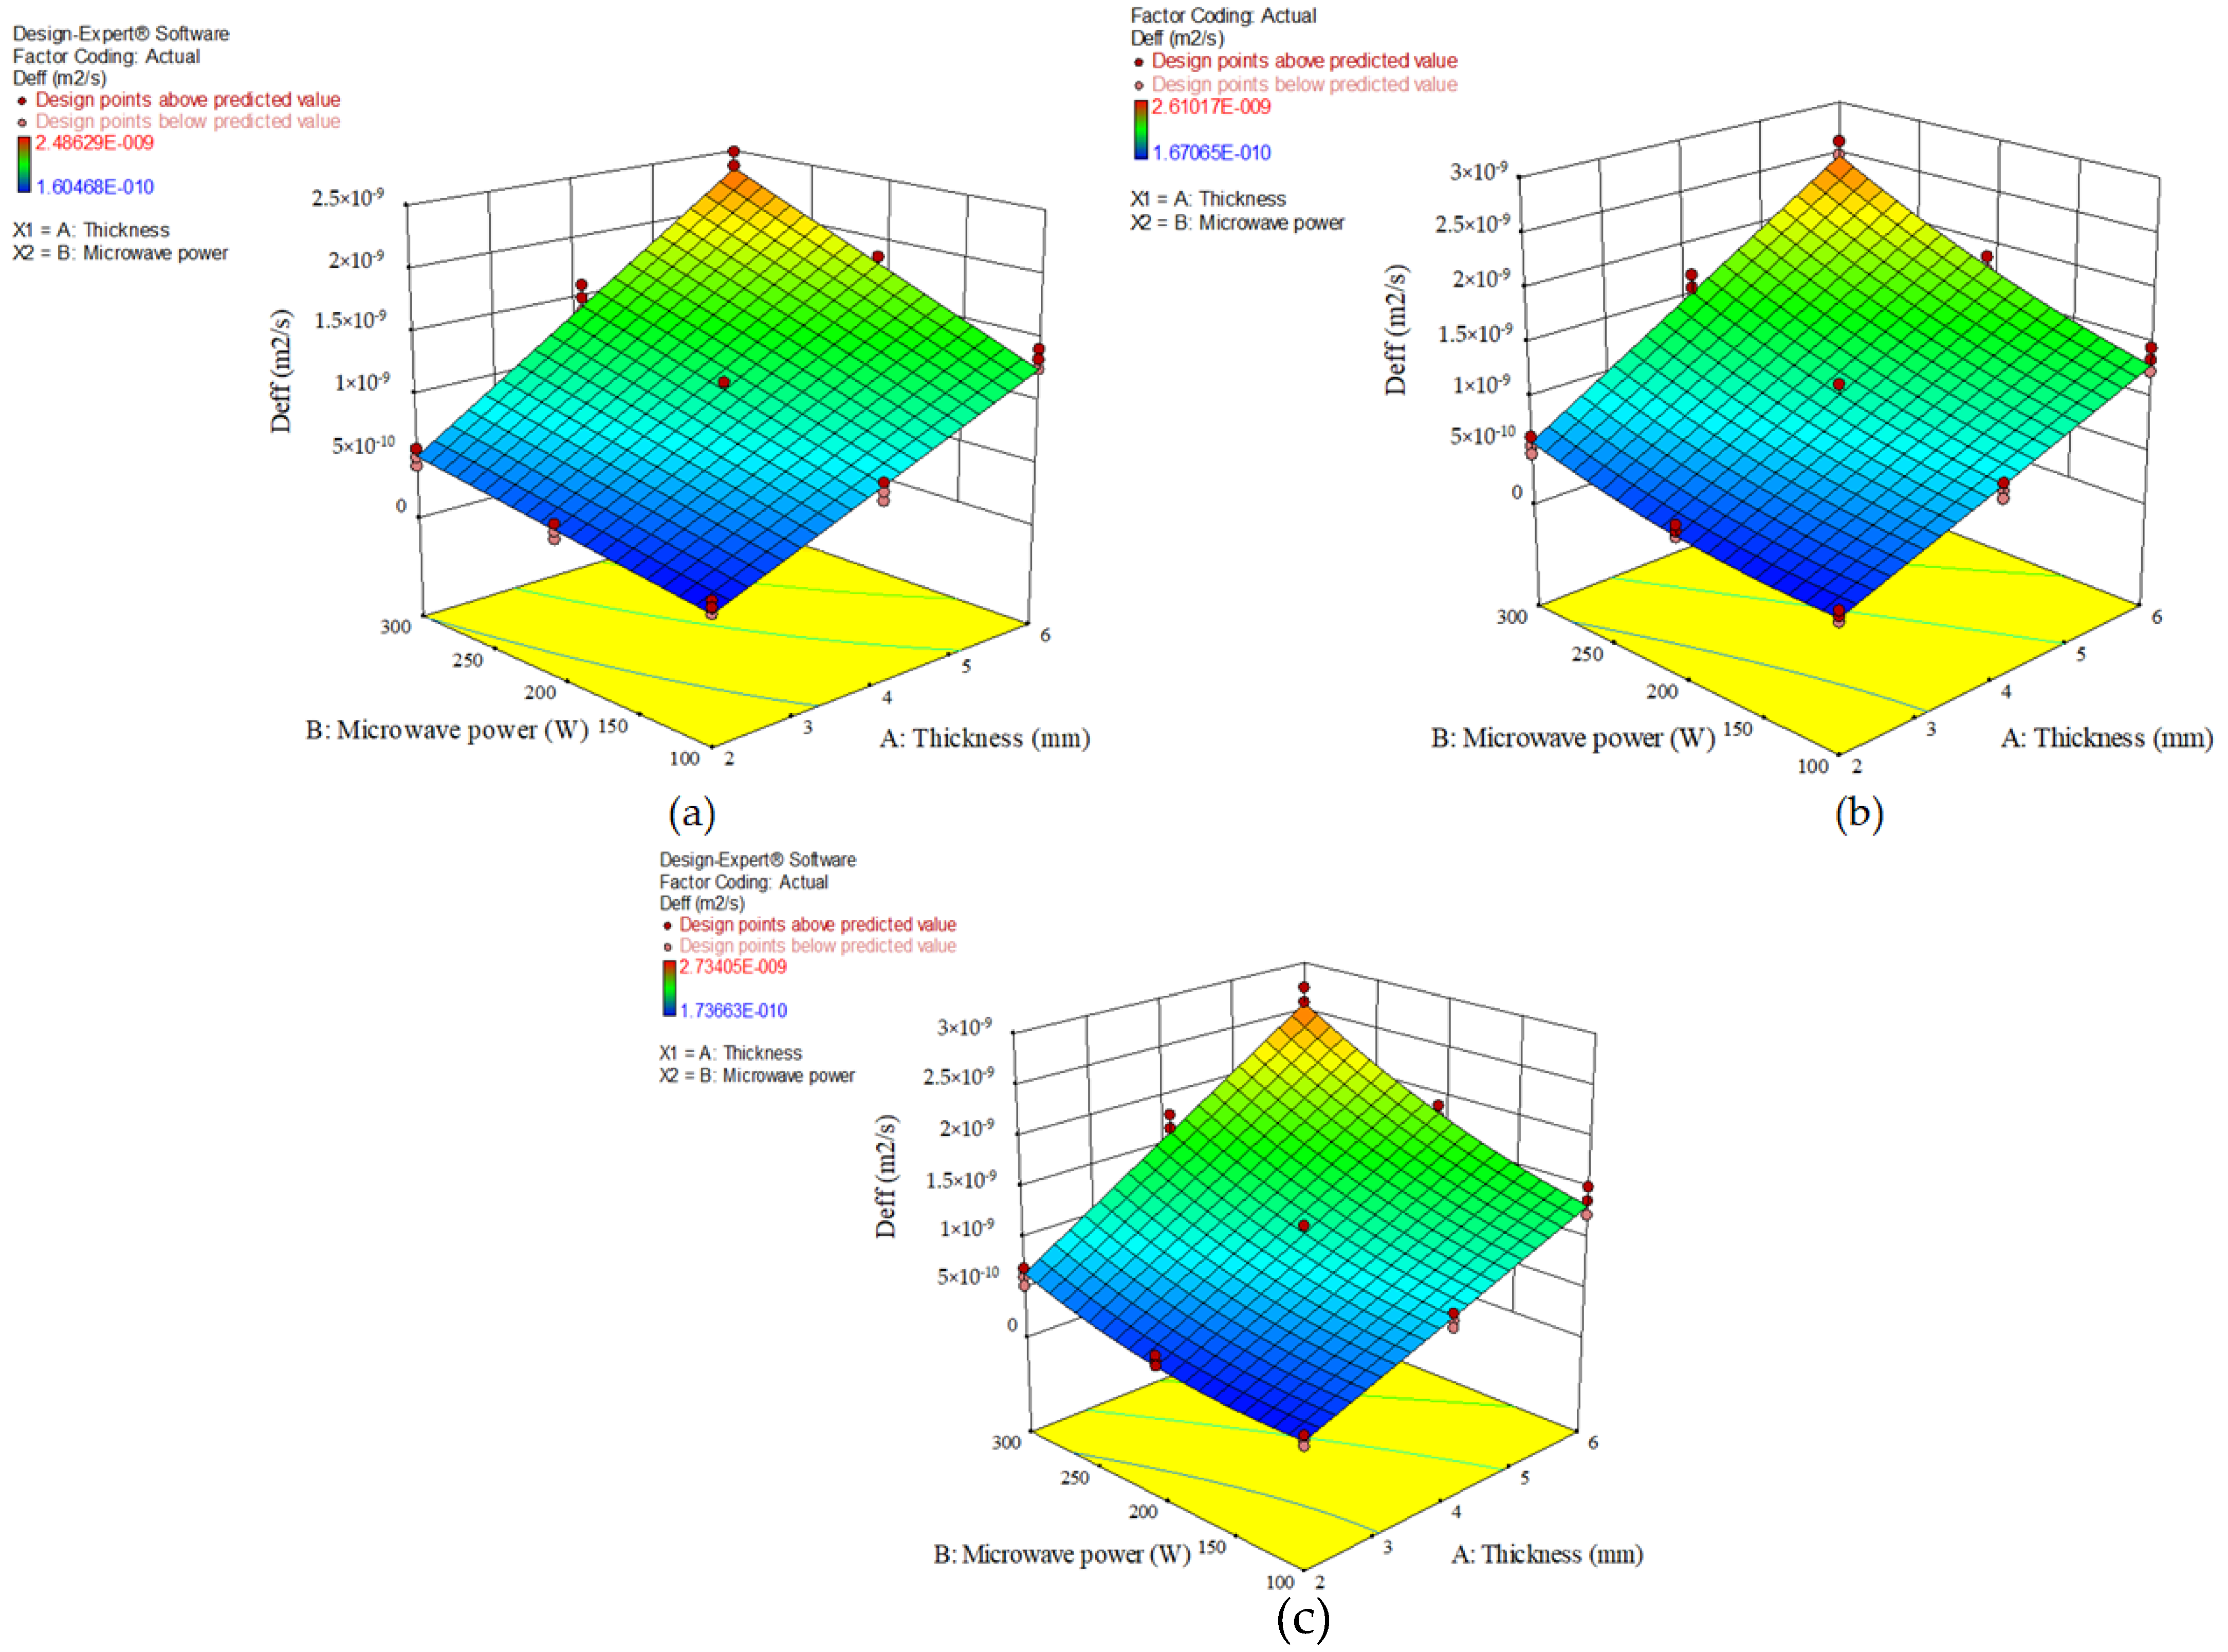
3.2. Effective Moisture Diffusivity
3.3. SEC
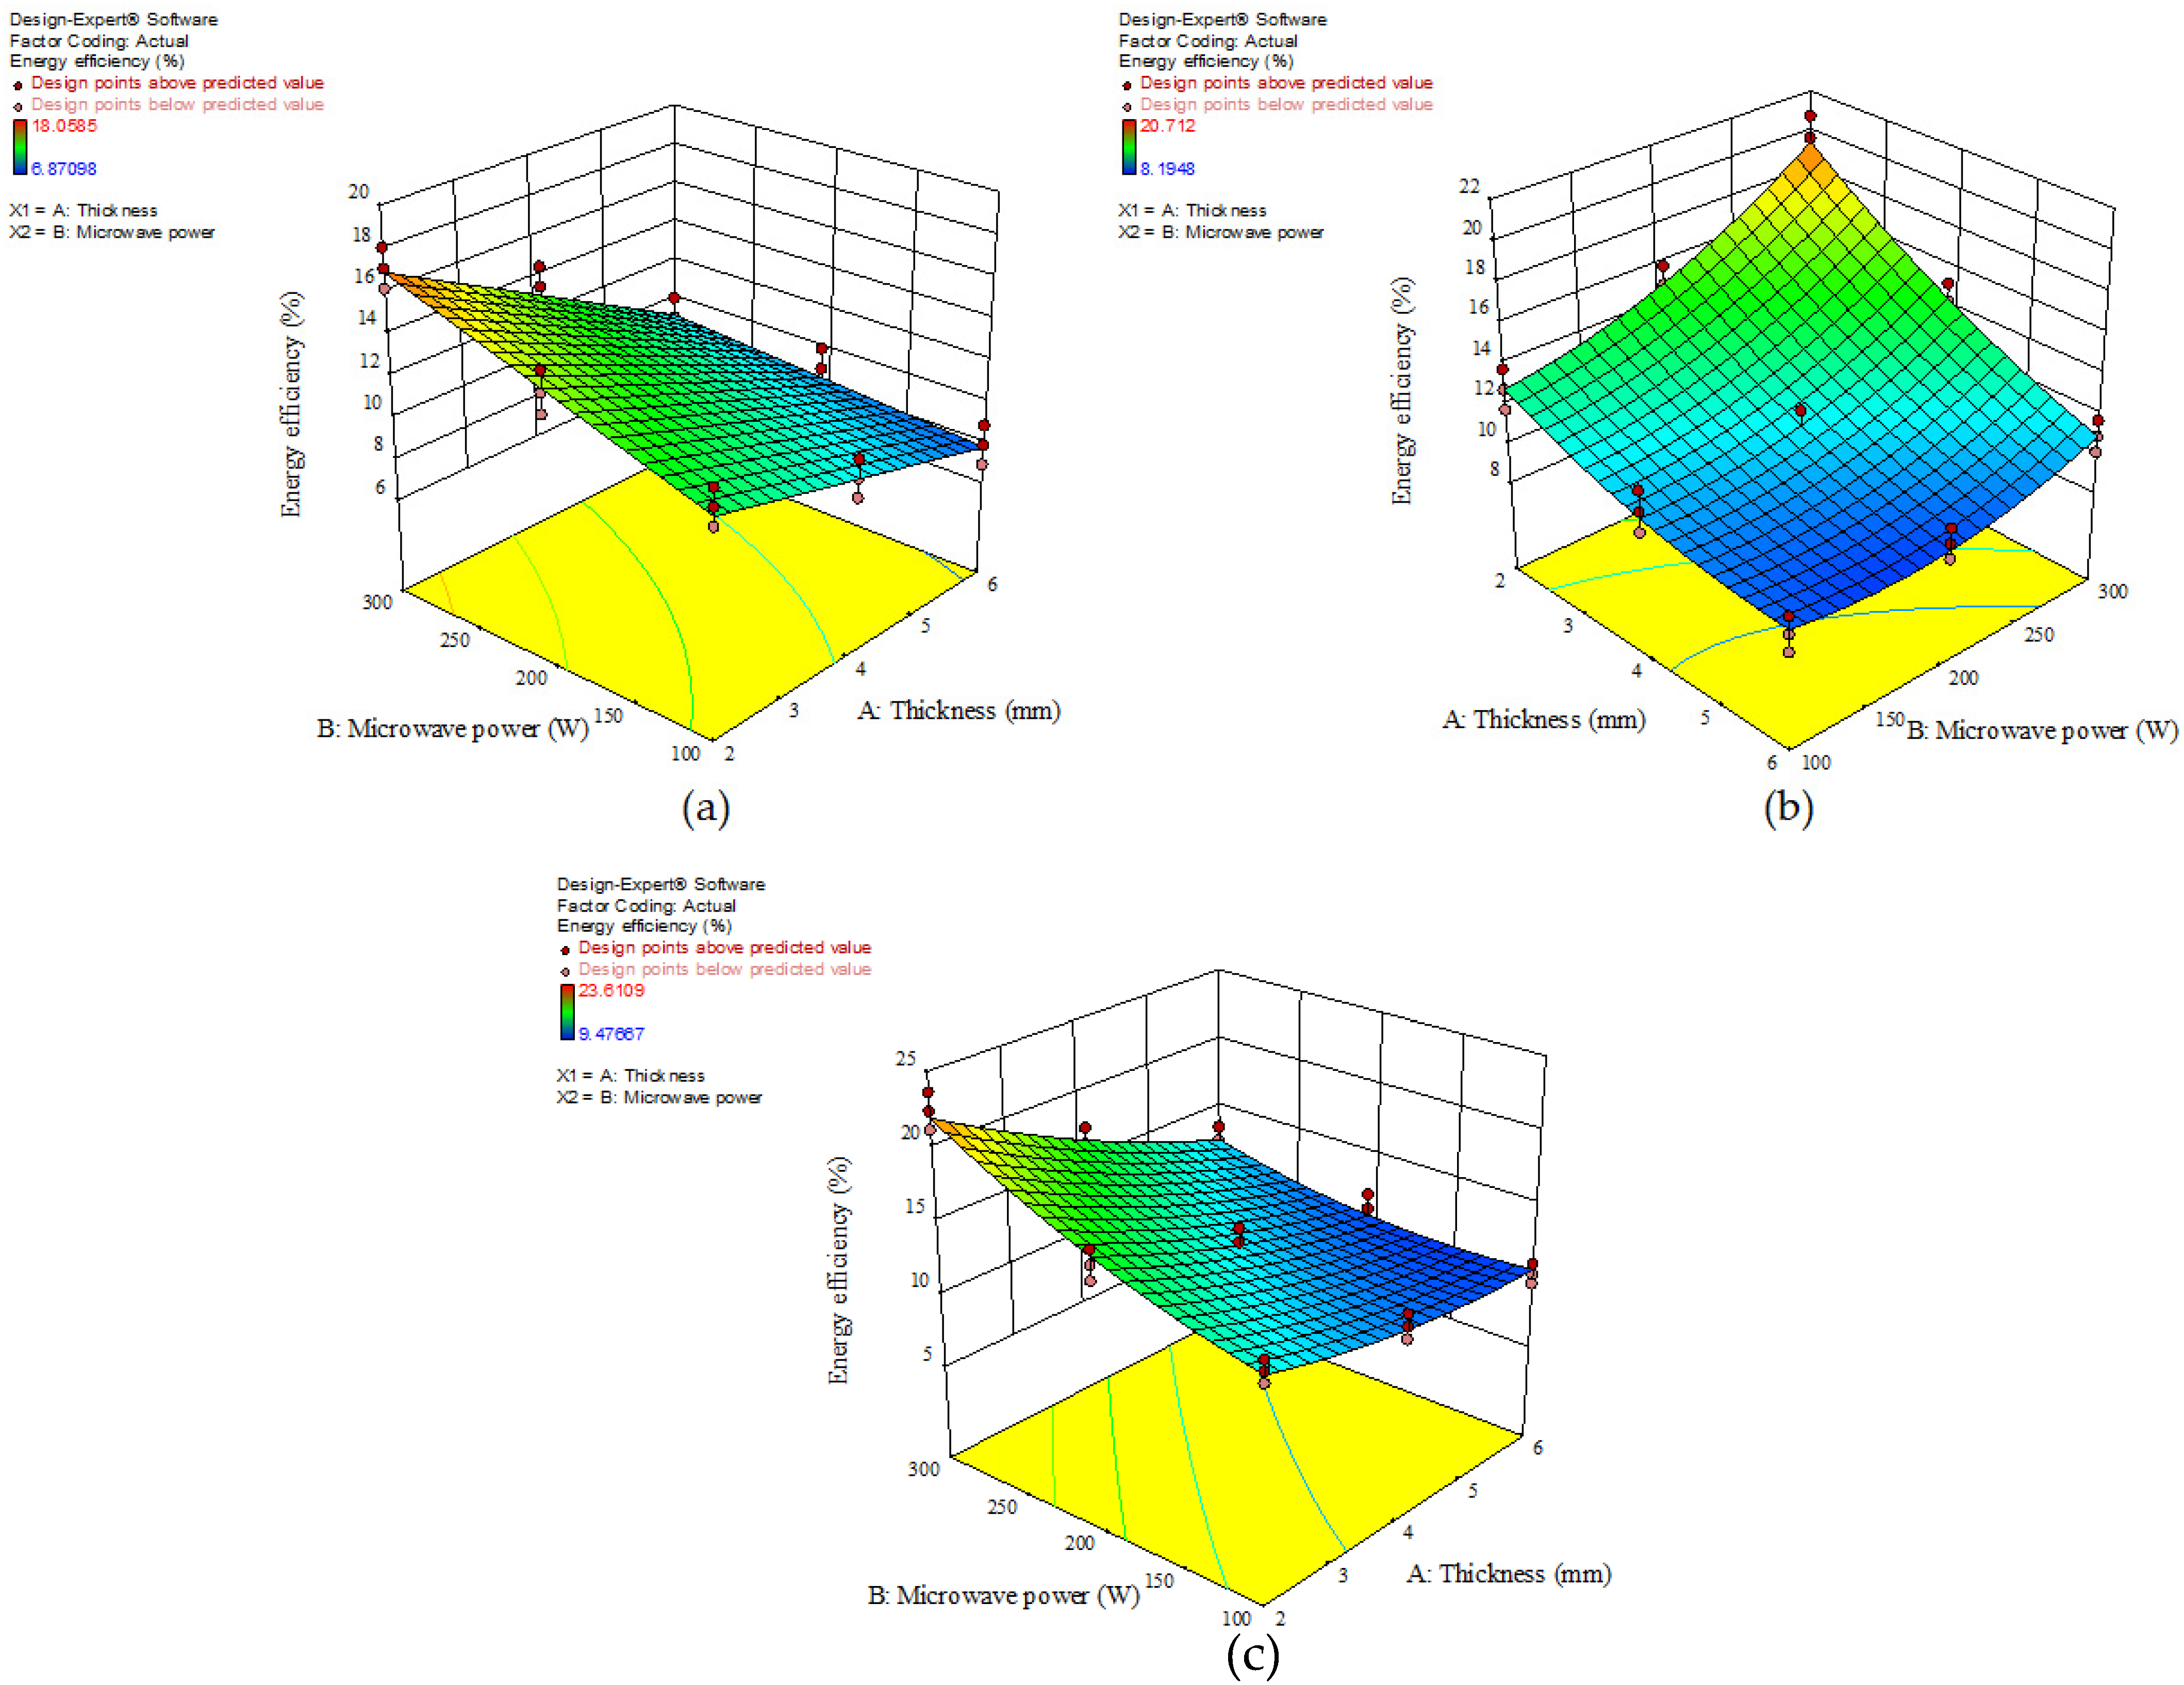
3.4. Energy Efficiency (Eef)
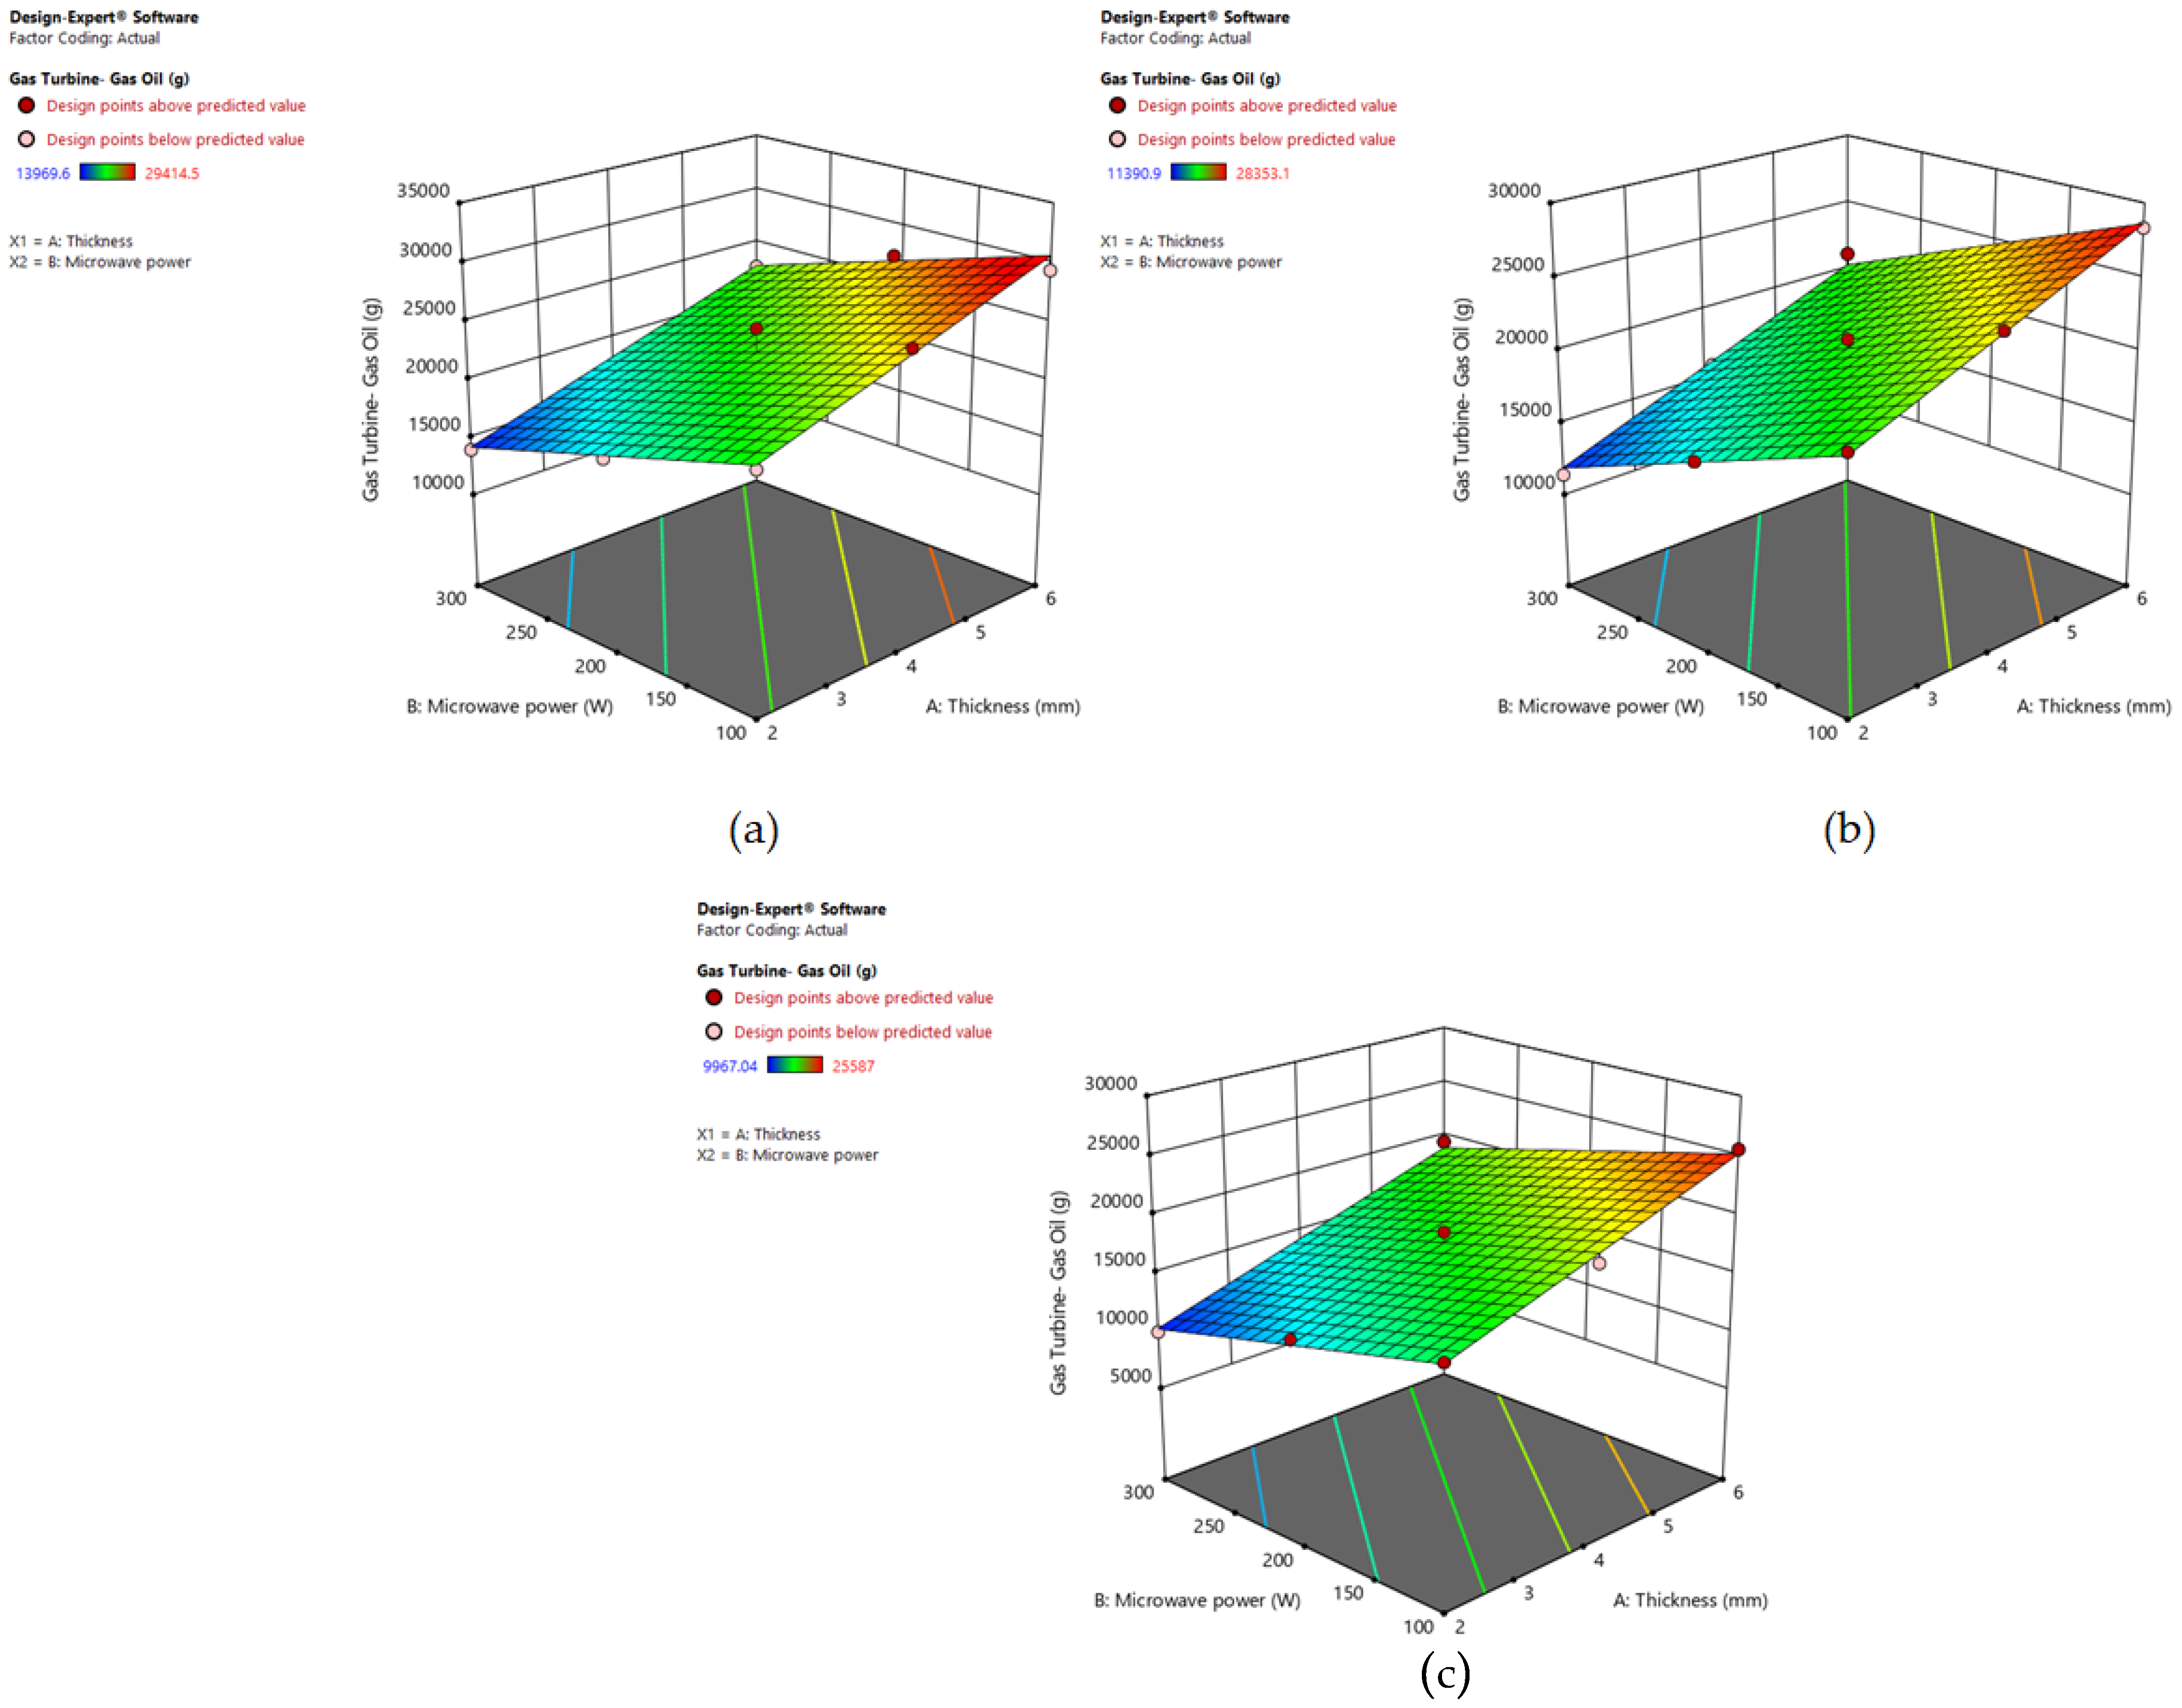
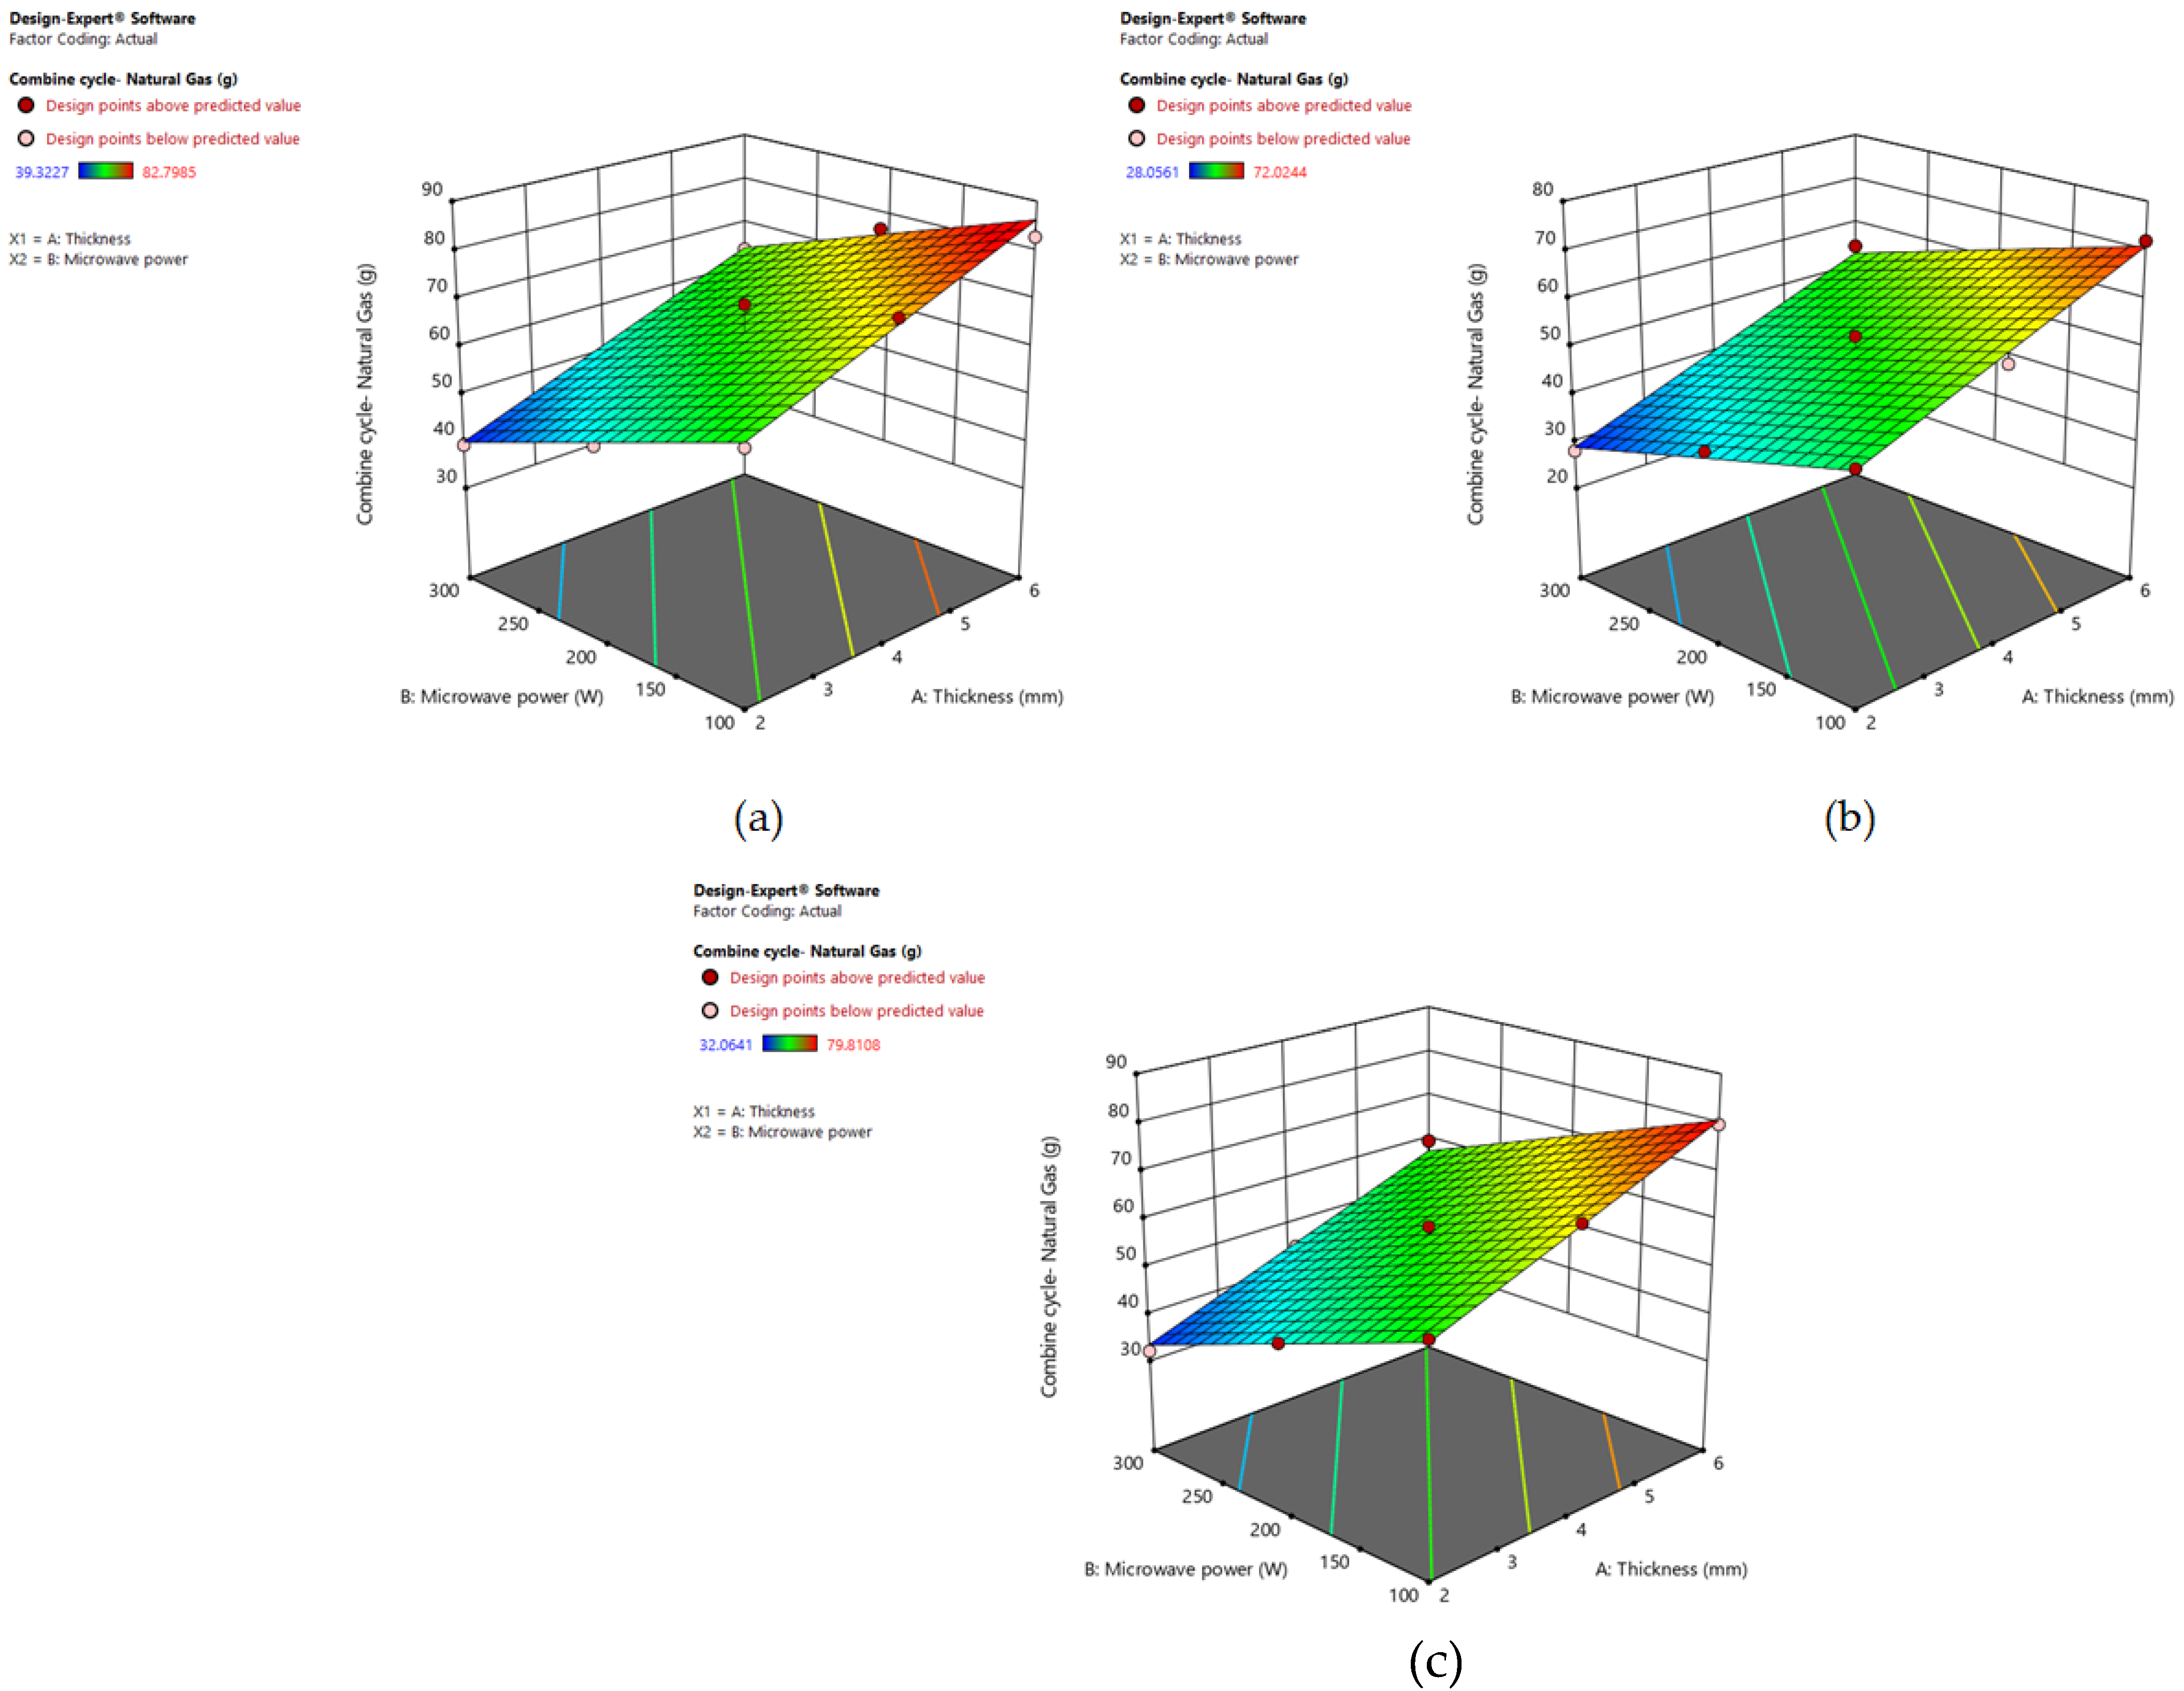
3.5. GHG
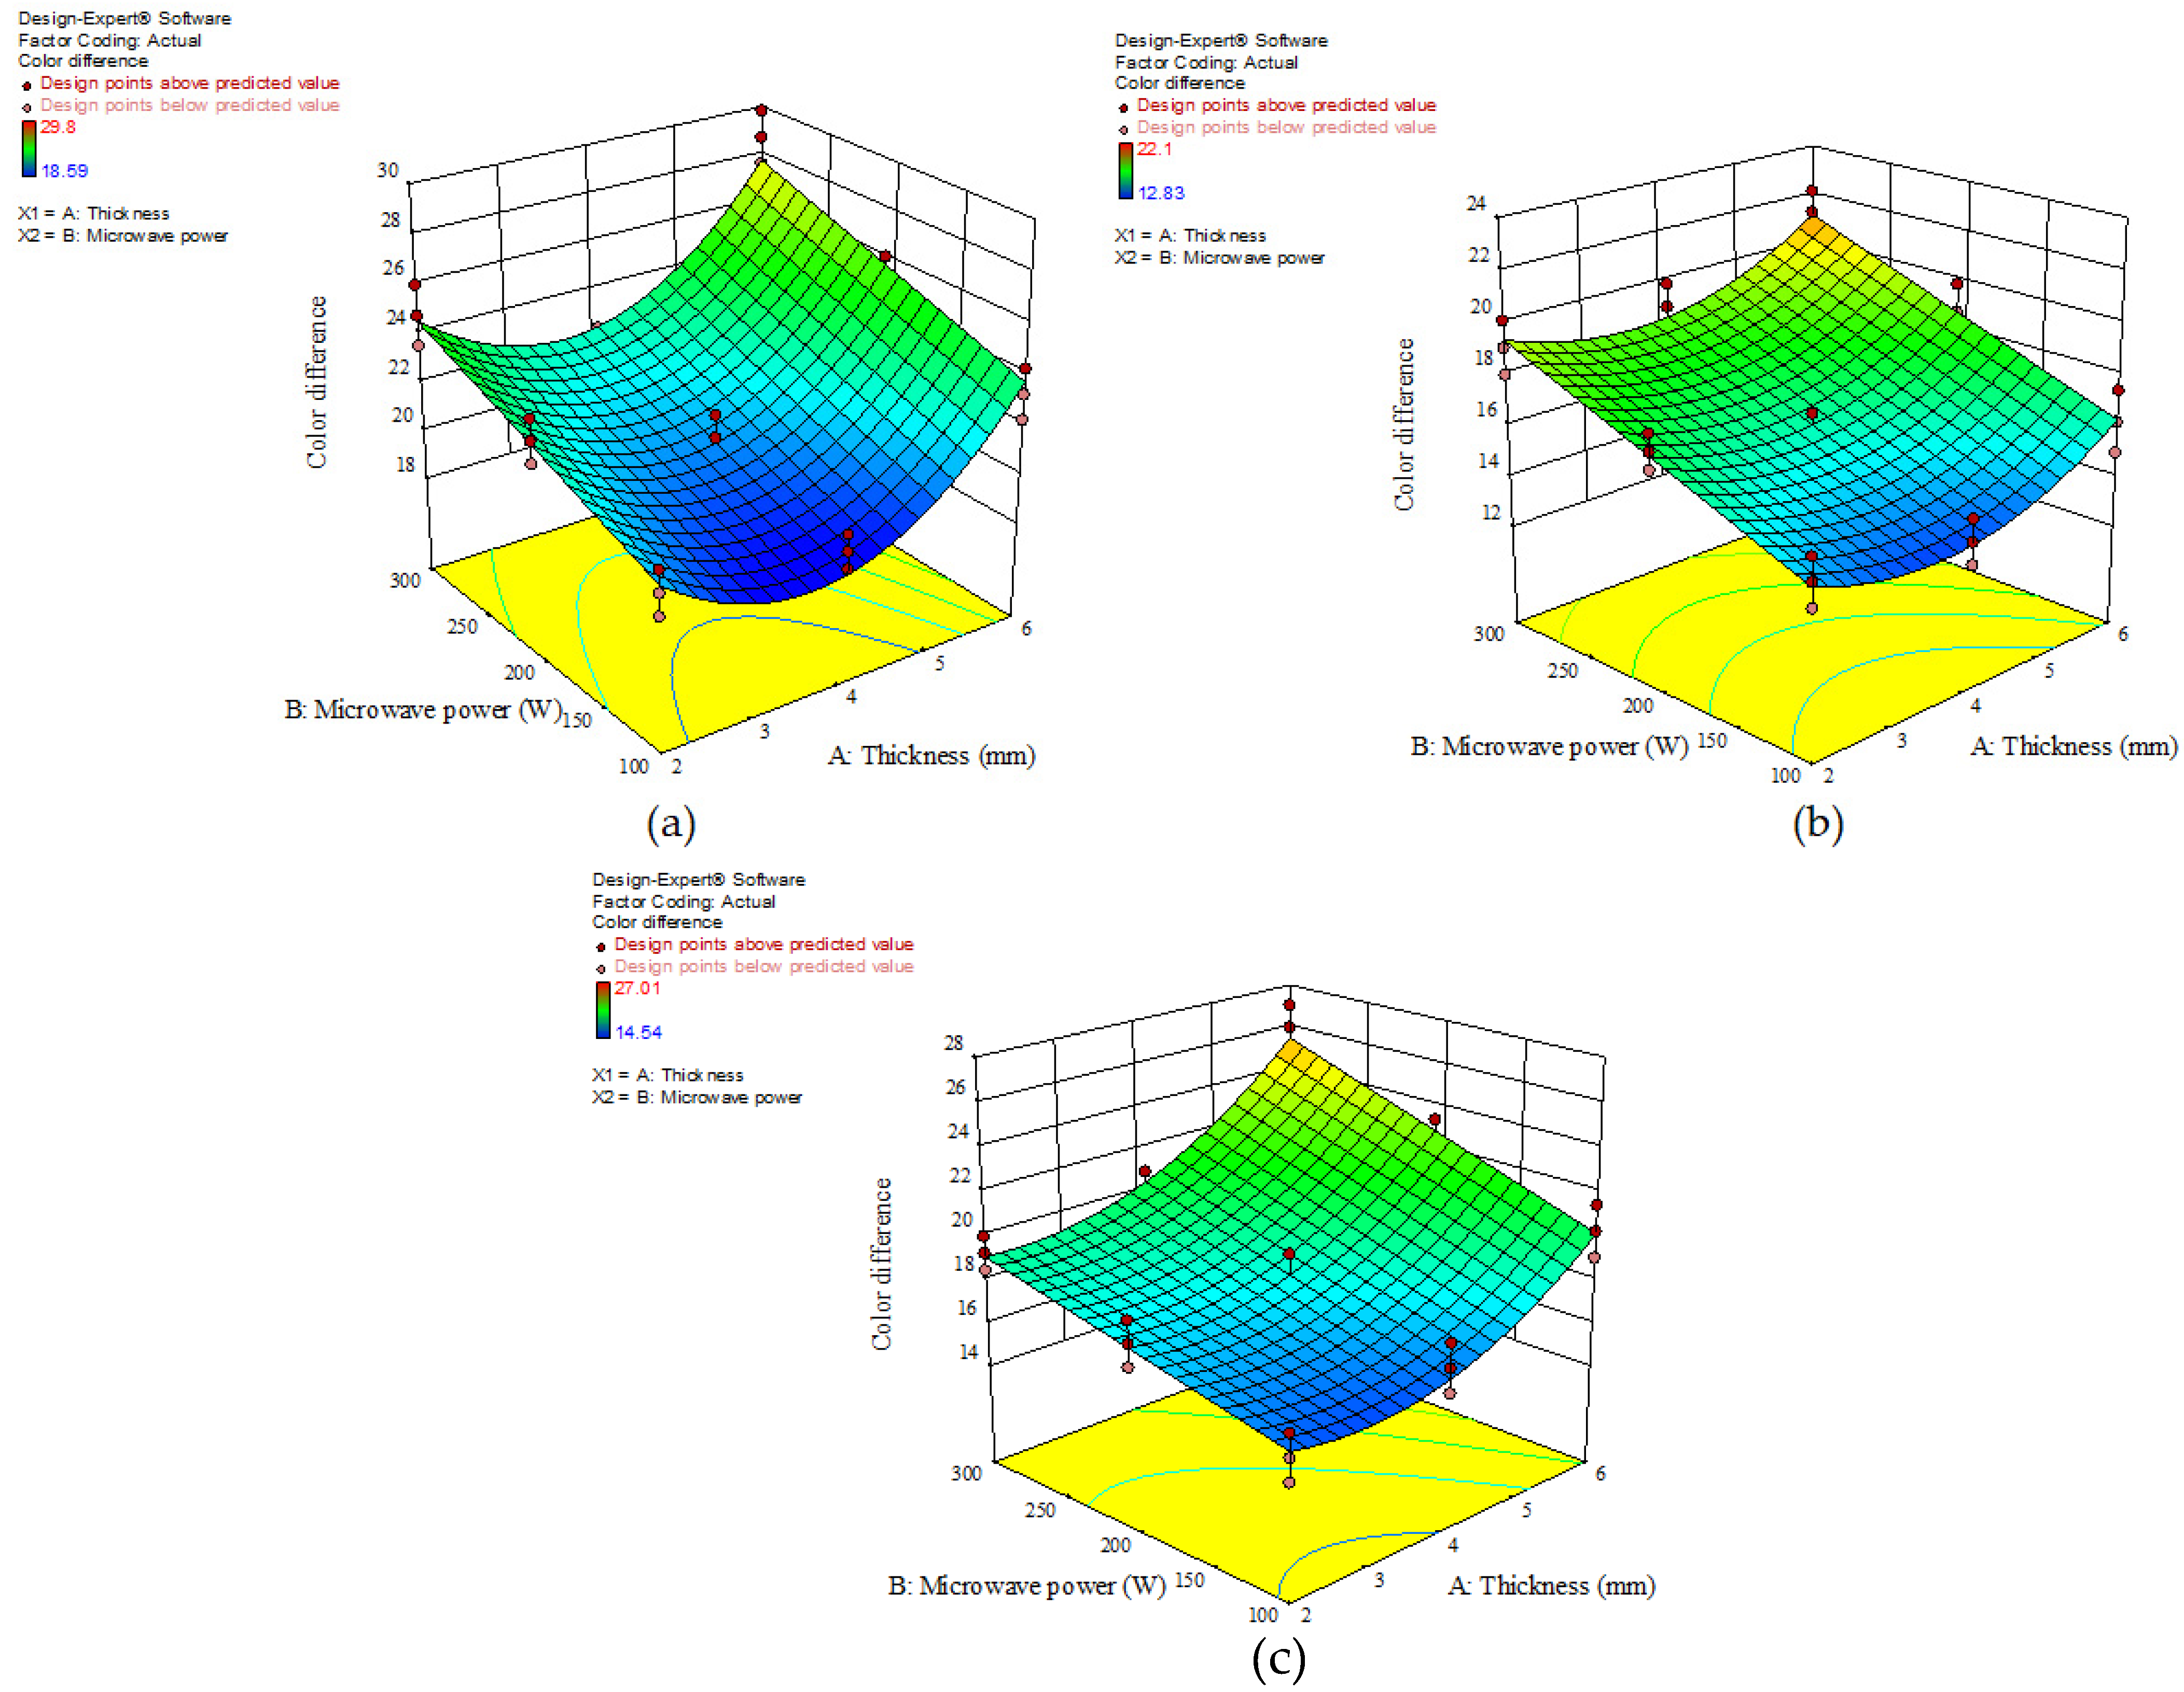
3.6. Color Changes
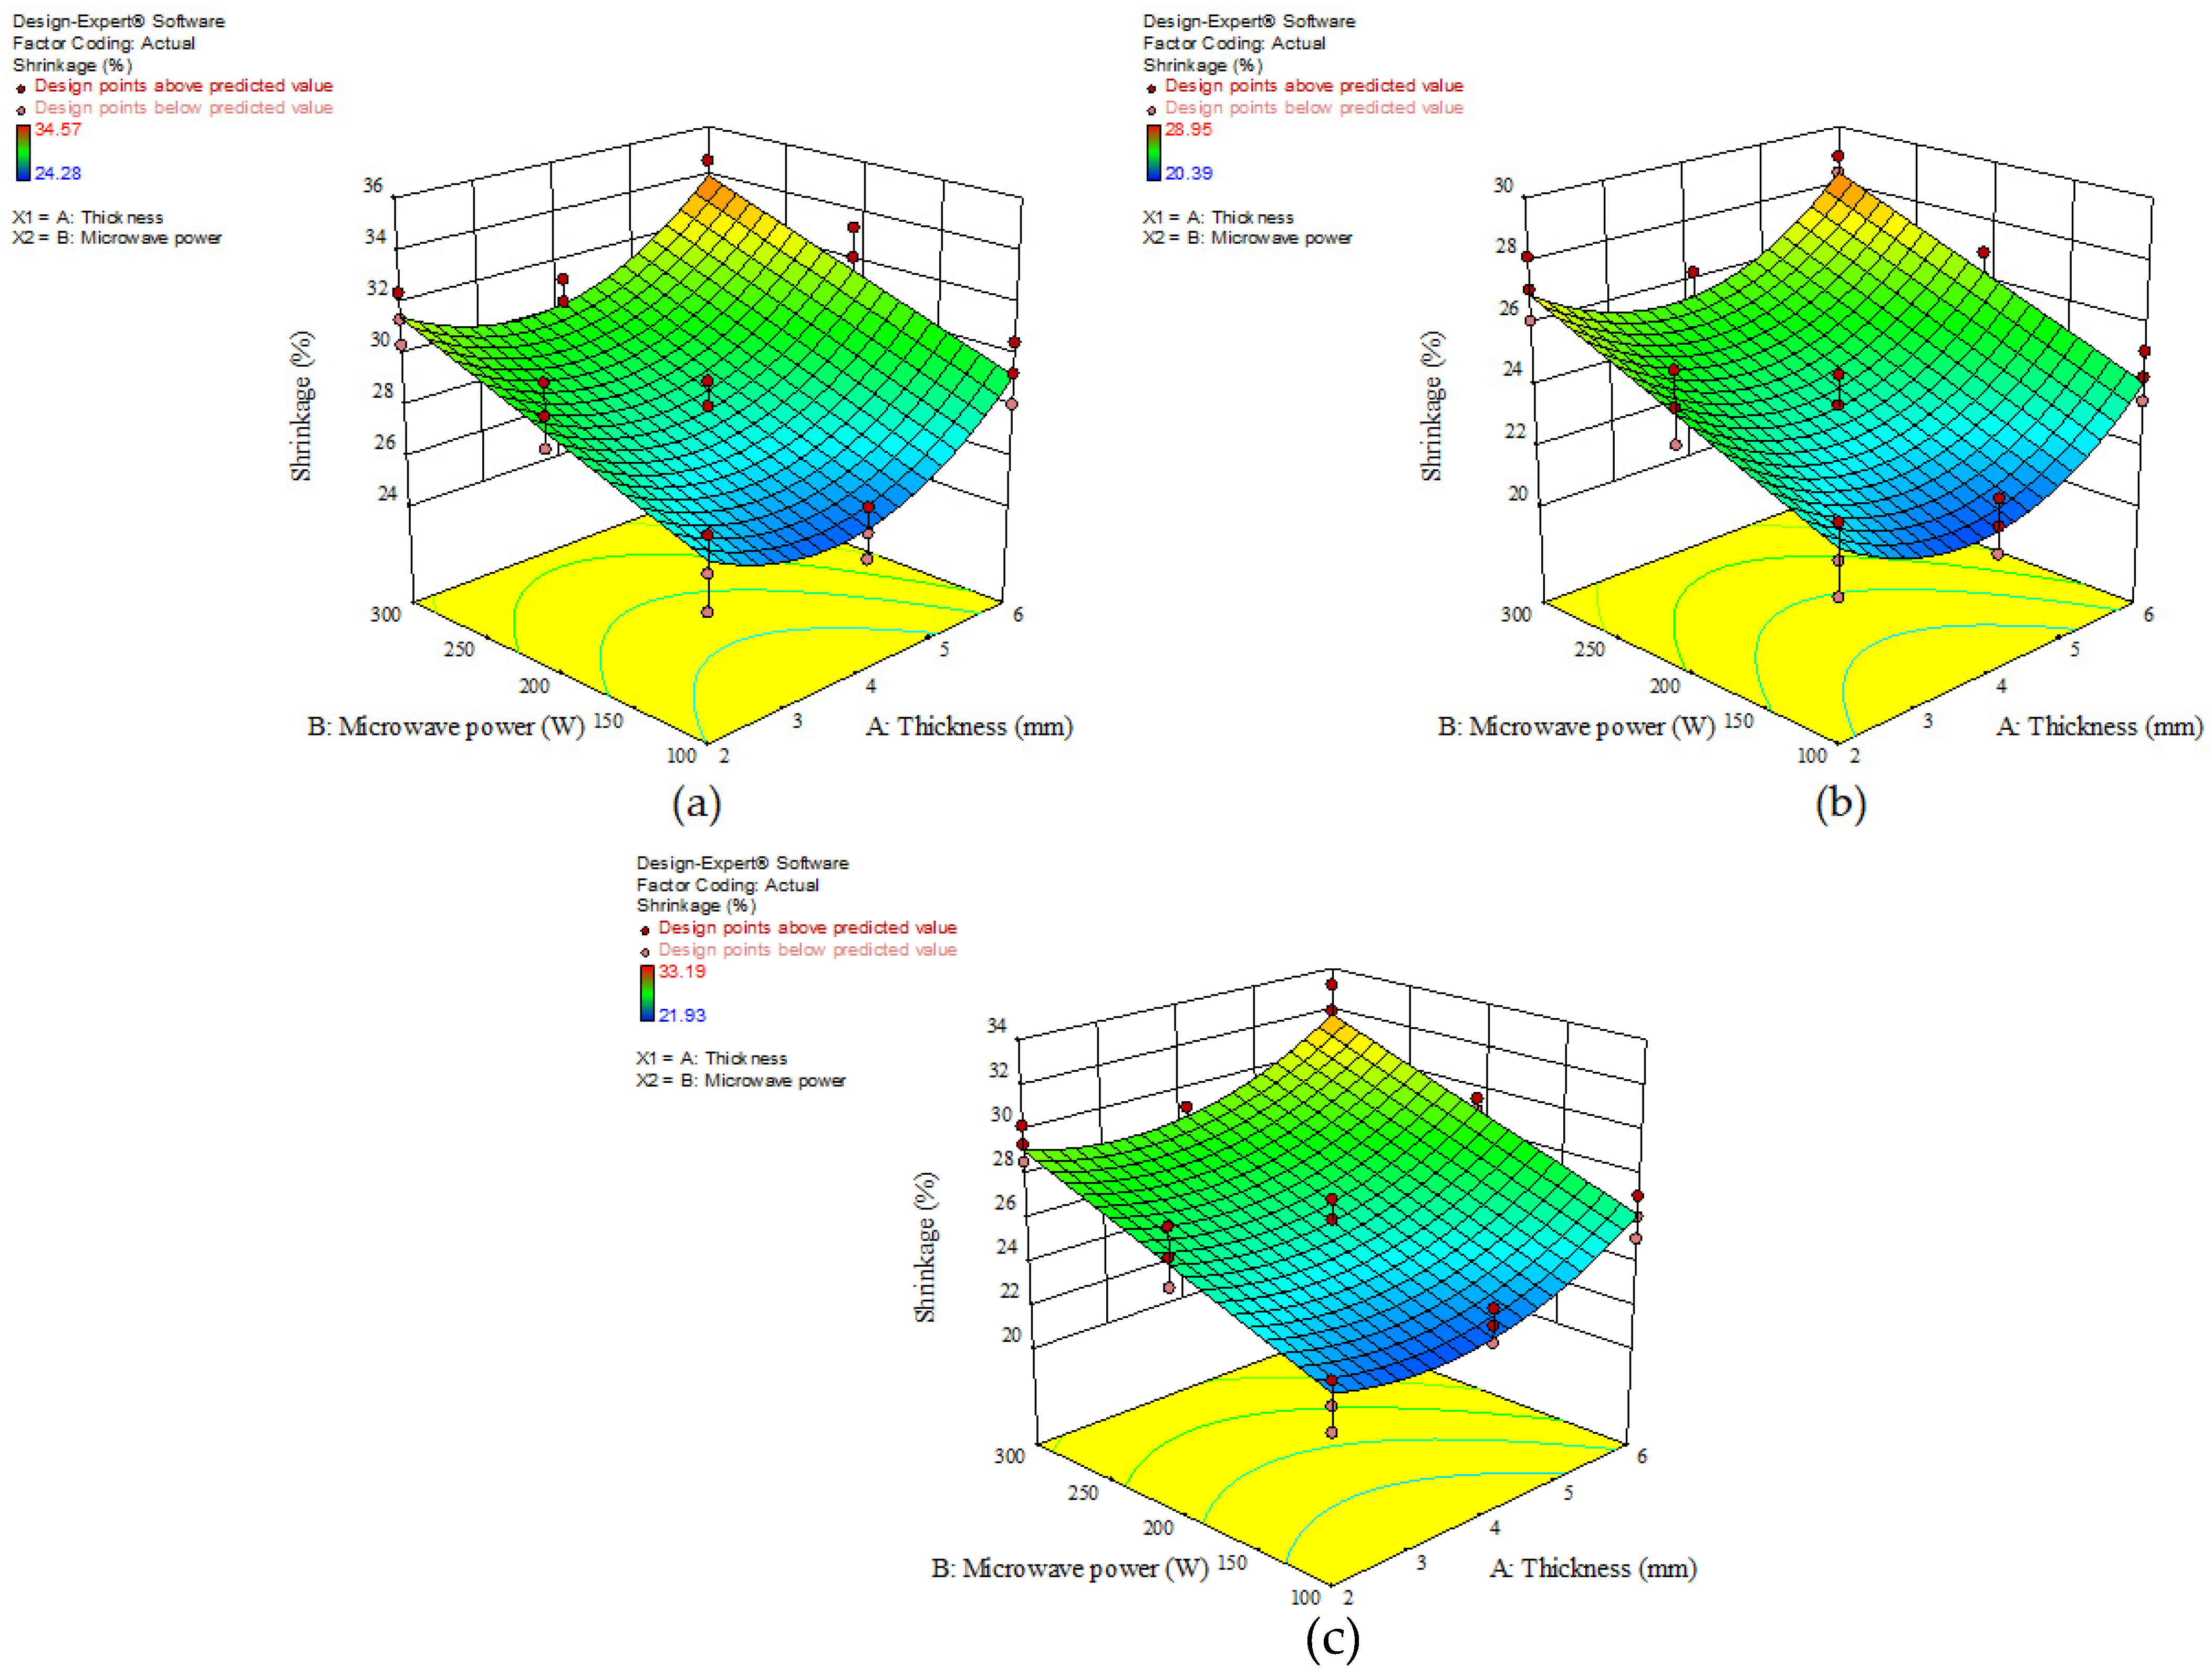
3.7. Shrinkage
3.8. Optimization
4. Conclusions
Author Contributions
Funding
Institutional Review Board Statement
Informed Consent Statement
Data Availability Statement
Acknowledgments
Conflicts of Interest
Nomenclature
| CC | Combined cycle turbines |
| Deff | Effective moisture diffusion coefficient |
| Dt | Drying time (min) |
| Eef | Energy efficiency (%) |
| GHG | Greenhouse gas |
| GO | Gas oil |
| GT | Gas turbine |
| HO | Heavy oil |
| L | Sample thickness (m) |
| M0 | Initial moisture content (d.b.) |
| MC | Moisture content (d.b.) |
| MCd.b. | Initial moisture content (d.b.) |
| Me | Equilibrium moisture content (d.b.) |
| Mf | Final weight of the sample (g) |
| Mi | Initial weight of the sample (g) |
| MP | Microwave power (W) |
| Mt | Sample moisture at time of t (d.b.) |
| Mw | Value of water leaving the sample during the process of drying (kg) |
| n | Number of the drying terms |
| NG | Natural gas |
| PP | Power plants (w) |
| RSM | Response surface methodology |
| SEC | Specific energy consumption (Mj/kg) |
| SP | Power turbine |
| ST | Slice thickness (mm) |
| Sv | Shrinkage (%) |
| t | Drying time (min) |
| TEC | Total energy use (MJ) |
| V | Sample volume after drying (cm3) |
| Vi | Sample volume before drying (cm3) |
| xi | Independent variable value |
| xj | Actual value of each parameter |
| yk | Response variable |
| β1 | Intercept of the variables |
| βi | Coefficients of the variables |
| λw | Latent heat for water vaporization (2257 kJ.kg−1) |
References
- Lyu, Y.; Bi, J.; Chen, Q.; Wu, X.; Gou, M.; Yang, X. Color enhancement mechanisms analysis of freeze-dried carrots treated by ultrasound-assisted osmosis (ascorbic acid-CaCl2) dehydration. Food Chem. 2022, 381, 132255. [Google Scholar] [CrossRef] [PubMed]
- de Souza, A.U.; Corrêa, J.L.G.; Tanikawa, D.H.; Abrahão, F.R.; de Jesus Junqueira, J.R.; Jiménez, E.C. Hybrid microwave-hot air drying of the osmotically treated carrots. LWT 2022, 156, 113046. [Google Scholar] [CrossRef]
- Fan, L.P.; Zhang, M.; Xiao, G.n.; Sun, J.c.; Tao, Q. The optimization of vacuum frying to dehydrate carrot chips. Int. J. Food Sci. Technol. 2005, 40, 911–919. [Google Scholar] [CrossRef]
- Dehghannya, J.; Seyed-Tabatabaei, S.-R.; Khakbaz Heshmati, M.; Ghanbarzadeh, B. Influence of three stage ultrasound—Intermittent microwave—Hot air drying of carrot on physical properties and energy consumption. Heat Mass Transf. 2021, 57, 1893–1907. [Google Scholar] [CrossRef]
- Taghinezhad, E.; Ebadollahi, A. Potential application of chitosan-clay coating on some quality properties of agricultural product during storage. Agric. Eng. Int. CIGR J. 2017, 19, 189–194. [Google Scholar]
- Guemouni, S.; Mouhoubi, K.; Brahmi, F.; Dahmoune, F.; Belbahi, A.; Benyoub, C.; Adjeroud-Abdellatif, N.; Atmani, K.; Bakhouche, H.; Boulekbache-Makhlouf, L. Convective and microwave drying kinetics and modeling of tomato slices, energy consumption, and efficiency. J. Food Process Eng. 2022, 45, e14113. [Google Scholar] [CrossRef]
- Chikpah, S.K.; Korese, J.K.; Sturm, B.; Hensel, O. Colour change kinetics of pumpkin (Cucurbita moschata) slices during convective air drying and bioactive compounds of the dried products. J. Agric. Food Res. 2022, 10, 100409. [Google Scholar] [CrossRef]
- Sobowale, S.S.; Agbawodike, J.I.; Kewuyemi, Y.O.; Adebo, O.A. Response surface methodology approach for predicting microwave-convective drying characteristics of sweet potato slices. J. Food Process. Preserv. 2022, 46, e16683. [Google Scholar] [CrossRef]
- Salehi, F.; Satorabi, M. Influence of infrared drying on drying kinetics of apple slices coated with basil seed and xanthan gums. Int. J. Fruit Sci. 2021, 21, 519–527. [Google Scholar] [CrossRef]
- Hosseinzadeh Samani, B.; Khodadadi, A.; Rostami, S.; Lorigooini, Z. Investigation and optimization of the effect of osmotic-ultrasound drying pretreatment on qualitative properties and process energy consumption of Cornus mas. J. Food Process. Preserv. 2021, 45, e15377. [Google Scholar] [CrossRef]
- Taghinezhad, E.; Kaveh, M.; Jahanbakhshi, A.; Golpour, I. Use of artificial intelligence for the estimation of effective moisture diffusivity, specific energy consumption, color and shrinkage in quince drying. J. Food Process Eng. 2020, 43, e13358. [Google Scholar] [CrossRef]
- Rybak, K.; Parniakov, O.; Samborska, K.; Wiktor, A.; Witrowa-Rajchert, D.; Nowacka, M. Energy and quality aspects of freeze-drying preceded by traditional and novel pre-treatment methods as exemplified by red bell pepper. Sustainability 2021, 13, 2035. [Google Scholar] [CrossRef]
- Taghinezhad, E.; Kaveh, M.; Szumny, A. Optimization and prediction of the drying and quality of turnip slices by convective-infrared dryer under various pretreatments by RSM and ANFIS methods. Foods 2021, 10, 284. [Google Scholar] [CrossRef] [PubMed]
- Tepe, T.K.; Kadakal, Ç. Determination of drying characteristics, rehydration properties, and shrinkage ratio of convective dried melon slice with some pretreatments. J. Food Process. Preserv. 2022, 46, e16544. [Google Scholar] [CrossRef]
- Mirzaei-Baktash, H.; Hamdami, N.; Torabi, P.; Fallah-Joshaqani, S.; Dalvi-Isfahan, M. Impact of different pretreatments on drying kinetics and quality of button mushroom slices dried by hot-air or electrohydrodynamic drying. LWT 2022, 155, 112894. [Google Scholar] [CrossRef]
- Taghinezhad, E.; Rasooli Sharabiani, V. The effect of combination dryer of hot air—Infrared and microwave on some quality properties of parboiled rice. Innov. Food Technol. 2017, 5, 25–38. [Google Scholar] [CrossRef]
- Rostami Gharkhloo, Z.; Sharifian, F.; Rahimi, A.; Akhoundzadeh Yamchi, A. Influence of high wave sound pretreatment on drying quality parameters of echinacea root with infrared drying. J. Sci. Food Agric. 2022, 102, 2153–2164. [Google Scholar] [CrossRef]
- Namjoo, M.; Moradi, M.; Niakousari, M. Evaluation of the effect of high-power ultrasound waves on conventional air drying of cumin seeds. Sustain. Energy Technol. Assess. 2022, 52, 102262. [Google Scholar] [CrossRef]
- Karimi, M.; Moradi, M.; Niakousari, M.; Karparvarfard, S.H. Application of heat carrier particles in a fluidized bed dryer: Dimensionless modeling and GHG emissions. J. Food Process Eng. 2022, 45, e14071. [Google Scholar] [CrossRef]
- Kaveh, M.; Chayjan, R.A.; Taghinezhad, E.; Sharabiani, V.R.; Motevali, A. Evaluation of specific energy consumption and GHG emissions for different drying methods (Case study: Pistacia Atlantica). J. Clean. Prod. 2020, 259, 120963. [Google Scholar] [CrossRef]
- Miraei Ashtiani, S.-H.; Rafiee, M.; Mohebi Morad, M.; Martynenko, A. Cold plasma pretreatment improves the quality and nutritional value of ultrasound-assisted convective drying: The case of goldenberry. Dry. Technol. 2022, 40, 1639–1657. [Google Scholar]
- Seyfi, A.; Asl, A.R.; Motevali, A. Comparison of the energy and pollution parameters in solar refractance window (photovoltaic-thermal), conventional refractance window, and hot air dryer. Sol. Energy 2021, 229, 162–173. [Google Scholar] [CrossRef]
- Wang, L.; Xu, B.; Wei, B.; Zeng, R. Low frequency ultrasound pretreatment of carrot slices: Effect on the moisture migration and quality attributes by intermediate-wave infrared radiation drying. Ultrason. Sonochem. 2018, 40, 619–628. [Google Scholar]
- AOAC. Official Methods of Analysis, 16th ed.; Association of Official Analytical Chemists: Washington, DC, USA, 2010. [Google Scholar]
- Geng, Z.; Torki, M.; Kaveh, M.; Beigi, M.; Yang, X. Characteristics and multi-objective optimization of carrot dehydration in a hybrid infrared/hot air dryer. LWT 2022, 172, 114229. [Google Scholar] [CrossRef]
- Ononogbo, C.; Nwakuba, N.; Nwaji, G.; Nwufo, O.; Nwosu, E.; Okoronkwo, C.; Igbokwe, J.; Anyanwu, E. Thermal efficiency and drying Behaviour of Yam slices in a dryer driven by the waste heat of exhaust gases. Sci. Afr. 2022, 17, e01310. [Google Scholar] [CrossRef]
- Namjoo, M.; Moradi, M.; Niakousari, M.; Karparvarfard, S.H. Ultrasound-assisted air drying of cumin seeds: Modeling and optimization by response surface method. Heat Mass Transf. 2022, 59, 1073–1091. [Google Scholar] [CrossRef]
- Ghanbarian, D.; Torki-Harchegani, M.; Sadeghi, M.; Pirbalouti, A.G. Ultrasonically improved convective drying of peppermint leaves: Influence on the process time and energetic indices. Renew. Energy 2020, 153, 67–73. [Google Scholar]
- Tepe, F.B.; Tepe, T.K.; Ekinci, A. Drying kinetics and energy efficiency of microwave-dried lemon slices. Chem. Ind. Chem. Eng. Q. 2022, 28, 297–304. [Google Scholar] [CrossRef]
- Nazari, S.; Shahhoseini, O.; Sohrabi-Kashani, A.; Davari, S.; Paydar, R.; Delavar-Moghadam, Z. Experimental determination and analysis of CO2, SO2 and NOx emission factors in Iran’s thermal power plants. Energy 2010, 35, 2992–2998. [Google Scholar] [CrossRef]
- Koca, N.; Burdurlu, H.S.; Karadeniz, F. Kinetics of colour changes in dehydrated carrots. J. Food Eng. 2007, 78, 449–455. [Google Scholar] [CrossRef]
- Bai, J.-W.; Zhang, L.; Aheto, J.H.; Cai, J.-R.; Wang, Y.-C.; Sun, L.; Tian, X.-Y. Effects of different pretreatment methods on drying kinetics, three-dimensional deformation, quality characteristics and microstructure of dried apple slices. Innov. Food Sci. Emerg. Technol. 2023, 83, 103216. [Google Scholar]
- Beigi, M.; Torki, M. Experimental and ANN modeling study on microwave dried onion slices. Heat Mass Transf. 2021, 57, 787–796. [Google Scholar] [CrossRef]
- Darvishi, H.; Zarein, M.; Farhudi, Z. Energetic and exergetic performance analysis and modeling of drying kinetics of kiwi slices. J. Food Sci. Technol. 2016, 53, 2317–2333. [Google Scholar] [PubMed]
- Raj, G.; Dash, K.K. Effect of intermittent microwave convective drying on physicochemical properties of dragon fruit. Food Sci. Biotechnol. 2022, 31, 549–560. [Google Scholar] [CrossRef]
- Szadzińska, J.; Mierzwa, D. The influence of hybrid drying (microwave-convective) on drying kinetics and quality of white mushrooms. Chem. Eng. Process. Process Intensif. 2021, 167, 108532. [Google Scholar]
- Sledz, M.; Wiktor, A.; Rybak, K.; Nowacka, M.; Witrowa-Rajchert, D. The impact of ultrasound and steam blanching pre-treatments on the drying kinetics, energy consumption and selected properties of parsley leaves. Appl. Acoust. 2016, 103, 148–156. [Google Scholar]
- Tao, Y.; Han, M.; Gao, X.; Han, Y.; Show, P.-L.; Liu, C.; Ye, X.; Xie, G. Applications of water blanching, surface contacting ultrasound-assisted air drying, and their combination for dehydration of white cabbage: Drying mechanism, bioactive profile, color and rehydration property. Ultrason. Sonochem. 2019, 53, 192–201. [Google Scholar]
- Wu, B.; Guo, X.; Guo, Y.; Ma, H.; Zhou, C. Enhancing jackfruit infrared drying by combining ultrasound treatments: Effect on drying characteristics, quality properties and microstructure. Food Chem. 2021, 358, 129845. [Google Scholar]
- Abbaspour-Gilandeh, Y.; Kaveh, M.; Fatemi, H.; Khalife, E.; Witrowa-Rajchert, D.; Nowacka, M. Effect of pretreatments on convective and infrared drying kinetics, energy consumption and quality of terebinth. Appl. Sci. 2021, 11, 7672. [Google Scholar] [CrossRef]
- Castro, S.M.; Saraiva, J.A.; Domingues, F.M.; Delgadillo, I. Effect of mild pressure treatments and thermal blanching on yellow bell peppers (Capsicum annuum L.). LWT Food Sci. Technol. 2011, 44, 363–369. [Google Scholar] [CrossRef]
- Beigi, M. Infrared dehydration of blanched quince slices: Study on process and mass transfer characteristics: Drying of quince slices . Lat. Am. Appl. Res. Int. J. 2021, 51, 241–247. [Google Scholar]
- Royen, M.J.; Noori, A.W.; Haydary, J. Experimental study and mathematical modeling of convective thin-layer drying of apple slices. Processes 2020, 8, 1562. [Google Scholar] [CrossRef]
- Onwude, D.I.; Hashim, N.; Abdan, K.; Janius, R.; Chen, G. Investigating the influence of novel drying methods on sweet potato (Ipomoea batatas L.): Kinetics, energy consumption, color, and microstructure. J. Food Process Eng. 2018, 41, e12686. [Google Scholar]
- Zhu, R.; Shen, J.; Law, C.L.; Ma, X.; Li, D.; Han, Y.; Kiani, H.; Manickam, S.; Tao, Y. Combined calcium pretreatment and ultrasonic/microwave drying to dehydrate black chokeberry: Novel mass transfer modeling and metabolic pathways of polyphenols. Innov. Food Sci. Emerg. Technol. 2022, 83, 103215. [Google Scholar]
- Nowacka, M.; Wiktor, A.; Anuszewska, A.; Dadan, M.; Rybak, K.; Witrowa-Rajchert, D. The application of unconventional technologies as pulsed electric field, ultrasound and microwave-vacuum drying in the production of dried cranberry snacks. Ultrason. Sonochem. 2019, 56, 1–13. [Google Scholar]
- Chao, E.; Li, J.; Fan, L. Enhancing drying efficiency and quality of seed-used pumpkin using ultrasound, freeze-thawing and blanching pretreatments. Food Chem. 2022, 384, 132496. [Google Scholar] [CrossRef] [PubMed]
- Pandiselvam, R.; Aydar, A.Y.; Kutlu, N.; Aslam, R.; Sahni, P.; Mitharwal, S.; Gavahian, M.; Kumar, M.; Raposo, A.; Yoo, S. Individual and interactive effect of ultrasound pre-treatment on drying kinetics and biochemical qualities of food: A critical review. Ultrason. Sonochem. 2022, 92, 106261. [Google Scholar]
- Taghinezhad, E.; Kaveh, M.; Szumny, A. Thermodynamic and quality performance studies for drying kiwi in hybrid hot air-infrared drying with ultrasound pretreatment. Appl. Sci. 2021, 11, 1297. [Google Scholar] [CrossRef]
- Mouhoubi, K.; Boulekbache-Makhlouf, L.; Mehaba, W.; Himed-Idir, H.; Madani, K. Convective and microwave drying of coriander leaves: Kinetics characteristics and modeling, phenolic contents, antioxidant activity, and principal component analysis. J. Food Process Eng. 2022, 45, e13932. [Google Scholar]
- Nwakuba, N.; Chukwuezie, O.; Asonye, G.; Asoegwu, S. Energy analysis and optimization of thin layer drying conditions of okra. Arid Zone J. Eng. Technol. Environ. 2018, 14, 129–148. [Google Scholar]
- Samadi, S.H.; Ghobadian, B.; Najafi, G.; Motevali, A. Potential saving in energy using combined heat and power technology for drying agricultural products (banana slices). J. Saudi Soc. Agric. Sci. 2014, 13, 174–182. [Google Scholar] [CrossRef]
- Xu, J.; Wang, D.; Lei, Y.; Cheng, L.; Zhuang, W.; Tian, Y. Effects of combined ultrasonic and microwave vacuum drying on drying characteristics and physicochemical properties of Tremella fuciformis. Ultrason. Sonochem. 2022, 84, 105963. [Google Scholar] [CrossRef] [PubMed]
- Kaveh, M.; Taghinezhad, E.; Aziz, M. Effects of physical and chemical pretreatments on drying and quality properties of blackberry (Rubus spp.) in hot air dryer. Food Sci. Nutr. 2020, 8, 3843–3856. [Google Scholar] [CrossRef] [PubMed]
- Beigi, M.; Harchegani, H.B.; Torki, M.; Kaveh, M.; Szymanek, M.; Khalife, E.; Dziwulska-Hunek, A. Experimental and numerical analysis of thermodynamic performance of microwave dryer of onion. J. Food Process Eng. 2022, 45, e14116. [Google Scholar] [CrossRef]
- Motevali, A.; Koloor, R.T. A comparison between pollutants and greenhouse gas emissions from operation of different dryers based on energy consumption of power plants. J. Clean. Prod. 2017, 154, 445–461. [Google Scholar] [CrossRef]
- Kaveh, M.; Abbaspour-Gilandeh, Y.; Nowacka, M. Comparison of different drying techniques and their carbon emissions in green peas. Chem. Eng. Process. Process Intensif. 2021, 160, 108274. [Google Scholar] [CrossRef]
- Motevali, A.; Jafari, H.; Molkabadi, E.Z.; Zhu, S.; Koloor, R.T.; Taghizadeh-Alisaraei, A. Comparison of environmental pollution and social cost analyses in different drying technologies. Int. J. Glob. Warm. 2020, 22, 1–29. [Google Scholar]
- Motevali, A.; Hashemi, S.J.; Taghinejad, E. Investigation of energy parameters, environment and social costs for drying process (Case study: Apple slices). Agric. Mech. Syst. Res. 2019, 20, 37–54. [Google Scholar]
- Taghinezhad, E.; Kaveh, M.; Khalife, E.; Chen, G. Drying of organic blackberry in combined hot air-infrared dryer with ultrasound pretreatment. Dry. Technol. 2021, 39, 2075–2091. [Google Scholar] [CrossRef]
- Zahoor, I.; Khan, M.A. Microwave assisted fluidized bed drying of red bell pepper: Drying kinetics and optimization of process conditions using statistical models and response surface methodology. Sci. Hortic. 2021, 286, 110209. [Google Scholar]
- EL-Mesery, H.S.; Elabd, M.A. Effect of microwave, infrared, and convection hot-air on drying kinetics and quality properties of okra pods. Int. J. Food Eng. 2021, 17, 909–926. [Google Scholar]
- Onwude, D.I.; Hashim, N.; Abdan, K.; Janius, R.; Chen, G. Modelling the mid-infrared drying of sweet potato: Kinetics, mass and heat transfer parameters, and energy consumption. Heat Mass Transf. 2018, 54, 2917–2933. [Google Scholar]
- Li, Y.; Zhang, Y.; Liu, H.; Jin, X.; Liu, X. Impacts of different blanching pretreatments on the quality of dried potato chips and fried potato crisps undergoing heat pump drying. Int. J. Food Eng. 2021, 17, 517–527. [Google Scholar] [CrossRef]
- Nowacka, M.; Dadan, M.; Tylewicz, U. Current applications of ultrasound in fruit and vegetables osmotic dehydration processes. Appl. Sci. 2021, 11, 1269. [Google Scholar] [CrossRef]
- Wang, Y.; Li, X.; Chen, X.; Li, B.; Mao, X.; Miao, J.; Zhao, C.; Huang, L.; Gao, W. Effects of hot air and microwave-assisted drying on drying kinetics, physicochemical properties, and energy consumption of chrysanthemum. Chem. Eng. Process. Process Intensif. 2018, 129, 84–94. [Google Scholar] [CrossRef]
- Mayor, L.; Sereno, A. Modelling shrinkage during convective drying of food materials: A review. J. Food Eng. 2004, 61, 373–386. [Google Scholar] [CrossRef]
- Paul, A.; Astatkie, E.; Martynenko, A. Electrohydrodynamic drying of fruit slices: Effect on drying kinetics, energy consumption, and product quality. J. Food Process. Preserv. 2022, 46, e16812. [Google Scholar]
- Chayjan, R.A.; Fealekari, M. Optimization of convective drying process for Persian shallot using response surface method (RSM). Agric. Eng. Int. CIGR J. 2014, 16, 157–166. [Google Scholar]
- Buvaneswaran, M.; Natarajan, V.; Sunil, C.K.; Rawson, A. Effect of pretreatments and drying on shrinkage and rehydration kinetics of ginger (Zingiber officinale). J. Food Process Eng. 2022, 45, e13972. [Google Scholar] [CrossRef]


| Independent Variables | Coded Variables | Levels | ||
|---|---|---|---|---|
| −1 | 0 | +1 | ||
| Thickness (mm) | A | 2 | 4 | 6 |
| Microwave power (W) | B | 100 | 200 | 300 |
| Pretreatment | Parameters | No | Equation | Model | R2 | Adj R2 | Pred R2 | CV (%) | p-Value |
|---|---|---|---|---|---|---|---|---|---|
| Control | Time | 10 | +135.77 + 12.88A − 0.37B | Linear | 0.9603 | 0.957 | 0.9483 | 7.15 | <0.0001 |
| Deff | 11 | −3.68 × 10⁻¹⁰ − 1.80 × 10⁻¹⁰A − 1.52 × 10⁻¹³B + 9.34 × 10⁻¹⁰AB | 2FI | 0.9818 | 0.9795 | 0.9751 | 9.36 | <0.0001 | |
| SEC | 12 | 17.01 + 2.06A + 0.005B − 0.0001B2 | Quadratic | 0.9340 | 0.9254 | 0.9089 | 6.14 | <0.0001 | |
| Eef * | 13 | +9.97 – 0.47A − 0.004AB | 2FI | 0.9046 | 0.8921 | 0.8714 | 8.72 | <0.0001 | |
| Color | 14 | +28.29 − 6.73A + 0.01B − 0.94A2 | Quadratic | 0.8810 | 0.8655 | 0.8326 | 4.75 | <0.0001 | |
| Shrinkage | 15 | +30.59 − 4.36A − 0.02B − 0.62A2 | Quadratic | 0.8602 | 0.8420 | 0.8076 | 3.67 | <0.0001 | |
| US ** | Time | 16 | +124.17 + 12.97A − 0.35B | Linear | 0.9572 | 0.9516 | 0.9415 | 5.82 | <0.0001 |
| Deff | 17 | −2.00 × 10⁻¹¹ − 1.76A × 10−10 − 4.30 × 10⁻¹²B + 9.81 × 10⁻¹³ AB + 1.06 × 10⁻¹⁴B2 | Quadratic | 0.9844 | 0.9815 | 0.9762 | 8.82 | <0.0001 | |
| SEC | 18 | +19.20 − 2.01A + 0.03B | Linear | 0.9361 | 0.9308 | 0.99178 | 6.61 | <0.0001 | |
| Eef | 19 | +15.65 − 1.78A + 7.44B − 6.27AB + 0.19A2 + 0001B2 | Quadratic | 0.9406 | 0.9265 | 0.9007 | 7.17 | <0.0001 | |
| Color | 20 | +16.44 − 3.69A + 0.02B + 0.43A2 | Quadratic | 0.8826 | 0.8672 | 0.8373 | 5.21 | <0.0001 | |
| Shrinkage | 21 | +26.45 − 4.08A + 0.02B + 0.55A2 | Quadratic | 0.8785 | 0.8627 | 0.8328 | 3.46 | <0.0001 | |
| BL *** | Time | 22 | +117.148 + 11.58A − 0.33B | Linear | 0.9699 | 0.9674 | 0.9616 | 6.49 | <0.0001 |
| Deff | 23 | −9.10 × 10⁻¹¹ − 1.73A × 10−10 − 5.61 × 10⁻¹²B + 1.02 × 10⁻¹² AB + 1.42 × 10⁻¹⁴B2 | Quadratic | 0.9838 | 0.9809 | 0.9749 | 8.95 | <0.0001 | |
| SEC | 24 | +14.74 − 2.05A + 0.03B | Linear | 0.9298 | 0.9239 | 0.9113 | 7.17 | <0.0001 | |
| Eef | 25 | +14.43 − 1.43A + 0.01B − 0.008AB + 0.18A2 + 0001B2 | Quadratic | 0.9432 | 0.9297 | 0.9063 | 7.02 | <0.0001 | |
| Color | 26 | +18.38 − 3.00A + 0.01B + 0.002AB + 0.47A2 | Quadratic | 0.9130 | 0.8972 | 0.867 | 5.15 | <0.0001 | |
| Shrinkage | 27 | +24.80 − 2.86A + 0.02B + 0.44A2 | Quadratic | 0.8973 | 0.8839 | 0.8572 | 3.56 | <0.0001 |
| Pretreatment | Power Plant—Type of Fuel | Equation for CO2 | Equation for NOx | p-Value |
|---|---|---|---|---|
| Control | SP-NG | 14,074.16 + 2625.24A − 2363.16B − 682.08B2 | 65.5 + 12.22A − 11B − 3.17B2 | <0.0001 |
| SP-HO | 22,682.41 + 4230.94A − 3805.56B − 1099.27B2 | 55.77+ 10.4A − 9.36B − 2.70B2 | <0.0001 | |
| GT-NG | 17,305.02 + 3227.9A − 2905.65B − 838.66B2 | 42.27 + 7.88A − 7.1B − 2.05B2 | <0.0001 | |
| GT-GO | 23,191.38 + 4325.88A − 3894.02B − 1123.94B2 | 128.13 + 23.9A − 21.51B − 6.21B2 | <0.0001 | |
| CC-NG | 9958.13 + 1857.48A − 1672.05B − 482.61B2 | 65.28 + 12.18A − 10.96B − 3.16B2 | <0.0001 | |
| CC-GO | 13,764.35 + 2567.46A − 2311.14B − 667.07B2 | 83.65 + 15.60A − 14.05B − 4.05B2 | <0.0001 | |
| US * | SP-NG | 12,304.77 + 2563.27A − 2518.20B | 56.27 + 11.93A − 11.72B | <0.0001 |
| SP-HO | 19,830.81 + 4131.06A − 4058.43B | 48.75 + 10.16A − 9.98B | <0.0001 | |
| GT-NG | 15,129.45 + 3151.7A − 3096.28B | +36.95 + 7.70A − 7.56B | <0.0001 | |
| GT-GO | 20,275.79 + 4223.76A − 4149.49B | 112.02 + 23.34A − 22.93B | <0.0001 | |
| CC-NG | 8706.21 + 1813.64A − 1781.75B | 57.07 + 11.89A − 11.68B | <0.0001 | |
| CC-TGO | 12,033.91 + 2506.85A − 2462.77B | 73.13 + 15.23A − 14.97B | <0.0001 | |
| BL ** | SP-NG | 10,762.27 + 2613.9A − 1921.75B | 50.09 + 12.17A − 8.94B | <0.0001 |
| SP-HO | 17,344.85 + 4212.66A − 3097.16B | 42.64 + 10.36A − 7.61B | <0.0001 | |
| GT-NG | 13,232.85 + 3213.95A − 2362.91B | 32.32 + 7.85A − 5.77B | <0.0001 | |
| GT-GO | 17,734.05 + 4307.19A − 3166.66B | 97.98 + 23.80A − 17.50B | <0.0001 | |
| CC-NG | 7614.81 + 1849.46A − 1359.73B | 49.92 + 12.12A − 8.91B | <0.0001 | |
| CC-TGO | 10,525.36 + 255,636A − 1879.45B | 63.96 + 15.54A − 11.42B | <0.0001 |
| Pretreatment | Parameters | Optimal Point | Power Plant—Type of Fuel | Optimal Point for CO2 | Optimal Point for NOx | Desirability |
|---|---|---|---|---|---|---|
| Control | Time | 48.96 | SP-NG | 8630.0 | 40.16 | 0.776 |
| Deff | 5.087 × 10⁻¹⁰ | SP-HO | 13,908.6 | 34.19 | ||
| SEC | 13.22 | GT-NG | 10,611.2 | 25.91 | ||
| Eef | 16.92 | GT-GO | 14,220.6 | 78.56 | ||
| Color | 24.54 | CC-NG | 6106.1 | 40.02 | ||
| Shrinkage | 31.48 | CC-TGO | 8440.1 | 51.29 | ||
| Ultrasound | Time | 44.46 | SP-NG | 7218.9 | 33.59 | 0.807 |
| Deff | 5.90 × 10⁻¹⁰ | SP-HO | 11,634.3 | 28.60 | ||
| SEC | 11.35 | GT-NG | 8876.1 | 21.67 | ||
| EE | 19.42 | GT-GO | 11,895.4 | 65.71 | ||
| Color | 19.36 | CC-NG | 5107.7 | 33.48 | ||
| Shrinkage | 26.95 | CC-TGO | 7060.0 | 42.90 | ||
| Blanching | Time | 39.31 | SP-NG | 6225.5 | 28.97 | 0.82 |
| Deff | 6.50 × 10⁻¹⁰ | SP-HO | 10,033.3 | 24.66 | ||
| SEC | 9.79 | GT-NG | 7654.6 | 18.69 | ||
| Eef | 21.98 | GT-GO | 10,258.4 | 56.67 | ||
| Color | 19.08 | CC-NG | 4404.8 | 28.87 | ||
| Shrinkage | 29.13 | CC-TGO | 6088.5 | 37 |
Disclaimer/Publisher’s Note: The statements, opinions and data contained in all publications are solely those of the individual author(s) and contributor(s) and not of MDPI and/or the editor(s). MDPI and/or the editor(s) disclaim responsibility for any injury to people or property resulting from any ideas, methods, instructions or products referred to in the content. |
© 2023 by the authors. Licensee MDPI, Basel, Switzerland. This article is an open access article distributed under the terms and conditions of the Creative Commons Attribution (CC BY) license (https://creativecommons.org/licenses/by/4.0/).
Share and Cite
Taghinezhad, E.; Kaveh, M.; Szumny, A.; Figiel, A. Quantifying of the Best Model for Prediction of Greenhouse Gas Emission, Quality, and Thermal Property Values during Drying Using RSM (Case Study: Carrot). Appl. Sci. 2023, 13, 8904. https://doi.org/10.3390/app13158904
Taghinezhad E, Kaveh M, Szumny A, Figiel A. Quantifying of the Best Model for Prediction of Greenhouse Gas Emission, Quality, and Thermal Property Values during Drying Using RSM (Case Study: Carrot). Applied Sciences. 2023; 13(15):8904. https://doi.org/10.3390/app13158904
Chicago/Turabian StyleTaghinezhad, Ebrahim, Mohammad Kaveh, Antoni Szumny, and Adam Figiel. 2023. "Quantifying of the Best Model for Prediction of Greenhouse Gas Emission, Quality, and Thermal Property Values during Drying Using RSM (Case Study: Carrot)" Applied Sciences 13, no. 15: 8904. https://doi.org/10.3390/app13158904
APA StyleTaghinezhad, E., Kaveh, M., Szumny, A., & Figiel, A. (2023). Quantifying of the Best Model for Prediction of Greenhouse Gas Emission, Quality, and Thermal Property Values during Drying Using RSM (Case Study: Carrot). Applied Sciences, 13(15), 8904. https://doi.org/10.3390/app13158904