1. Introduction
The mechanical performance characteristics of concrete medium are: when external forces reach a certain limit, the concrete medium will undergo abrupt failure without prior warning; it has significant strength asymmetry, with compressive strength far greater than tensile strength; the failure is random and is a typical disordered medium, with an extremely small ultimate strain value during failure; and it exhibits significant rate sensitivity under blast loading. In addition, the process of concrete medium failure under blast loading exhibits significant progressive (dynamic evolution process of failure), grading (scale of fragments), and zoning (mechanical response differences at different distances from the load source) characteristics: the medium in the near zone undergoes violent deformation and shows characteristics of crushing failure; the medium in the middle zone undergoes elastic-plastic deformation, and the degree of fragmentation is relatively larger compared to the medium in the near zone; the medium in the far zone undergoes elastic vibration. Therefore, the mechanical behavior of concrete medium under blast loading is highly complex.
Numerical simulation studies of the concrete medium under blast loading mainly include: the finite element method (FEM), the discontinuous deformation analysis method (DDA), the discrete element method (DEM), the material point method (MPM), etc.
As a relatively mature numerical simulation method, FEM is widely used. Anas et al. discussed the failure modes of concrete under different working conditions by reviewing numerical/analytical studies on air blast loading [
1]. Kristoffersen et al. studied the response of tubular concrete under blast loading [
2]. Jeong et al. simulated the dynamic fracturing and crack propagation processes of brittle materials under blast loading [
3]. Rokhy et al. simulated the explosion characteristics of a hydrogen-air mixture near a concrete barrier [
4]. Wang et al. proposed an Arbitrary Lagrangian Eulerian-FEM-smoothed particle hydrodynamics (ALE-FEM-SPH) coupling method and predicted the damage process of reinforced concrete slabs under explosive loads [
5]. Augusto et al. predicted the fracture mode of reinforced concrete slabs under explosive loads [
6]. Karmakar et al. conducted numerical research on the response of reinforced concrete slabs under explosive loads through a hybrid discretization combining FEM and smoothed particle hydrodynamics (SPH) [
7]. Temsah et al. predicted the dynamic response of blast-loaded reinforced concrete beams and derive the Iso-Damage curve of a reinforced concrete beam exposed to a blast wave [
8,
9]. To solve discontinuous mechanical problems and overcome the limitations of the finite element method, the extended finite element method has been developed in recent years. Baietto et al. analyzed the two-dimensional and three-dimensional contact-type crack expansion based on contact fatigue tests and empirical formulas for friction-type cracks [
10,
11]. However, the FEM often encounters grid distortion or even negative volume problems when solving this problem, resulting in abnormal termination of calculations.
The DDA is a numerical model proposed by Shi for analyzing the motion and deformation of block systems [
12]. DDA is capable of solving problems such as large displacements, large deformations, and discontinuous movements such as slipping, cracking, and rotating. In recent years, scholars have started using this method to simulate the failure process of reinforced concrete structures and have achieved good results [
13,
14]. However, this method is currently limited to simulating two-dimensional problems and is still a certain distance away from simulating three-dimensional problems.
The DEM was first proposed by Cundall in 1971 in the United States and is suitable for solving large displacement and nonlinear problems [
15]. Zhang et al. used a two-dimensional discrete element model to study the failure process of concrete [
16]. Hentz et al. used a three-dimensional discrete element model to study the dynamic behavior of concrete and verified the rate effect of concrete through dynamic tensile tests [
17]. Qin et al. used the discrete element method to establish a two-dimensional concrete model; they further simulated the Brazilian splitting test of concrete and obtained a significant rate effect on the tensile strength of concrete [
18]. Haeri et al. studied the failure process and failure patterns of concrete samples by numerical simulation (particle flow code 2D) [
19]. Wu et al. studied the crack propagation modes and the relationship between kinetic energy and strain energy under different strain rates [
20,
21,
22]. However, the DEM simulates through iterative calculations, which requires a huge amount of computational resources; additionally, this method only uses cohesion to reflect the strength characteristics of the research object when simulating the damage of concrete medium, which is quite different from the actual situation.
Harlow and his Computational Fluid Dynamics (CFD) group at the Los Alamos National Laboratory (LANL) in the United States proposed the Particle-In-Cell (PIC) method in 1955 [
23]. The PIC method uses a dual description, where the fluid is discretized into particles (Lagrangian description), while the computational grid still uses the Eulerian grid. The particles migrate between the Eulerian grid, describing the movement of the fluid. This method can solve a large number of problems that cannot be solved by using only the Lagrangian or Eulerian methods. The MPM evolved from the PIC method. Unlike the numerical simulation methods described above, the MPM combines the advantages of both Lagrangian and Eulerian methods, allowing the material points to move on the background grid and solving the motion equations on the background grid to avoid mesh distortion. It is especially suited to solving large deformation and material fracture problems [
24,
25]. Hu et al. investigated the synergistic effects of blast and fragmentation on structural failure based on the MPM [
26]. Lei et al. developed a hybrid staggered grid finite element material point method (HSGFEMP), which was verified by numerical examples [
27].
To enhance the accuracy of simulating concrete medium damage under blast loading, this study employed the MPM due to its superiority in simulating large deformation and material fracture problems. Firstly, an MPM simulation program was developed based on the MPM theory using the C++ programming language. Next, the Split-Hopkinson Pressure Bar (SHPB) experimental device was utilized to subject concrete specimens to both compression and splitting loads. By varying the loading rate, the concrete specimens were induced into different destructive states. Subsequently, the yield strength of the concrete specimens was analyzed under varying strain rate conditions. Based on these findings, an improved approach to the HJC model was proposed. Finally, the improved HJC model was embedded into the simulation program, and its effectiveness was further investigated through a case study involving a contact explosion on a plain concrete slab.
2. Basic Theory of the MPM
The MPM discretizes the continuum into a series of material points; each material point represents a material region and carries all the material information of that region, such as mass, velocity, stress, and strain. The collection of all material points represents the entire material area. Therefore, the density of the continuum can be approximated as:
In the equation, represents the total number of material points, is the mass of the material point, is the Dirac Delta function, and represents the coordinates of the material point.
Similar to the FEM, the solution format of the MPM is also based on the weak form. The solution format of the MPM is as follows:
In the equation, is the density, is the acceleration, is the force acting on the unit mass of the object, is the solving area, is the given surface force boundary, is the comparing stress, and is the comparing boundary surface force.
Substituting Equation (1) into Equation (2), it can be obtained:
In the equation, , , , , , is used to introduce a hypothetical boundary layer thickness in order to convert the final term of the left-hand side boundary integral in Equation (2) into a volume integral. As shown in Equation (3), the material point method converts the integrals in Equation (2) into the product of the value of the integrand at each material point and the volume represented by the material point, which is a form of point integration.
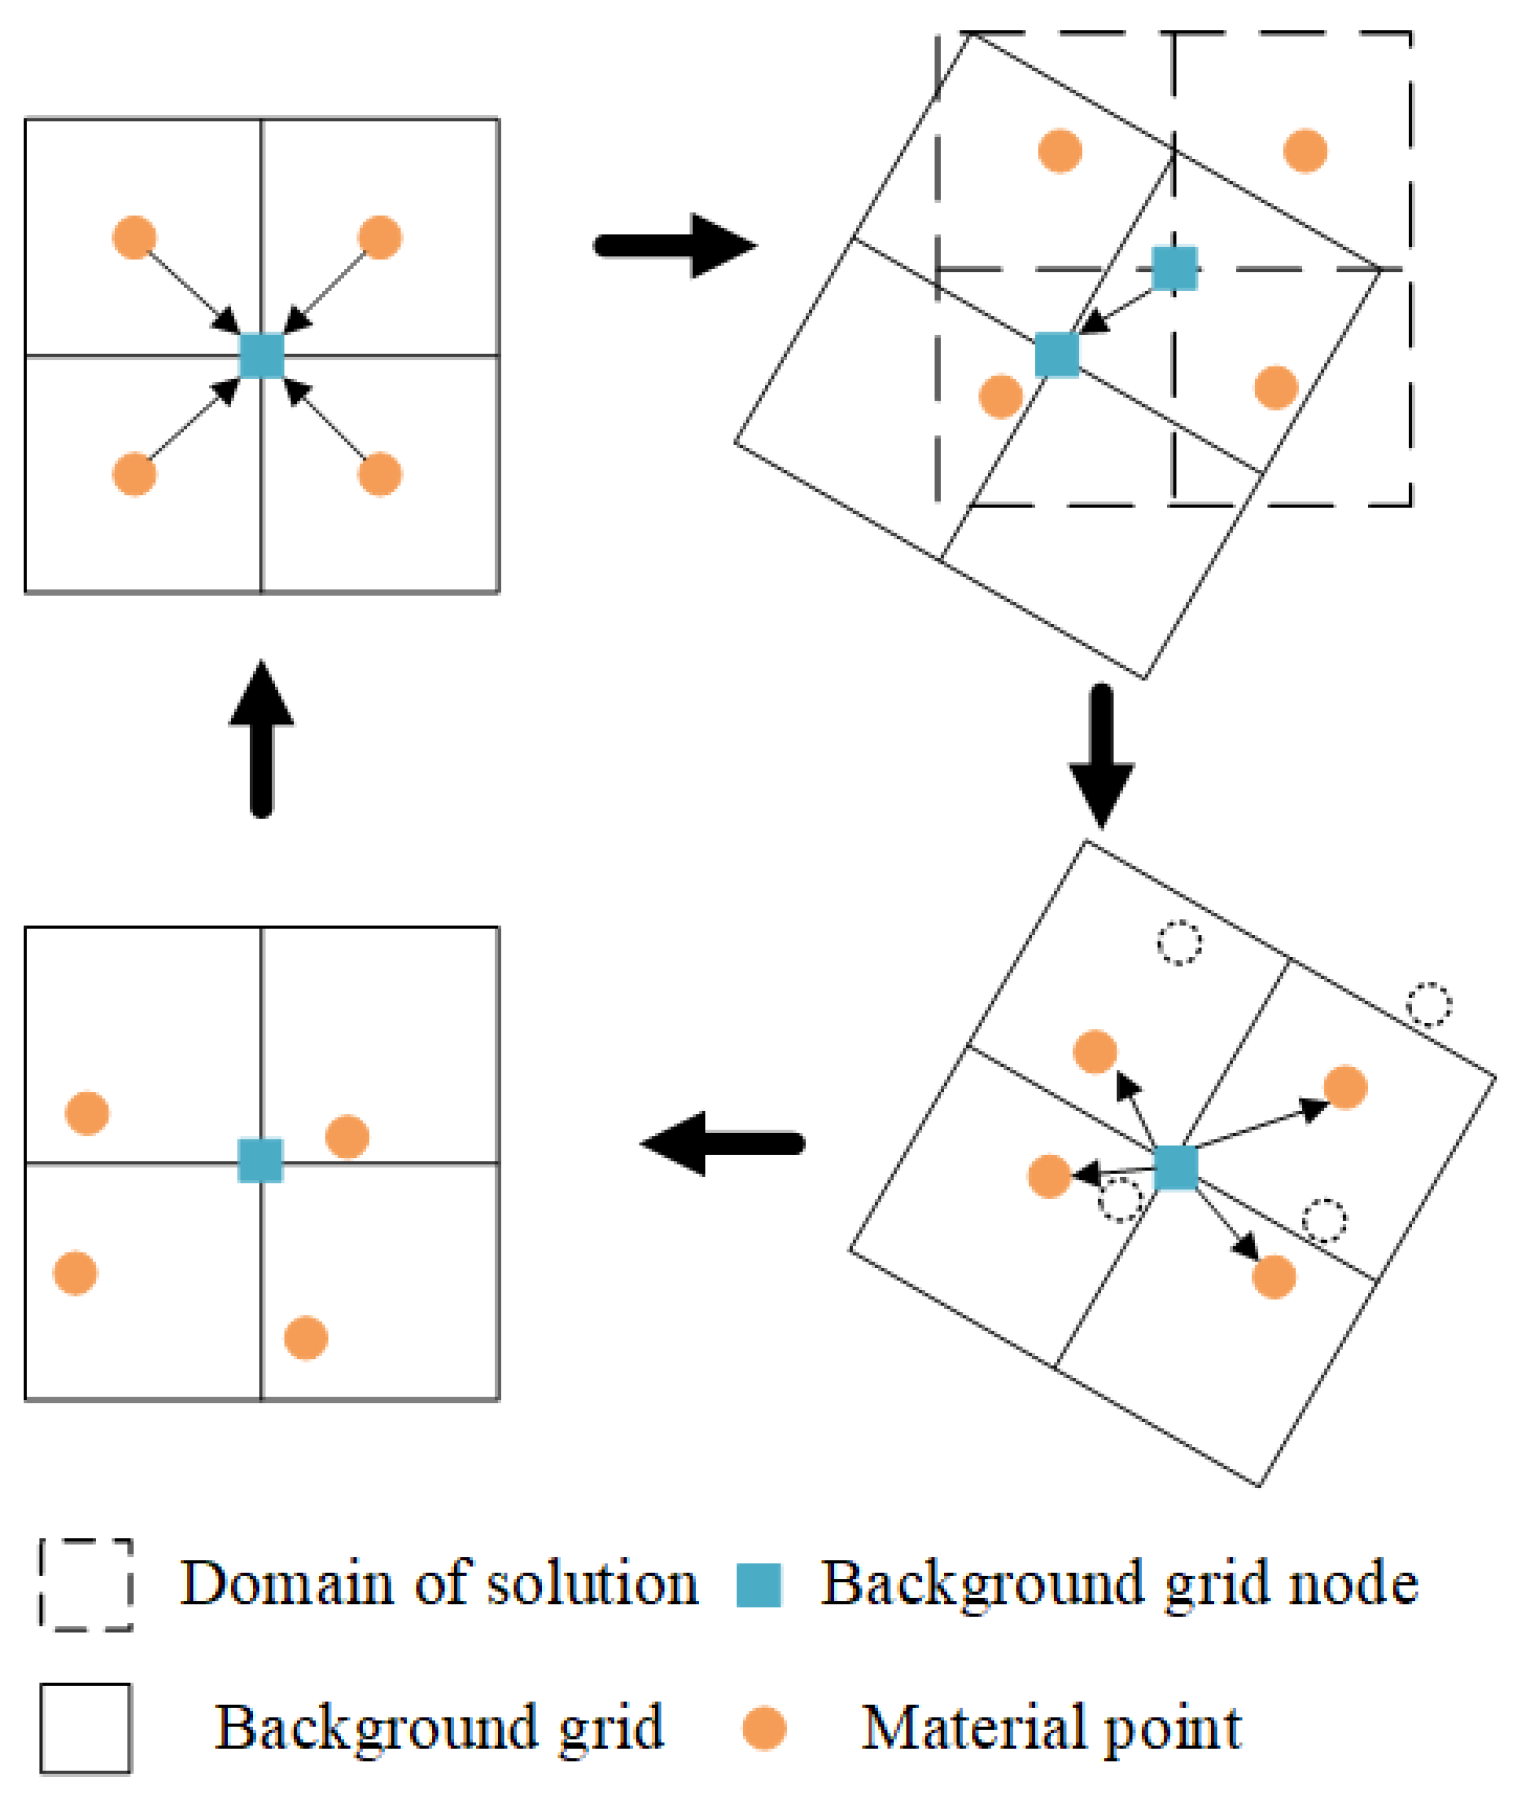
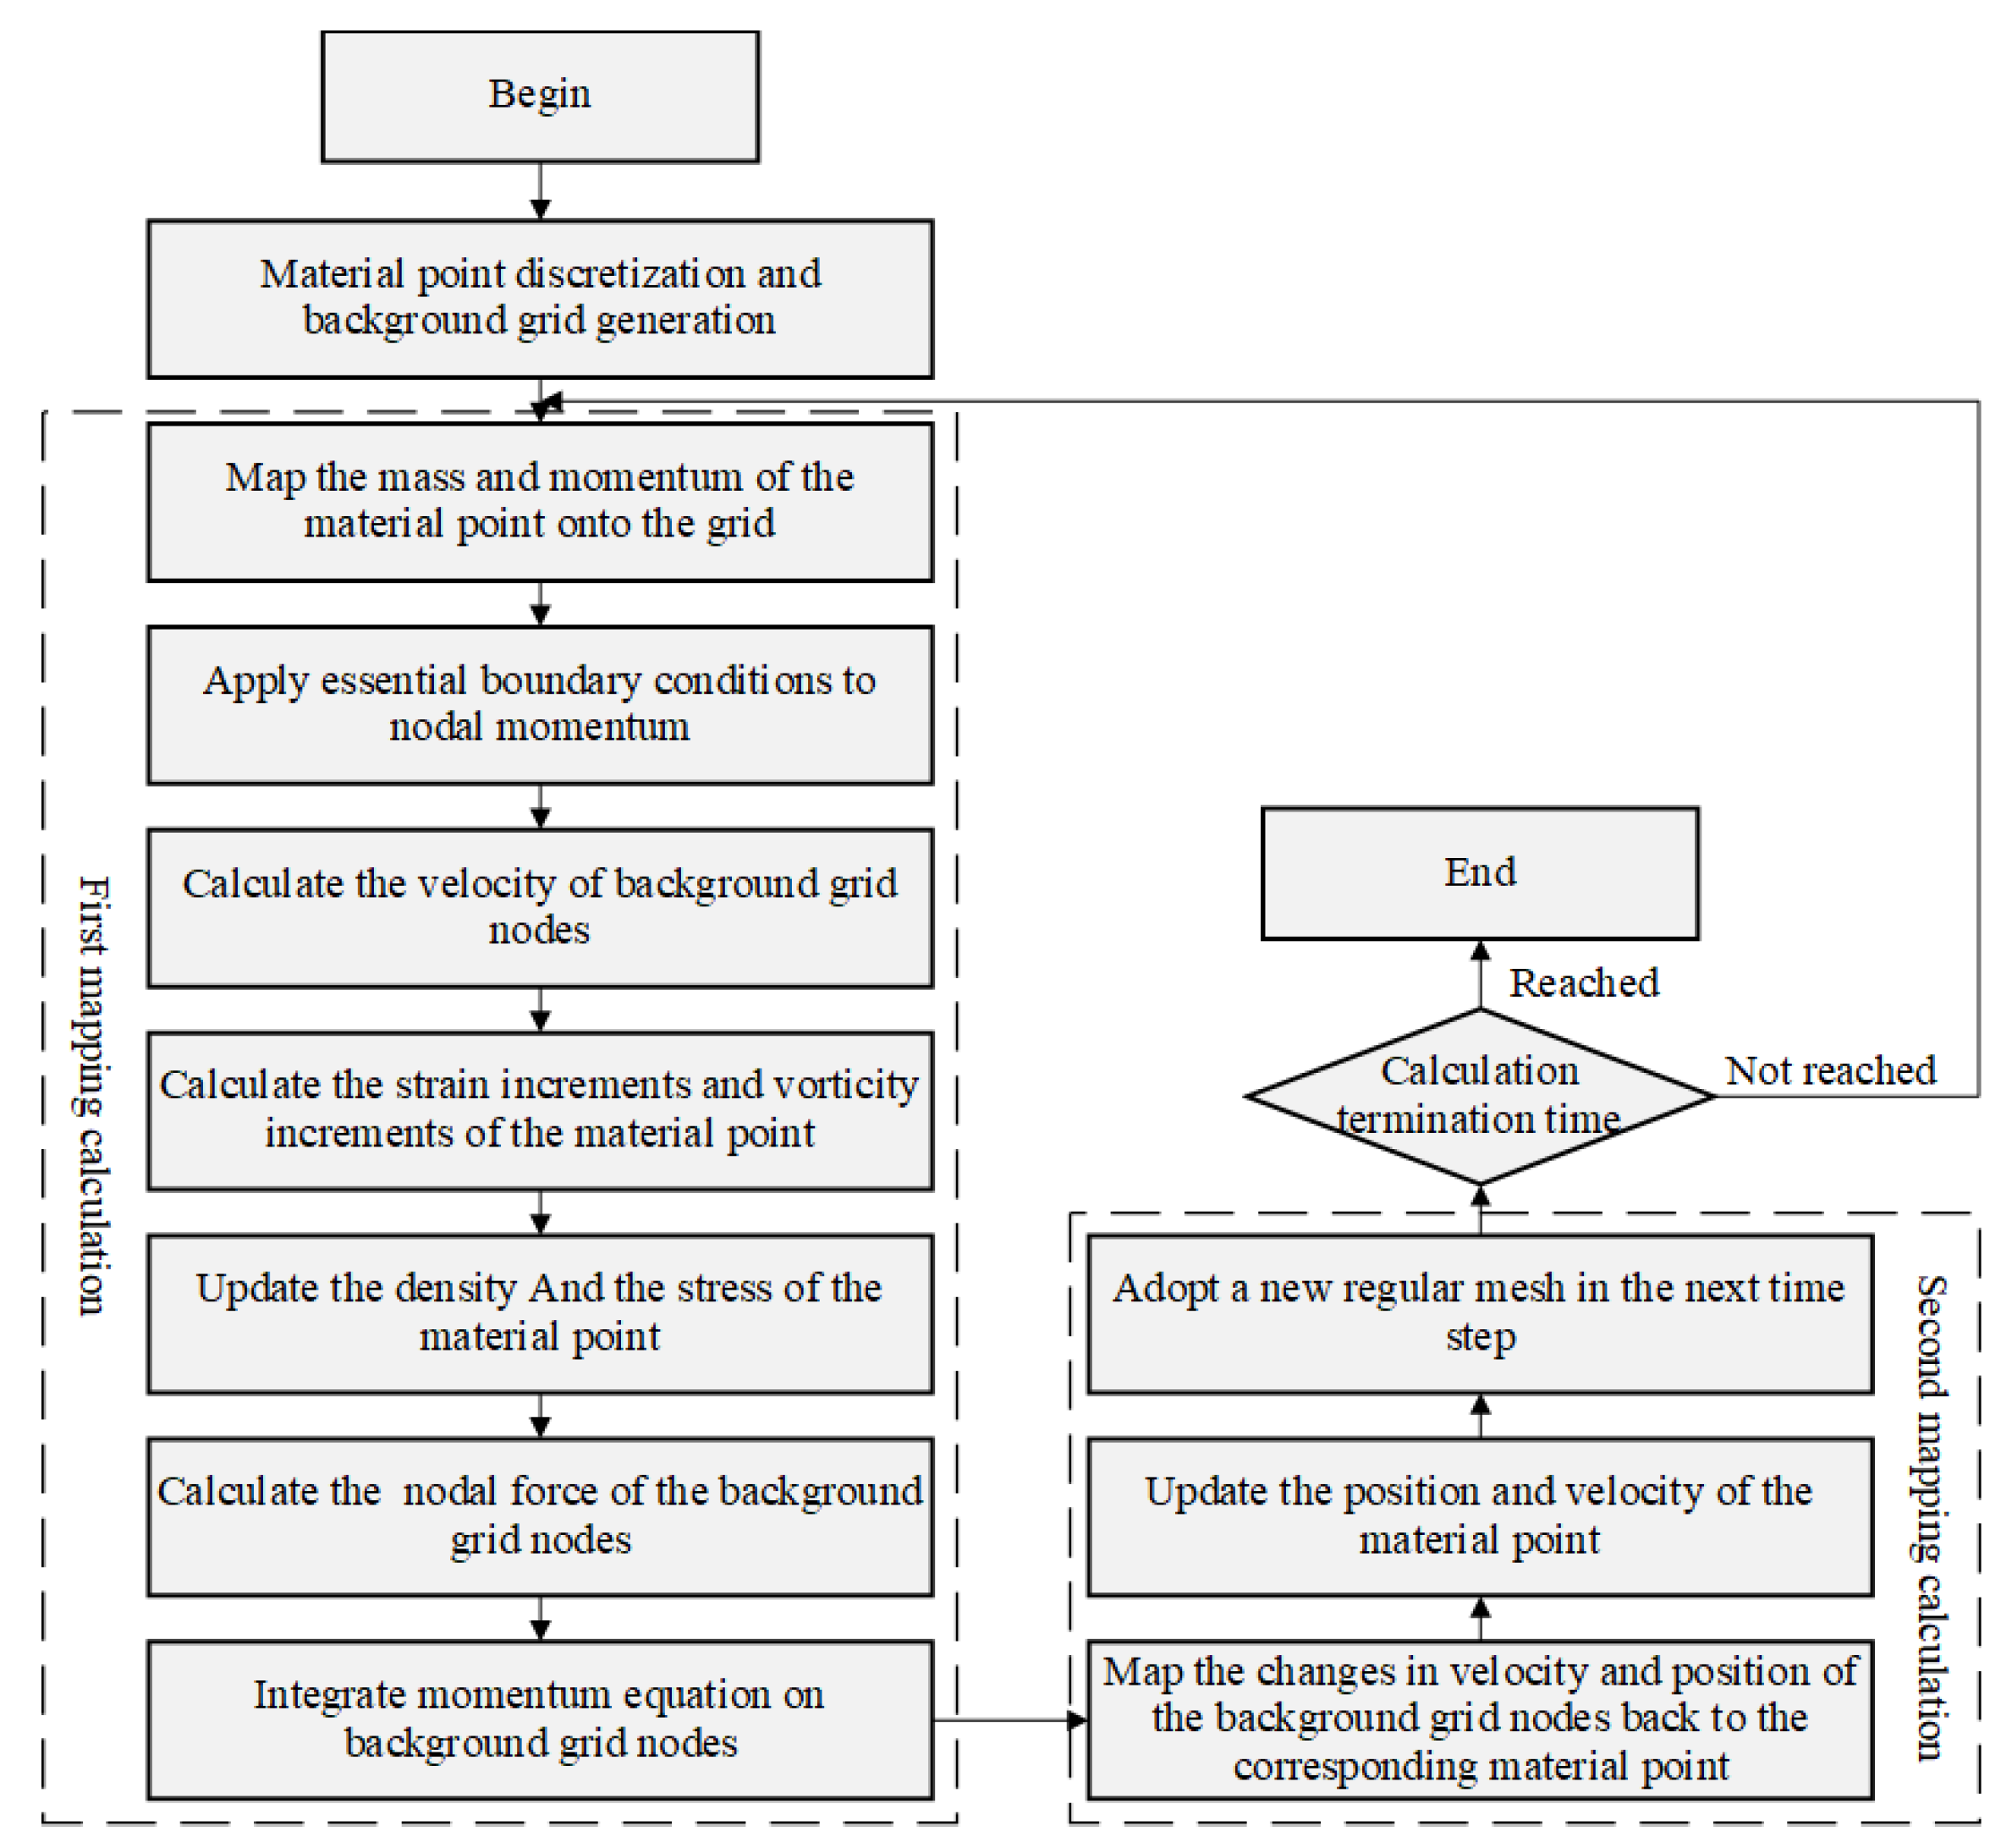
The MPM arranges a background grid for the material domain and approximately solves the momentum equation using the virtual work principle. Within one computational time step, the mass and momentum of the material points are first mapped to the nodes of the background grid using shape functions to calculate the mass and momentum of the background grid nodes. Furthermore, the momentum equation is integrated at the background grid nodes, and the change in velocity and position of the background grid nodes is mapped back to the material points using shape functions to update their velocity and position. Finally, the deformed background grid is discarded, and the regular background grid is used again in the next time step. The solution process of the MPM within one computational time step is shown in
Figure 1, and the MPM calculation algorithm is shown in
Figure 2.
3. An Improved HJC Model Considering the Segmentation of the DIF Function
3.1. HJC Model
The HJC model was proposed by Holmquist et al. [
28]. This model proposes corresponding state equations and yield functions for concrete under high confinement pressure and large deformation at high strain, which can effectively simulate the mechanical behavior of concrete materials under high-speed impact while reasonably considering the damage and failure of concrete during this process. The equation of the yield surface is shown in
Figure 3,
is the normalized yield stress,
is the normalized maximum hydrostatic tensile stress,
is the normalized pressure,
is the dimensionless equivalent strain rate (
is the reference strain rate).
The yield stress of the HJC model is:
In the equation, is the dynamic increasing factor, is the normalized yield stress, is the yield stress, is the unconfined compressive strength, is the damage factor (), is the normalized cohesive material strength, is the normalized pressure hardening coefficient, is the pressure hardening index, and is the strain rate coefficient.
The HJC model comprehensively considers the hydrostatic pressure effect and strain rate effect of concrete materials, as well as damage evolution caused by plastic strain and plastic volumetric strain. However, the HJC model itself still has certain shortcomings: (1) The model cannot well describe the failure mode dominated by tensile failure; (2) The influence of the third deviatoric stress invariant on the strength surface has not been considered; and (3) The strain hardening behavior of concrete materials has not been taken into account.
In response to these deficiencies, researchers have made some improvements to the HJC model to improve its calculation accuracy under different loading conditions. Polanco-Loria et al. modified the HJC model by considering the hydrostatic pressure effect, the third deviatoric stress invariant, and the tensile-compression-shear composite damage. They used the improved HJC model to calculate uniaxial compression, biaxial compression, strain softening, and projectile penetration effects on concrete targets and compared the results with other experimental results as well as the original HJC model calculation results [
29]. Islam et al. mainly modified the strain rate effect part of the HJC model based on the experimental results of the dynamic increasing factor (DIF) of concrete material strength growth. At the same time, they considered the temperature effect in the HJC model, used the improved HJC model to calculate an example of projectile penetration into a concrete target, and compared it with the original HJC model [
30]. Zhang et al. corrected the deficiency of the tension damage model in the HJC model and verified the improved model through a 2-D program [
31].
3.2. The Improved Method of the HJC Model
In addition to the above shortcomings, a large number of research results have shown that the HJC model can well reflect the influence of low strain rates on the dynamic strength of concrete but cannot accurately describe the significant enhancement effect of concrete dynamic strength under high strain rate conditions. That is, the dynamic strength calculated by the DIF function in the HJC model under high strain rate conditions deviates greatly from experimental results.
Therefore, based on the Hopkinson bar, this article carried out dynamic uniaxial compression and dynamic split tension experiments on concrete to obtain the dynamic compressive and tensile strengths of concrete under high strain rates and improved the DIF function in the HJC model in combination with experimental data, making it have segmentation. That is, there is a critical strain rate. When the strain rate is lower than the critical strain rate, the strain rate effect on the strength of concrete is not obvious, but when the strain rate is higher than the critical strain rate, the degree to which the strength of concrete increases with the strain rate is significantly improved.
The SHPB experiment is the primary method of studying the mechanical properties of materials at high strain rates (10
2~10
4 s
−1). A modern conventional SHPB consists of a gas gun (cannon or launching device), a bullet, an incident bar, a transmission bar, an energy absorption device, and a data acquisition system (as shown in
Figure 4).
Large cubic concrete samples were cast for core drilling. At the end of the 28-day curing period, the mass concrete specimens were sent to a professional processing plant, where they were cored, cut to size, and ground. It was then processed into Φ50 mm × 25 mm disc-shaped specimens (as shown in
Figure 5). The two loading sections of the processed specimens are smooth enough and have parallelism within the tolerance range of 0.01 mm. The dynamic compression and dynamic Brazilian splitting experiments were carried out by the SHPB experimental device.
Throughout the experiment, it is required that the cross-sectional area of the specimen always be smaller than or equal to that of the rod. In addition, the incident rod must be long enough (more than twice the length of the bullet) to avoid overlapping of incident and reflected waves, and the material must remain within the elastic range during the experiment. To improve the accuracy of the test, it is also required that the contact surface between the rod and the specimen remain flat and parallel to each other throughout the experiment.
The concrete specimen is loaded between the incident and transmission bars. The bullet is propelled by high-pressure gas and is fired from the launching device at a certain velocity, striking the incident bar and generating a pressure pulse in the incident bar known as the incident wave (measured by the resistance strain gauge attached to the incident bar). The pressure pulse propagates forward in the incident bar, and when it reaches the interface between the incident bar and the specimen, the entire specimen is compressed due to the inertial effect of the specimen and the transmission bar. Meanwhile, due to the wave impedance difference between the bar and specimen, the incident wave is partially reflected as a reflected wave back to the incident bar, and the other part passes through the specimen as a transmission wave and enters the transmission bar. The reflected wave is also measured by the resistance strain gauge attached to the incident bar, and the transmission wave is measured by the resistance strain gauge attached to the transmission bar. By processing the measured incident wave, reflected wave, and transmission wave, the deformation and failure of the material can be obtained, as can the dynamic performance data of the material.
To comprehensively consider the effect of strain rate on the dynamic compressive strength and dynamic tensile strength, the compression dynamic increasing factor and the tensile dynamic increasing factor were separately defined. The compression dynamic increasing factor (
) was defined as:
The tensile dynamic increasing factor (
) was defined as
In the equation, is the dynamic uniaxial compressive strength, is the quasi-static uniaxial compressive strength, is the dynamic uniaxial tensile strength, and is the quasi-static uniaxial tensile strength.
3.2.1. Calculation Expression of the
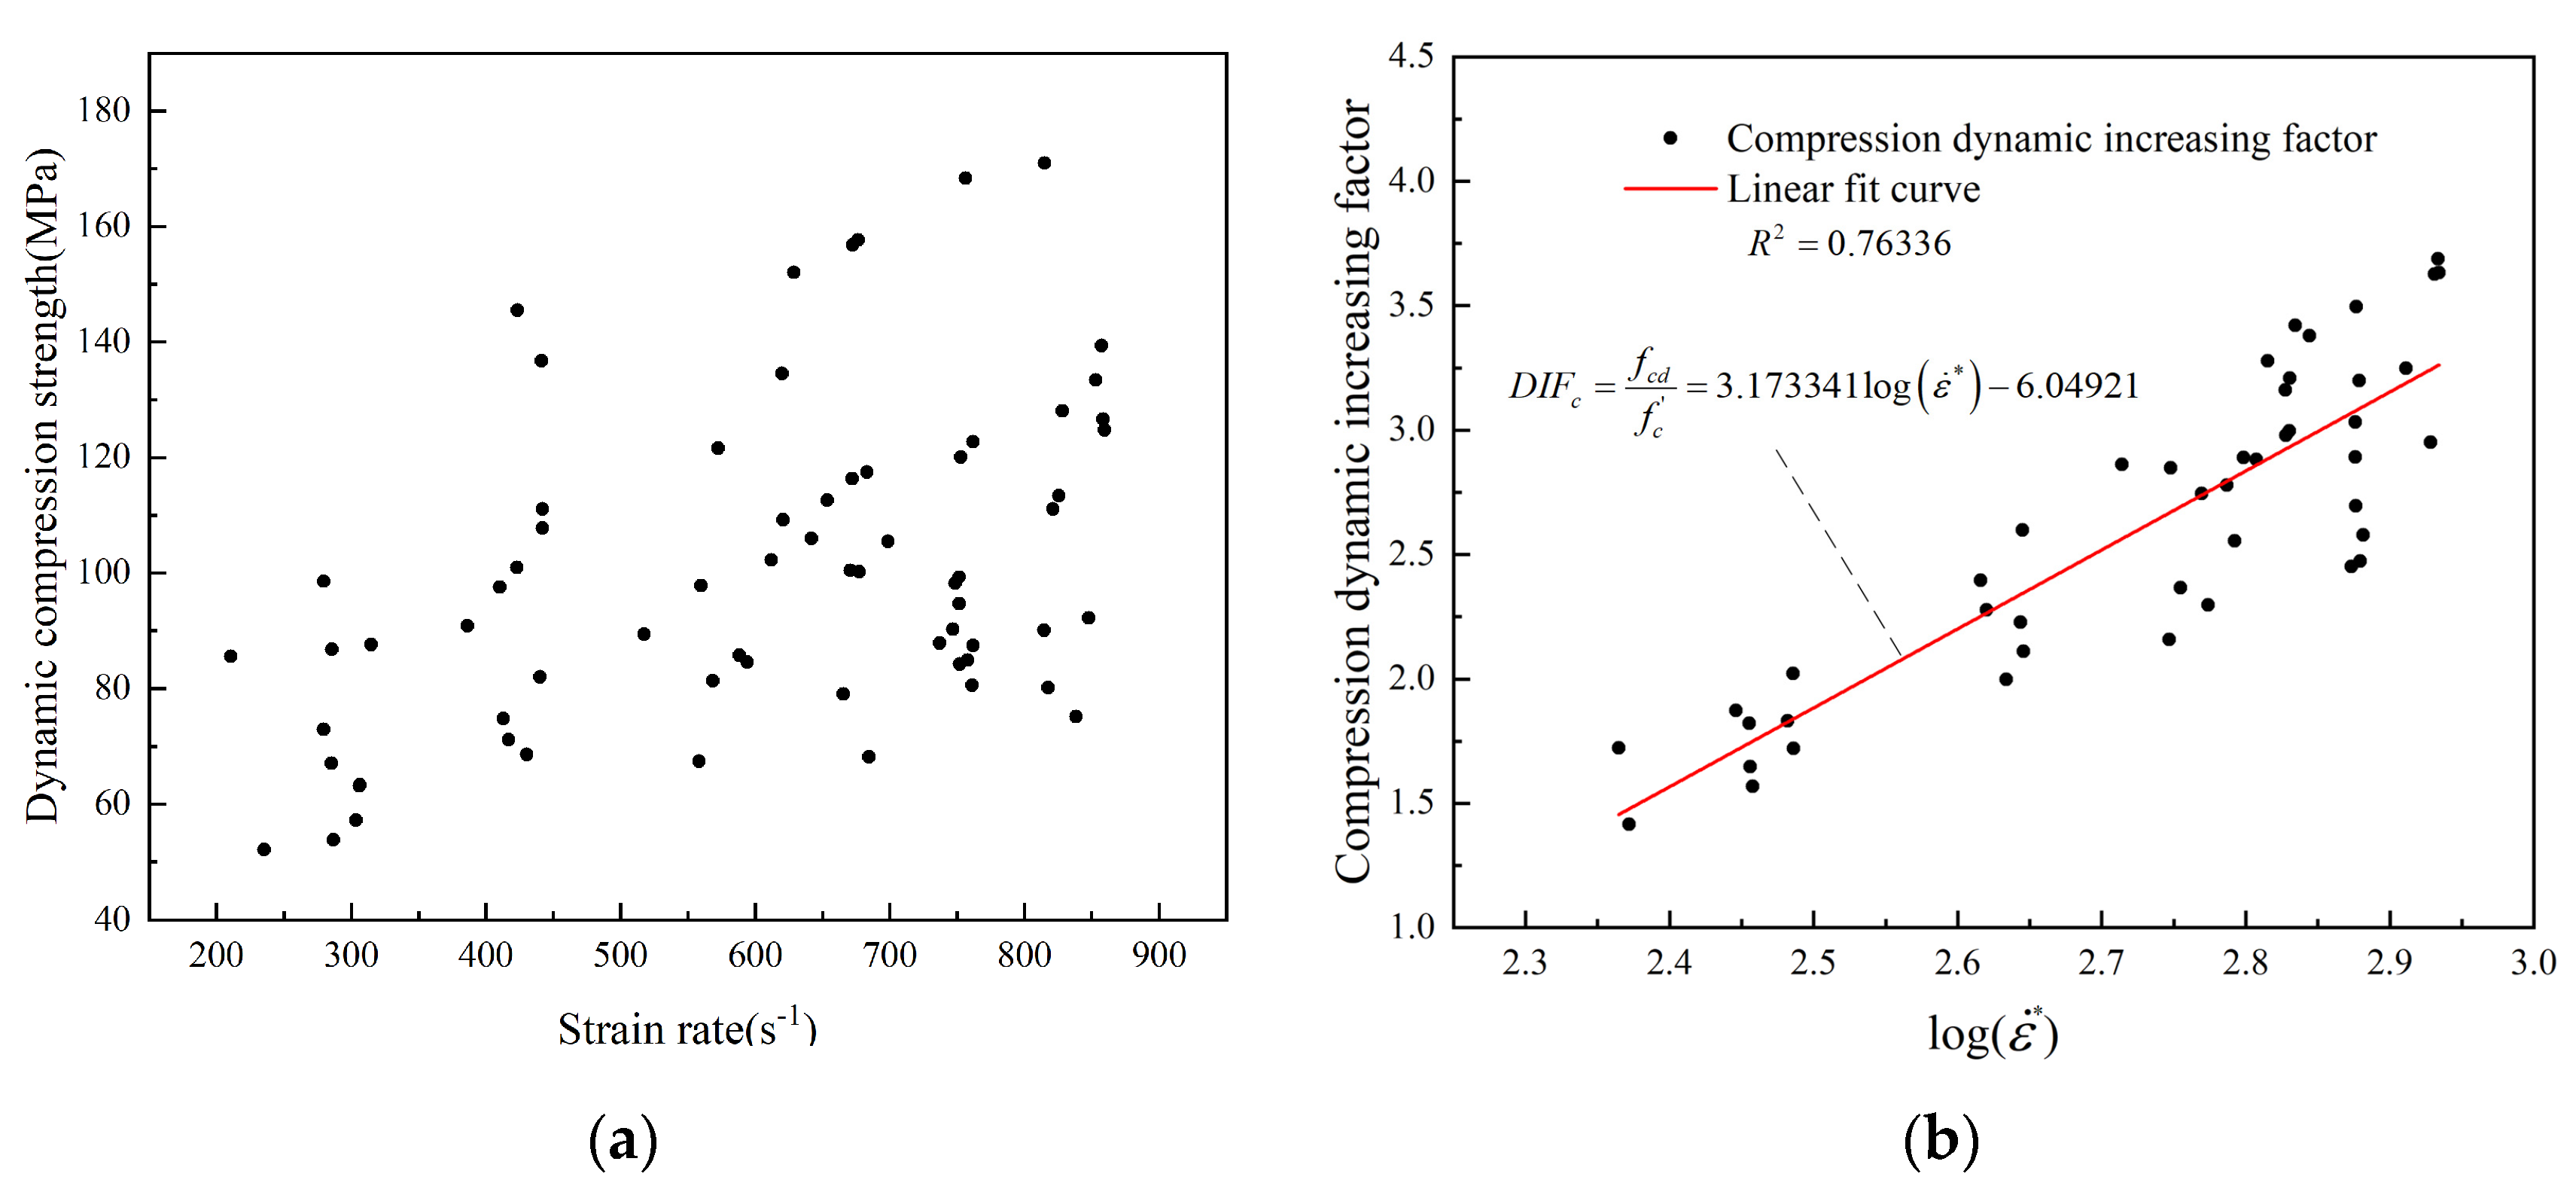
At the end of the dynamic compression experiments, the dynamic compressive strength under different strain rate conditions was plotted as a scatter plot according to the experimental results, as shown in
Figure 6a. The data were then fitted to the experimental results using a variety of function forms in the Origin software with 9.1 version, such as the linear function, the Boxlucas1 function, the Explp1 function, the Parabola function, and the PWL2 function, and the expressions for each function form are shown in
Table 1. Where
A, B, C, D, and
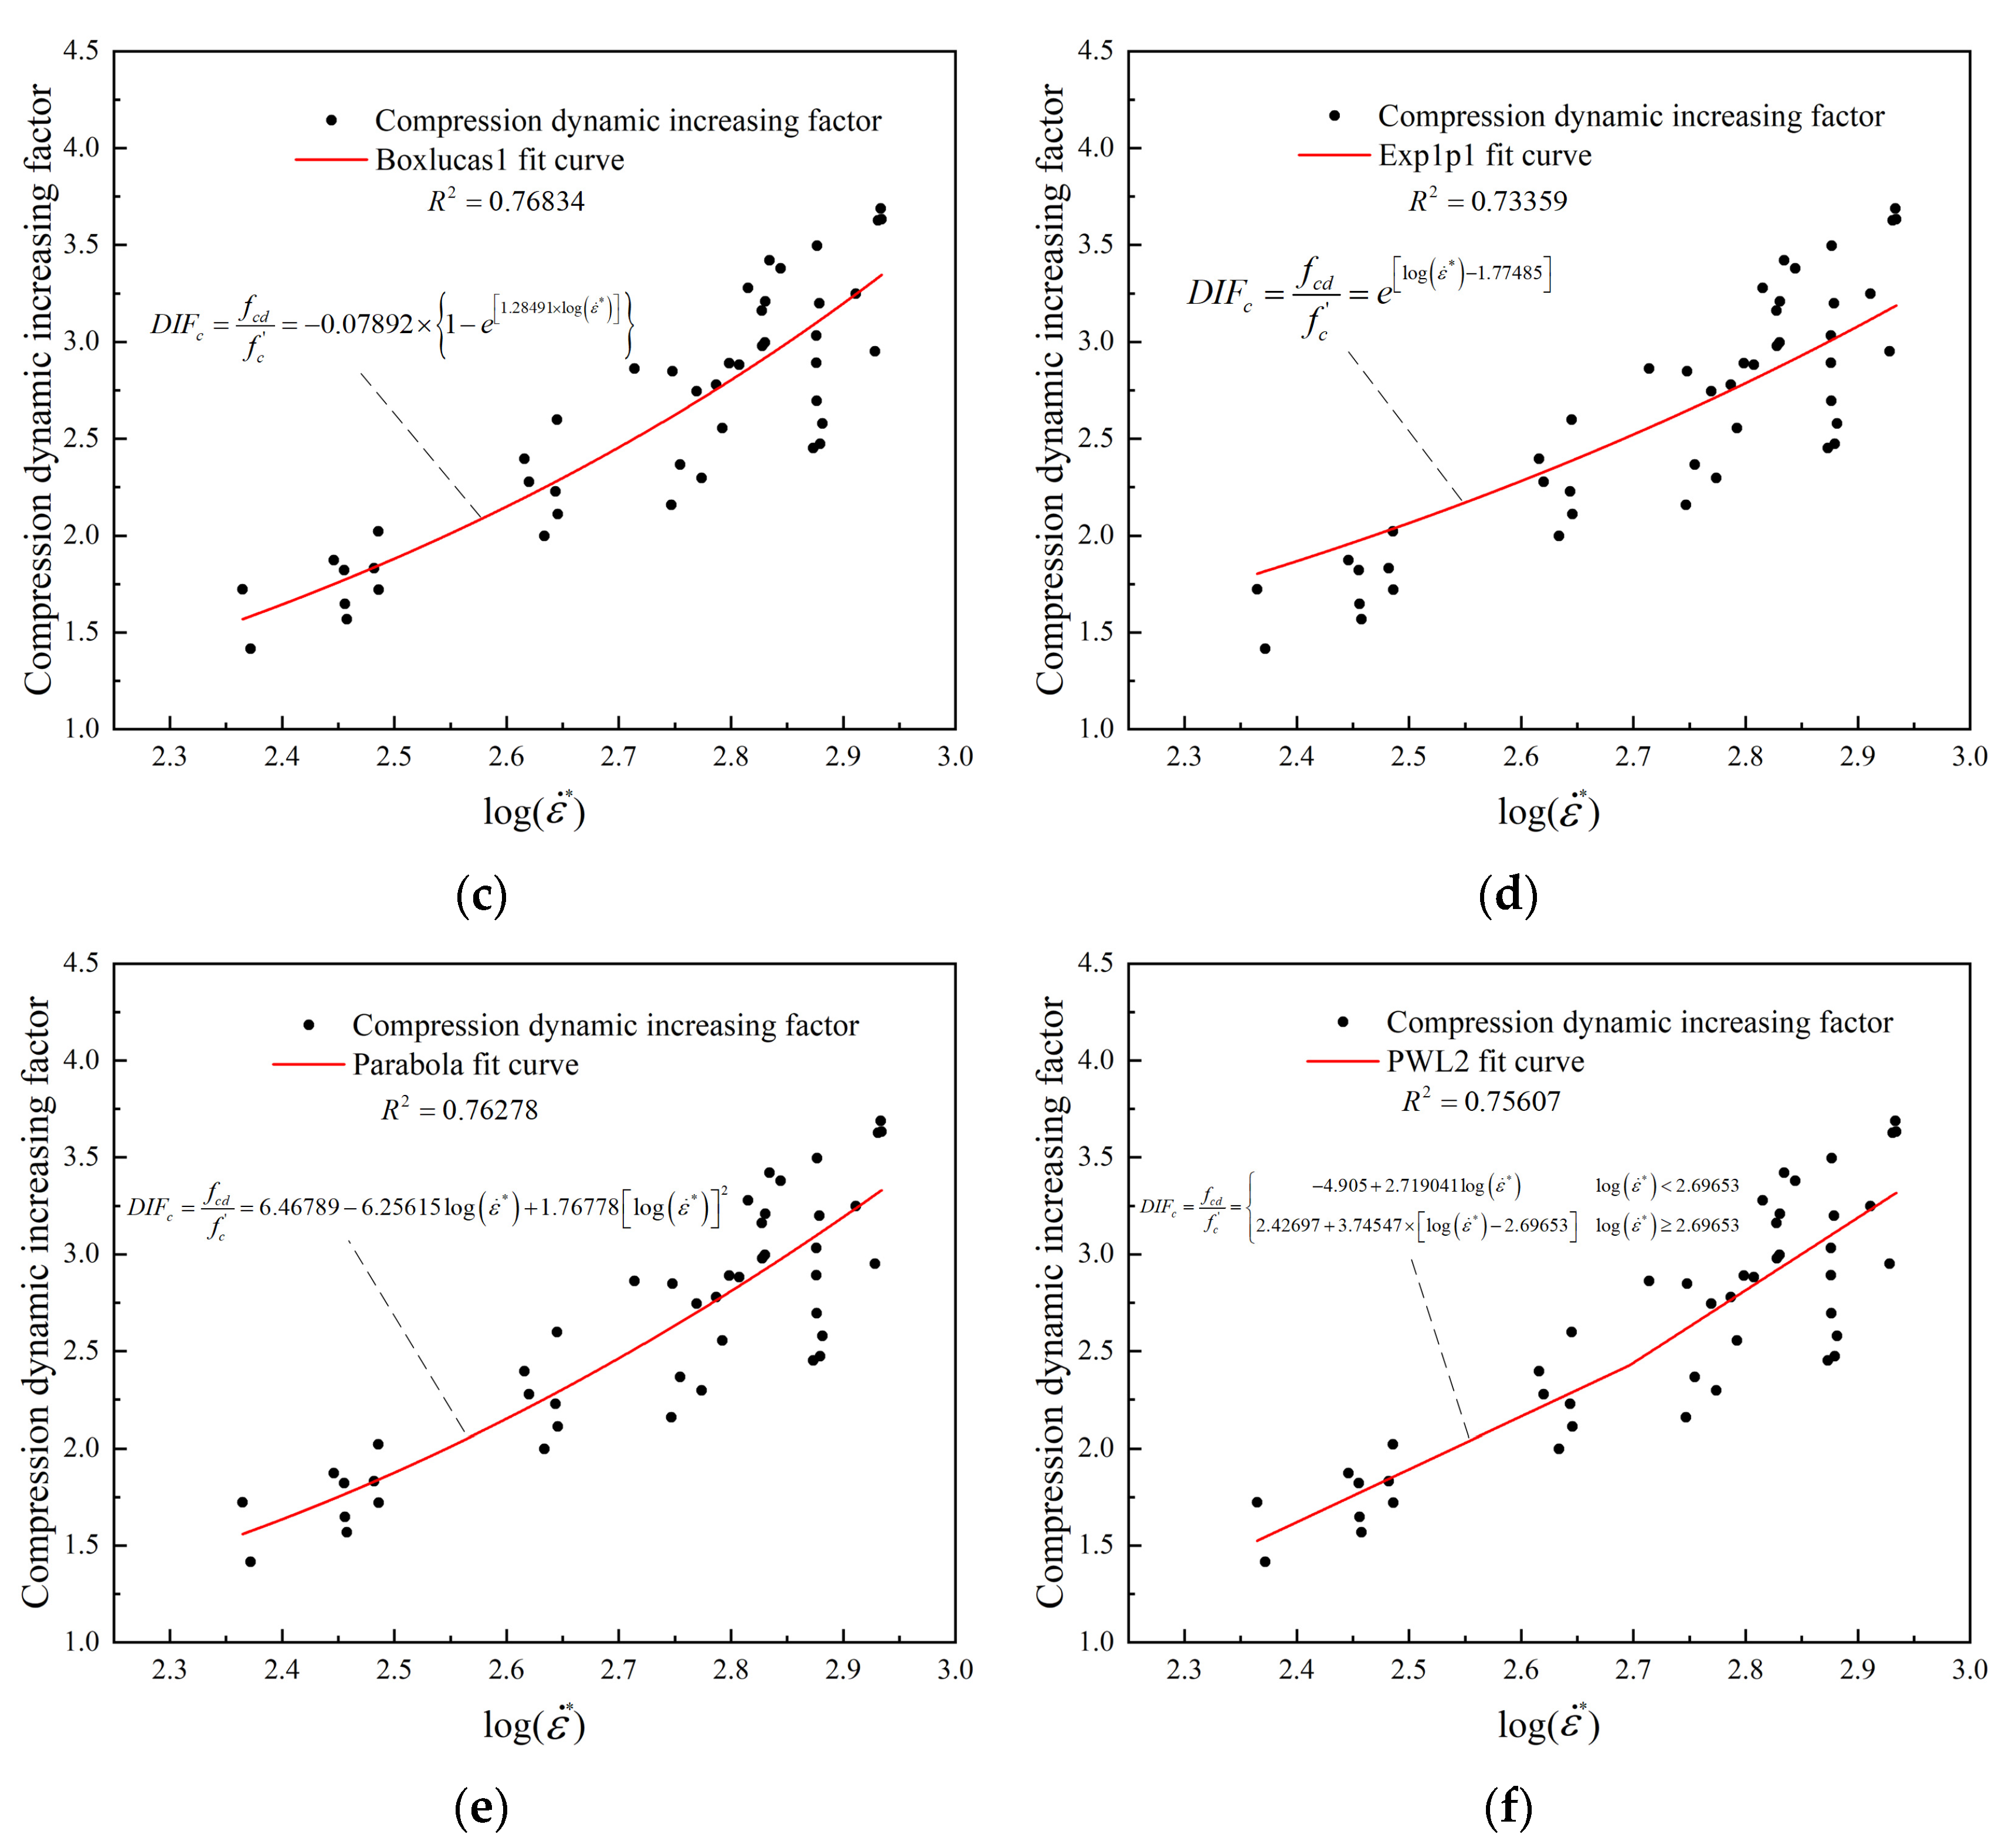
E are the fitting coefficients. Note that before fitting the data, it is necessary to eliminate some of the large scatter of “bad data points”. The results of fitting the coefficients for increasing dynamic compressive strength to different functional forms are shown in
Figure 6b–f.
It can be seen that the Boxlucas1 function has the highest goodness of fit compared to the other functional forms when the goodness of fit of the different functional forms is analyzed and compared. Therefore, to describe the compression dynamic increasing factor with greater accuracy, the Boxlucas1 function is used. Meanwhile, it is not difficult to see that the dynamic compressive strength of concrete is significantly enhanced under blast loading when analyzing the dynamic compressive strength scatter plots and various types of data fitting plots. Here, we define this property as the “strain rate segmentation characteristic” of the dynamic compressive strength of concrete.
Based on the consideration of the “strain rate segmentation characteristic”, the expression of the compression dynamic increasing factor is proposed as follows:
In the equation, is the formula for calculating the dynamic increasing factor in the HJC model, is the strain rate, and is the dimensionless equivalent strain rate ( is reference strain rate).
3.2.2. Calculation Expression of the
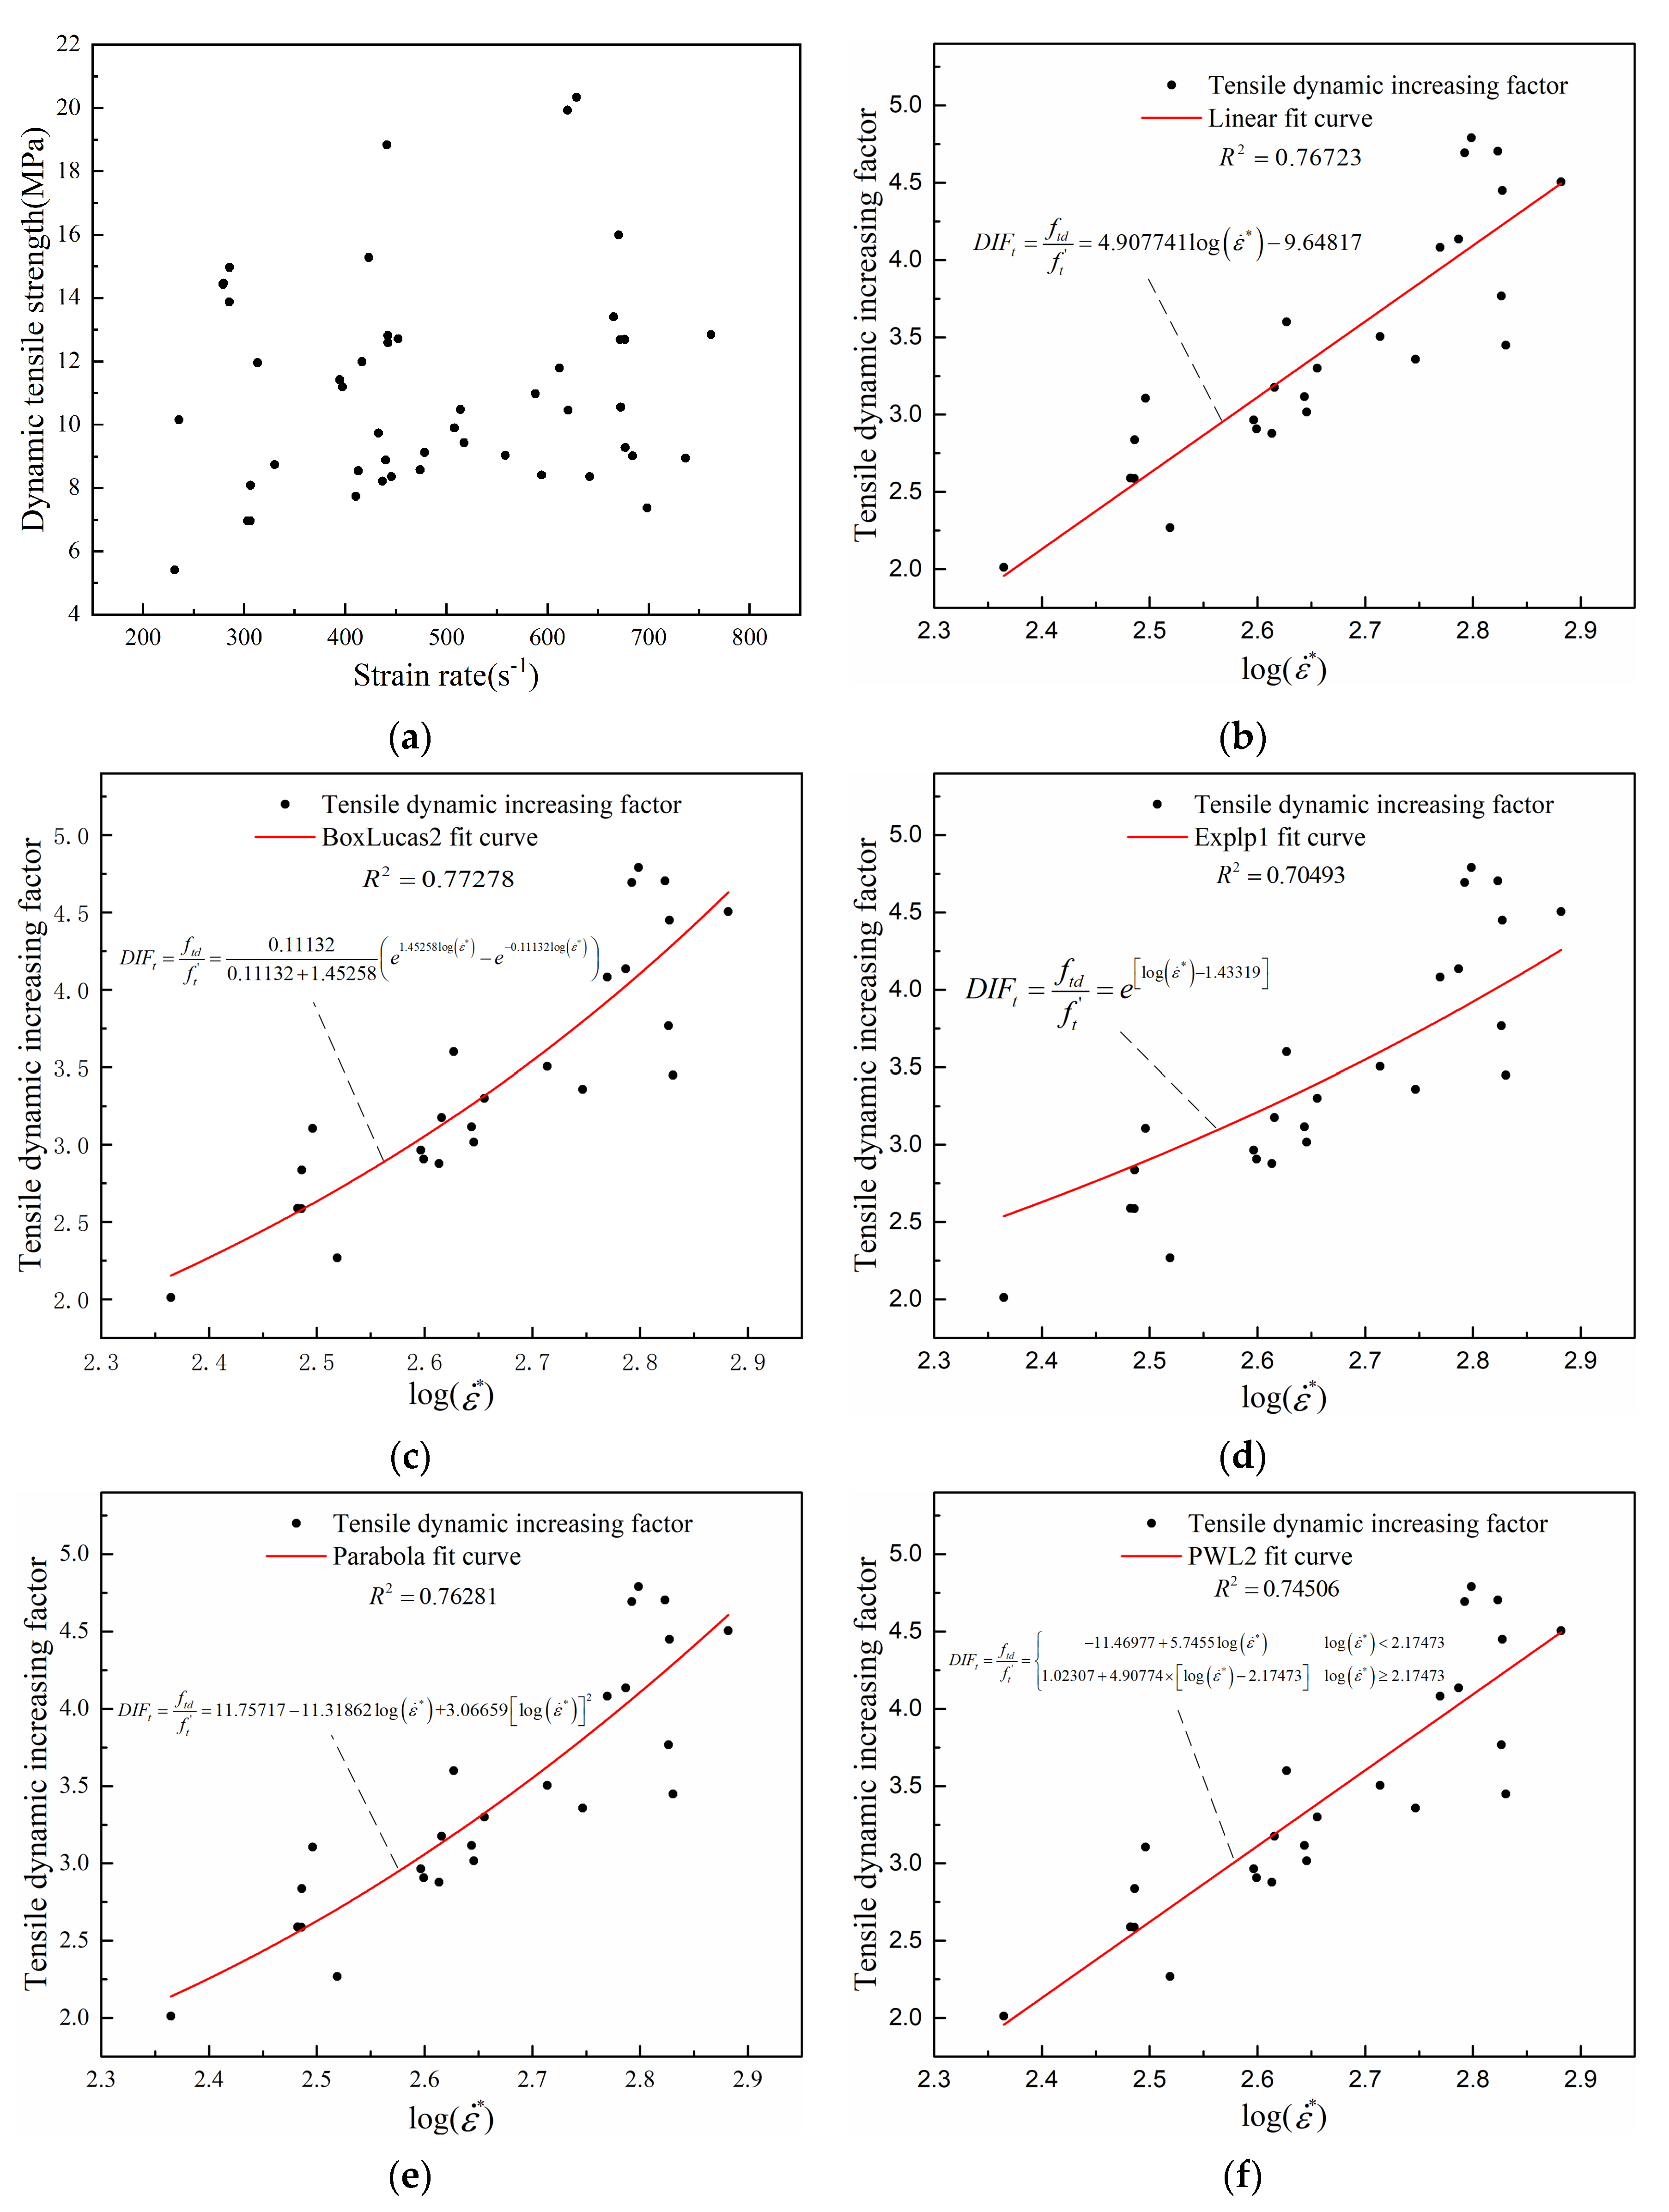
At the end of the Brazilian dynamic splitting experiments, the dynamic tensile strength under different strain rate conditions was plotted as a scatter plot by the experimental results, as shown in
Figure 7a. Several functional forms, including the linear function, the Boxlucas2 function, the Explp1 function, the parabola function, and the PWL2 function, were fitted to the experimental results, and the expressions for each function form are shown in
Table 1.
Figure 7b–f shows the results of fitting the tensile dynamic increasing factor for different functional forms.
It can be seen that the Boxlucas2 function has the highest goodness of fit compared to the other functional forms when analyzing and comparing the goodness of fit of the different functional forms. The Boxlucas2 function is therefore a more accurate description of the tensile dynamic increasing factor. In addition, analysis of the dynamic tension plot and various data fitting plots shows that the dynamic tension of concrete, like dynamic compression, also exhibits the “strain rate segmentation property”.
Based on the consideration of the “strain rate segmentation characteristics”, the expression of the tensile dynamic increasing factor is proposed as follows:
In the equation, is the formula for calculating the dynamic increasing factor in the HJC model, is the strain rate, and is the dimensionless equivalent strain rate ( is reference strain rate).
Based on this research, the HJC model has been improved, and an improved expression for yield stress has been obtained as follows:
In the equation, is the normalized maximum static tensile stress, and the other symbols are explained in the previous text.
4. Numerical Example
The improved HJC model was embedded into the MPM simulation program, and its effectiveness was investigated through a numerical example. The numerical example is a contact explosion experiment on a plain concrete slab carried out by Dua et al. [
32]. The dimension of the concrete slab is 750 mm × 750 mm × 75 mm. The concrete slab was reinforced with 12-mm-diameter rebar mesh spaced at 100 mmc/c each way at the top and bottom with a 30-mm cover. The concrete slab was supported on a 900-mm-high steel frame without edge fixity. Experimental tests were performed to investigate both failure modes by subjecting the concrete slab to the contact explosion effects of 500 g of TNT. The experiment result is shown in
Figure 8.
The numerical model was established first before using the program to solve this problem. The material points were used to discretize the charge and concrete slab, and a background grid was generated. The spacing between material points of the charge was set to 0.005 m, resulting in a total of 2184 material points. The spacing between material points of the concrete slab was also set to 0.005 m, producing a total of 339,684 material points. The range of the background grid was set to X: 0.0 m~0.75 m, Y: 0.0 m~0.75 m, and Z: −0.8 m~0.3 m, with a spacing of 0.01 m. Boundary conditions were applied to the concrete slab using the background grid, with the length and width being fixed and the thickness being free. The explosive calculation model in contact with the concrete slab is shown in
Figure 9.
The improved HJC model was used for the plain concrete slab, and the high-energy explosive model and JWL state equation were used for the charge. The model parameter values are shown in
Table 2,
Table 3,
Table 4,
Table 5 and
Table 6.
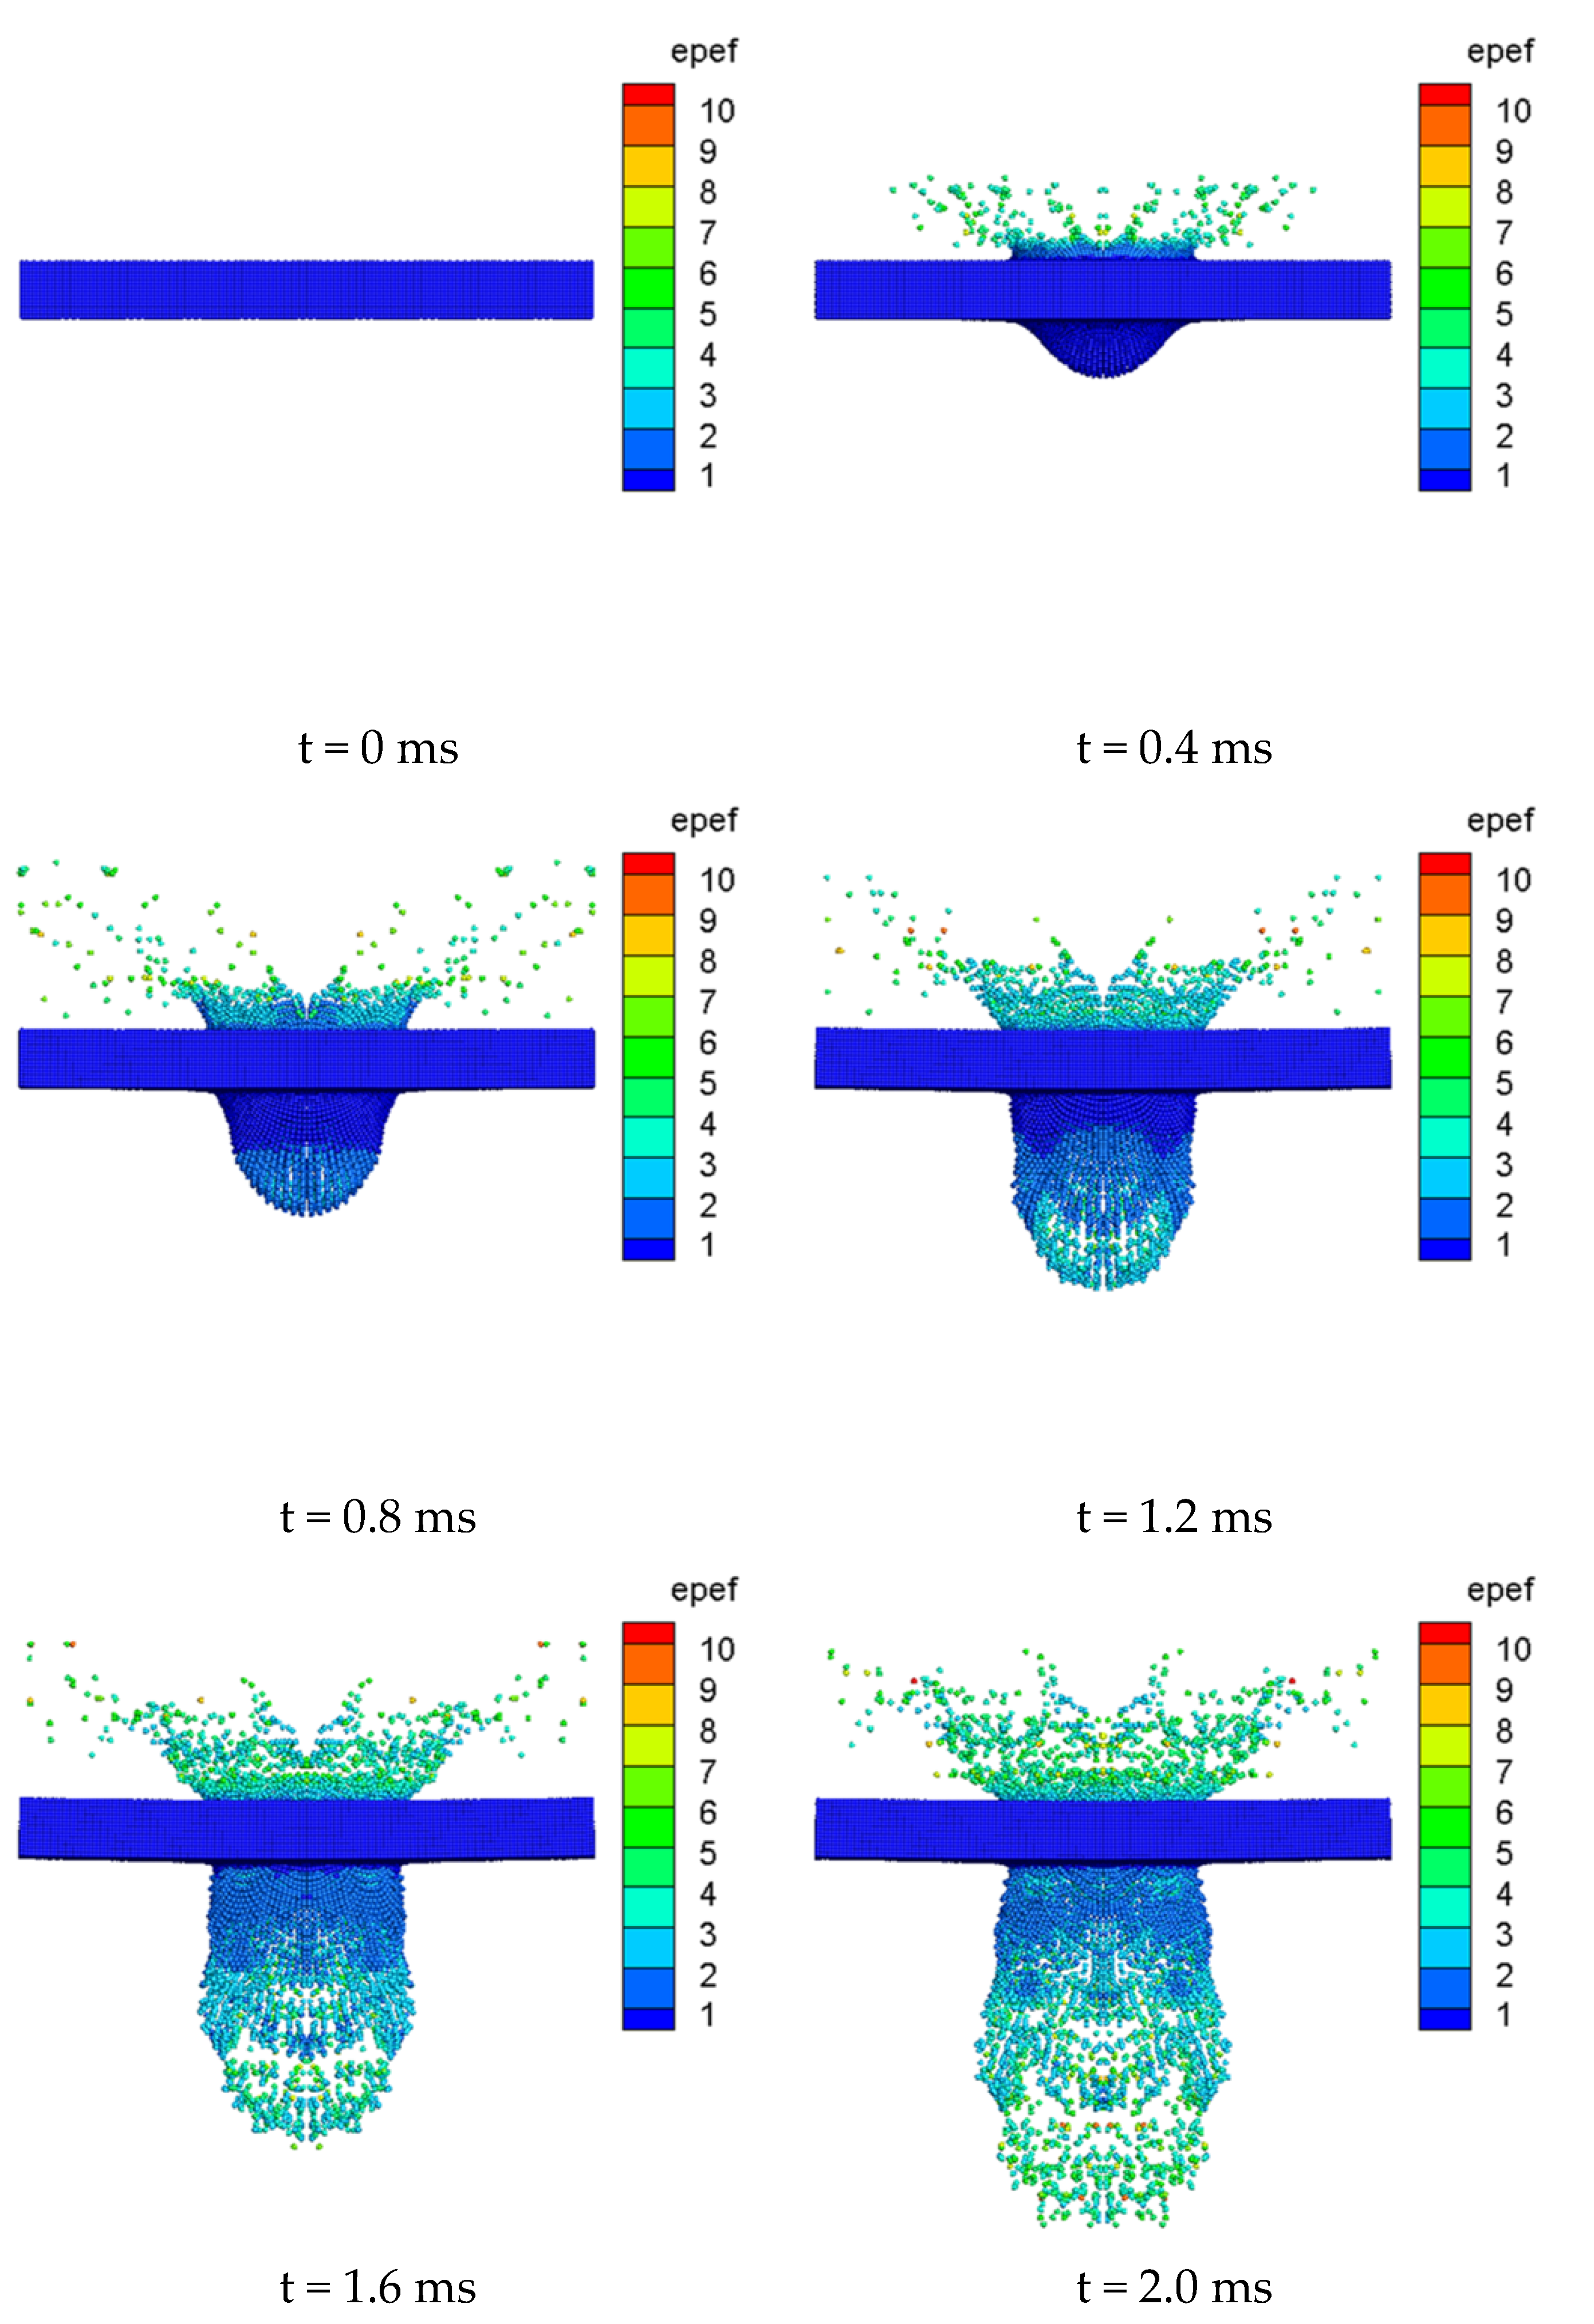
The equivalent plastic strain of the slab under explosive contact is shown in
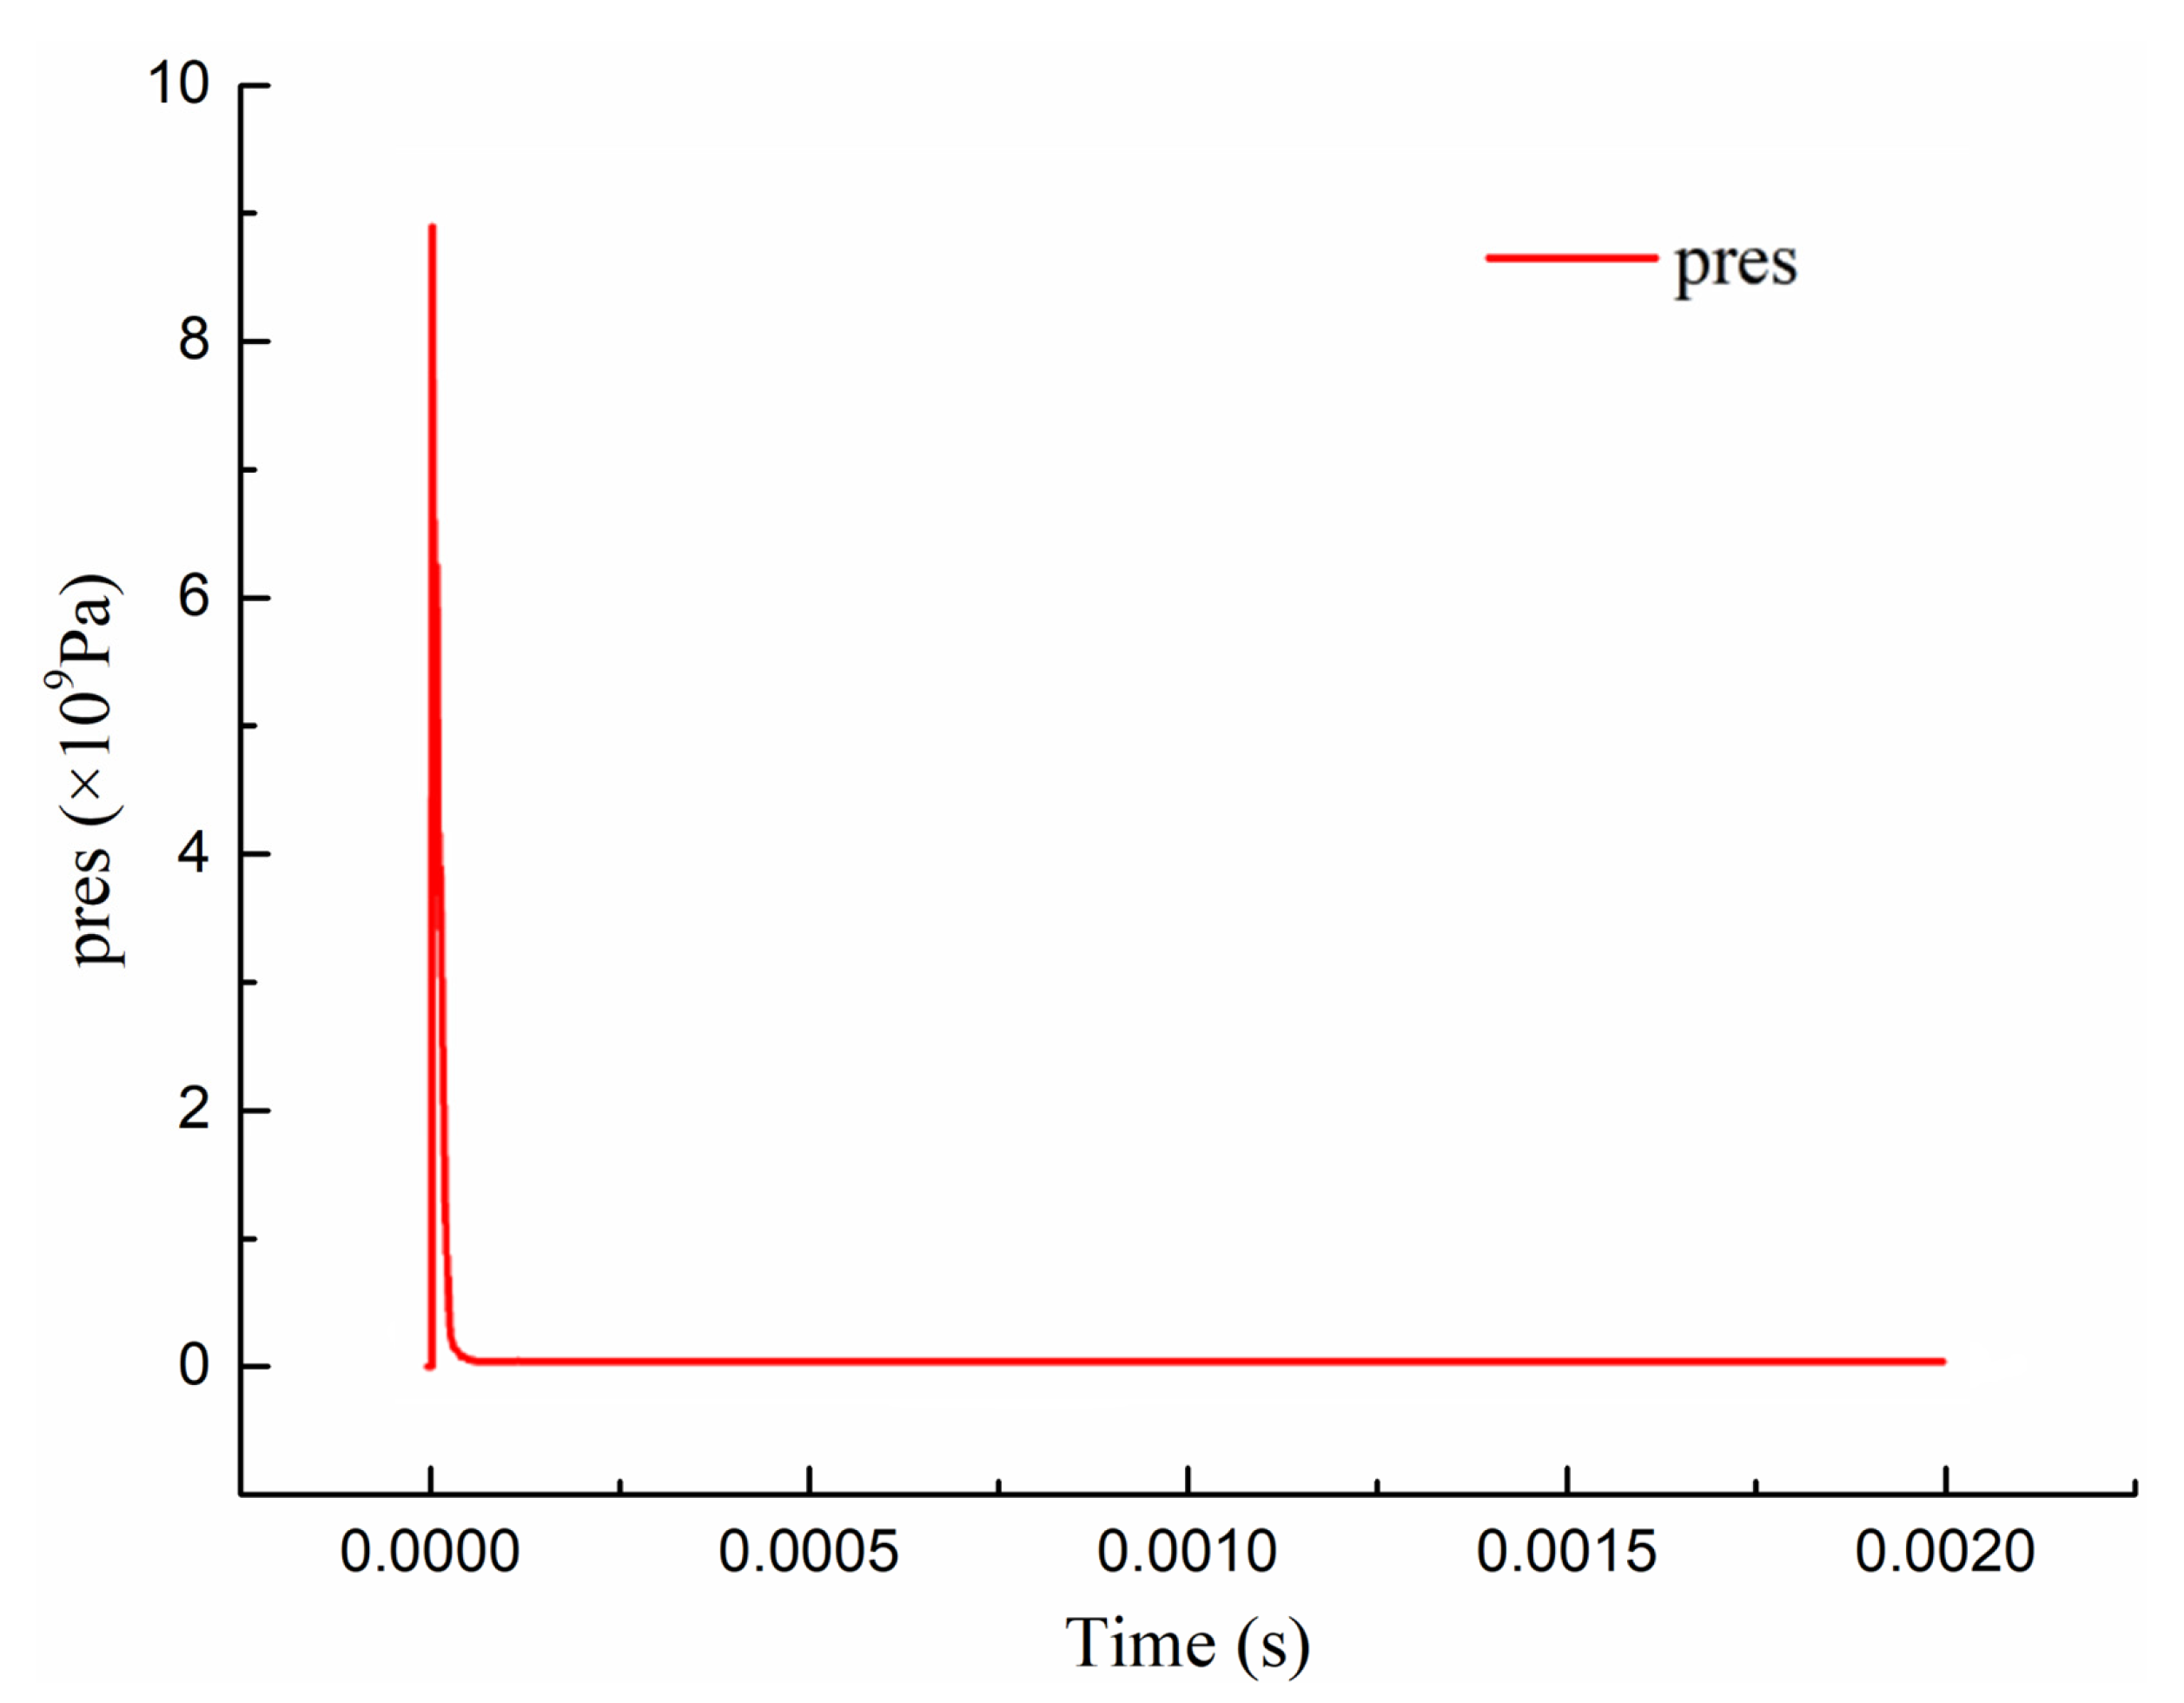
Figure 10. From the figure, it can be seen that the failure mode of the concrete slab under explosive contact is mainly local crushing, cutting damage, bottom collapse, and peeling damage. After the charge is detonated, the high-pressure shock wave generated will directly act on the blast surface of the concrete slab, the pressure amplitude reached 9 GPa and then rapidly attenuated (as shown in
Figure 11), and this pressure is often higher than the compressive strength of the concrete, causing a crushed area to appear on the slab facing the explosion, that is, the appearance of a blast pit; after the shock wave pressure propagates to the inside of the concrete slab, it will spread to the bottom in the form of a compression wave, and the tensile wave formed by reflection on the bottom surface will cause a collapse and peeling area on the bottom surface, while a penetrating hole will be formed at the center of the slab.
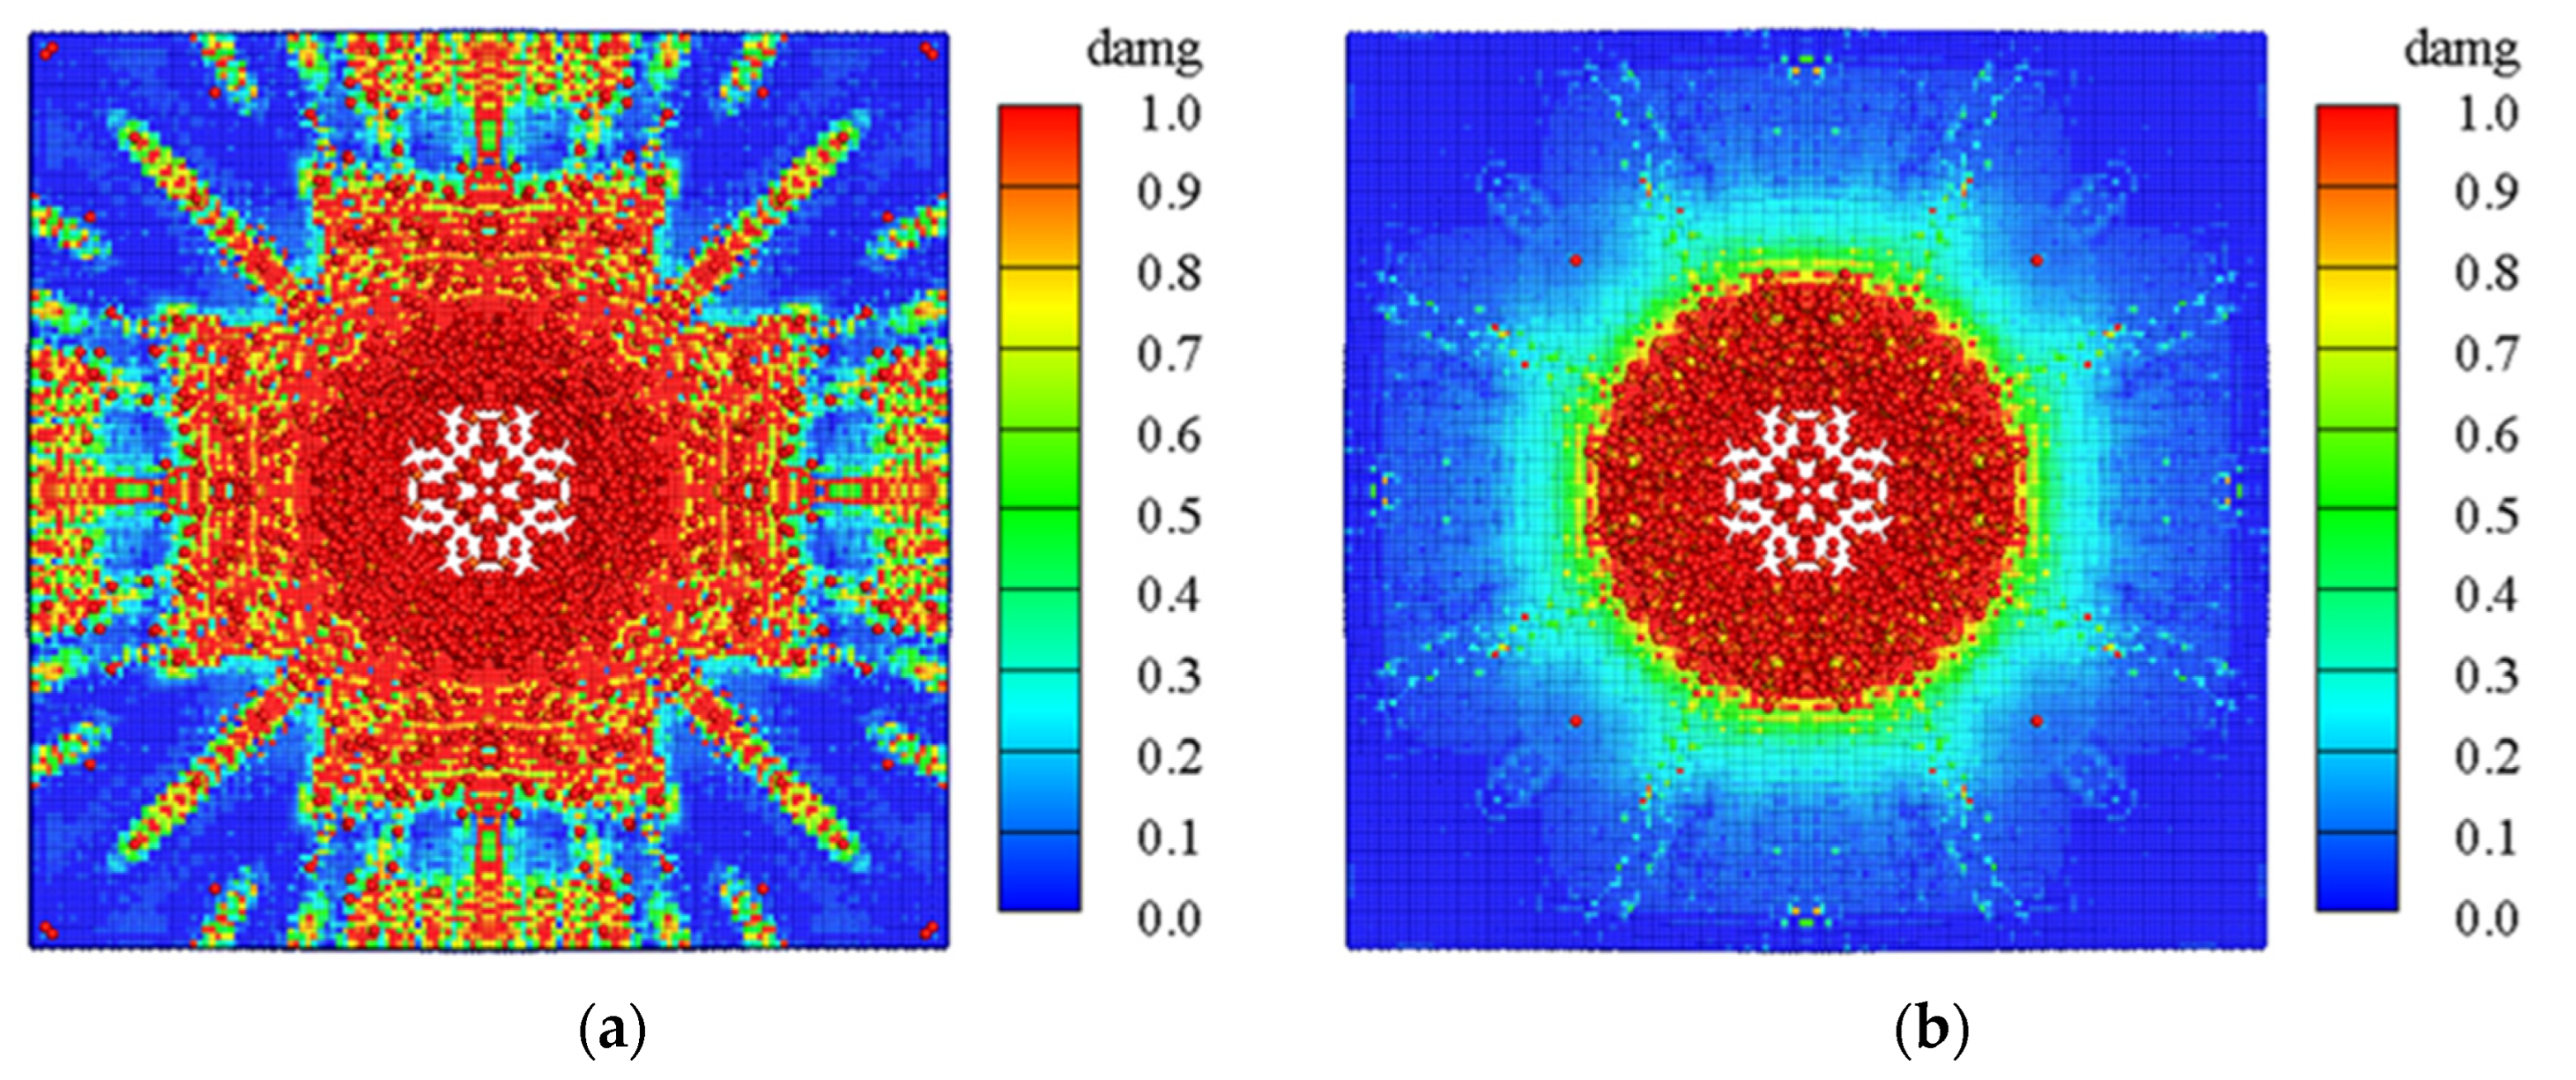
The ultimate damage distribution of the slab under explosive contact is shown in
Figure 12. From the figure, it can be seen that under explosive contact, the compressive stress waves generated by the explosion shock wave cause damage to the front explosive surface of the slab, which propagates to the back explosive surface of the slab and forms a strong tensile wave, causing layer cracking and collapse of the concrete on the back explosive surface. In the central area of the slab, multiple circular and radial cracks appear, which have the characteristics of bi-directional bending and cracking of the corner. The slab is severely damaged in the tensile zone, and multiple transverse cracks appear in the middle of the back explosive surface of the slab.
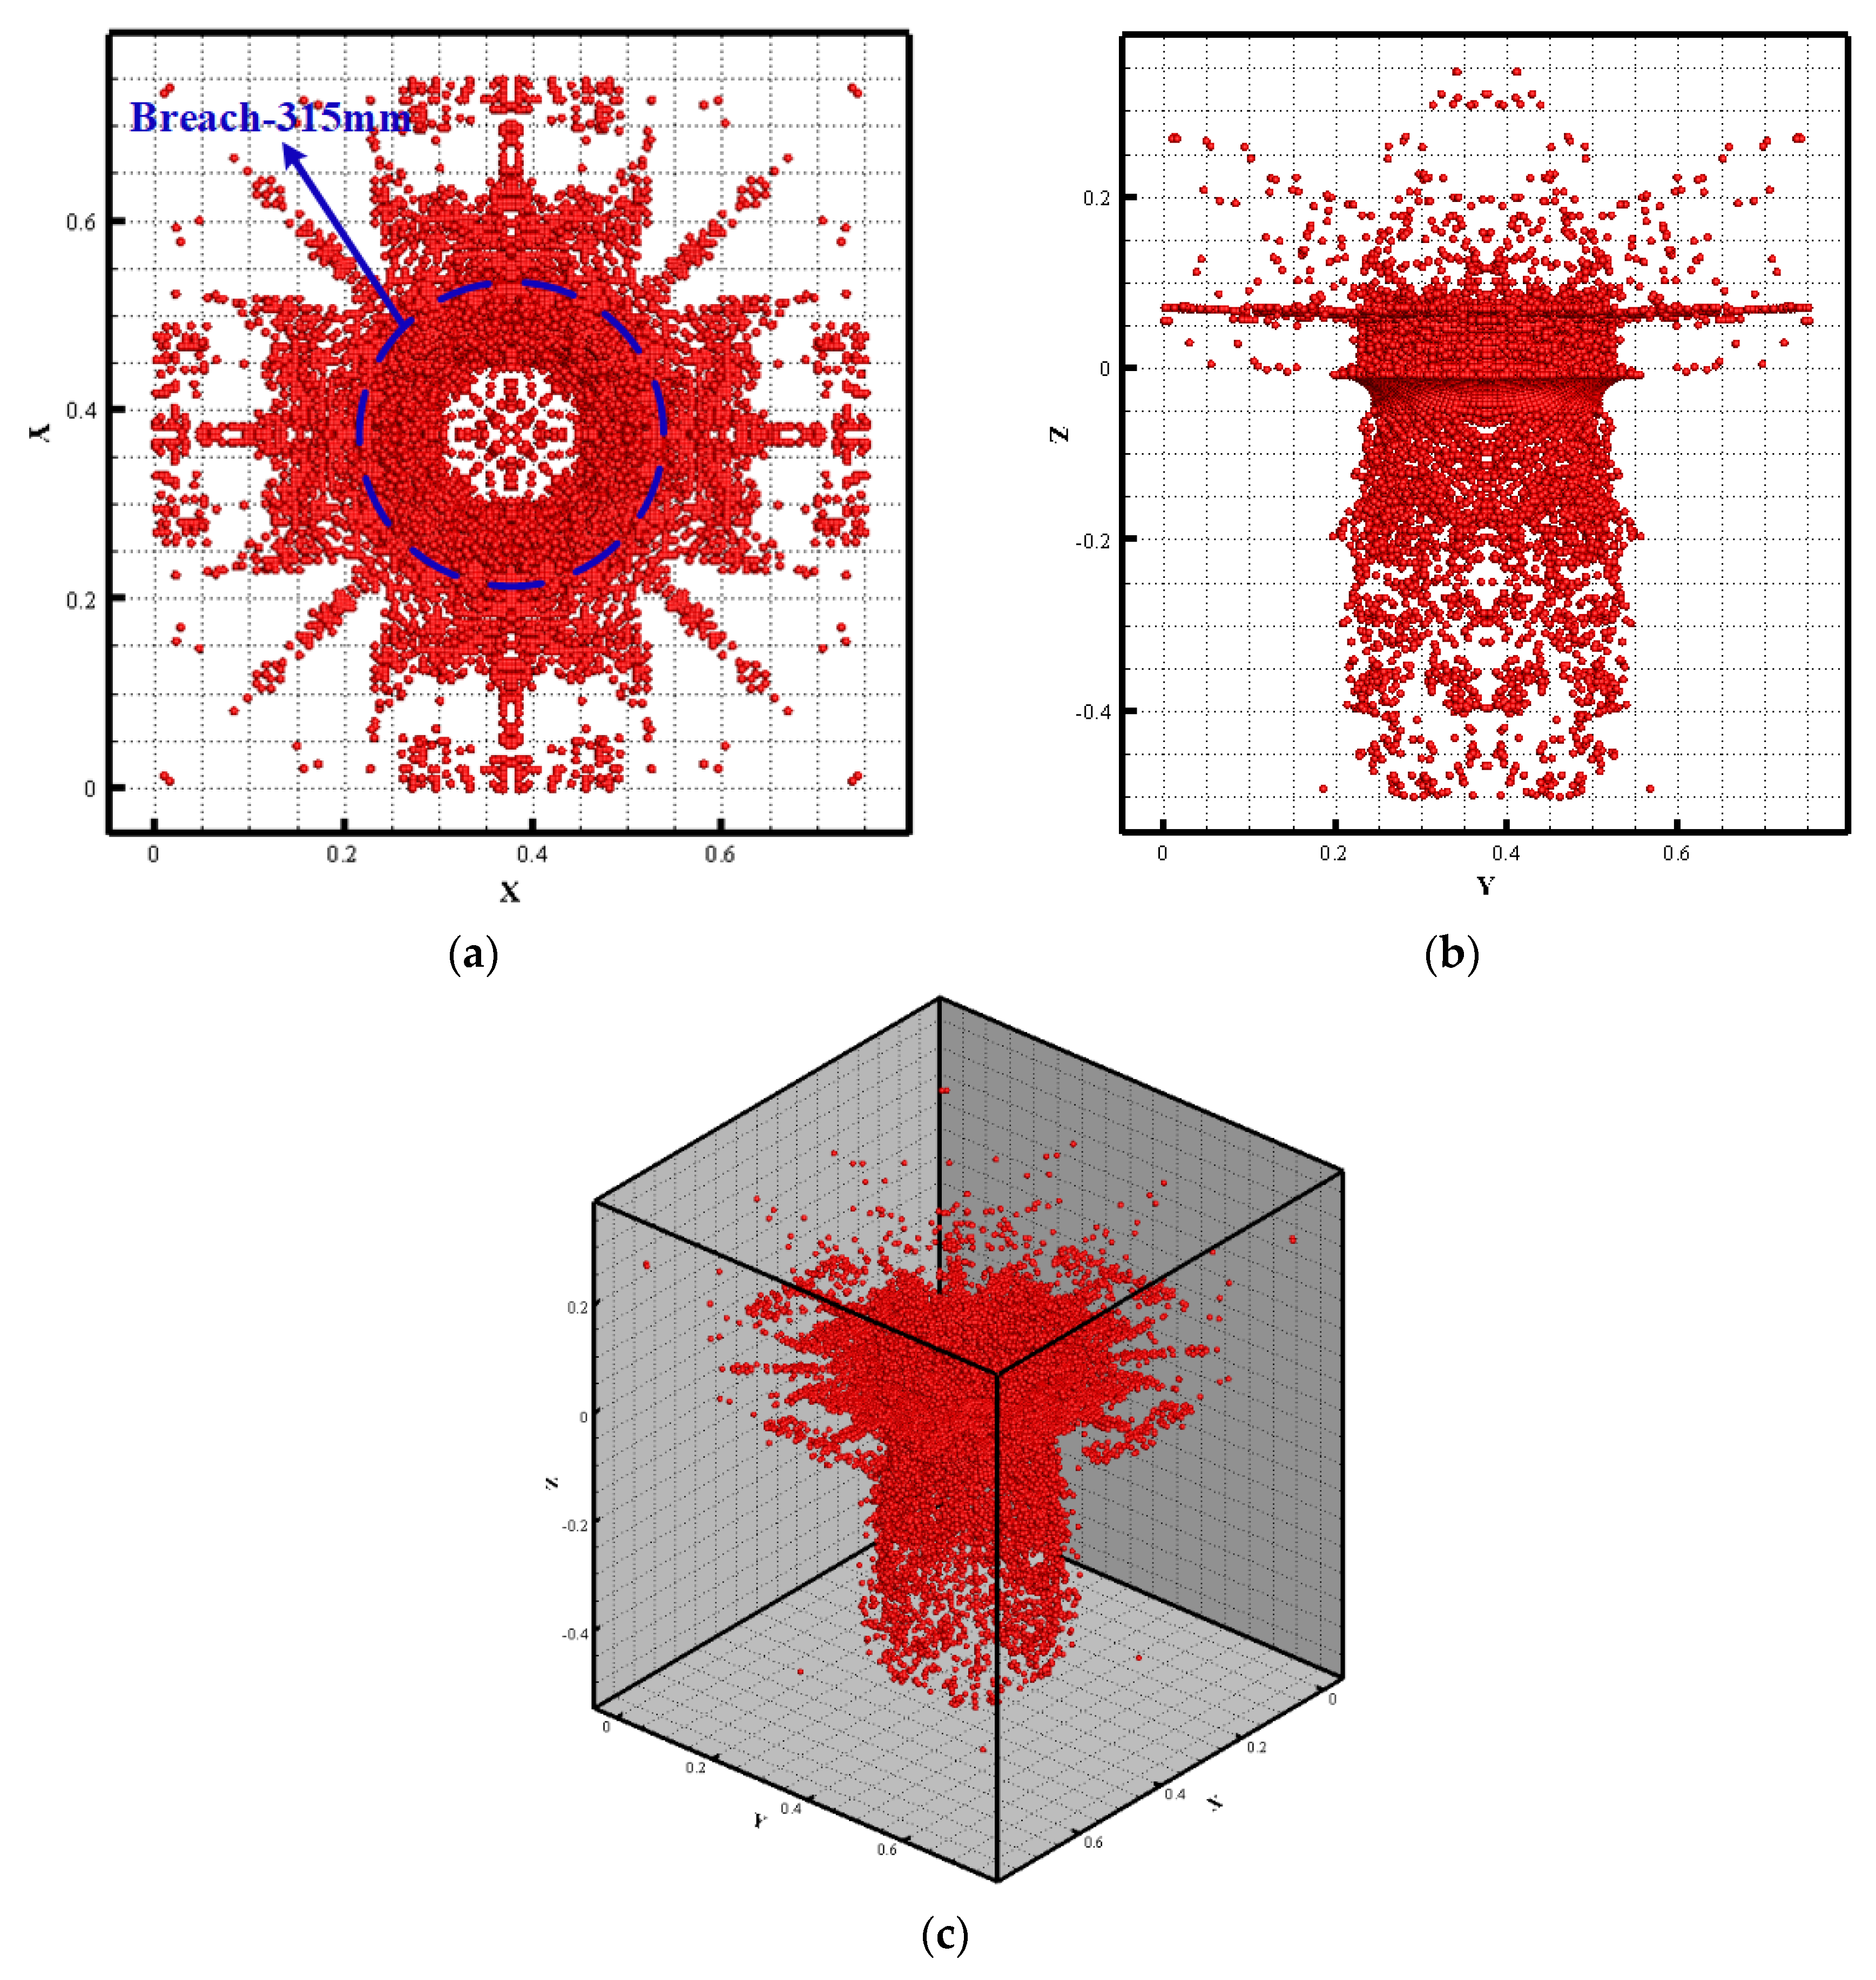
When the damage value of a certain material point inside the slab exceeds 1.0, it is considered that the material point has failed, as shown in
Figure 13. From the figure, it can be seen that after the detonation of the charge, the first damage caused is the crushing damage to the front explosive surface, followed by the formation of a through-hole at the center of the slab, and finally the tensile damage to the back explosive surface, with the damaged area on the back of the slab being significantly larger than that on the front. The diameter of the damaged area on the front of the slab calculated by this method is 315 mm, with an error rate of 10% compared to the experimental results, indicating that this method can accurately simulate the process of the concrete medium under blast loading.
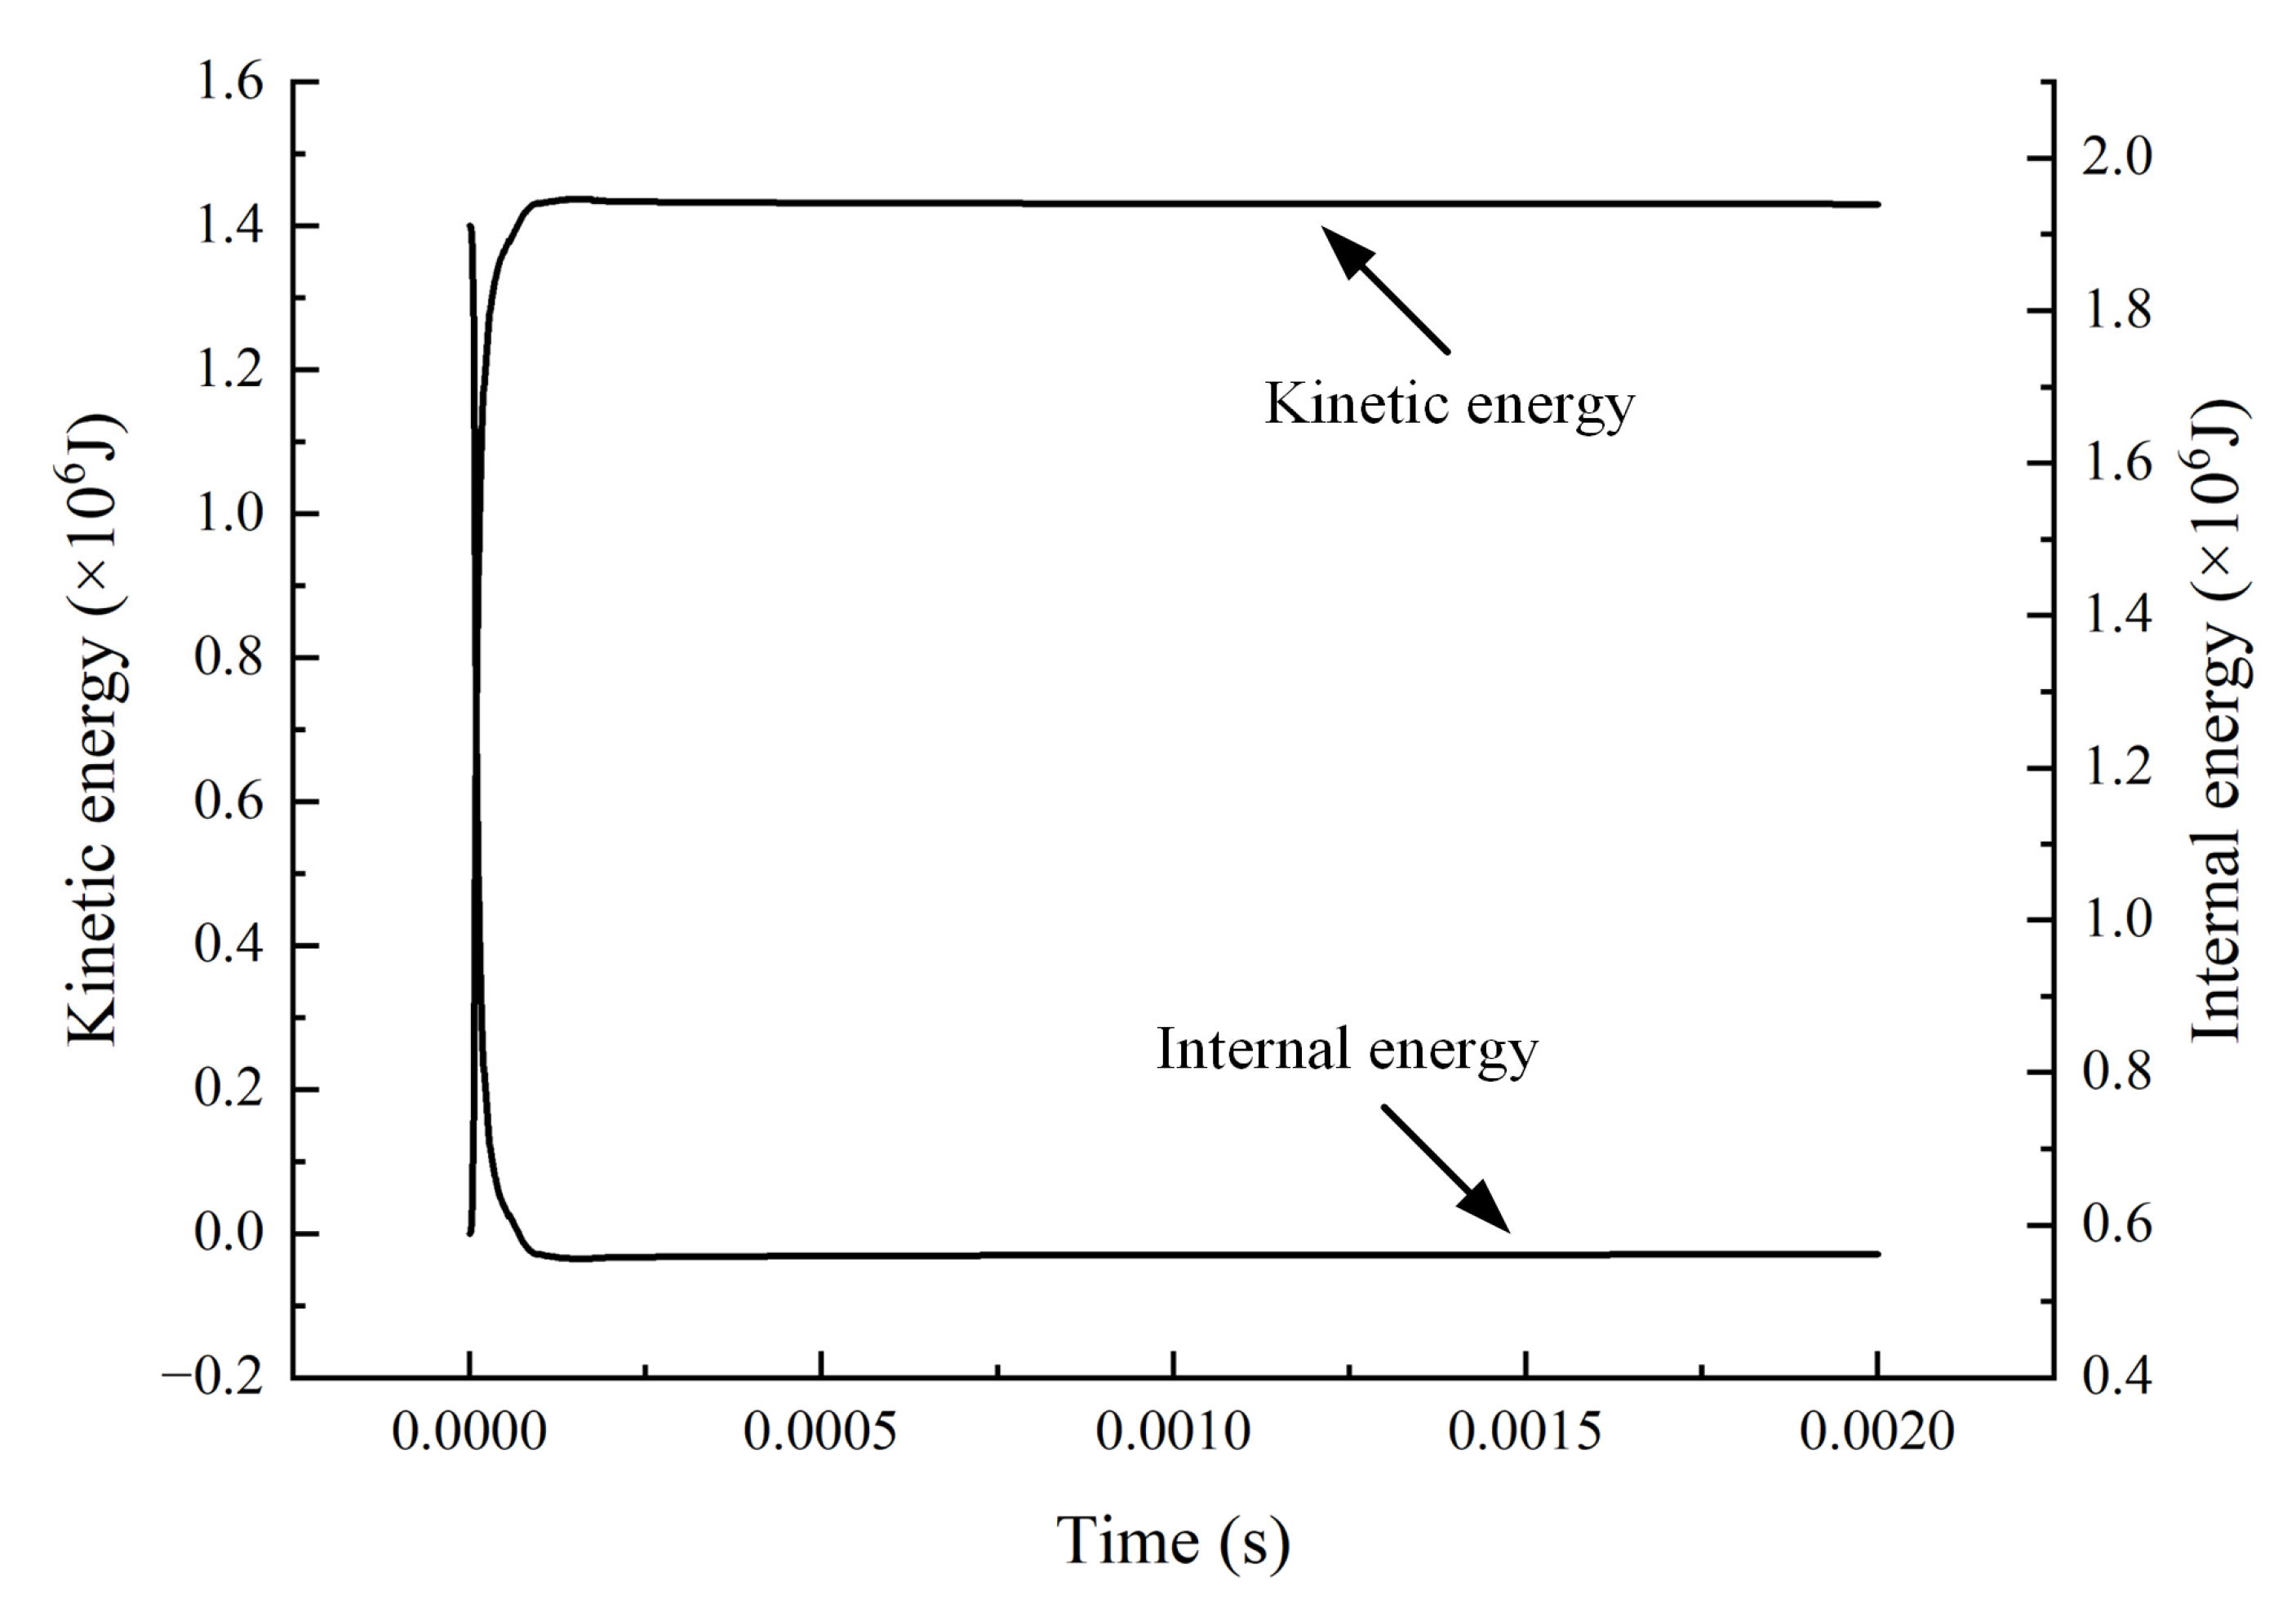
Figure 14 depicts the process of changing system energy over time. When the charge explodes, a massive amount of energy is released in an instant. Compression and tensile failure occur in the concrete slab. As the explosive burns completely, its internal energy progressively changes into the system’s kinetic energy. However, the entire energy of the system is conserved both before and after the explosive detonation, which indirectly reflects the method’s accuracy.
This numerical example demonstrates that, compared to other continuum mechanics methods such as the FEM, the MPM can accurately simulate material fracture problems, whereas the FEM frequently generates grid distortion and distorted calculation results when solving those problems. However, the MPM is less accurate than the FEM when calculating tiny deformation problems.
5. Conclusions
The mechanical behavior of concrete medium under blast loading is highly complex. In this study, an improved HJC model was proposed based on the SHPB experiment, which is the main innovative work of this article. In the improved HJC model, the calculation expressions of the compression dynamic increasing factor and tensile dynamic increasing factor of concrete were given separately, considering the segmented characteristics of the dynamic strength enhancement factor. It can better reflect the strengthening effect of medium and high strain rates on the dynamic strength of the concrete medium.
Furthermore, an MPM simulation program was developed, and the improved HJC model was embedded into this program. This program was verified through numerical examples, and the results have an error rate of 10% compared to the experimental results, showing that this program can accurately simulate the fracture and fragmentation process of the concrete medium under blast loading, particularly the pulverization characteristics of the medium in the near zone of the load.
Compared with other continuum mechanics methods such as the FEM, the MPM is particularly suitable for solving material failure problems. However, the MPM itself also has some issues, such as the continuity of background grid shape functions and the stability of integration algorithms. In future research, corresponding improvements can be made to the MPM to enhance its computational accuracy and efficiency.
