Article

eDA3-X: Distributed Attentional Actor Architecture for Interpretability of Coordinated Behaviors in Multi-Agent Systems

by
Yoshinari Motokawa
* and
Toshiharu Sugawara
Department of Computer Science, Waseda University, Tokyo 169-8555, Japan
*
Author to whom correspondence should be addressed.
Appl. Sci. 2023, 13(14), 8454; https://doi.org/10.3390/app13148454
Submission received: 20 May 2023 / Revised: 8 July 2023 / Accepted: 19 July 2023 / Published: 21 July 2023
(This article belongs to the Special Issue Explainable AI (XAI) for Information Processing)

Abstract

:
In this paper, we propose an enhanced version of the distributed attentional actor architecture (eDA3-X) for model-free reinforcement learning. This architecture is designed to facilitate the interpretability of learned coordinated behaviors in multi-agent systems through the use of a saliency vector that captures partial observations of the environment. Our proposed method, in principle, can be integrated with any deep reinforcement learning method, as indicated by X, and can help us identify the information in input data that individual agents attend to during and after training. We then validated eDA3-X through experiments in the object collection game. We also analyzed the relationship between cooperative behaviors and three types of attention heatmaps (standard, positional, and class attentions), which provided insight into the information that the agents consider crucial when making decisions. In addition, we investigated how attention is developed by an agent through training experiences. Our experiments indicate that our approach offers a promising solution for understanding coordinated behaviors in multi-agent reinforcement learning.

1. Introduction

Explainable reinforcement learning (XRL) has gained considerable attention from both academia and industry due to the vast potential of deep reinforcement learning (DRL) in various applications. However, the black-box problem of DRL, which refers to its unaccountable decision-making process, remains a significant limitation. XRL seeks to overcome this challenge by providing transparency and interpretability in the decision-making process of DRL agents. This is particularly important in critical domains such as autonomous vehicles, where even a small error in the decision can lead to undesirable real-world consequences. Providing explanations for DRL algorithm decisions not only facilitates error identification and correction but also builds trust and acceptance of DRL across various industries.
According to recent research [1,2,3], multiple categories of XRL provide the interpretability of agents. For example, the decision-making process of agents has been interpreted by decomposing reward functions [4,5,6,7] or visualizing their saliency maps based on the integrated gradients method [8,9,10,11]. The attention mechanism and transformer developed by Vaswani et al. [12] also play a critical role in providing transparency to the decision-making process. As a result, various neural network models based on the attention mechanism and transformer, such as vision transformer (ViT) [13] and decision transformer [14], have facilitated the successful visualization of input information that is instrumental in achieving state-of-the-art performance for explainability in computer vision and DRL.
Despite the importance of clarifying the black-box coordination/cooperation mechanism for enhancing the productivity and robustness of the entire system, limited research has been conducted on XRL in multi-agent systems (MAS). The multi-actor-attention-critic (MAAC) [15], which integrates the attention mechanism in the style of MADDPG [16], illustrates how agents selectively focus on cooperative agents using the central attention mechanism, thereby improving the overall efficiency of the system. Motokawa and Sugawara [17] have proposed a multi-agent transformer deep Q-network (MAT-DQN) to establish the interpretability of distributed agents’ coordinated behaviors by analyzing individual agents’ attention mechanisms. Their findings are expected to enhance the explainability of learned behaviors of individuals as well as the efficiency of the entire system. However, their investigation on attention analysis remains inadequate; for instance, they have not addressed how the agents’ attention patterns change throughout their training.
To address this shortcoming, we previously proposed a distributed attentional actor architecture (DA3-X) [18], an extension of MAT-DQN [17], to enhance the interpretability of coordinated behaviors in multi-agent DRL (MADRL). The proposed model architecture relies on trainable parameters known as saliency vectors. As implied by X in DA3-X, the network architecture can accommodate various reinforcement learning algorithms, such as DA3-RAINBOW [19], DA3-DDPG [20], and DA3-IQN [21] to support agents’ adaptation flexibility to a variety of environments. DA3-X is a sequential network architecture comprising three main modules: state embedder, transformer encoder, and DRL head. Agents utilizing DA3-X (DA3-X agents) can visualize information that is relevant to their learned actions via attention heatmaps. Similar to those of the ViT [13], attention heatmaps of DA3-X indicating the intensity of interest in the image-like observation can be generated by extracting the attention weight from the attention mechanism in the transformer encoder. The justification and rationale behind the decision-making process of DA3-X agents are interpretable by representing their observation through the state embedder and transformer encoder, along with the attention mechanism inside DA3-X. Our preliminary version of DA3-X has already demonstrated its effectiveness; however, the resolution of the analysis was insufficient to distinguish the information that attracts regular attention from the one that attracts flexible, situation-specific attention.
In this paper, we introduce a more interpretable version of the DA3-X algorithm, known as enhanced DA3-X (eDA3-X), which incorporates three different types of attention mechanisms, namely standard attention, positional attention, and class attention. Note that the standard attention is the same as that used in the previous version of DA3-X. The positional attention provides insights into the underlying strategy of each agent and where to focus, regardless of the situation. Meanwhile, the class attention is more conditional and specific to the situation. To evaluate eDA3-X, we conducted experiments on the object collection game scenario, where multiple agents learn to coordinate their behavior and collect objects in each environment. Our results show that eDA3-X outperforms the baseline DRL algorithms while providing better interpretability. Furthermore, we conducted attention analysis by comparing agents’ coordinated behaviors and three types of attention heatmaps generated by eDA3-X to validate its effectiveness against DA3-X.

2. Related Work

Attention-based method in XRL: The incorporation of the attention mechanism in models is one of the most popular methods in XRL [22], aside from developed methods through the research on visual explanations such as feature-based [23,24,25], embedding-based [9,26], perturbation-based [27,28,29], and gradient-based methods [8,9,10,11]. Although there are some studies pointing out that the attention mechanism is not always an effective explanation in text classification [30,31], we support that the attention mechanism demonstrates meaningful interpretation on the decision-making process of deep learning, as discussed by Wiegreffe and Pinter [32]. According to Shi et al. [25], there are two main approaches for the attention-based method: querying the observation of agents through customized self-attention modules assembled sequentially [33,34,35,36] and using convolution [37,38,39,40,41]. Recently, we proposed a previous version of DA3-X [18] as an extension of MAT-DQN [17] to demonstrate how decentralized agents coordinate with each other in MAS by highlighting the influence of relevant tasks, other agents, and the noise in local observations through the attention mechanism.
Transformer variants: Transformers and their variants achieved recognition for their performance [12,13,42] and are widely applied in the fields of natural language processing and computer vision. However, there are still relatively few studies that adapt transformers to DRL because of the high variance of states in the training phase. Some prior works sought to imitate outsourcing-supervised (human) actions [43] and interacted with agents via text descriptions through the transformer (multi-modal transformer) [44]. Upadhyay et al. [45] proposed deep transformer Q-networks (DTQN) to incorporate the transformer in conventional reinforcement learning algorithms in continuous environments, and Xu et al. [46] demonstrated that transformer-based models called Trans-v-DRQN outperformed other models in text adventure games. Ritter et al. [47] proposed an episodic planning network (EPN), which characterizes experienced memories retrieved from episodic storage under rapid task-solving games. Chen et al. [14] presented decision transformers, which perceive environments as conditional sequences; these were subsequently modified by introducing the trajectory transformer [48].
However, many previous investigations on transformer architectures have focused on enhancing their learning efficiency rather than elucidating the decision-making mechanisms of agents. Consequently, long short-term memory recurrent neural networks (LSTMs) [49], gated recurrent units (GRUs) [50], and transformers are frequently used primarily as vast memory banks rather than as state representation generators [46]. On the other hand, lightweight transformers are installed as the transformer encoders in the DA3-X to reduce computational costs in entire MADRL. By introducing a simple transformer encoder, we aimed the cost-effective interpretability of agents in MADRL.
Explainable Multi-Agent Systems: There are several human-centered approaches on explainable multi-agent systems (XMAS) as a part of explainable AI (XAI) [51]. Kraus et al. [52] proposed the explainable decisions in multi-agent environments (xMASE), aiming at increasing user satisfaction. Calvaresi et al. [53] introduced blockchain technology to establish explainability, and investigated their method using a swarm of unmanned aerial vehicles. Alzetta et al. [54] proposed the real-time beliefs–desires–intentions (RT-BDI) framework, and highlighted the need of XMAS in a real-time process.
In this paper, we particularly pursue an approach to establish interpretability of agents in MADRL, instead of introducing an interpretable neural network architecture in MAS. We focus on incorporating the attention mechanism in an actor neural network to highlight which information is correlated to the unknown decision-making process in MADRL.
Attention mechanism in MADRL: Various MADRL models utilizing the attention mechanism for XRL have also been proposed. Previous studies [15,55,56,57,58,59,60,61] often used the attention mechanism as a centralized communication processor that efficiently handles encoded messages among agents in MADRL. Incorporation of the attention mechanism in MAS is also beneficial for constrained problems [62], such as the approximation of underlying behaviors of agents [63] and trajectory prediction [64,65]. In particular, Choi et al. [55] introduced the multi-focus attention network, which helps agents attend to important sensory-input information using multiple, parallel attention mechanisms in a grid-like environment. Zambaldi et al. [66] investigated the enhancement of the agents’ ability to efficiently adapt to complicated environments (Box-World and StarCraft II) that require relational reasoning over structured representations by the attention mechanism. Lee et al. [67] introduced joint attention, which aggregates every other agent’s attention map and demonstrated its cost-effectiveness in multi-agent coordination environments.
The initial investigations into MADRL concentrated on improving agents’ performance by using centralized attentions in the centralized training with decentralized execution (CTDE) [68] methodology. Nonetheless, the fully decentralized approach is generally more dependable because of reduced policy update variability, and is more realistic in real-world environments [69]. Furthermore, the analysis of coordination through attention heatmaps has not been fully explored. We aim to conduct a specific behavioral analysis of collaborative agents using decentralized attention heatmaps to determine how to employ alternate strategies and establish coordination based on their observations, to improve interpretability.
DA3-X: DA3-X is a neural network model comprising the attention mechanism [18]. The key aspect of DA3-X lies in its ability to provide interpretability for agents in distributed multi-agent systems. In such systems, agents must establish coordination with one another, making it essential to understand how their cooperative behaviors arise from their black-box decision-making processes. While previous studies have explored transparency in coordination within centralized multi-agent systems, they have often overlooked the more practical distributed systems commonly found in real-world applications. By employing DA3-X as a baseline method, we present an analysis of its interpretability, specifically its capability to selectively identify crucial segments of observation by examining the attention weights within DA3-X [18]. Additionally, the flexible network structure of DA3-X allows for the application of various reinforcement learning methods. Furthermore, we demonstrate that the scalability of DA3-X remains unaffected by the number of agents, as it assumes a distributed system and does not rely on models from other agents.
In this paper, we further extended the attention mechanism of DA3-X for further interpretability of agents in MADRL. While only standard attention is available in DA3-X, our proposed method, eDA3-X, is capable of serving the positional attention and class attention in addition to the standard attention. This novel enhancement enables us to conduct a more granular analysis of the interpretable coordinated behavior exhibited by agents in MADRL scenarios.

3. Preliminaries

3.1. Dec-POMDP

We assumed the decentralized partially observable Markov decision process (dec-POMDP) [70] of N agents. Dec-POMDP is formulated by a tuple:
I , S , { A i } , p T , { r i } , { Ω i } , O , H
where I = { 1 , , N } indicates a set of agents in the system; S is a finite set of possible states; A i is a finite set of action space of each agent i I . For a A ( = A 1 × × A N ) and s , s S , p T ( s | s , a ) is a transition probability; r i ( s , a ) R is the reward obtained by i I ; Ω i is a finite set of observations by i I ; O ( o | s , a ) is an observation probability that i sees o Ω when i takes action a in state s; H is the time horizon of the process. In dec-POMDP, the objective of agents is to maximize the discounted cumulative reward R i = t = 0 H γ t r i ( s , a ) by optimizing their policies π i , where γ is a discount factor ( 0 γ < 1 ).

3.2. Problem Setting

To evaluate our method, we employ the object collection game where agents collect as many objects as possible in a grid-like environment of size G X × G Y , as shown in Figure 1a, where G X = G Y = 25 . At the beginning of each episode, agents are placed at the initial positions indicated by numbered blue and red cells in Figure 1a and begins exploration in the environment. At each time step, agents decide their action a i A i = { up , down , right , left } , wherein each element describes the movement direction of agents. Agent i receives a reward r i ( s , a ) depending on the state s S at the next time step after the joint action a = ( a 1 , , a i , , a N ) A ; i.e., i obtains a positive reward r i ( s , a ) = r obs > 0 if it moves to the same position as an object to collect in state s ; it receives a negative reward r i ( s , a ) = r col < 0 if it collides against other agents or walls in s ; otherwise, it receives r i ( s , a ) = 0 . Despite the simple tasks in this game and the required coordination structure being straightforward, it makes it easier to reason why the individual agents analyzed the specific parts of input data to decide actions for the evaluation of the proposed method, eDA3-X.
At each step, agents encode their observations of the environment in N C channels of R X × R Y binary matrices in { 0 , 1 } or { 0 , 1 } (where R X × R Y is the size of the observation matrices R R X × R Y ) and feed their observation tensor in shape of N C × R X × R Y into their neural networks. In this study, we introduce two types of observation methods, namely, local view and relative view methods [71], as shown in Figure 1b,c. Note that the leftmost figure in Figure 1b,c depicts the example environment, whose size is { G X × G Y } = { 10 × 10 } , including the walls; thus, they are smaller than that in Figure 1a. In these figures, black cells are walls, black star-shaped marks are objects, and blue and red numbered cells are agents in the environment.
Local view: Agents generate the matrices of the local view based on their local observations; thus, R X × R Y is the same size as the visible range. Figure 1b shows example environment and matrices when { R X × R Y } = { 7 × 7 } , where the blue square line indicates agent 0’s surrounding sight (visible range). Suppose N C = 5 , agent 0 obtains its local observation matrices where the first three indicate agents’ position, the fourth channels indicate objects’ position, and the fifth channel shows walls and invisible area. Note that the area behind the walls cannot be observed.
Relative view: Unlike with the local view method, agents obtain their observation matrices in the shape of { R X × R Y } = { G X × G Y } with the relative view method. An example is shown in Figure 1c, where the red square indicates agent 2’s visible range, whose size is 7 × 7 and { R X × R Y } = { 10 × 10 } . The encoding mechanism of the relative view is similar to that of the local view, where each channel indicates the locations of agents, objects, or walls within the visible range; other elements are filled with zeros. As an advantage of the relative view method, agents observe their global positions in the environment.

3.3. Multi-Head Attention

The self-attention mechanism [12] was introduced to calculate similarities between sequences as
Attention ( Q , K , V ) = Softmax ( Q · K T d ) V ,
where Q, K, and V denote query, key, and value matrices, respectively, and d is the dimension of the query/key. The attention weight is obtained by softmax function of the dot product between the query and key matrices in Equation (2). Multi-head attention (MHA) is determined by calculating the self-attention in h parallel attention heads, as shown in the equation below:
MHA ( Q , K , V ) = Concat ( head 1 , , head h ) W O head l = Attention ( Q · W l Q , K · W l K , V · W l V ) ,
where W l Q , W l K , W l V , W O are projected parameter matrices for attention head head l ( 1 l h ), and Concat denotes the concatenation procedure of output matrices from h attention heads (for further details, please refer to the original paper [12]).

4. Proposed Method: eDA3-X

4.1. Neural Network Architecture

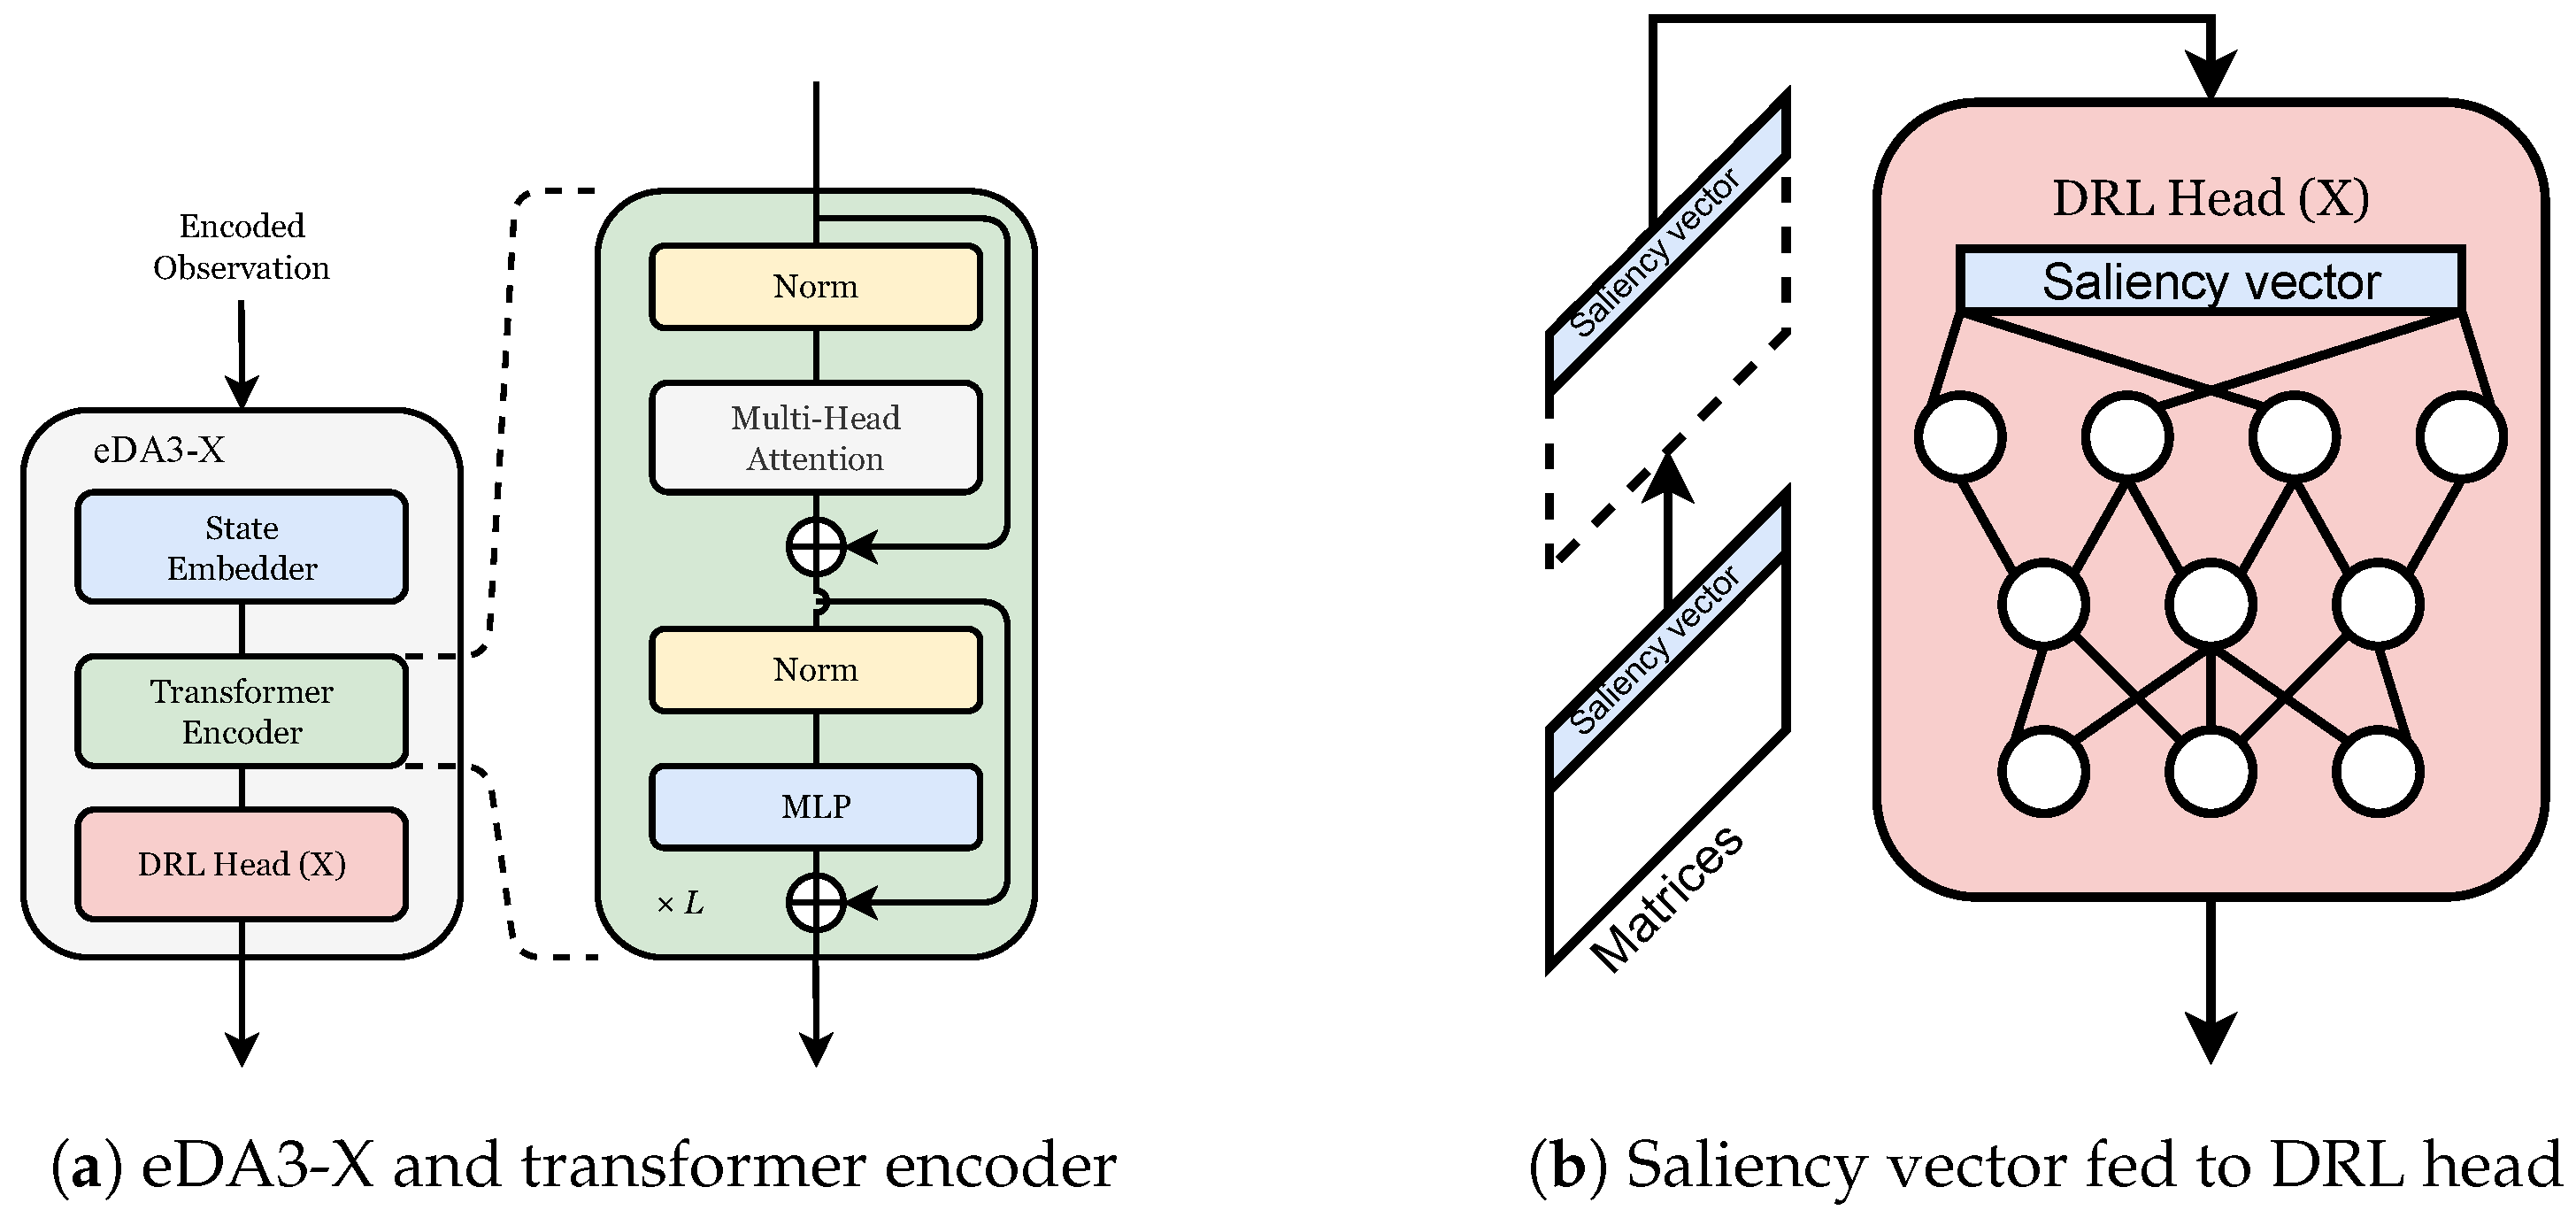
The key idea of proposed method, eDA3-X, is to consistently use the saliency vector (trainable parameters) throughout eDA3-X, as illustrated in Figure 2. In this approach, eDA3-X is capable of visualizing relevant information in the attention heatmaps and allows us to interpret the decision-making process of eDA3-X agents. The eDA3-X mainly comprises three modules: state embedder, transformer encoder, and DRL head. eDA3-X first expresses the observation in the saliency vector through the MHA mechanism inside its transformer encoder and propagates the saliency vector to the DRL head, as shown in Figure 2a,b, respectively.
In state embedder, observation matrices of shape N C × R X × R Y are projected to C × R X P × R Y P using a convolutional neural network with kernel size of P, where C > 0 is the length of saliency vector, and P > 0 is patch size. The matrices are flattened and concatenated with the saliency vector v sal R C to produce matrices in the shape of ( R X P · R Y P + 1 ) × C . Position embedding P pos , which is a set of trainable parameters in the shape of ( R X P · R Y P + 1 ) × C , is then appended to the matrices for the attention calculation.
In the transformer encoder, the matrices undergo the norm, MHA, and the multi-layer perceptron (MLP) layers for L times, as shown in Figure 2a. The similarities of each sequence in the matrices, derived from embedded observation and saliency vector, are obtained in MHA calculation as explained in Equation (3). In other words, eDA3-X agents’ focus in their observations is interpretable by comparing the intensity of attention weight based on similarities between the saliency vector and other elements in observation. The remaining calculation in the transformer encoder is identical to that of MAT-DQN [17]. Note that the shape of matrices remains the same as ( R X P · R Y P + 1 ) × C before and after the process in transformer encoder.
Only the saliency vector in the matrices from the transformer encoder are extracted and fed to the DRL head, as shown in Figure 2b. Unlike in MAT-DQN [17], any deep neural network can be applied to the DRL head in eDA3-X using arbitrary reinforcement learning algorithm, such as RAINBOW [19], DDPG [20], or IQN [21] (hence denoted as X in eDA3-X). The variety in DRL heads is expected to enhance agents’ learnability and adaptation flexibility. Indeed, we previously reported flexible adaptation to complex environment by adopting different reinforcement learning algorithm in its DRL head [18].

4.2. Standard, Positional, and Class Attentions

Based on our previous study [18], we further extend DA3-X to improve its interpretability. While only standard attention is available in DA3-X, we introduce hyperparameters to derive positional attention and class attention in eDA3-X. The following equation is the mathematical procedure of decision-making process in DA3-X:
h 0 = [ v sal ; x 1 E ; x 2 E ; ; x I E ] + P pos h l = TEL ( h l 1 ) , l = 1 , , L Q = DRLHead ( h L 0 )
where x R I × ( P 2 N C ) are patched observation matrices, E R ( P 2 N C ) × C represents embedding parameters, I = R X P · R Y P is the number of the matrices after the patch operation. Each line in Equation (4) corresponds to the procedure in the state embedder, transformer encoder layer (TEL), and DRL head in Figure 2, respectively.
We introduce a new state embedder based on the previous state embedder in Equation (4) to derive the positional attention and class attention in addition to the standard attention in eDA3-X. The state embedder in eDA3-X becomes
h 0 = [ v sal ; α x 1 E ; α x 2 E ; ; α x I E ] + β P pos
where α { 0 , 1 } and β { 0 , 1 } are hyperparameters depending on the purpose of attention analysis. While the eDA3-X agent is trained, those parameters are set as α = 1 and β = 1 , such that Equation (5) becomes identical to that in Equation (4). We call it standard attention to distinguish it from other attentions. Suppose α = 0 and β = 1 , we derive
h 0 = [ v sal ; 0 ; 0 ; ; 0 ] + P pos .
during attention analysis. When α = 0 , all information about the observation is masked to zero, meaning the observation information is omitted. Hence, similarities between the saliency vector and sequences of position embedding are obtained in MHA. We call this attention positional attention. Similarly, when we set α = 1 and β = 0 , the state embedder in Equation (5) becomes
h 0 = [ v sal ; x 1 E ; x 2 E ; ; x I E ]
where the similarities of the saliency vector only depends on embedded observation matrices. In this case, we call this attention class attention. Each combination of parameters ( { α , β } = { 1 , 1 } , { 0 , 1 } , { 1 , 0 } ) allows us to examine attention analysis in different aspects.
The DA3-X model utilized only the standard attention ( { α , β } = { 1 , 1 } ), which highlighted influential segments in observation, such as cooperative agents with a high attention weight. However, it was unclear whether DA3-X assigned high attention to these segments to identify cooperative/coordinated actions or simply due to their proximity as nearby locations/objects that require constant awareness. This lack of interpretability hindered a thorough understanding of the model’s decision-making process.
Conversely, eDA3-X incorporates positional attention ( { α , β } = { 0 , 1 } ) and class attentions ( { α , β } = { 1 , 0 } ) to improve the interpretability of agents’ decision making. The positional attention highlights the segments that eDA3-X always pays attention to, regardless of the situation-specific observations. For example, eDA3-X’s focus on its surroundings in standard attention can be explained by the positional attention of eDA3-X. The class attention interprets the significance of the contribution of the attribute of segments to an agent’s decision-making process, regardless of the observation’s distance. For instance, eDA3-X assigns the same intensity of class attention to the same class of segments (other agents, objects, or walls), thereby elucidating how eDA3-X considers other agents’ cooperativeness or irrationality in constructing coordination.

5. Experiments and Results

5.1. Experimental Setup

For our experiment, we utilized a grid-like environment E , as illustrated in Figure 1a, where G X × G Y = 25 × 25 , including the walls. Each cell in E is represented by different colors to indicate entities, where black represents walls, blue and red represent the initial position of agents, and white represents empty space. The object spawn regions are represented by green, red, and beige segments, respectively. The agents aim to collect the ★-marked objects, with a total of 40 objects in the environment. Once an object is collected by an agent, a new object will spawn at a random location within the corresponding spawn region.
We consider a scenario where six agents ( N = 6 ) are placed in the environment E , consisting of four intelligent agents and two roaming agents. At the beginning of each episode, the intelligent agents spawn at specific blue cells ( { 0 , 1 , 2 , 3 } ) in Figure 1a and start exploring. Each agent learns its policy π i to maximize the collection of objects in its designated area without collisions. Specifically, agent 0 and agent 1 can collect objects only in the green and beige regions, while agent 2 and agent 3 can collect objects in the red and beige regions. If agents try to pick up objects outside their designated area, the objects remain in the same location, and the agents receive zero reward r i ( s , a ) = 0 . The agents are not aware of this region’s limitations and need to learn it through their experience. The roaming agents spawn at the red cells ( { 4 , 5 } ) and randomly move around in the environment without collecting objects, potentially confusing the intelligent agents. Since the roaming agents are not cooperative, the intelligent agents must determine which agents in E are worth building coordination and exclude the non-cooperative agents. We set N C = N + 2 = 8 , where N = 6 matrices are used to distinguish the agents’ location and those of other nearby agents, and two matrices are used for objects and the invisible area, as shown in Figure 1b,c.
In our experiment, we investigated the performance of two types of agents, namely eDA3-DQN agents and eDA3-IQN agents. The former had a multi-layer perceptron (MLP) as a deep Q-network (DQN) [72] installed in their DRL head, while the latter had an implicit quantile network (IQN) [21] installed. The eDA3-X agents were equipped with four attentional heads ( h = 4 ), and the transformer encoder was looped only once ( L = 1 ), which are the same hyperparameters as previous study [18]. The patch size was set to P = 1 and P = 5 for the local and relative views, respectively. The length of the saliency vector v sal was set to C = 64 (same as [18]). As for the baseline algorithms, we trained standard DQN agents and IQN agents using the double Q-learning [73] and dueling network [74] algorithms.
We trained agents for 5000 episodes, each consisting of H = 200 steps. The reward functions used were r obs = 1 for agents moving to a collectible object and r col = 1 for colliding with other objects such as agents and walls. Agents were provided with an image-like partial observation of size R X , R Y = 7 , 7 using either local view or a relative observation of size R X , R Y = G X × G Y = 25 × 25 using the relative view method, with a visible range of 7 × 7 .

5.2. Quantitative Learning Performance

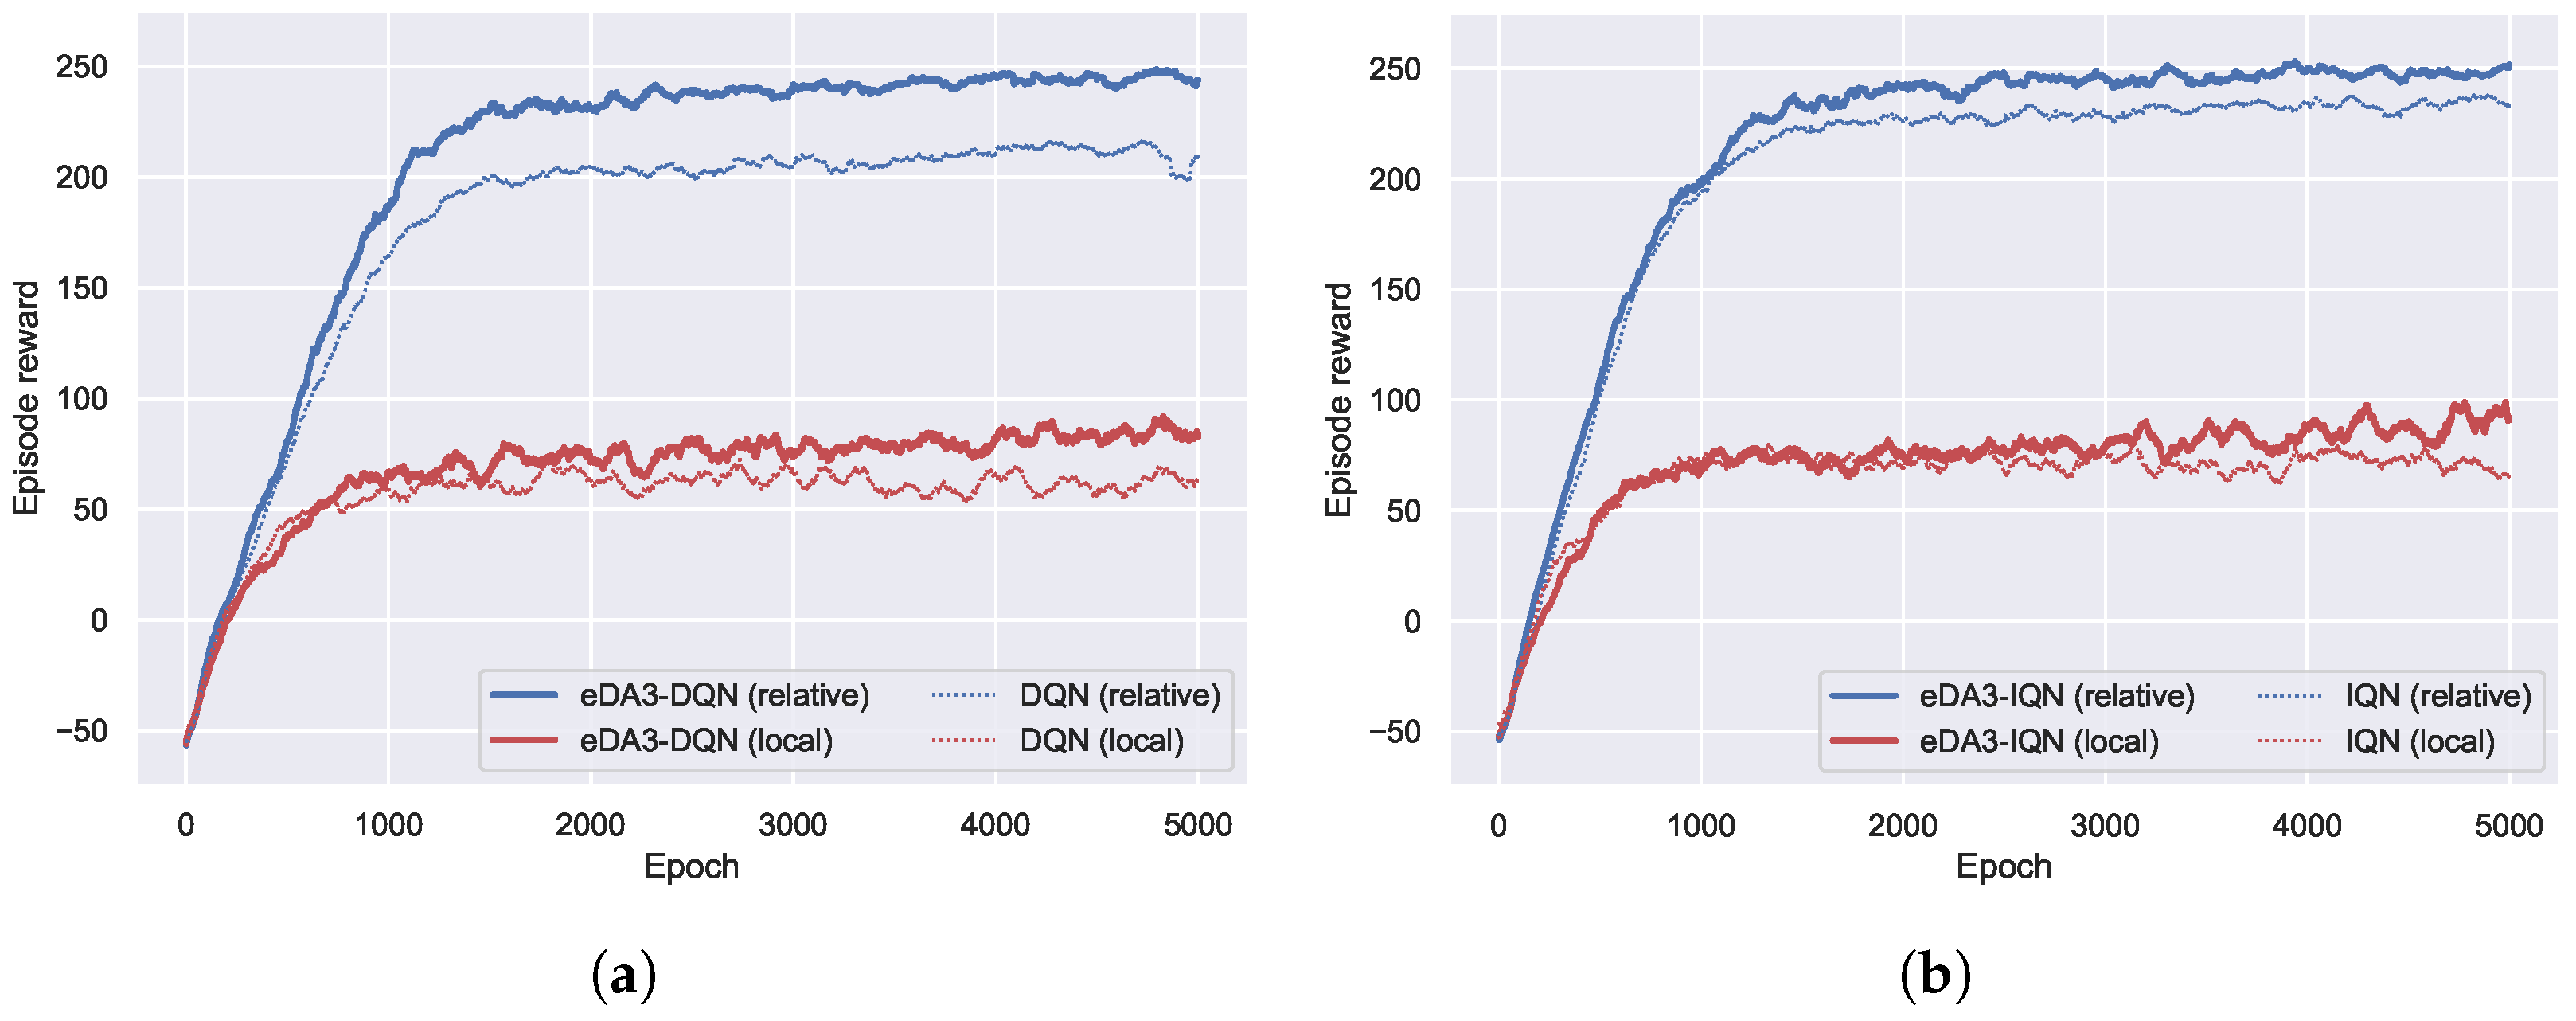
The results depicted in Figure 3 illustrate the total reward obtained by four intelligent agents per episode (episode reward) over 5000 training episodes utilizing different observation methods and DRL algorithms (DQN and IQN based). The solid blue and red lines in Figure 3 represent the learning performances of eDA3-X agents with relative and local view methods, respectively. Conversely, the dashed blue and red lines depict the baseline method performances. Table 1 provides a quantitative comparison of the observation methods, including the number of objects collected, collisions between agents, collisions with walls, and episode reward. Each value in Table 1 is the average value over the final 100 episodes with a range of one standard deviation ( ± σ ).
Based on the results presented in Figure 3 and Table 1, it can be observed that all the intelligent agents were able to successfully learn how to collect objects within the environment, as indicated by the steadily increasing episode rewards and low collision counts. Moreover, it was found that performance improvements were more notable when agents used the relative view to observe the environment rather than the local view, regardless of the DRL algorithms employed. This is likely due to the additional global positional information provided by the relative view.
Moreover, the results presented in Figure 3 and Table 1 suggest that the eDA3-X agents outperformed the baseline methods in terms of building more efficient policies in the environment. Specifically, when using the local view method, eDA3-DQN and eDA3-IQN agents collected 18.17 ( 26.56 % ) and 29.19 ( 41.68 % ) more objects than their DQN and IQN counterparts, respectively. On the other hand, when using the relative view method, the eDA3-DQN and eDA3-IQN agents achieved an improvement in episode reward by 43.24 ( 21.57 % ) and 16.07 ( 6.86 % ) compared to the baseline methods. The following sections present a detailed discussion on the performance improvement by using the relative view method.

5.3. Attention Analysis from Coordination

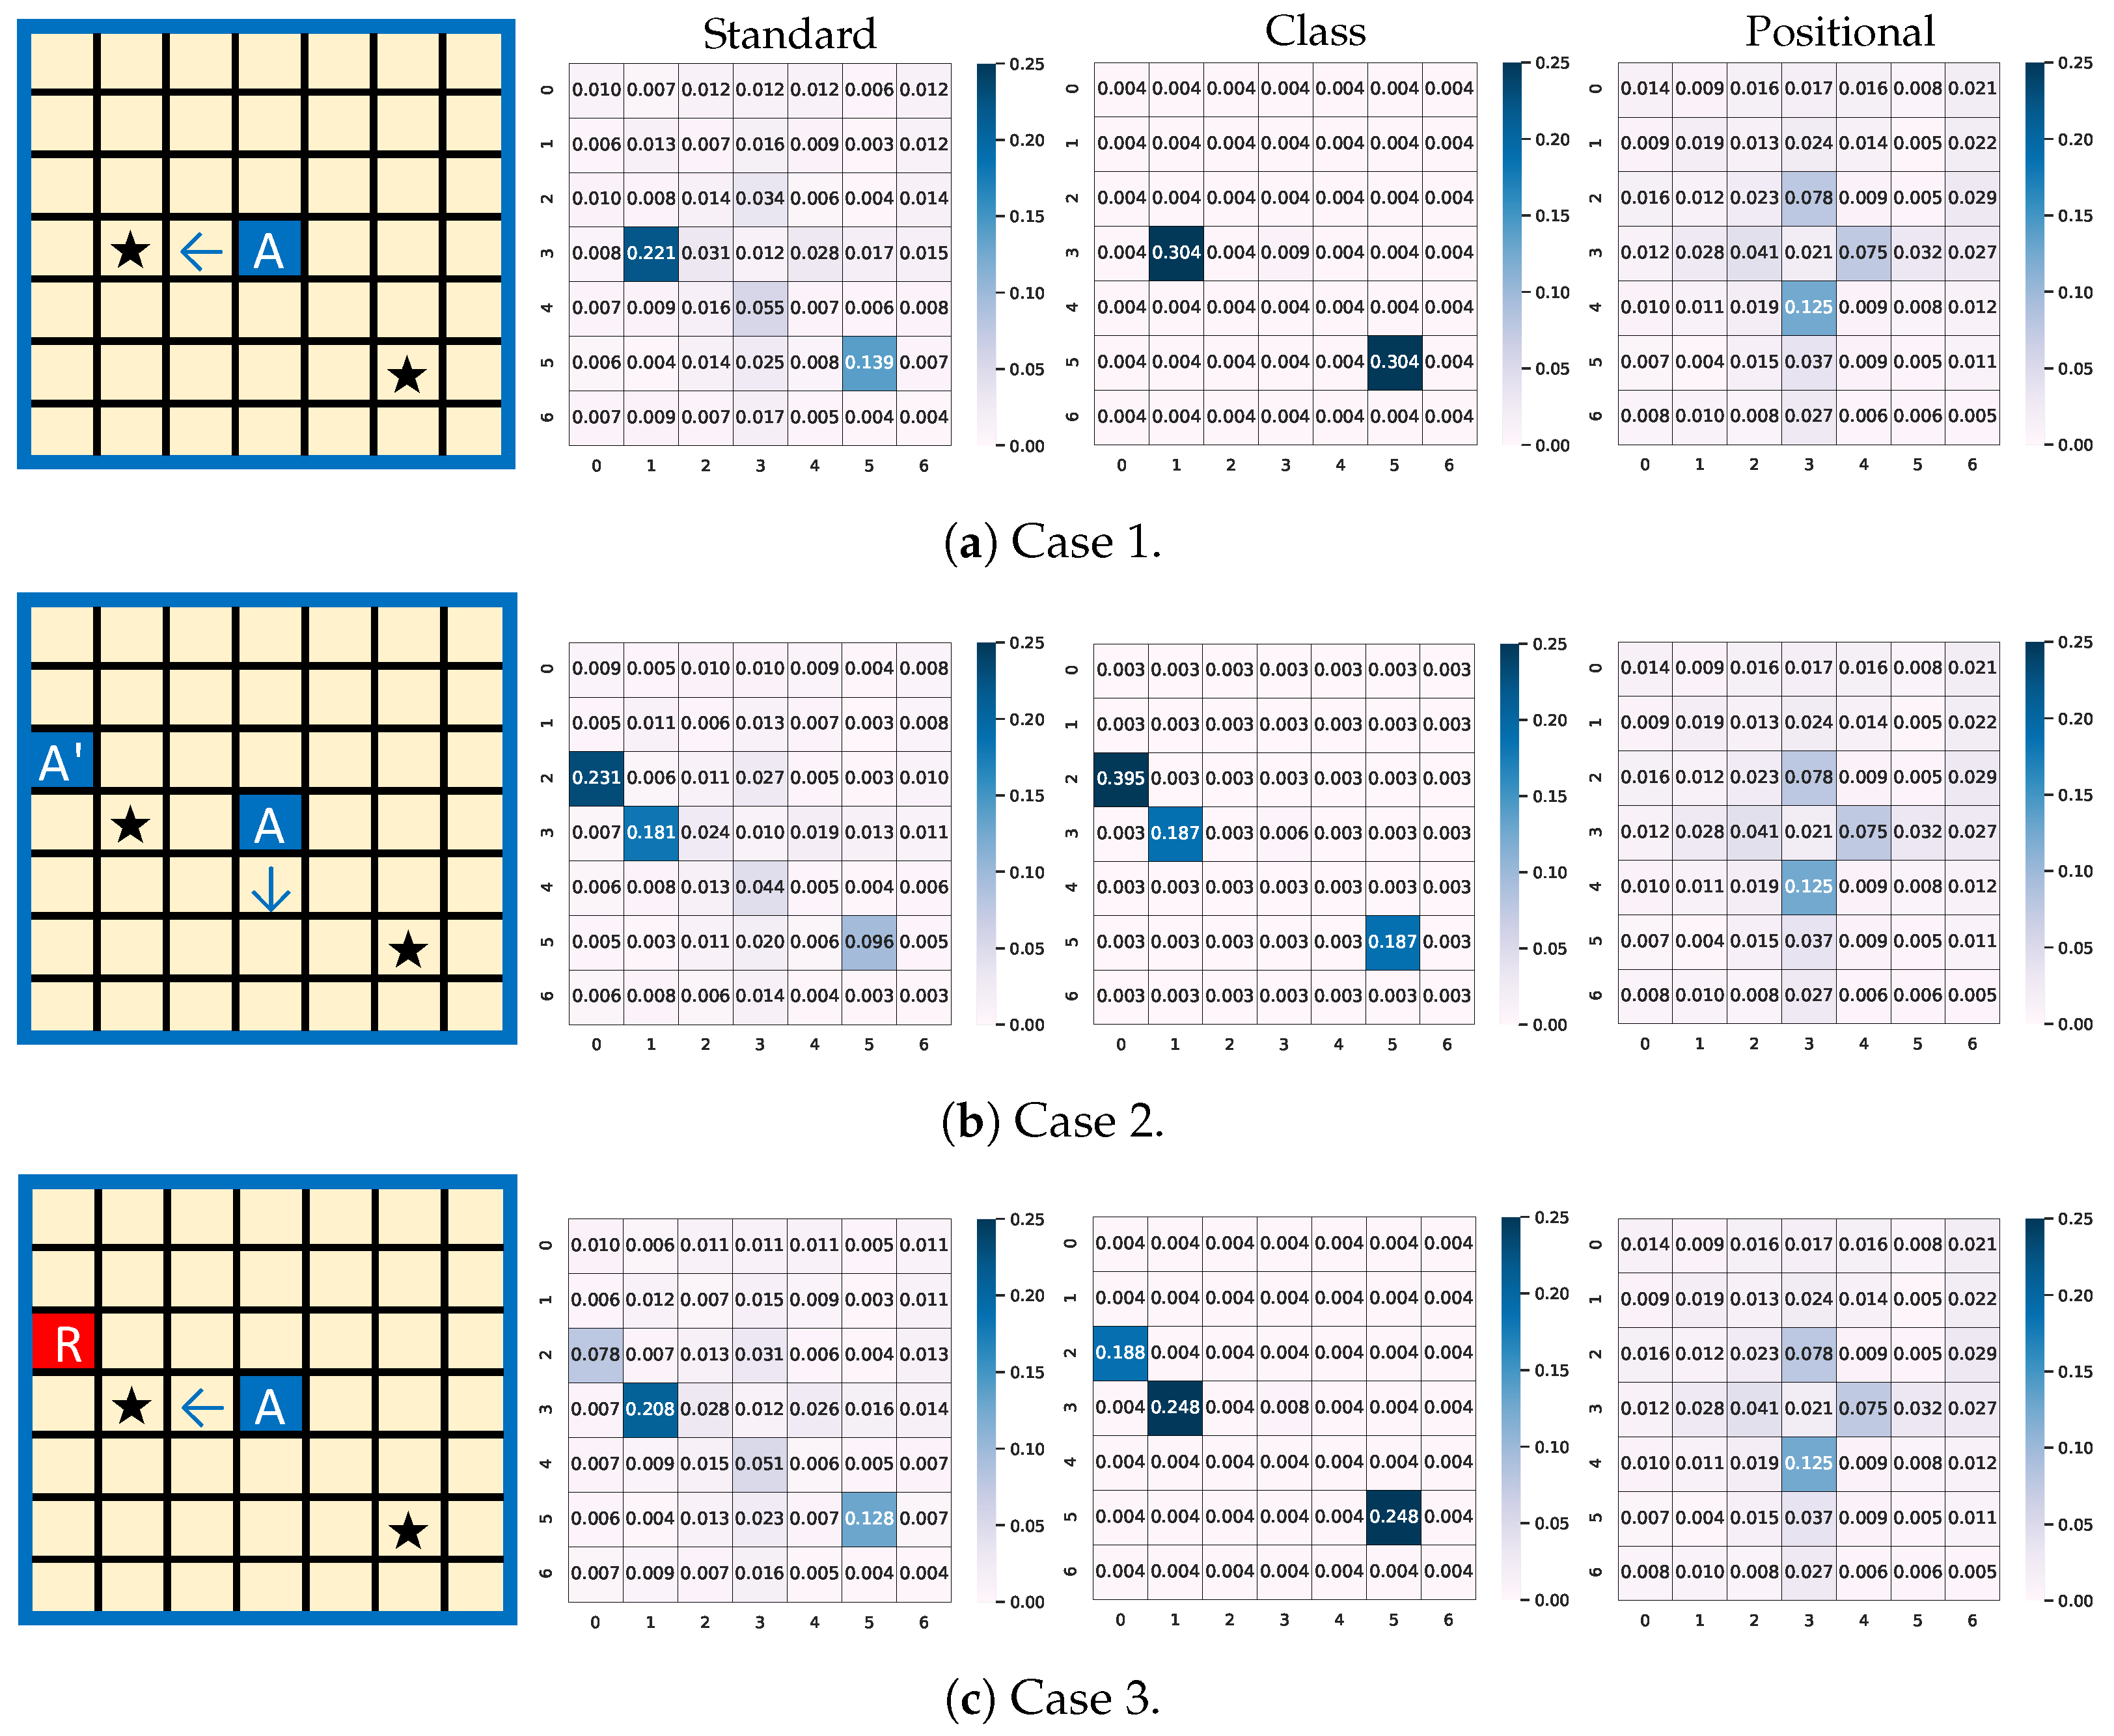
It was confirmed that eDA3-DQN and eDA3-IQN agents learn to adapt to the object collection game in the environment. In addition to the performance improvement of eDA3-X agents (Figure 3 and Table 1), eDA3-X agents can provide the information to interpret their decisions unlike agents with the baseline methods. Therefore, we first analyzed the interpretability of eDA3-X agents with the local view method. Note that eDA3-DQN agents provided similar interpretability as eDA3-IQN agents; hence, we only analyzed the attention of the eDA3-IQN agents. Figure 4 shows the attention heatmaps of a trained eDA3-IQN agent named agent A in three different cases when it behaves cooperatively. The left figure in Figure 4 is an observation of agent A. The color and marks in the observation are identical to those in Figure 1a, and the blue arrow next to agent A expresses the direction of the next movement. Three attention heatmaps depict the standard, class, and positional attention heatmaps of agent A from left to right, respectively. Each value in the attention heatmaps corresponds to the same segment in the observation, and each value in the attention heatmap is the attention weight. Note that positional attention heatmaps are identical throughout the three cases because positional attention shows the underlying focus strategy and is not affected by individual observations (see Equation (6)).
In Case 1, agent A finds two objects at different distances and approaches the closer object, as shown in Figure 4a. This action is explained as agent A assigns higher attention weight to the closer object than to the farther one ( 0.221 and 0.139 , respectively), according to the standard attention heatmap in Figure 4a. The standard attention heatmap also demonstrates that agent A assigns attention weight to its surrounding cells as its right, upside, left, and downside cells show attention weights of 0.028 , 0.034 , 0.031 , and 0.055 , respectively. This phenomenon has already been reported in previous studies [17,18] but with an insufficient explanation of this feature; for example, we cannot explain using only standard attention why the lower cell has a larger weight of 0.055 than that of the left cell ( 0.031 ), which is the position after the next move. On the other hand, with eDA3-X, we can explain that the lower cell is assigned a larger attention weight in the standard attention because the lower cell is usually more focused ( 0.125 ) than left cell ( 0.041 ) regardless of observation situation, according to the positional attention heatmap.
Besides the discussion on the standard attention, we discuss the explanation based on the class and positional attention. In the class attention heatmap in Case 1, agent A assigns a high attention weight of 0.304 on both objects, 0.009 on itself and 0.004 elsewhere. In the positional attention, values of attention weight around agent A are relatively higher ( 0.075 , 0.078 , 0.041 , and 0.125 ); this implies that agents are slightly but always aware of their surroundings. Note that because only standard attention heatmaps are generated by DA3-X [18], the detailed explanation provided by class and positional attentions is the interpretation made possible by eDA3-X.
Figure 4b (Case 2) is a demonstration of agent A behaving cooperatively when it observes agent A’, which is an intelligent coworker, along with two objects. Accordingly, agent A yields agent A’ for the closer object and moves downward to approach a slightly farther object. The standard attention heatmap shows high intensity on agent A’ ( 0.231 ) and a decrease in the attention weight on the closer object as it changes from 0.221 in Case 1 to 0.181 in Case 2. We can verify that such differences in attention weight are derived from class attention. Once agent A sees agent A’ nearby, it puts 0.395 of attention weight on the coworker and relatively less attention ( 0.187 ) on objects, indicating the high impact of the existence of agent A’ for agent A’s decision-making process.
Lastly, agent A ignores agent R, which is a roaming agent, and approaches a closer object in Case 3 (Figure 4c). In other words, agent A successfully recognizes agent R as an irrational agent and learns that it is unworthy to coordinate with agent R. Unlike in Case 2 shown in Figure 4b, agent A assigns only 0.078 of attention weight on agent R, as shown in the standard attention heatmap in Figure 4c. This decrement of attention weight on agent R is derived from the class attention because it indicates a higher attention weight on objects than that on agent R ( 0.248 and 0.188 ).

5.4. Positional Attention Analysis

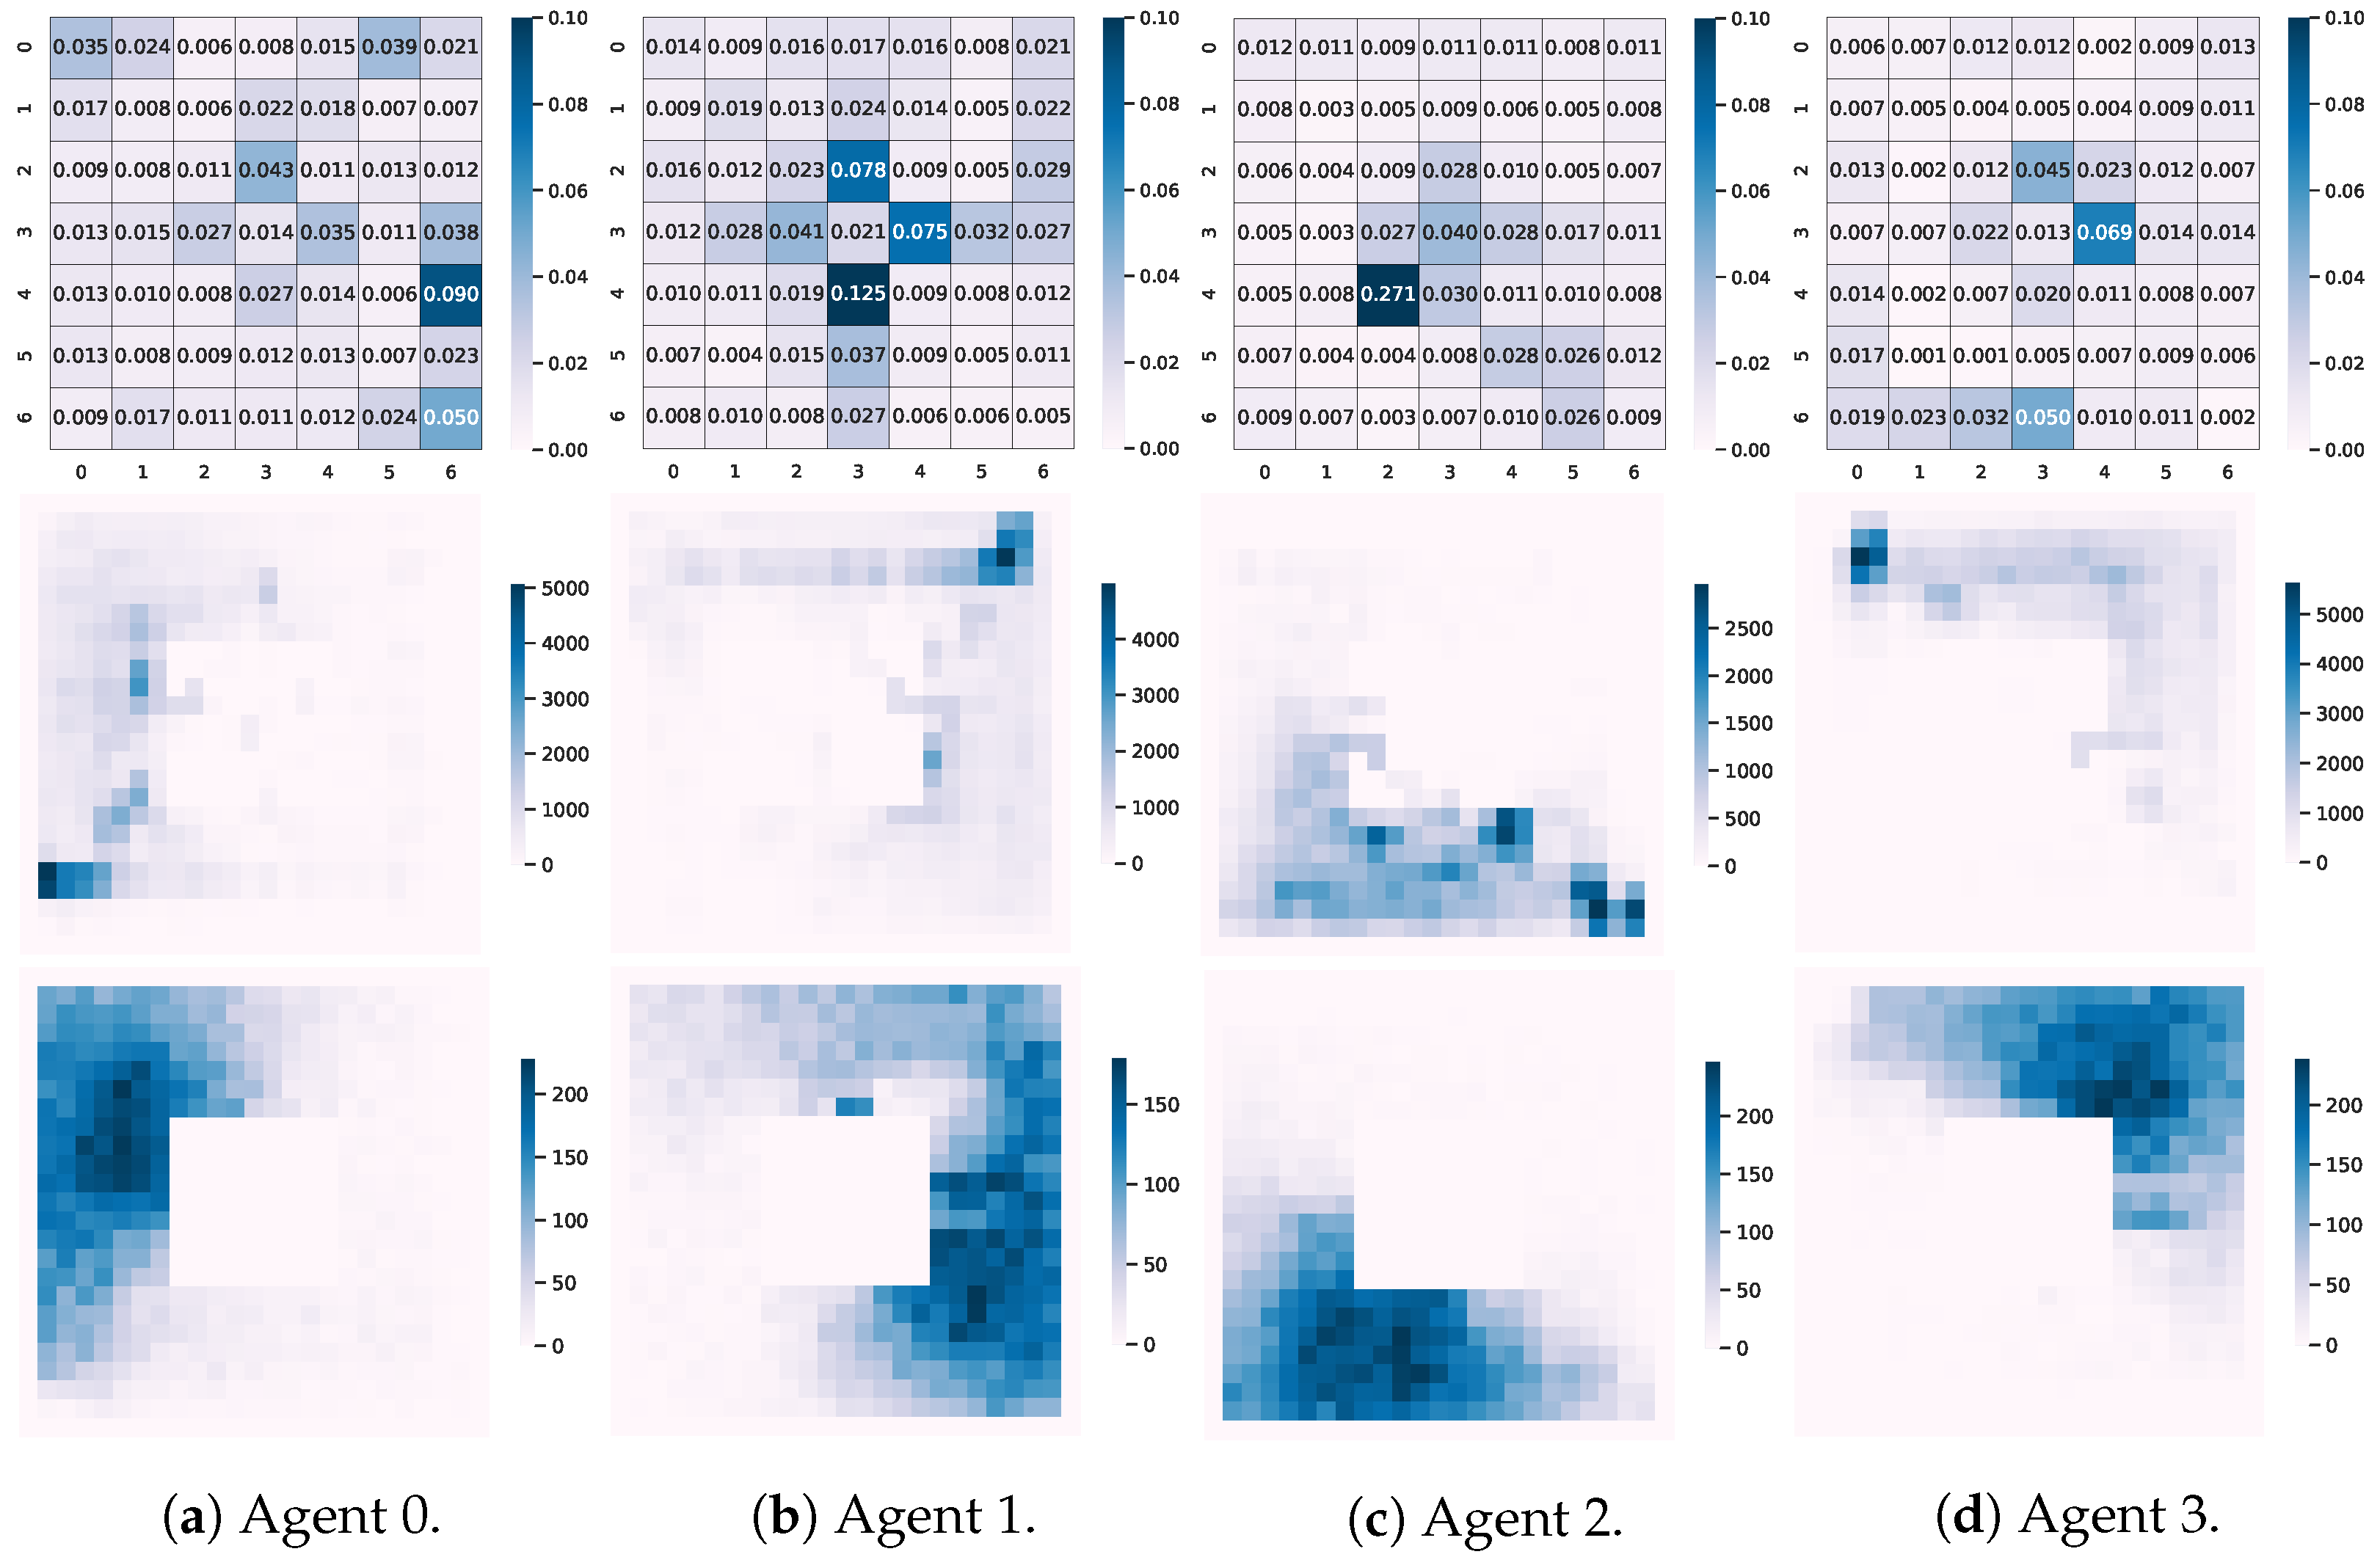
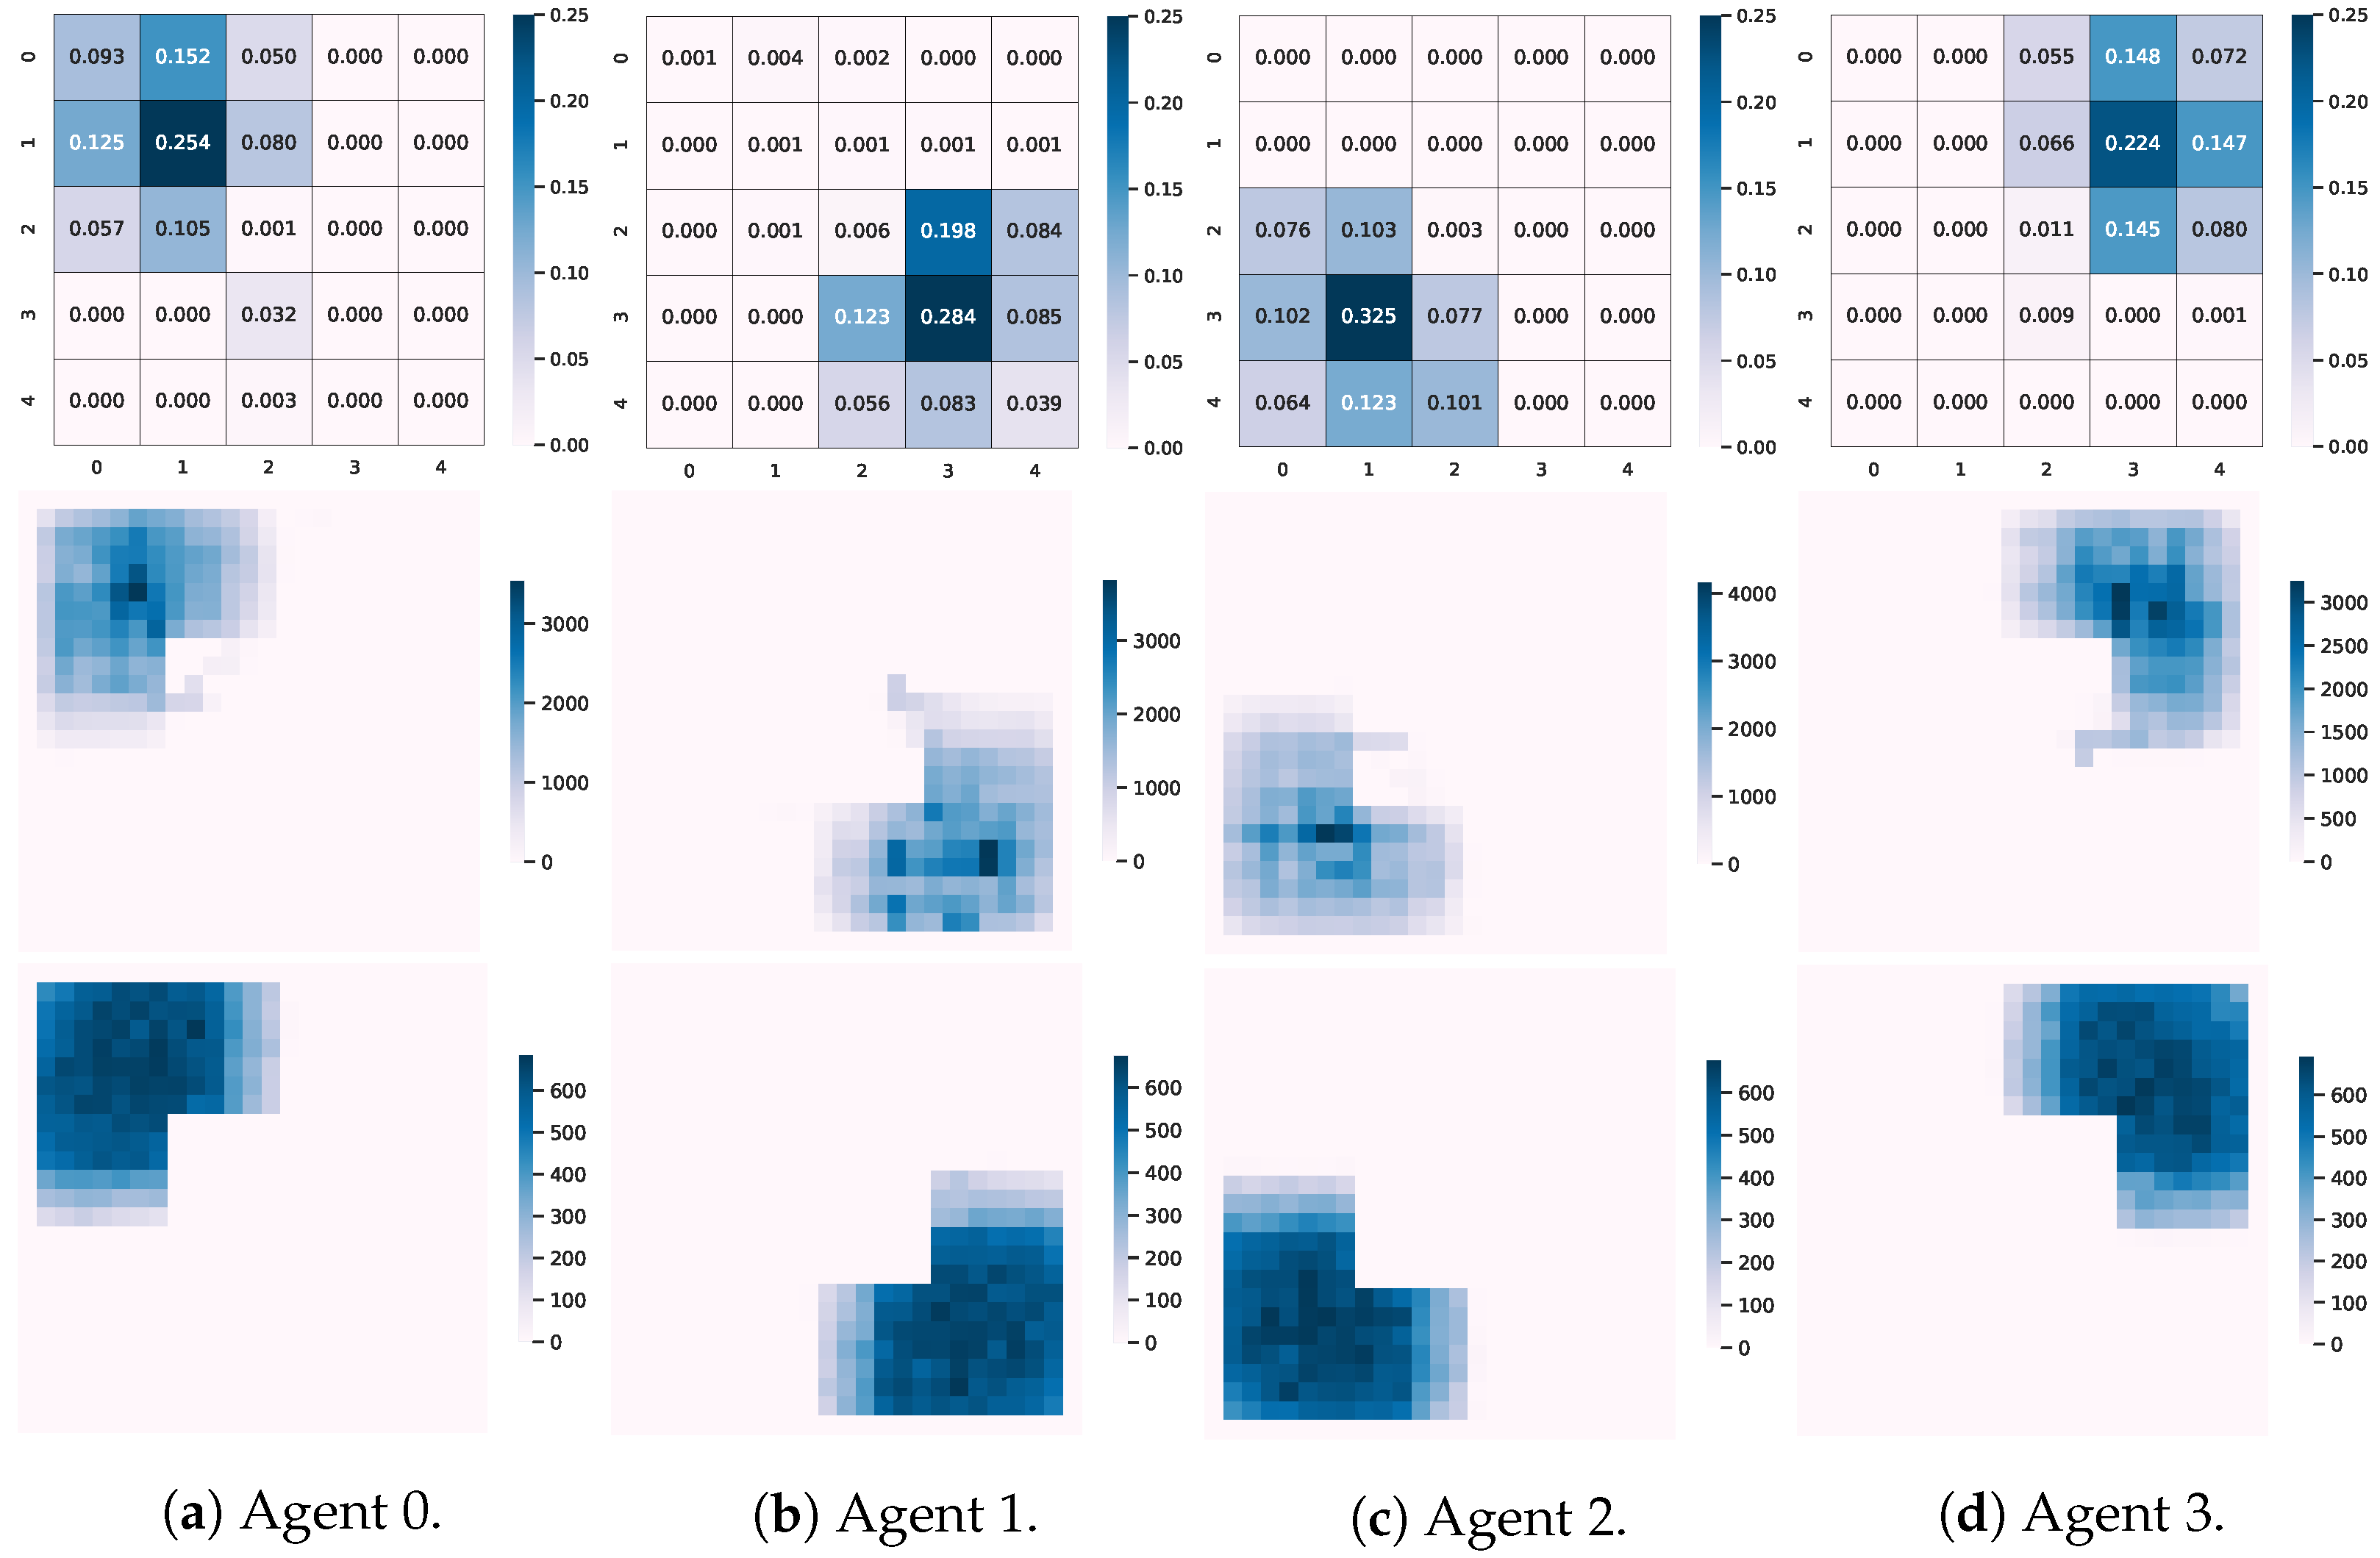
In this section, we discuss the contribution of positional attention to the performance difference between the two observation methods and the effects of observation methods on cooperative behaviors as the attention heatmaps indicate the underlying strategy where they focus their attention acquired during learning. We present three types of heatmaps for eDA3-IQN agent i ( { 0 , 1 , 2 , 3 } ) in Figure 5 and Figure 6: the positional attention heatmap (top), the heatmap of agent i’s trajectory indicating where i visited through 1000 episodes (middle), and the heatmap indicating where agent i collected objects through 1000 episodes (bottom). For this analysis, we removed the constraints of designated areas of object collection to evaluate the agents’ ability to learn their areas of responsibility correctly; in other words, we replaced all green and red regions to beige regions in Figure 1a. Thus, agents were allowed to collect objects anywhere in the environment E . The heatmaps of agent 4 and agent 5 were omitted as they were roaming agents. Notably, the positional attention heatmaps of local views are 7 × 7 in Figure 5, whereas those of relative views are 5 × 5 , as shown in Figure 6. This difference is because the environment size is G X × G Y = 25 × 25 , and the patch size is P = 5 for the relative view method. Thus, each attention weight at each segment of the attention heatmaps in Figure 6 corresponds to a 5 × 5 area of the environment.
The attention heatmaps depicted in Figure 5 reveal that eDA3-IQN agents typically focus on their adjacent cells. Notably, the region of attention varies for each agent; for example, the positional attentions of agent 0, agent 1, and agent 3 are mainly directed towards the neighboring and boundary cells (Figure 5a,b,d) whilst that of agent 2 indicates high attention on the neighboring cells only (Figure 5c). The heatmaps of object collection indicate that the agents roughly divide the environment for exploration. Each agent is responsible for the region around a particular corner. However, the trajectory heatmaps in Figure 5 indicate that agents move in the same regions; for instance, agent 1 sometimes explored the upper region where agent 2 and agent 3 were collecting objects. Similarly, agent 2 also covered the areas partly overlapped with agent 0 and agent 1. In other words, agents sometimes move into another agent’s region to collect objects whilst the other agent is distant from it. We interpret this behavior as a combination of two strategies: (1) segmenting the area per agent and (2) moving in the same direction collecting objects. As a result of following two strategies, agents with the local view method obtain such a vague allocation of regions that leads to lower performance compared to agents with the relative view method.
The relative view method leads to a nearly equal distribution of the environment among agents, as illustrated in Figure 6. The positional attention heatmaps of each agent highlight the same region that they mostly explore because of the rough ( P = 5 ) global positions. For instance, agent 0’s attention is mainly focused on the upper-left region of its heatmap, which corresponds to its areas of exploration and object collection, as depicted in Figure 6a. Other agents also assume responsibility for specific regions of the environment and rarely interfere with one another. It is indeed interesting that regions that agents mostly take care of can be interpreted by visualizing the positional attention heatmaps from each eDA3-X agent. Consequently, the performance of eDA3-X agents significantly improves when using the relative view method to observe the environment. Unlike agents with the local view method that follow two strategies, agents with the relative view method seem to follow only one solid strategy: segmenting the area for each agent. Hence, agents with the relative view achieve an explicit allocation of regions per agent, resulting more efficient performance.

5.5. Positional Attentions Analysis from Respective Channels

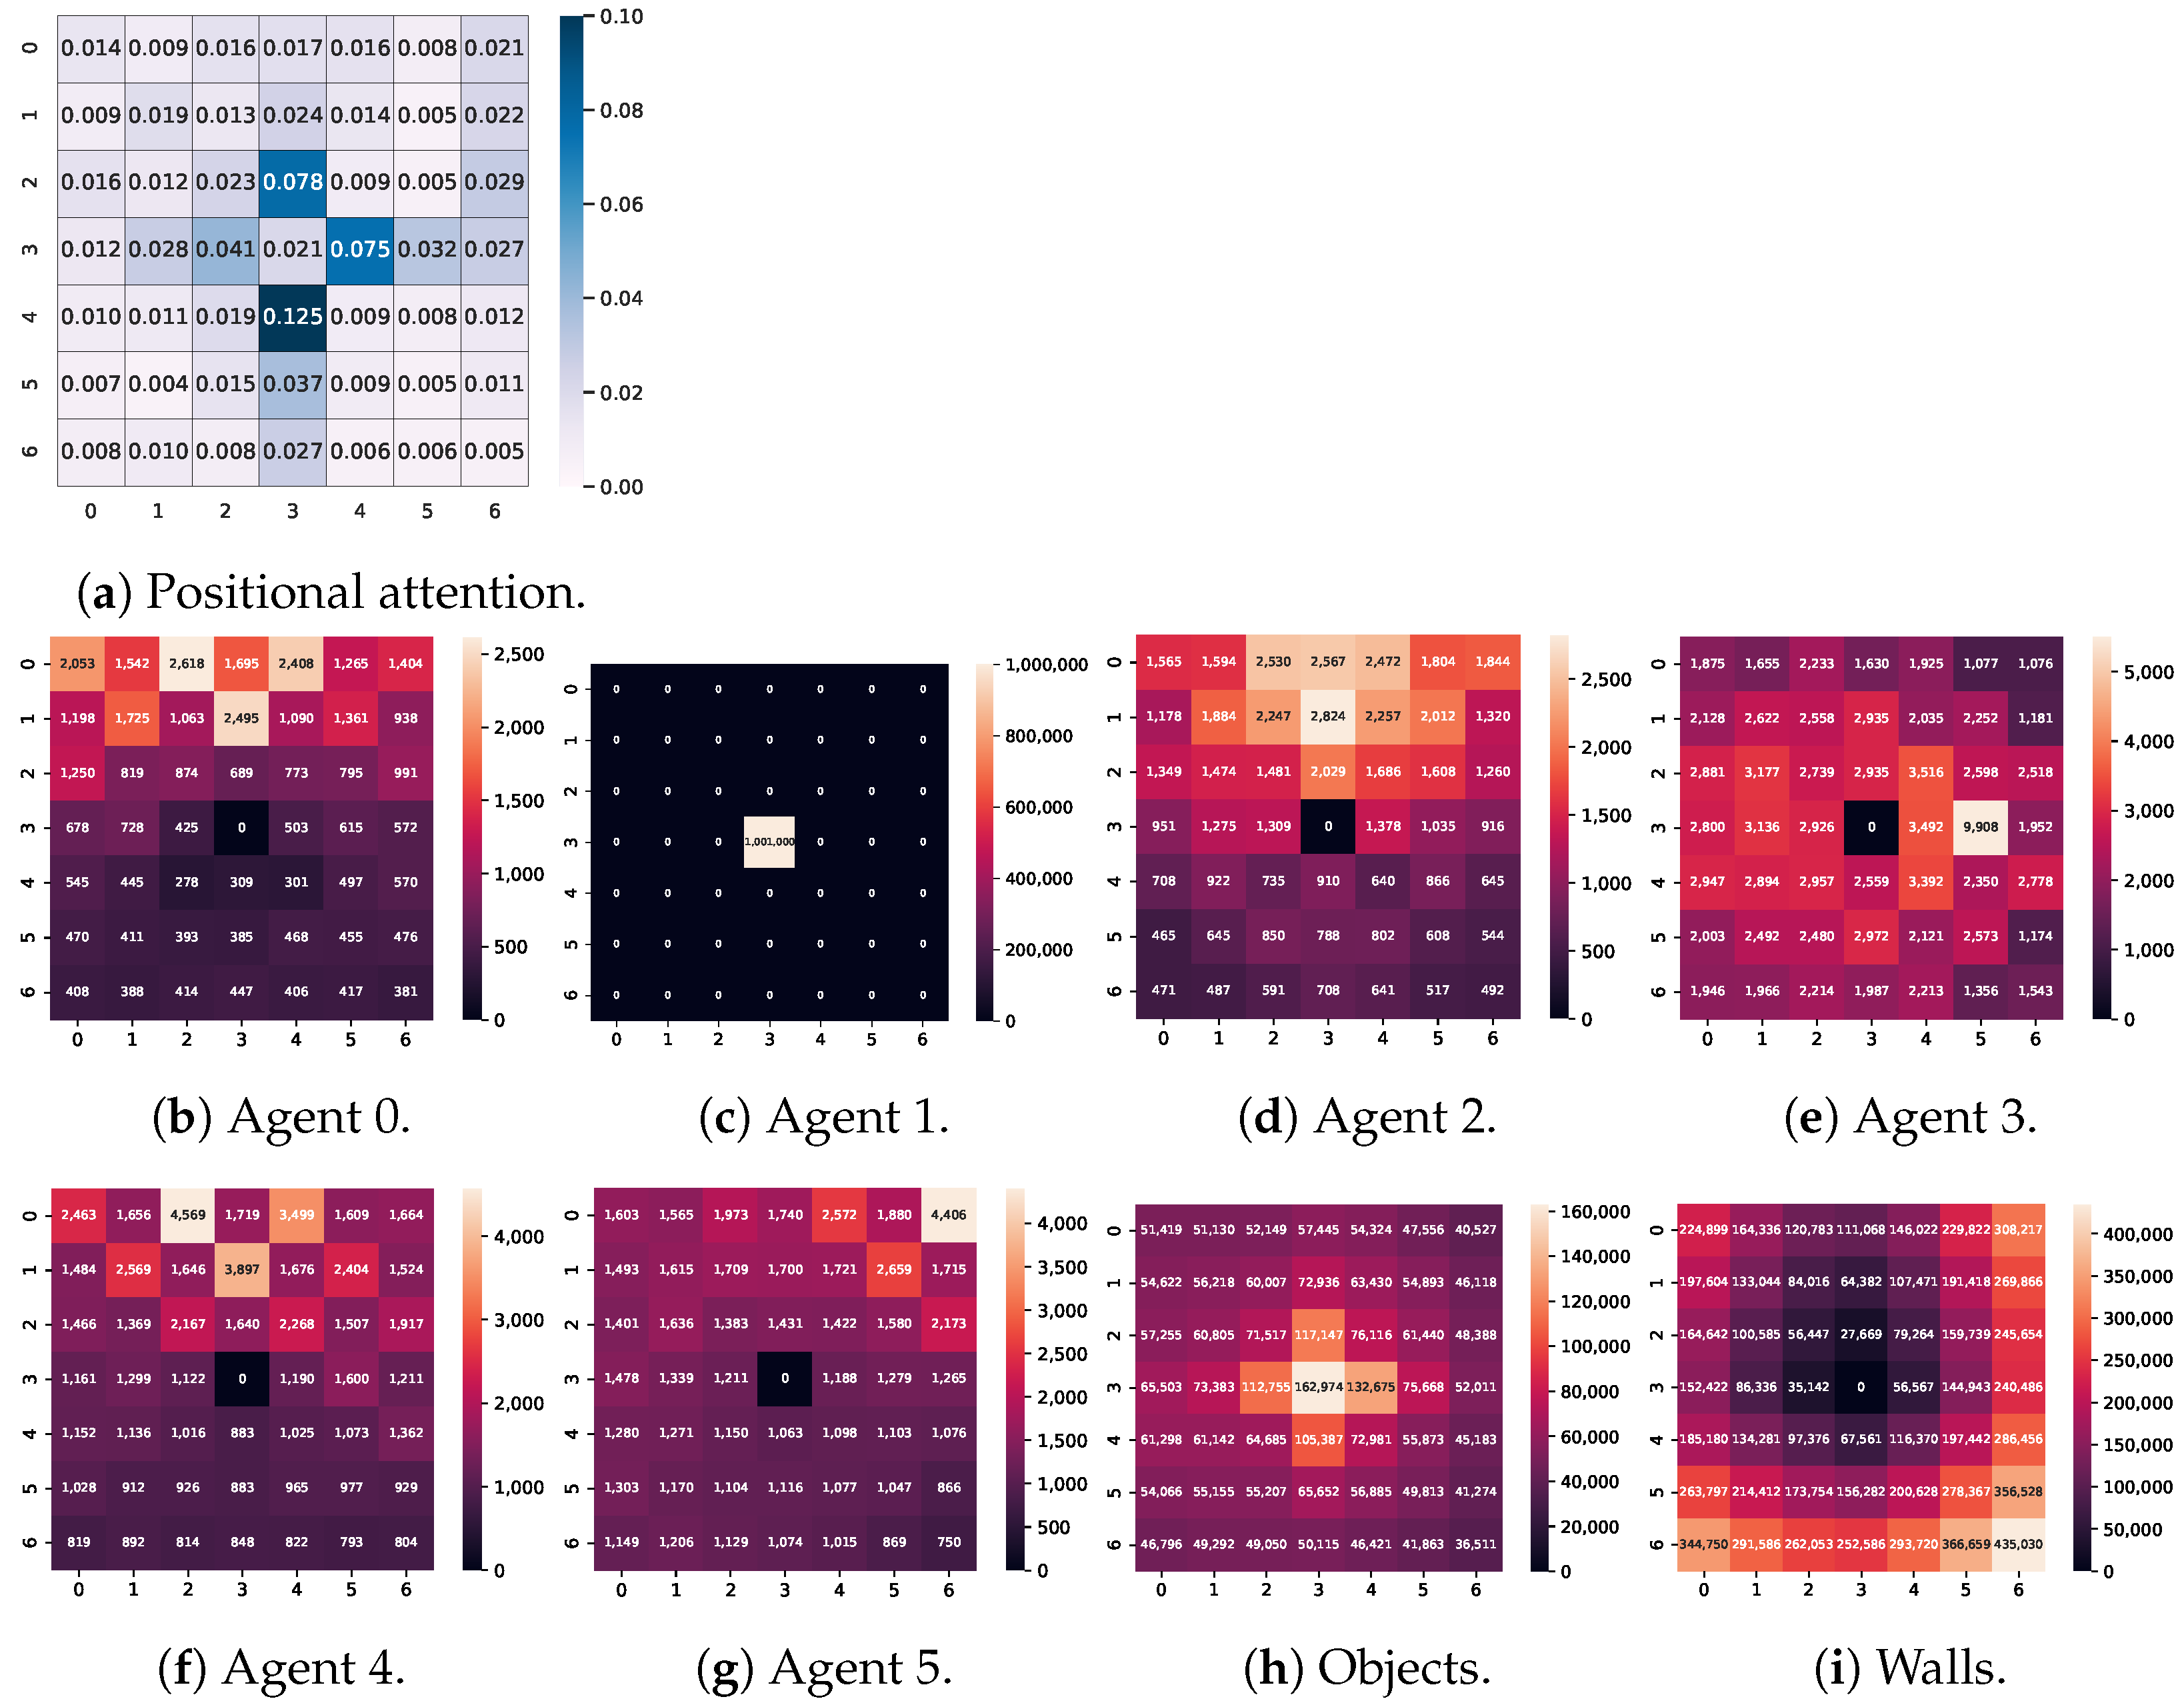
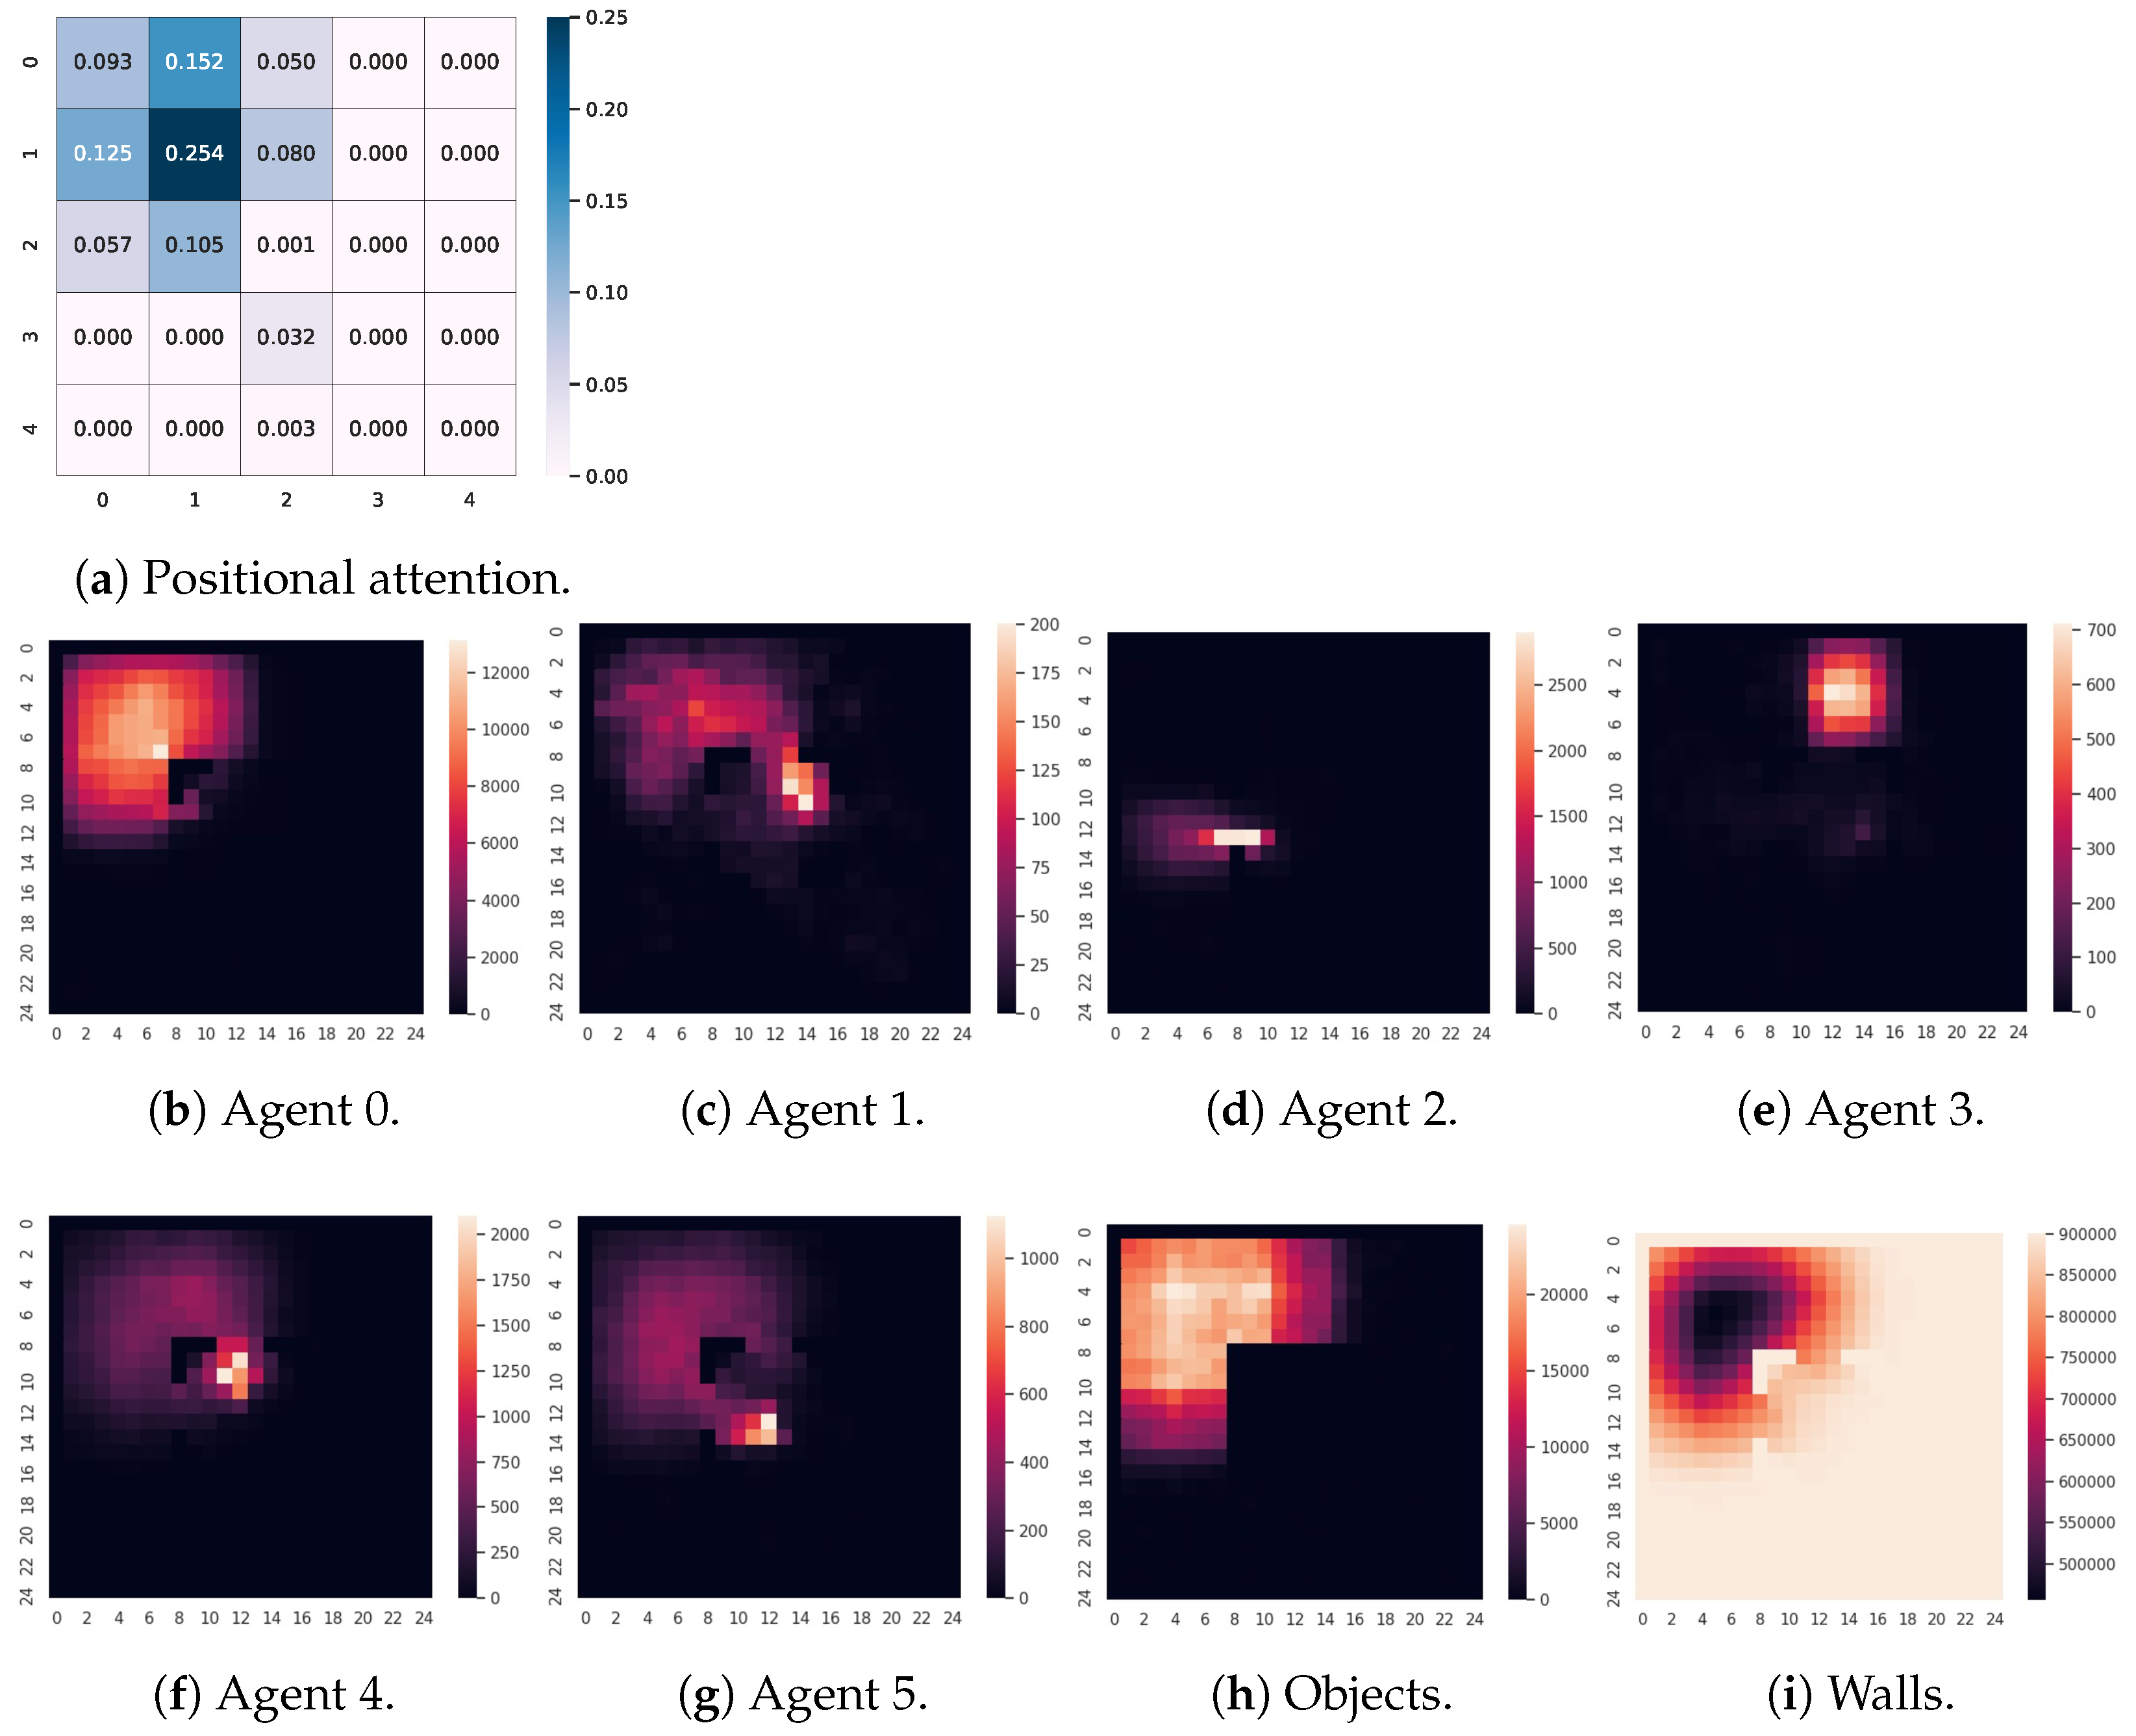
We discussed how the positional attention varies depending on observation methods. In this analysis, we further examined how the positional attention is correlated with respective observation channels. Figure 7 and Figure 8 present the positional attention heatmaps of a trained eDA3-IQN agent using the local view (Figure 7a) and relative view methods (Figure 8a) as well as the heatmaps indicating how many times an agent, object, and wall were observed (i.e., count 1 or 1 ) at specific cells in respective observation channels over 5000 episodes of the training phase. Our experiments used N C = 8 channels, and the second and third rows in Figure 7 and Figure 8 show eight heatmaps. As with the example in Figure 1, the first six channels in the observation (Figure 7b–g and Figure 8b–g are dedicated to agents, while the seventh and eighth channels (Figure 7h,i and Figure 8h,i are for object observation and visible area. Note that the accumulated values in the visible sight heatmaps (Figure 7i and Figure 8i) are multiplied by 1 to visualize explicitly, as the visible sight within walls is encoded in { 0 , 1 } as shown in Figure 1b,c.
Figure 7 displays the positional attention and the accumulated counts heatmap of agent 1 that mainly explores the lower right region of the environment with the local view Figure 5b. The positional attention heatmap of agent 1 highlights only its center, which corresponds to its location (Figure 7c). According to the positional attention heatmap in Figure 7a, agent 1 mainly focuses on its four adjacent cells with attention weights of 0.075 , 0.078 , 0.041 , and 0.125 , corresponding to locations where objects have been frequently observed at the seventh channel ( 132 , 675 times on the right, 117 , 147 times on the left, 112 , 755 times on the top, and 105 , 387 times at the bottom), as shown in Figure 7h. In contrast, only an attention weight of 0.021 is assigned to the center despite objects appearing 162 , 974 times at this location (Figure 7a,h). Therefore, we verify that eDA3-X agents tend to focus their attention on neighboring cells and less attention on distant location, anticipating immediate object collection and rewards from their subsequent actions and considering distant objects less influential in their decision-making process.
Furthermore, the attention heatmap (Figure 7a) places significant attention weight where other agents are frequently detected (Figure 7b–e). For instance, agent 0 and agent 2, which mostly explored the left and lower region of the environment (Figure 5a,c), were observed 2495 and 2824 times at two cells away in the upper direction from agent 1. Agent 4, which randomly moved in the environment, was also observed 3897 times at the same cell. As mentioned in Section 5.4, agents sometimes explored the same regions. Consequently, agent 1 assigned an attention weight of 0.024 to the corresponding cell, which was relatively high when compared to that of other cells (Figure 7a). Similarly, agent 3 was observed 9908 times at the two cells away in the right direction, resulting in a relatively high attention weight ( 0.032 ). Agent 1 also focused on the lower segments, possibly because it frequently encountered walls on the lower side of the environment (Figure 7i). Thus, we confirmed that eDA3-X agents also pay close attention to the areas where other agents are detected, indicating that the agents aim to avoid collisions with them.
The positional attention heatmap and observation of agent 0 in Figure 8 reveal that the eDA3-X agent with relative view method mainly focuses on the area that agent 0 explored, unlike the previous positional attention analysis with the local view method, as shown in Figure 8a,h,i. The positional attention does not highlight the region where other agents are frequently observed, even though agent 1, agent 2, and agent 3 are observed up to 200, 2500, and 700 times. The counts of encountering other agents with a relative view are much fewer than those with a local view, as shown in Figure 6, as can be expected given the clear allocation of regions in the environment. Since agents can determine their global positions through relative views in a bottom-up manner, we confirmed that eDA3-X agents with the relative view method can perform well by directing their positional attention to the areas where they are responsible for collecting objects.

6. Discussion

In our study, we conducted a quantitative analysis of learning performance, comparing agents using the eDA3-X model to those utilizing the baseline method. We found that agents equipped with eDA3-X not only exhibited improved interpretability but also outperformed agents using the baseline method. As previously reported in the literature, the attention mechanism provides agents with the ability to adapt flexibly to their environment [18]. By leveraging the attention weights to selectively focus on important segments of their observations, agents utilizing eDA3-X achieved more efficient learning performance compared to those relying on the baseline methods. Notably, the improvement in learning performance was particularly remarkable when employing a simple neural network architecture (specifically, DQN in this paper) within the DRL head in eDA3-X. This finding suggests that the limited information available in observations can be leveraged more effectively for learning performance when using a simple reinforcement learning algorithm.
Through experiments and attention analysis, we validated the interpretability of eDA3-X agents by examining their standard, class, and positional attention heatmaps. Our analysis of the standard attention heatmaps and cooperative behaviors indicates that eDA3-IQN agents selectively assign attention weight to their observations based on the intensity of interest, focusing on nearby objects when multiple objects are present. Additionally, these agents give high attention to other agents. When encountering agents that behave randomly, the eDA3-X agents seem to learn that adaptation is not worthwhile. While this feature has been previously reported, in this paper, we further classified standard attention into class and positional attention for a more granular analysis. The comparison of attention weight in the class attention may allow one to interpret the efficiency of eDA3-X agents to perceive each element type in the observation regardless of location. For example, as illustrated in Figure 4b,c, our analysis points towards some agent considering another similar agent more important than objects, while it deems a randomly behaving agent less significant. Furthermore, we discussed the potential of positional attention conveys distinct meanings based on either a local or relative observation method. In the case of the local view method, the positional attention may reveal the areas where eDA3-X agents pay attention, as demonstrated in Figure 4. Conversely, with the relative view method, the positional attention may indicate the region an agent learned to be responsible for.
In addition to the above analysis, we examined the development of positional attention throughout training. As shown in Figure 7 and Figure 8, the agents assign positional attention weight based on relevant information, such as frequently observed agents, objects, and edge of the environment. As previously mentioned, eDA3-X agents using the local view method focus on their four adjacent cells and the area where other agents are often observed, while those using the relative view method focus on their assigned region. We believe that this difference in positional attention contributes significantly to the disparity in learning performance.
Limitations: For our approach, there may still be limitations in terms of quantitatively evaluating the interpretability of agents. In this study, we introduced the observation mechanism of eDA3-X agents through attention heatmaps, for which we illustrated the potential value for explanations. However, the lack of quantitative evaluation on explainability may be critical in safety-critical applications such as self-driving systems, where high safety and algorithmic accountability must be ensured. Hence, to overcome such limitations, our next study will focus on conducting a quantitative examination of the decision-making process transparency of the agents through attention heatmaps.
In this paper, we have presented our results and findings based on experiments conducted in the object collection game. However, it is important to note a primary limitation of our approach, which is that eDA3-X is currently applicable only to grid-like environments, as depicted in Figure 1a. In real-world applications, continuous environments such as the multi-agent particle environment [16] are more prevalent. Additionally, our attention analysis has been limited to a few specific cases in a simple scenario within this paper. In order to thoroughly evaluate the versatility of interpretability provided by eDA3-X, further investigation of our proposed method and attention analysis across a diverse range of environments and test cases is required.

7. Conclusions

In this study, we introduced eDA3-X as a novel method to enhance the interpretability of agents in multi-agent deep reinforcement learning. Our proposed approach was validated through experiments conducted using the object collection game. The result quantitatively demonstrates that eDA3-X agents outperform baseline algorithms using the saliency vector. With an initial analysis, we identified indicators how eDA3-X agents effectively adapt to other agents by analyzing the three types of attention heatmaps generated from the attention weights in the local transformer encoder. Additionally, we explored the development of positional attention, a feature that has not been extensively studied before. Our findings show that the positional attention heatmaps exhibit distinct characteristics depending on the observation method.

Author Contributions

Writing—original draft, Y.M.; Writing—review & editing, T.S. All authors have read and agreed to the published version of the manuscript.

Funding

This work was partly supported by JSPS KAKENHI Grant Number 20H04245.

Data Availability Statement

Publicly available datasets were analyzed in this study. This data can be found here: [https://github.com/Yoshi-0921/MAEXP] (accessed on 1 July 2023).

Conflicts of Interest

The authors declare no conflict of interest.

References

  1. Milani, S.; Topin, N.; Veloso, M.; Fang, F. A Survey of Explainable Reinforcement Learning. arXiv 2022, arXiv:2202.08434. [Google Scholar] [CrossRef]
  2. Puiutta, E.; Veith, E.M.S.P. Explainable Reinforcement Learning: A Survey. In Proceedings of the Machine Learning and Knowledge Extraction, Dublin, Ireland, 25–28 August 2020; Holzinger, A., Kieseberg, P., Tjoa, A.M., Weippl, E., Eds.; Springer International Publishing: Cham, Switzerland, 2020; pp. 77–95. [Google Scholar]
  3. Heuillet, A.; Couthouis, F.; Díaz-Rodríguez, N. Explainability in deep reinforcement learning. Knowl.-Based Syst. 2021, 214, 106685. [Google Scholar] [CrossRef]
  4. Guo, W.; Wu, X.; Khan, U.; Xing, X. EDGE: Explaining Deep Reinforcement Learning Policies. Adv. Neural Inf. Process. Syst. 2021, 34, 12222–12236. [Google Scholar]
  5. Anderson, A.; Dodge, J.; Sadarangani, A.; Juozapaitis, Z.; Newman, E.; Irvine, J.; Chattopadhyay, S.; Fern, A.; Burnett, M. Explaining Reinforcement Learning to Mere Mortals: An Empirical Study. In Proceedings of the 28th International Joint Conference on Artificial Intelligence, IJCAI’19, Macao, China, 10–16 August 2019; AAAI Press: Washington, DC, USA, 2019; pp. 1328–1334. [Google Scholar]
  6. Bica, I.; Jarrett, D.; Huyuk, A.; van der Schaar, M. Learning “What-if” Explanations for Sequential Decision-Making. In Proceedings of the International Conference on Learning Representations, Virtual Event, 3–7 May 2021. [Google Scholar]
  7. Juozapaitis, Z.; Koul, A.; Fern, A.; Erwig, M.; Doshi-Velez, F. Explainable Reinforcement Learning via Reward Decomposition. In Proceedings of the International Joint Conference on Artificial Intelligence. A Workshop on Explainable Artificial Intelligence, Macao, China, 10–16 August 2019. [Google Scholar]
  8. Sundararajan, M.; Taly, A.; Yan, Q. Axiomatic Attribution for Deep Networks. In Proceedings of the 34th International Conference on Machine Learning—Volume 70, ICML’17, Sydney, Australia, 6–11 August 2017; JMLR: Norfolk, MA, USA, 2017; pp. 3319–3328. [Google Scholar]
  9. Zahavy, T.; Ben-Zrihem, N.; Mannor, S. Graying the black box: Understanding DQNs. In Proceedings of the 33rd International Conference on Machine Learning, New York, NY, USA, 20–22 June 2016; Proceedings of Machine Learning Research. Balcan, M.F., Weinberger, K.Q., Eds.; PMLR: Norfolk, MA, USA; Volume 48, pp. 1899–1908. [Google Scholar]
  10. Weitkamp, L.; van der Pol, E.; Akata, Z. Visual Rationalizations in Deep Reinforcement Learning for Atari Games. In Proceedings of the Artificial Intelligence, Hertogenbosch, The Netherlands, 8–9 November 2018; Atzmueller, M., Duivesteijn, W., Eds.; Springer International Publishing: Cham, Switzerland, 2019; pp. 151–165. [Google Scholar]
  11. Huber, T.; Schiller, D.; André, E. Enhancing Explainability of Deep Reinforcement Learning Through Selective Layer-Wise Relevance Propagation. In Proceedings of the KI 2019: Advances in Artificial Intelligence, Kassel, Germany, 23–26 September 2019; Springer: Berlin/Heidelberg, Germany, 2019; pp. 188–202. [Google Scholar] [CrossRef]
  12. Vaswani, A.; Shazeer, N.; Parmar, N.; Uszkoreit, J.; Jones, L.; Gomez, A.N.; Kaiser, L.u.; Polosukhin, I. Attention is All you Need. In Advances in Neural Information Processing Systems; Guyon, I., Luxburg, U.V., Bengio, S., Wallach, H., Fergus, R., Vishwanathan, S., Garnett, R., Eds.; Curran Associates, Inc.: Red Hook, NY, USA, 2017; Volume 30. [Google Scholar]
  13. Dosovitskiy, A.; Beyer, L.; Kolesnikov, A.; Weissenborn, D.; Zhai, X.; Unterthiner, T.; Dehghani, M.; Minderer, M.; Heigold, G.; Gelly, S.; et al. An Image is Worth 16 × 16 Words: Transformers for Image Recognition at Scale. In Proceedings of the International Conference on Learning Representations, Virtual Event, 3–7 May 2021. [Google Scholar]
  14. Chen, L.; Lu, K.; Rajeswaran, A.; Lee, K.; Grover, A.; Laskin, M.; Abbeel, P.; Srinivas, A.; Mordatch, I. Decision transformer: Reinforcement learning via sequence modeling. Adv. Neural Inf. Process. Syst. 2021, 34, 15084–15097. [Google Scholar]
  15. Iqbal, S.; Sha, F. Actor-Attention-Critic for Multi-Agent Reinforcement Learning. In Proceedings of the 36th International Conference on Machine Learning, Long Beach, CA, USA, 9–15 June 2019; Proceedings of Machine Learning Research. Chaudhuri, K., Salakhutdinov, R., Eds.; PMLR: Norfolk, MA, USA; Volume 97, pp. 2961–2970. [Google Scholar]
  16. Lowe, R.; Wu, Y.; Tamar, A.; Harb, J.; Abbeel, P.; Mordatch, I. Multi-Agent Actor-Critic for Mixed Cooperative-Competitive Environments. In Proceedings of the 31st International Conference on Neural Information Processing Systems, NIPS’17, Long Beach, CA, USA, 4–9 December 2017; Curran Associates, Inc.: Red Hook, NY, USA, 2017; pp. 6382–6393. [Google Scholar]
  17. Motokawa, Y.; Sugawara, T. MAT-DQN: Toward Interpretable Multi-Agent Deep Reinforcement Learning for Coordinated Activities. In Proceedings of the Artificial Neural Networks and Machine Learning—ICANN 2021: 30th International Conference on Artificial Neural Networks, Bratislava, Slovakia, 14–17 September 2021; Proceedings, Part IV. Springer: Berlin/Heidelberg, Germany, 2021; pp. 556–567. [Google Scholar] [CrossRef]
  18. Motokawa, Y.; Sugawara, T. Distributed Multi-Agent Deep Reinforcement Learning for Robust Coordination against Noise. In Proceedings of the 2022 International Joint Conference on Neural Networks (IJCNN), Padua, Italy, 18–23 July 2022; pp. 1–8. [Google Scholar] [CrossRef]
  19. Hessel, M.; Modayil, J.; van Hasselt, H.; Schaul, T.; Ostrovski, G.; Dabney, W.; Horgan, D.; Piot, B.; Azar, M.; Silver, D. Rainbow: Combining Improvements in Deep Reinforcement Learning. In Proceedings of the AAAI Conference on Artificial Intelligence, New Orleans, LA, USA, 2–3 February 2018; Volume 32. [Google Scholar]
  20. Lillicrap, T.P.; Hunt, J.J.; Pritzel, A.; Heess, N.M.O.; Erez, T.; Tassa, Y.; Silver, D.; Wierstra, D. Continuous control with deep reinforcement learning. arXiv 2016, arXiv:1509.02971, arXiv:1509.02971. [Google Scholar]
  21. Dabney, W.; Ostrovski, G.; Silver, D.; Munos, R. Implicit Quantile Networks for Distributional Reinforcement Learning. In Proceedings of the 35th International Conference on Machine Learning, Stockholm, Sweden, 10–15 July 2018; Proceedings of Machine Learning Research. Dy, J., Krause, A., Eds.; PMLR: Norfolk, MA, USA; Volume 80, pp. 1096–1105. [Google Scholar]
  22. Wang, W.; Shen, J.; Lu, X.; Hoi, S.C.H.; Ling, H. Paying Attention to Video Object Pattern Understanding. IEEE Trans. Pattern Anal. Mach. Intell. 2021, 43, 2413–2428. [Google Scholar] [CrossRef] [PubMed]
  23. Iyer, R.R.; Li, Y.; Li, H.; Lewis, M.; Sundar, R.; Sycara, K.P. Transparency and Explanation in Deep Reinforcement Learning Neural Networks. In Proceedings of the 2018 AAAI/ACM Conference on AI, Ethics, and Society, New Orleans, LA, USA, 2–3 February 2018. [Google Scholar]
  24. Goel, V.; Weng, J.; Poupart, P. Unsupervised Video Object Segmentation for Deep Reinforcement Learning. In Proceedings of the 32nd International Conference on Neural Information Processing Systems, NIPS’18, Red Hook, NY, USA, 3–8 December 2018; Curran Associates, Inc.: Red Hook, NY, USA, 2018; pp. 5688–5699. [Google Scholar]
  25. Shi, W.; Huang, G.; Song, S.; Wang, Z.; Lin, T.; Wu, C. Self-Supervised Discovering of Interpretable Features for Reinforcement Learning. IEEE Trans. Pattern Anal. Mach. Intell. 2020, 44, 2712–2724. [Google Scholar] [CrossRef] [PubMed]
  26. Mnih, V.; Kavukcuoglu, K.; Silver, D.; Rusu, A.A.; Veness, J.; Bellemare, M.G.; Graves, A.; Riedmiller, M.; Fidjeland, A.K.; Ostrovski, G.; et al. Human-level control through deep reinforcement learning. Nature 2015, 518, 529–533. [Google Scholar] [CrossRef] [PubMed]
  27. Zeiler, M.D.; Fergus, R. Visualizing and Understanding Convolutional Networks. In Proceedings of the Computer Vision—ECCV 2014, Zurich, Switzerland, 6–12 September 2014; Fleet, D., Pajdla, T., Schiele, B., Tuytelaars, T., Eds.; Springer International Publishing: Cham, Switzerland, 2014; pp. 818–833. [Google Scholar]
  28. Ribeiro, M.T.; Singh, S.; Guestrin, C. “Why Should I Trust You?”: Explaining the Predictions of Any Classifier. In Proceedings of the 22nd ACM SIGKDD International Conference on Knowledge Discovery and Data Mining, KDD’16, San Francisco, CA, USA, 13–17 August 2016; Association for Computing Machinery: New York, NY, USA, 2016; pp. 1135–1144. [Google Scholar] [CrossRef]
  29. Fong, R.; Vedaldi, A. Interpretable Explanations of Black Boxes by Meaningful Perturbation; IEEE: New York, NY, USA, 2018; pp. 3449–3457. [Google Scholar]
  30. Jain, S.; Wallace, B.C. Attention is not Explanation. In Proceedings of the 2019 Conference of the North American Chapter of the Association for Computational Linguistics: Human Language Technologies, Volume 1 (Long and Short Papers); Association for Computational Linguistics: Minneapolis, MN, USA, 2019; pp. 3543–3556. [Google Scholar] [CrossRef]
  31. Serrano, S.; Smith, N.A. Is Attention Interpretable? In Proceedings of the 57th Annual Meeting of the Association for Computational Linguistics, Florence, Italy, 28 July–2 August 2019; Association for Computational Linguistics: Florence, Italy, 2019; pp. 2931–2951. [Google Scholar] [CrossRef] [Green Version]
  32. Wiegreffe, S.; Pinter, Y. Attention is not not Explanation. In Proceedings of the 2019 Conference on Empirical Methods in Natural Language Processing and the 9th International Joint Conference on Natural Language Processing (EMNLP-IJCNLP), Hong Kong, China, 7 November 2019; Association for Computational Linguistics: Hong Kong, China, 2019; pp. 11–20. [Google Scholar] [CrossRef] [Green Version]
  33. Annasamy, R.M.; Sycara, K. Towards Better Interpretability in Deep Q-Networks. In Proceedings of the Thirty-Third AAAI Conference on Artificial Intelligence and Thirty-First Innovative Applications of Artificial Intelligence Conference and Ninth AAAI Symposium on Educational Advances in Artificial Intelligence, AAAI’19/IAAI’19/EAAI’19, Honolulu, HI, USA, 27 January–1 February 2019; AAAI Press: Washington, DC, USA, 2019. [Google Scholar] [CrossRef] [Green Version]
  34. Tang, Y.; Nguyen, D.; Ha, D. Neuroevolution of Self-Interpretable Agents. In Proceedings of the 2020 Genetic and Evolutionary Computation Conference, GECCO’20, Cancún, Mexico, 8–12 July 2020; Association for Computing Machinery: New York, NY, USA, 2020; pp. 414–424. [Google Scholar] [CrossRef]
  35. Sorokin, I.; Seleznev, A.; Pavlov, M.; Fedorov, A.; Ignateva, A. Deep Attention Recurrent Q-Network. arXiv 2015, arXiv:1512.01693. [Google Scholar] [CrossRef]
  36. Mott, A.; Zoran, D.; Chrzanowski, M.; Wierstra, D.; Jimenez Rezende, D. Towards Interpretable Reinforcement Learning Using Attention Augmented Agents. In Advances in Neural Information Processing Systems; Wallach, H., Larochelle, H., Beygelzimer, A., d’Alché-Buc, F., Fox, E., Garnett, R., Eds.; Curran Associates, Inc.: Red Hook, NY, USA, 2019; Volume 32. [Google Scholar]
  37. Manchin, A.; Abbasnejad, E.; van den Hengel, A. Reinforcement Learning with Attention that Works: A Self-Supervised Approach. In Advances in Neural Information Processing Systems; Gedeon, T., Wong, K.W., Lee, M., Eds.; Springer International Publishing: Cham, Switzerland, 2019; pp. 223–230. [Google Scholar]
  38. Itaya, H.; Hirakawa, T.; Yamashita, T.; Fujiyoshi, H.; Sugiura, K. Visual Explanation using Attention Mechanism in Actor-Critic-based Deep Reinforcement Learning. In Proceedings of the 2021 International Joint Conference on Neural Networks (IJCNN), Shenzhen, China, 18–22 July 2021; pp. 1–10. [Google Scholar]
  39. Yang, Z.; Bai, S.; Zhang, L.; Torr, P.H.S. Learn to Interpret Atari Agents. arXiv 2018, arXiv:1812.11276. [Google Scholar] [CrossRef]
  40. Mousavi, S.; Schukat, M.; Howley, E.; Borji, A.; Mozayani, N. Learning to predict where to look in interactive environments using deep recurrent q-learning. arXiv 2016, arXiv:1612.05753. [Google Scholar] [CrossRef]
  41. Zhao, M.; Li, Q.; Srinivas, A.; Gilaberte, I.C.; Lee, K.; Abbeel, P. R-LAtte: Visual Control via Deep Reinforcement Learning with Attention Network. In Proceedings of the Advances in Neural Information Processing Systems, Online, 6–12 December 2020. [Google Scholar]
  42. Brown, T.; Mann, B.; Ryder, N.; Subbiah, M.; Kaplan, J.D.; Dhariwal, P.; Neelakantan, A.; Shyam, P.; Sastry, G.; Askell, A.; et al. Language Models are Few-Shot Learners. In Advances in Neural Information Processing Systems; Larochelle, H., Ranzato, M., Hadsell, R., Balcan, M.F., Lin, H., Eds.; Curran Associates, Inc.: Red Hook, NY, USA, 2020; Volume 33, pp. 1877–1901. [Google Scholar]
  43. Dasari, S.; Gupta, A.K. Transformers for One-Shot Visual Imitation. In Proceedings of the CoRL, Virtual Event, 16–18 November 2020. [Google Scholar]
  44. Abramson, J.; Ahuja, A.; Barr, I.; Brussee, A.; Carnevale, F.; Cassin, M.; Chhaparia, R.; Clark, S.; Damoc, B.; Dudzik, A.; et al. Imitating Interactive Intelligence. arXiv 2020, arXiv:2012.05672. [Google Scholar] [CrossRef]
  45. Upadhyay, U.; Shah, N.; Ravikanti, S.; Medhe, M. Transformer Based Reinforcement Learning For Games. arXiv 2019, arXiv:1912.03918. [Google Scholar] [CrossRef]
  46. Xu, Y.; Chen, L.; Fang, M.; Wang, Y.; Zhang, C. Deep Reinforcement Learning with Transformers for Text Adventure Games. In Proceedings of the 2020 IEEE Conference on Games (CoG), Osaka, Japan, 24–27 August 2020; pp. 65–72. [Google Scholar] [CrossRef]
  47. Ritter, S.; Faulkner, R.; Sartran, L.; Santoro, A.; Botvinick, M.; Raposo, D. Rapid Task-Solving in Novel Environments. In Proceedings of the International Conference on Learning Representations, Virtual Event, 3–7 May 2021. [Google Scholar]
  48. Janner, M.; Li, Q.; Levine, S. Offline Reinforcement Learning as One Big Sequence Modeling Problem. In Advances in Neural Information Processing Systems; Ranzato, M., Beygelzimer, A., Dauphin, Y., Liang, P., Vaughan, J.W., Eds.; Curran Associates, Inc.: Red Hook, NY, USA, 2021; Volume 34, pp. 1273–1286. [Google Scholar]
  49. Sak, H.; Senior, A.W.; Beaufays, F. Long short-term memory recurrent neural network architectures for large scale acoustic modeling. In Proceedings of the INTERSPEECH, Singapore, 14–18 September 2014; pp. 338–342. [Google Scholar]
  50. Chung, J.; Gulcehre, C.; Cho, K.; Bengio, Y. Empirical evaluation of gated recurrent neural networks on sequence modeling. In Proceedings of the NIPS 2014 Workshop on Deep Learning, Montreal, QC, Canada, 8–13 December 2014. [Google Scholar]
  51. Ciatto, G.; Calegari, R.; Omicini, A.; Calvaresi, D. Towards XMAS: eXplainability through Multi-Agent Systems. In Proceedings of the 1st Workshop on Artificial Intelligence and Internet of Things Co-Located with the 18th International Conference of the Italian Association for Artificial Intelligence (AI*IA 2019), Rende (CS), Italy, 22 November 2019; CEUR Workshop Proceedings. Savaglio, C., Fortino, G., Ciatto, G., Omicini, A., Eds.; CEUR-WS: London, UK, 2019; Volume 2502, pp. 40–53. [Google Scholar]
  52. Kraus, S.; Azaria, A.; Fiosina, J.; Greve, M.; Hazon, N.; Kolbe, L.M.; Lembcke, T.; Müller, J.P.; Schleibaum, S.; Vollrath, M. AI for Explaining Decisions in Multi-Agent Environments. In Proceedings of the Thirty-Fourth AAAI Conference on Artificial Intelligence, AAAI 2020, Thirty-Second Innovative Applications of Artificial Intelligence Conference, IAAI 2020, Tenth AAAI Symposium on Educational Advances in Artificial Intelligence, EAAI 2020, New York, NY, USA, 7–12 February 2020; AAAI Press: Washington, DC, USA, 2020; pp. 13534–13538. [Google Scholar]
  53. Calvaresi, D.; Mualla, Y.; Najjar, A.; Galland, S.; Schumacher, M. Explainable Multi-Agent Systems Through Blockchain Technology. In Proceedings of the Explainable, Transparent Autonomous Agents and Multi-Agent Systems: First International Workshop, EXTRAAMAS 2019, Montreal, QC, Canada, 13–14 May 2019; Revised Selected Papers. Springer: Berlin, Heidelberg, 2019; pp. 41–58. [Google Scholar] [CrossRef]
  54. Alzetta, F.; Giorgini, P.; Najjar, A.; Schumacher, M.I.; Calvaresi, D. In-Time Explainability in Multi-Agent Systems: Challenges, Opportunities, and Roadmap. Explain. Transparent Auton. Agents Multi-Agent Syst. 2020, 12175, 39–53. [Google Scholar]
  55. Choi, J.; Lee, B.J.; Zhang, B.T. Multi-focus Attention Network for Efficient Deep Reinforcement Learning. arXiv 2017, arXiv:1712.04603. [Google Scholar] [CrossRef]
  56. Jiang, J.; Lu, Z. Learning Attentional Communication for Multi-Agent Cooperation. In Proceedings of the 32nd International Conference on Neural Information Processing Systems, NIPS’18, Red Hook, NY, USA, 2–8 December 2018; Curran Associates, Inc.: Red Hook, NY, USA, 2018; pp. 7265–7275. [Google Scholar]
  57. Liu, Y.; Wang, W.; Hu, Y.; Hao, J.; Chen, X.; Gao, Y. Multi-Agent Game Abstraction via Graph Attention Neural Network. In Proceedings of the AAAI, New York, NY, USA, 7–12 February 2020. [Google Scholar]
  58. Ryu, H.; Shin, H.; Park, J. Multi-Agent Actor-Critic with Hierarchical Graph Attention Network. In Proceedings of the AAAI, New York, NY, USA, 7–12 February 2020. [Google Scholar]
  59. Niu, Y.; Paleja, R.; Gombolay, M. Multi-Agent Graph-Attention Communication and Teaming. In Proceedings of the 20th International Conference on Autonomous Agents and MultiAgent Systems, AAMAS’21, Virtual Event, 3–7 May 2021; International Foundation for Autonomous Agents and Multiagent Systems: Richland, SC, USA, 2021; pp. 964–973. [Google Scholar]
  60. Mao, H.; Zhang, Z.; Xiao, Z.; Gong, Z.; Ni, Y. Learning Multi-Agent Communication with Double Attentional Deep Reinforcement Learning. Auton. Agents Multi-Agent Syst. 2020, 34, 32. [Google Scholar] [CrossRef]
  61. Hoshen, Y. VAIN: Attentional Multi-Agent Predictive Modeling. In Proceedings of the 31st International Conference on Neural Information Processing Systems, NIPS’17, Long Beach, CA, USA, 4–9 December 2017; Curran Associates, Inc.: Red Hook, NY, USA, 2017; pp. 2698–2708. [Google Scholar]
  62. Parnika, P.; Diddigi, R.B.; Danda, S.K.R.; Bhatnagar, S. Attention Actor-Critic Algorithm for Multi-Agent Constrained Co-Operative Reinforcement Learning. In Proceedings of the 20th International Conference on Autonomous Agents and MultiAgent Systems, AAMAS’21, Virtual Event, 3–7 May 2021; International Foundation for Autonomous Agents and Multiagent Systems: Richland, SC, USA, 2021; pp. 1616–1618. [Google Scholar]
  63. Li, M.G.; Jiang, B.; Zhu, H.; Che, Z.; Liu, Y. Generative Attention Networks for Multi-Agent Behavioral Modeling. In Proceedings of the AAAI, New York, NY, USA, 7–12 February 2020. [Google Scholar]
  64. Li, J.; Yang, F.; Tomizuka, M.; Choi, C. EvolveGraph: Multi-Agent Trajectory Prediction with Dynamic Relational Reasoning. In Proceedings of the Neural Information Processing Systems (NeurIPS), Online, 6–12 December 2020. [Google Scholar]
  65. Li, L.; Yao, J.; Wenliang, L.; He, T.; Xiao, T.; Yan, J.; Wipf, D.; Zhang, Z. GRIN: Generative Relation and Intention Network for Multi-agent Trajectory Prediction. In Advances in Neural Information Processing Systems; Ranzato, M., Beygelzimer, A., Dauphin, Y., Liang, P., Vaughan, J.W., Eds.; Curran Associates, Inc.: Red Hook, NY, USA, 2021; Volume 34, pp. 27107–27118. [Google Scholar]
  66. Zambaldi, V.; Raposo, D.; Santoro, A.; Bapst, V.; Li, Y.; Babuschkin, I.; Tuyls, K.; Reichert, D.; Lillicrap, T.; Lockhart, E.; et al. Deep reinforcement learning with relational inductive biases. In Proceedings of the International Conference on Learning Representations, New Orleans, LA, USA, 6–9 May 2019. [Google Scholar]
  67. Lee, D.; Jaques, N.; Kew, C.; Wu, J.; Eck, D.; Schuurmans, D.; Faust, A. Joint Attention for Multi-Agent Coordination and Social Learning. arXiv 2021, arXiv:2104.07750. [Google Scholar] [CrossRef]
  68. Xueguang Lyu, Y.X. Contrasting Centralized and Decentralized Critics in Multi-Agent Reinforcement Learning. In Proceedings of the International Joint Conference on Autonomous Agents and Multiagent Systems, Honolulu, HI, USA, 14–18 May 2007. [Google Scholar]
  69. Lyu, X.; Xiao, Y.; Daley, B.; Amato, C. Contrasting Centralized and Decentralized Critics in Multi-Agent Reinforcement Learning. arXiv 2021, arXiv:2102.04402, arXiv:2102.04402. [Google Scholar]
  70. Puterman, M.L. Markov Decision Processes: Discrete Stochastic Dynamic Programming, 1st ed.; John Wiley & Sons, Inc.: Hoboken, NJ, USA, 1994. [Google Scholar]
  71. Miyashita, Y.; Sugawara, T. Analysis of coordinated behavior structures with multi-agent deep reinforcement learning. Appl. Intell. 2021, 51, 1069–1085. [Google Scholar] [CrossRef]
  72. Mnih, V.; Kavukcuoglu, K.; Silver, D.; Graves, A.; Antonoglou, I.; Wierstra, D.; Riedmiller, M. Playing Atari With Deep Reinforcement Learning. In NIPS Deep Learning Workshop; NeurIPS: New Orleans, LA, USA, 2013. [Google Scholar]
  73. Hasselt, H.v.; Guez, A.; Silver, D. Deep Reinforcement Learning with Double Q-Learning. In Proceedings of the Thirtieth AAAI Conference on Artificial Intelligence, AAAI’16, Phoenix, AZ, USA, 12–17 February 2016; AAAI Press: Washington, DC, USA, 2016; pp. 2094–2100. [Google Scholar]
  74. Wang, Z.; Schaul, T.; Hessel, M.; Van Hasselt, H.; Lanctot, M.; De Freitas, N. Dueling Network Architectures for Deep Reinforcement Learning. In Proceedings of the 33rd International Conference on International Conference on Machine Learning—Volume 48, ICML’16, New York, NY, USA, 19–24 June 2016; JMLR: Norfolk, MA, USA, 2016; pp. 1995–2003. [Google Scholar]
Figure 1. Environment and observation matrices with respect to view method. (a) Environment used in our study. Black cells represent walls, numbered blue and red cells represent the initial position of agents, and ★ marks represent objects. Green, red, and beige cells represent regions where ★ spawn, and white cells represent empty space. (b) Encoding local view observation of agent 0 in N C × R X × R Y . The visible range of agent 0 is represented as blue square line. (c) Encoding relative view observation of agent 2 in N C × G X × G Y . The visible range of agent 2 is represented as red square line.
Applsci 13 08454 g001
Figure 2. eDA3-X architecture, based on the DA3-X architecture [18].
Applsci 13 08454 g002
Figure 3. Learning performance comparison between local and relative view methods. (a) Episode reward by DQN-based algorithms. (b) Episode reward by IQN-based algorithms.
Applsci 13 08454 g003
Figure 4. Attention analysis with local view. Blue cell labeled A at center is observing agent. Blue arrow represents the direction of next movement. ★ marks represent objects. Blue and red cells labeled A’ and R represent intelligent coworker and roaming agent, respectively.
Applsci 13 08454 g004
Figure 5. Positional attention analysis with local view. Each row shows positional attention heatmap in 7 × 7 (top), heatmap of agent i’s trajectory (middle), and heatmap of collected objects by agent i (bottom).
Applsci 13 08454 g005
Figure 6. Positional attention analysis with relative view. Each row shows positional attention heatmap in 5 × 5 (top), heatmap of agent i’s trajectory (middle), and heatmap of collected objects by agent i (bottom).
Applsci 13 08454 g006
Figure 7. Positional attention and observation statistics with local view of agent 1.
Applsci 13 08454 g007
Figure 8. Positional attention and observation statistics with relative view of agent 0.
Applsci 13 08454 g008
Table 1. Quantitative performance comparison.
ObservationModelEpisode RewardObjects CollectedAgents CollisionWalls Collision
localdqn 62.95 ± 26.42 68.41 ± 26.56 2.63 ± 2.36 2.83 ± 2.81
iqn 64.95 ± 33.87 70.04 ± 33.27 2.27 ± 1.99 2.82 ± 3.36
eda3-dqn 82.36 ± 33.86 86.58 ± 34.22 2.03 ± 1.09 2.19 ± 2.25
eda3-iqn 93.17 ± 38.17 99.23 ± 37.83 3.04 ± 5.09 3.02 ± 5.64
relativedqn 200.49 ± 48.18 210.36 ± 28.15 3.60 ± 3.74 6.27 ± 23.47
iqn 234.19 ± 16.14 239.99 ± 14.62 3.13 ± 3.11 2.67 ± 4.76
eda3-dqn 243.73 ± 18.84 249.11 ± 15.10 3.16 ± 5.08 2.22 ± 4.39
eda3-iqn 250.26 ± 13.17 255.67 ± 12.09 3.19 ± 3.76 2.22 ± 2.81
Disclaimer/Publisher’s Note: The statements, opinions and data contained in all publications are solely those of the individual author(s) and contributor(s) and not of MDPI and/or the editor(s). MDPI and/or the editor(s) disclaim responsibility for any injury to people or property resulting from any ideas, methods, instructions or products referred to in the content.