Article

Experimental Investigation of Mechanical Properties of Clay–Cement Slurry Containing Graphene Oxide

1
China Coal Research Institute, Beijing 100013, China
2
National Engineering Research Center of Deep Shaft Construction, Beijing 100013, China
3
Beijing China Coal Mine Engineering Company Ltd., Beijing 100013, China
4
School of Civil and Resource Engineering, University of Science and Technology Beijing, Beijing 100085, China
*
Author to whom correspondence should be addressed.
Appl. Sci. 2023, 13(14), 8452; https://doi.org/10.3390/app13148452
Submission received: 8 June 2023 / Revised: 15 July 2023 / Accepted: 19 July 2023 / Published: 21 July 2023

Abstract

:
As a widely used material in underground engineering, clay–cement slurry grouting is known for its initial poor anti-seepage and filtration capacity, the low strength of the resulting stone body, and its tendency towards brittle failure. To explore efficient and environmentally friendly grouting materials, industrial-grade graphene oxide (GO) was incorporated into a clay–cement slurry to create a new type of slurry called a GO composite. These GO composites were then utilized to reinforce fractured formations. Uniaxial compression tests, shear strength tests, permeability tests, and electron microscopy scans were conducted to investigate the strength, permeability, and microscopic features of the GO composite-reinforced fractured formations. Furthermore, the optimization effect and application prospects of graphene oxide on clay–cement slurry materials were evaluated. The experimental results demonstrated that the modified slurry effectively improved the compressive strength (increased by 7.2% to 32.5%) and shear strength (increased by 28.6% to 105.3%) of consolidated fractured gravel. By conducting orthogonal experiments with range analysis, variance analysis, and multiple regression analysis, it was shown that there was a strong correlation between the consolidated body and three factors influencing the permeability coefficient. Among these factors, the OPC content had the most significant impact on the permeability coefficient, followed by the GO content. Graphene oxide was found to promote cement hydration reactions, guide the growth of hydration products on the surface of graphene oxide nanosheets, optimize the pore structure in grouting materials, and reduce microcracks between the slurry and the fractured gravel interface. Electron microscopy characterization and fractal analysis revealed that the addition of graphene oxide effectively reduced the degree of microdamage during the sample’s failure process. This ensured the integrity of the sample during the unstable failure process, enhanced the material’s toughness, and improved its ability to resist loads.

1. Introduction

Gravel formations, widely distributed in China, are loose structured Quaternary sediments composed of sand, gravel, and pebbles in varying gradations. Natural gravel includes cobblestones, sand grains, silt, and clay, exhibiting uneven lithology, loose structure, strong permeability, and significant variation in particle size. These formations are characterized by high permeability, weak bonding, and easy instability. Inadequate treatment of such formations can lead to engineering issues like soil structure instability and water influx. In severe cases, it may result in structural collapse, posing threats to economic, property, and human safety [1,2]. Enhancing the mechanical properties of gravel formations is crucial for ensuring the stability of underground structures.
In modern civil and hydraulic engineering, grouting finds extensive applications in various areas such as strengthening building foundations, subgrade treatment, curtain seepage prevention for dam foundations, landfill sites, underground water sealing, and grouting, among others. By employing compaction, filling, and splitting actions, the grouting material can effectively diffuse within the predetermined reinforcement area. Upon solidification, the grout forms friction and interlocks with the gravel interface, thereby enhancing the strength of the gravel stratum [3,4,5]. In practical engineering, it is often challenging to alter the characteristics of the stratum. Therefore, the current focus lies in improving the mechanical properties of fractured rock masses post-grouting through the optimization of grouting materials. Grouting materials have undergone significant development since the introduction of pure clay slurry in the 19th century. Presently, grouting materials primarily include cement, cement–water glass, clay–cement, chemical grouting materials, and resins [6,7,8]. Among these, clay–cement grouting materials possess favorable attributes, including low cost, good stability, and strong anti-seepage performance [9,10]. However, the limitations of low strength and slow solidification speed have restricted the application range of clay–cement grouting materials.
In recent years, the advancement of nanomaterial technology has significantly contributed to its continuous improvement. Nanomaterials possess high specific surface area, surface charge, and small pores, enabling them to fill voids and provide nucleation sites for hydration products. Even in small quantities, these materials have a substantial impact on the physical and chemical properties of soil [11,12]. Several factors have an impact on the mechanical properties of grouting reinforcement, leading domestic and international scholars to conduct numerous experimental studies. These studies aim to analyze the influence of various factors on the performance of reinforced materials and provide improved construction guidance. Wang Kai [13] conducted simulated grouting tests on fully weathered granite and discovered that the strength and thickness of the grouted body were positively correlated with the grouting pressure, while the permeability coefficient exhibited a negative correlation with the grouting pressure. Qian Ziwei [14] investigated the impact of factors such as grouting volume and static water pressure on the permeability coefficient and compressive strength of the medium through laboratory experiments. Based on sand layer grouting model tests, Li Zhipeng [15] studied the influence of factors such as particle size distribution, clay content, water–cement ratio, and grouting pressure on the compressive strength, deformation modulus, and permeability coefficient of reinforced bodies. They determined that the water–cement ratio is the main control factor affecting the effectiveness of grouting reinforcement. Feng Han [16] focused on the factors influencing the application of geopolymer materials in grouting fractured rock masses. Their research revealed that the modified water glass activator and slag replacement rate are key factors affecting the grouting effect. The concentration of the former is closely related to the strength of the reinforced body, while the latter affects the setting time of the grout.
Oxide graphene, derived from oxidizing graphite with potent oxidants [17,18], exhibits a substantial specific surface area and contains numerous oxygen-containing functional groups (-OH, -COOH, -O-) at the edges and surfaces of its layers. These functional groups provide a platform for the growth of hydration products, facilitating the formation of C-S-H gel and enhancing the rigidity of cement composite materials, thereby improving their overall performance. Additionally, these oxygen-containing functional groups display good hydrophilicity, enabling oxide graphene to dissolve in water and further enhance material properties [19,20,21]. Li et al. [22] proposed a method of reinforcing loess by incorporating graphene oxide (GO) into cement. They determined that the optimal mechanical and water resistance values were achieved when the GO content reached 0.09 wt.%. Zhang [23] added GO to cement-expansive soil to improve its triaxial characteristics, mitigating the low flexural strength and weak deformation resistance of cement-solidified expansive soil. The optimal performance was observed with a GO content of 0.1 wt.%. Moreover, Valizadeh and Zhou [24,25] discovered that even a small amount of GO significantly enhances the physical and mechanical properties as well as microscopic structures of clay sand. Tong et al. [26] investigated the impact of oxide graphene on the corrosion resistance of concrete and found that it promotes the formation of C-S-H gel, resulting in a denser microscopic structure of the material. Jing Jianguo [27] separately added graphene in concentrations of 0.01%, 0.03%, and 0.05% to ground cement materials, testing the compressive strength of the cement-based composite material at 3 days and 28 days. They found that the addition of graphene improved the compressive strength, with 0.03% graphene showing the most significant improvement in the strength of cement-based materials. Wenhui Duan [28] examined the compressive and flexural strengths of oxide graphene composite cement compared with ordinary cement paste, revealing significant improvements in both. The compressive strength was increased by approximately 15% to 33% compared with ordinary cement, while the tensile strength improved by 41% to 59%.
Although there has been research on the reinforcement of cement with graphene oxide (GO), limited reports exist on the application of GO-modified cement–clay grouting materials. This study focuses on investigating the reinforcing effect of GO composites, developed by the Mine Construction Research Institute of China Coal Technology and Engineering Group, on gravel layers with different particle sizes. Grouting specimens were created using a specialized experimental apparatus for conducting grouting tests. The study examines the impact of graphene oxide content on the compressive strength, shear strength, and plasticity strength of modified clay–cement slurry grout. Additionally, permeability tests were conducted on the grouted specimens to analyze the influence of various factors on the permeability coefficient. Finally, scanning electron microscopy (SEM) was utilized to investigate the micro-reinforcement characteristics of the grout–solid interface. The objective of this research is to develop grouting materials that exhibit high-strength, high-anti-seepage, and high-durability properties, while providing scientific guidance regarding the reinforcement effect of such materials.

2. Materials and Methods

2.1. Test Device

The shallow-buried gravel layer grouting test device consists of two main modules: the formation simulation module and the slurry supply module. The formation simulation module utilizes two semicircular steel pipes with a diameter of Φ200 × 800 mm, featuring flanges at both ends. These steel pipes are assembled with precision steel threads, allowing for easy sampling and repeated use. Rubber pads are used to create a seal, and 8 mm holes are reserved on the flanges as injection and water outlet points. On the other hand, the slurry supply module comprises a pressure tank, a power device, a grouting tube, a pressure gauge, and a high-pressure pipeline. In this setup, the slurry stored in the pressure vessel is injected into a simulated formation within the test barrel through the injection pipeline. The injection process is facilitated by the air compressor, which provides the necessary pressure. The outlet pipeline control valve can be adjusted to maintain a constant inlet water pressure. By using a pressure gauge, the outlet pressure can be measured and recorded, along with the outflow time. Considering parameters such as sample size and applied hydraulic head pressure, it becomes possible to calculate the permeability coefficient of the specimen. The diagram of the test device is shown in Figure 1.

2.2. Materials

2.2.1. Clay–Cement Slurry

In this experiment, a laboratory-made graphene oxide-modified clay–cement slurry was utilized. Ordinary Portland cement (OPC) with a strength grade not lower than 42.5 and a fineness that meets the requirements of GB/T 1345 [29] was chosen for this purpose. The chemical compositions of the test cement are presented in Table 1. The fourth-order clay obtained from Henan Province, China, was mixed with water and allowed to soak for 2 to 3 days to ensure complete infiltration. Subsequently, the clay slurry was prepared by mixing it with a high-speed mixer and then sieving out the sand particles using a 0.05 mm mesh. The particle size distribution of the clay slurry was as follows: 6.9% for the 0.5–0.25 mm particle size, 17.8% for the 0.25–0.075 mm particle size, 34.3% for the 0.075–0.005 mm particle size, and 41.0% for the 0.005 mm particle size. The analysis of clay performance is provided in Table 1.
The GO suspension used in this study, with a concentration of 2 mg/mL, is an industrial-grade single-layer graphene oxide dispersion produced by Suzhou Carbon Century Graphene Technology Co., Ltd. in Suzhou, China. This dispersion was prepared using an improved Hummer’s method. The diameter distribution analysis revealed that particles ranging from 3 to 8 nm accounted for 95% of the suspension, while those with a thickness less than 3 nm constituted 90%. The purity of the GO suspension reached 99%.
The specific gravity of the clay slurry was measured to be 1.15 g/cm3. The total volume of mixing cement used in the experiment was 5%, 10%, and 15% of the clay slurry volume. Additionally, sodium silicate was added at a rate of 10 mL per liter. The GO suspension was prepared by incorporating graphene oxide into the solution at specific concentrations based on the solid mass. In particular, concentrations of 0 wt.%, 0.03 wt.%, and 0.05 wt.% of the solid mass of ordinary Portland cement (OPC) were used. To prepare the clay–graphene mixture, the clay slurry was combined with the GO solution and stirred for 5 min. Before that, the cement and mineral admixture were accurately weighed and thoroughly blended. The resulting mixture was then added to the clay–graphene suspension and stirred for an additional 5 min to ensure a uniform slurry. The ratio of clay–cement slurry is shown in Table 2.

2.2.2. Stratum Selection

To simulate the reinforcement effect of grouting with slurry under different formation conditions, limestone specimens varying in particle sizes from 0.01 mm to 10 mm were employed in the experiment. These specimens were divided into four size ranges: (<1 mm), (1–2 mm), (2–5 mm), and (5–10 mm). The proportion of each size range was adjusted repeatedly according to the experimental procedure, resulting in three groups of simulated bottom layers. The gradation chart depicting these size ranges is presented in Figure 2. In order to assess the permeability characteristics of the specimens across different particle size ranges, permeability coefficient experiments were conducted. This allowed for the determination of the specimens’ permeability coefficients under varying particle size conditions. The results of the permeability coefficient tests are summarized in Table 3. Through this analysis, the effectiveness of grouting on different sizes of limestone particles within the simulated bottom layer could be examined.

2.3. Methods

2.3.1. Sample Preparation

To start the process, the gravel is sieved to achieve uniformity, ensuring consistent particle size distribution. The total mass of gravel required for filling is then determined based on the desired porosity. The sand and gravel particles of each size category are then carefully weighed according to the specified proportions and thoroughly mixed. The test barrel system is assembled, and the vertical test barrel is installed after securely placing one side flange and the grouting nozzle in position. The gravel is filled into the barrel using a layer-by-layer compaction method to ensure proper packing. After filling, the flange cover is installed, and the drainage conditions for different layers are established by adjusting the mesh number of the filter cloth on the bottom flange. The test barrel is then positioned horizontally, and the pressure tank and gas tank are connected. Tap water is used to check for any obstructions in the pipeline and to saturate the gravel layer. Next, based on the prescribed ratio and corresponding density of the clay–cement slurry, the pressure tank is injected with the mixture. The pressure inside the barrel is carefully adjusted to the predetermined grouting pressure using a pressure regulating valve, and the total weight of the pressure tank is recorded. Grouting is then carried out in accordance with the set time parameters, and the total weight of the pressure tank is recorded again after completion. Subsequently, the pipeline is thoroughly flushed with water. To prevent excessive evaporation, a thin film is lightly placed over the setup, and the entire test system is cured in a dedicated curing box for a duration of 7 days. Finally, samples of the grouting reinforcement body, sized at 50 mm × 100 mm, are carefully extracted. The test methods and processes are visually represented in Figure 3.

2.3.2. Testing Procedures

Referring to the “Cement Grout Strength Testing Standard—Cement Grout Strength Testing Method (ISO Method)” (GB/T 17671-1999) [31], the grouting reinforcement bodies with various proportions are subjected to compressive strength and shear strength tests at 28 days of age. These specimens are uniformly cured in a standard curing box according to established procedures. Furthermore, the water consumption, setting time, and stability of the cement’s standard consistency are determined using the cement standard consistency test method (GB/T 1346-2011) [32]. The plastic strength of the material is also assessed using a Vicat apparatus. To evaluate the permeability coefficient of the grouting reinforcement body, a specialized shallow-buried gravel layer grouting test device is utilized. The key distinction is that the pressure tank in the grouting test device is filled either with clay–cement slurry or water. In addition, the microstructure of the interfacial surface of the grouting reinforcement body is analyzed using a TESCAN VEGA scanning electron microscope.

3. Results

3.1. Performance Analysis of Grouting Reinforcement

3.1.1. Uniaxial Compressive Strength

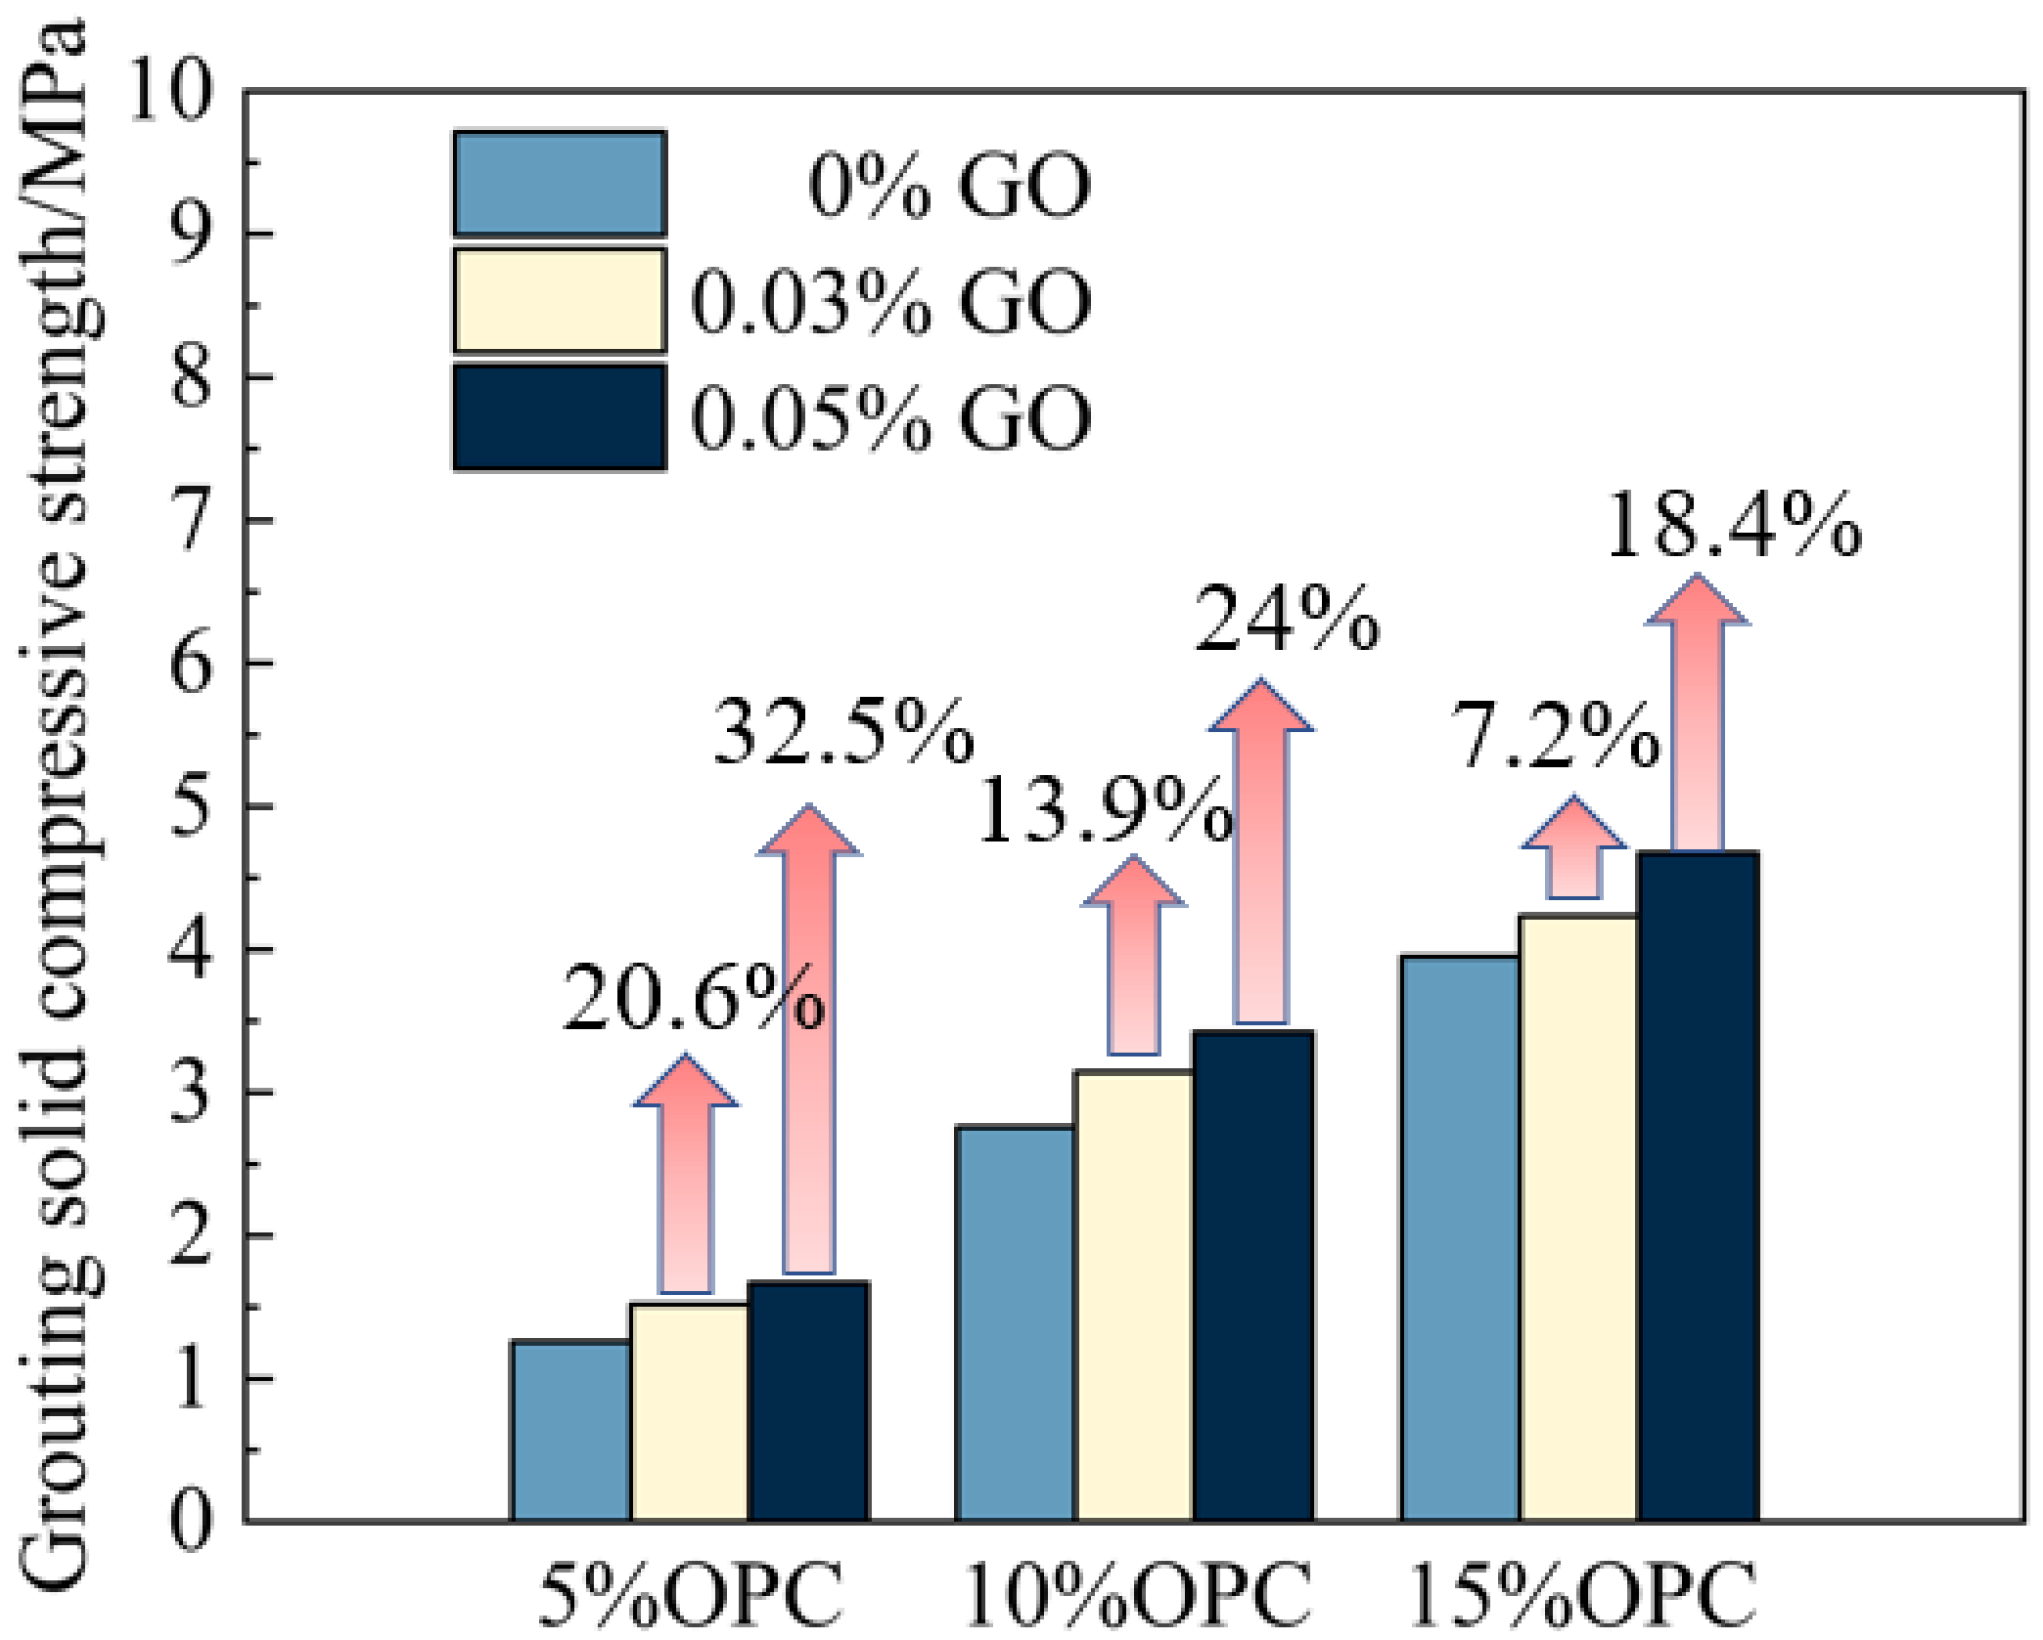
The uniaxial compressive strength plays a crucial role in evaluating the effectiveness of grouting reinforcement. In this study, specimens with various proportions were subjected to uniaxial compression tests and compared with specimens that did not have graphene oxide (GO) added. The objective was to analyze the impact of GO and ordinary Portland cement (OPC) addition on the strengthening effect. The results of the uniaxial compressive strength test are presented in Figure 4.
As the GO addition increased, the uniaxial compressive strength exhibited an upward trend. The maximum uniaxial compressive strength of the specimen, relative to the nongrouted medium, increased by 32.5%, indicating a significant reinforcement effect. The critical point for the change rate of compressive strength with respect to the GO addition rate was found to be approximately 0.03% (three parts per ten thousand of cement content). When the slurry viscosity exceeded this value, the growth rate of compressive strength slowed down. Conversely, when the viscosity was below this threshold, the growth rate of compressive strength increased. For instance, considering an OPC addition of 5%, when the GO addition rate remained within 0.03%, the improvement in compressive strength of the grouted medium was more substantial, reaching 20.6%. However, when the GO addition rate surpassed 0.03%, the enhancement in compressive strength diminished to an increment of 11.9%. The slurry exhibits a permeation effect on internal voids and cracks within the pressured gravel. Gao Yuan et al. [33] conducted studies on reinforcing fractured rocks through grouting using fly ash combined with 0.08 wt.% of graphene oxide and cement-based grouting material without graphene oxide. It was observed that the addition of graphene oxide increased the compressive strength by 12.59% to 22.49%, and the elastic modulus by 2.37% to 4.81%. This indicates a lower porosity of the specimen, enabling it to better withstand external loads during compaction. Furthermore, numerical simulation revealed that the presence of graphene oxide enhanced material toughness and altered its brittleness, aligning with previous research [34].
With an increase in GO content, the volume of clay–cement particle aggregates also increases. As the slurry infiltrates microcracks or small voids, a spatial framework of clay–cement aggregates forms, with GO layers as the core. Clay particles fill this framework, creating a slurry system architecture that enhances the system’s density and compactness within the fractured system. Simultaneously, the addition of GO intensifies the pressure filtration effect of the slurry. The solvent water, acting as mobile material particles within the slurry, precipitates more rapidly, thereby improving the rate of stone formation and slurry density [35]. Consequently, this leads to an overall increase in the strength of the grouting reinforcement body at a macro level.

3.1.2. Shear Strength

The shear strength of the grouted medium is a crucial parameter for evaluating the effectiveness of grouting reinforcement and analyzing the stability of the reinforced strata. This study conducted direct shear tests on specimens with different proportions to determine their shear strength under various ratios. The relationship between GO and OPC addition and the shear strength of the grouting reinforcement body was plotted and is depicted in Figure 5. Based on the shear strength data, an analysis was conducted to investigate the variations in shear strength of the grouted medium and the influence of adding graphene oxide (GO). The findings from Figure 6 indicate that the addition of GO has a substantial impact on the shear strength of the grouted medium. Generally, the shear strength of the specimen increases with an increase in GO addition. For example, considering an OPC addition of 5%, when the GO addition rate remains within 0.03%, there is a more substantial improvement in the shear strength of the grouted medium, reaching 59%. However, when the GO addition rate surpasses 0.03%, the increment in shear strength diminishes to 44.3%. This suggests that the GO addition rate exhibits a turning point in the growth rate of shear strength near 0.03%, which is consistent with the impact of slurry viscosity on compressive strength.
In traditional clay–cement slurries, cement hydration generates cement particles with a positive charge. During the process, the cement particles experience a partial charge exchange with clay particles, resulting in the adsorption of clay particles onto the surface of cement particles. This phenomenon leads to agglomeration and the formation of a cohesive gel-like structure under alkaline conditions, which exhibits a certain level of strength. Studies have shown that incorporating graphene oxide into clay–cement slurries has a nucleation effect, promoting cement hydration reactions, and generating more calcium silicate hydrate (C-S-H) within the capillary pores. This facilitates the transfer of additional cement hydration products within the micropores and capillaries. Qi Meng [36] compared X-ray diffraction (XRD) spectra of different amounts of graphene oxide (GO) and observed similar peak shapes without distinct absorption peaks. This implies that the addition of GO does not alter the types of cement hydration products. However, as the amount of graphene oxide (GO) increased, the intensity of the absorption peaks gradually increased. This observation indicates that GO promotes the formation of cement hydration products and enhances the strength of the specimens.
During the grouting process, an increase in the addition of graphene oxide (GO) results in a larger volume of clay–cement particle aggregates. This leads to an increase in the thickness of the slurry vein and enhances its compaction effect on the surrounding soil mass. As a result, the compactness of the soil mass improves, which enhances the friction, embedding, and interlocking effects between the soil particles. Ultimately, this improvement in the interparticle interactions leads to an enhancement in the shear strength of the grouted medium. Additionally, GO can transfer more cement hydration products into microcapillary pores and act as a crack bridge within the material’s microcracks, thereby improving its shear resistance [37].

3.1.3. Plastic Strength of Slurry

The strength of the slurry is measured using a Vicker cone penetrometer, in which the clay slurry is placed in a 65 × 75 × 40 mm sized conical mold. The mold is kept in the SBY-32B constant temperature cement curing box produced by Yixuan Test Instrument Co., Ltd. in Cangzhou, China, and the plastic strength of different slurry ratios is measured at regular intervals. The specific formula is as follows:
P = cos 2 α 2 G / π sin α 2 h 2
where G is the weight of the entire cone, α is the cone angle, and h is the distance that the cone penetrates the slurry.
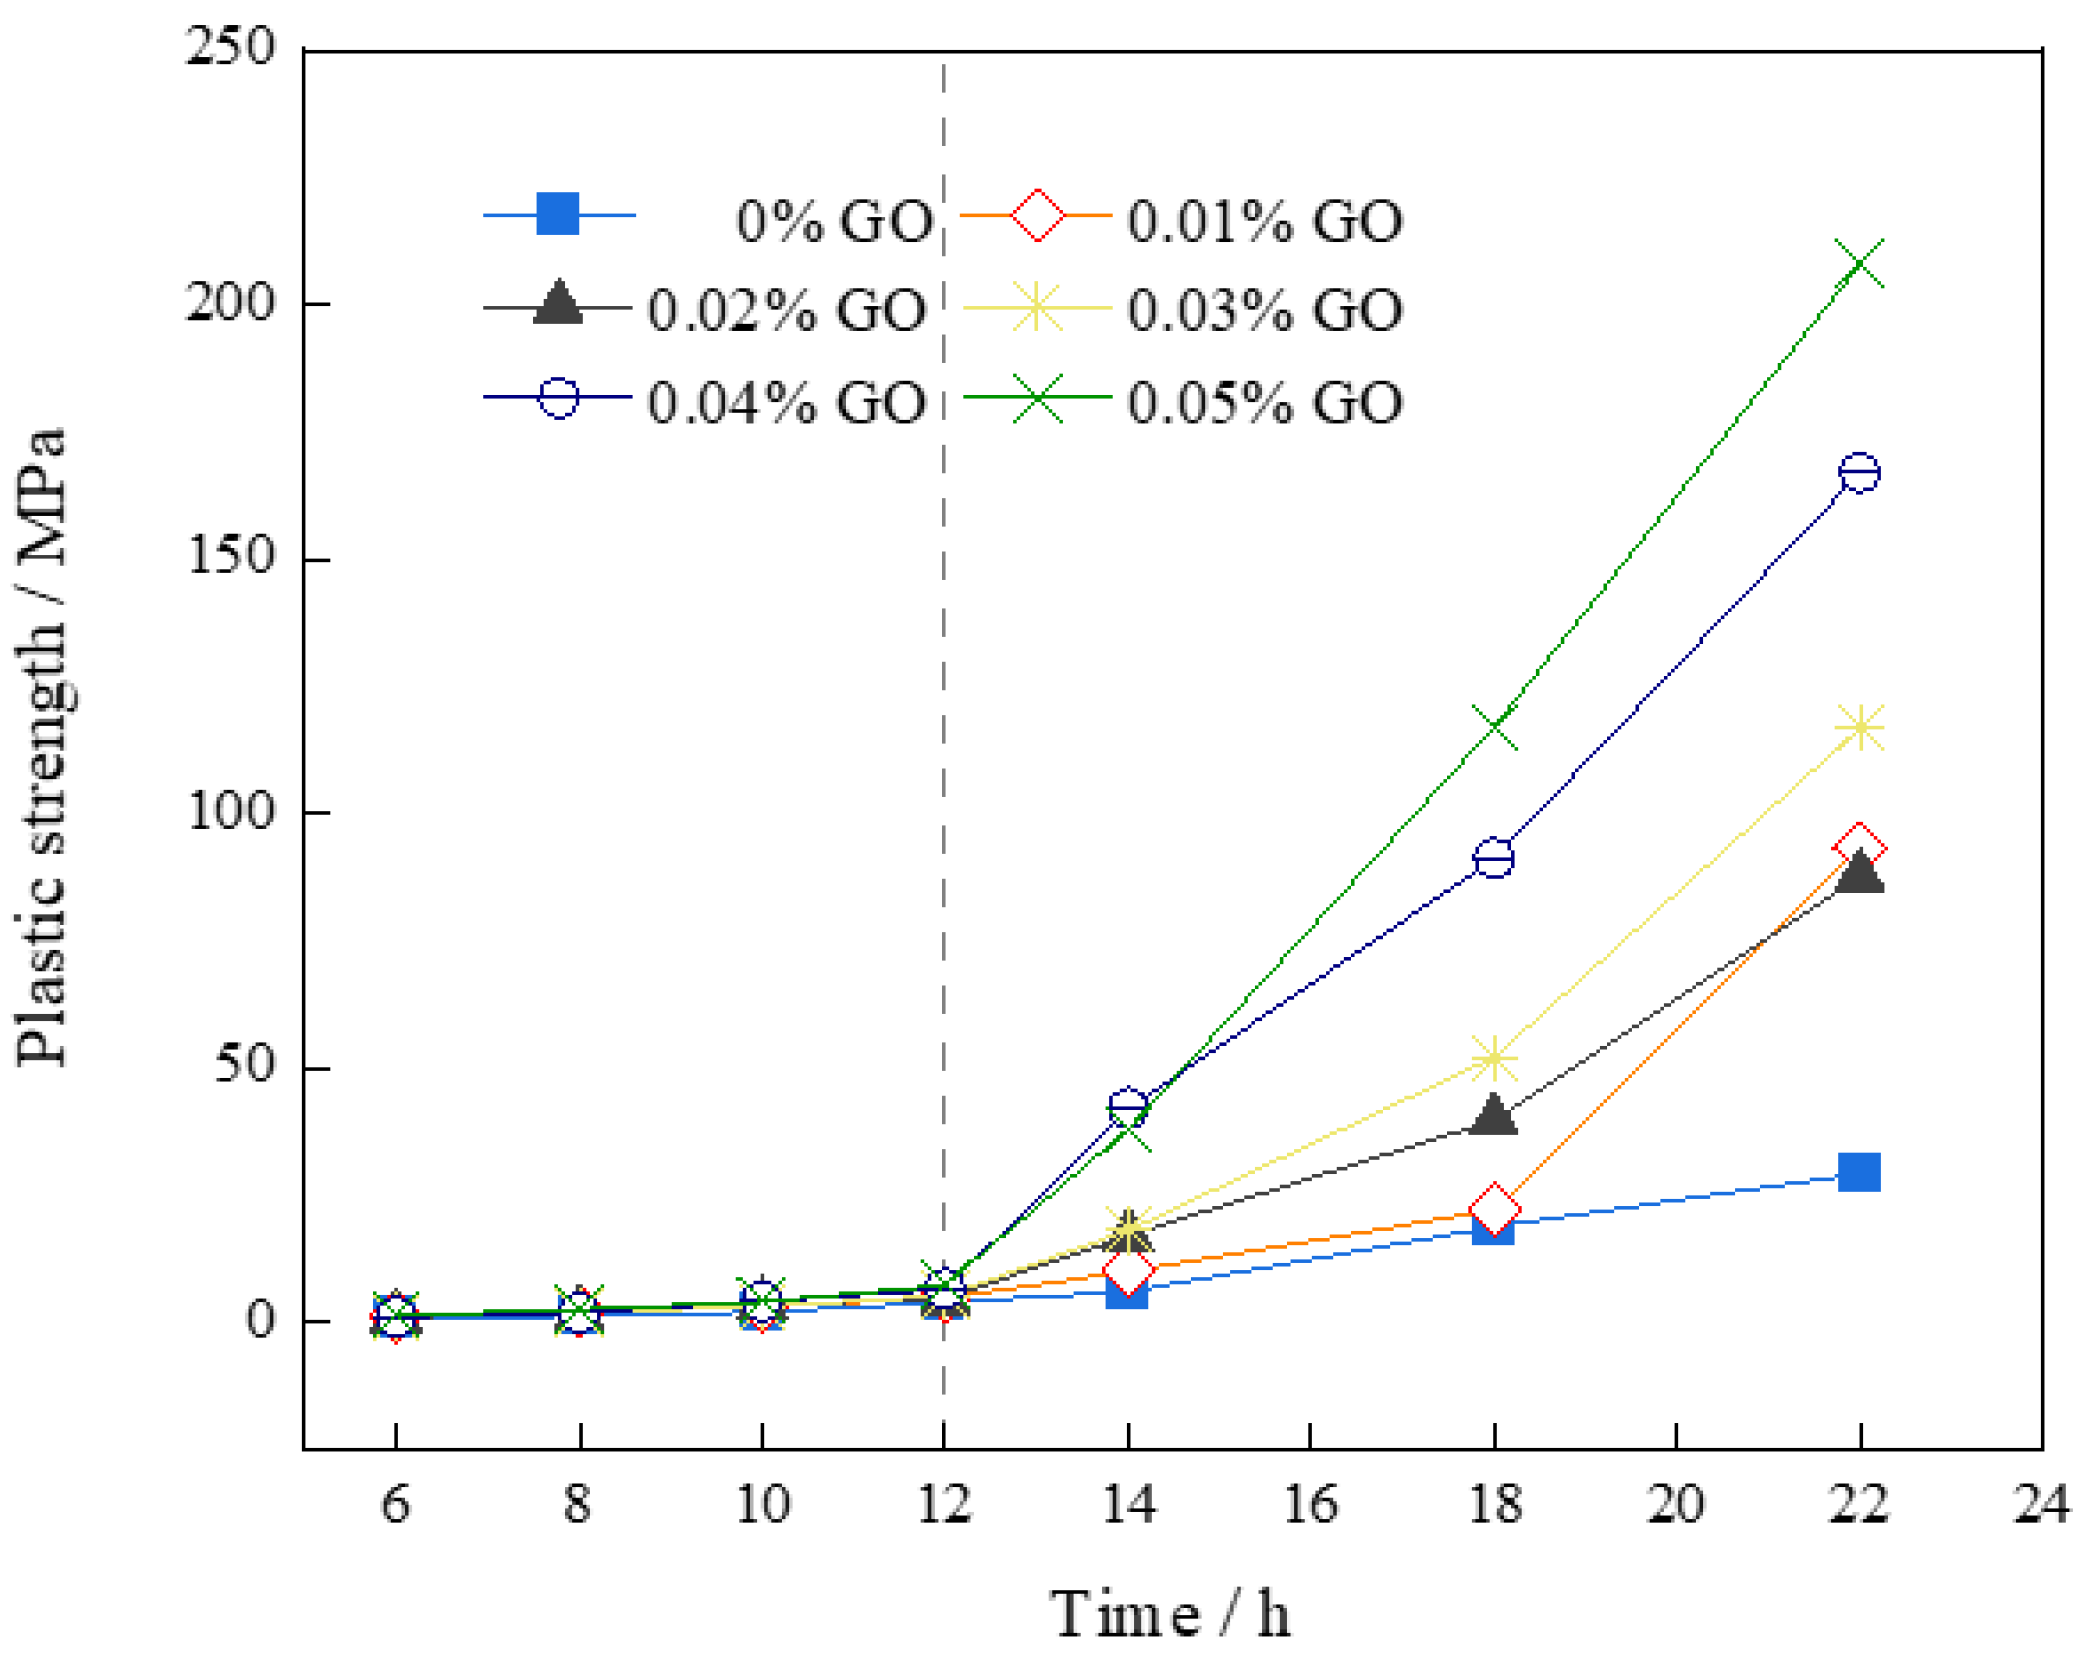
The plasticity feature is the late effect of the rheological characteristics of the slurry, and it plays a crucial role in resisting infiltration and water plugging. The results of the slurry’s plastic strength are shown in Figure 6. The following can be observed: (1) The plastic strength of the slurry with different mix ratios exhibited the same trend. Before 12 h, the plastic strength remained at a relatively low level, gradually increasing moderately, and then explosively increasing exponentially after 14 h. (2) In comparison with the control group, there was a notable increase in the plastic strength of the slurry as the graphene oxide (GO) content increased. This indicates that GO plays an essential role in enhancing the early-stage water plugging performance of the slurry. This observation aligns with the principles of viscosity thixotropy mentioned earlier, demonstrating that GO exhibits optimal effects in this regard.
The plasticity characteristics are the late effects of rheological characteristics of the slurry, which play a significant role in anti-seepage and water plugging. The clay–cement slurry needs to continuously overcome the resistance caused by soil mass and the slurry itself during the grouting reinforcement process. The time-varying nature of plastic strength reflects the change in the resistance caused by the slurry itself over time. Simultaneously, as the grouting progresses from the grouting hole to the front-end area of the slurry, the grouting pressure gradually decreases. This attenuation weakens the splitting and compaction effect on the soil mass that is located far away from the grouting pipe. Consequently, this reduction in pressure leads to a decrease in both compressive and shear strength. Additionally, it was found in the experiments that water and bubbles were discharged during and after the grouting process, indicating that a seepage channel had been formed within the medium from the front end of the slurry to the drainage hole. It played a certain pressure-relieving role near the drainage hole, reduced the extrusion effect of the slurry on the medium, and weakened the grouting reinforcement effect [38].

3.2. Anti-Permeability Performance of Grouting Reinforcement

Under the action of an air compressor, a certain amount of high-pressure gas is injected into the water tank. The pressure of the inflow pipe is kept constant by adjusting the valve of the outflow pipeline. The pressure at the outflow end can be obtained through a pressure gauge, and the outflow time and pressure can be recorded. Combined with parameters such as the size of the test piece and the water head pressure applied, the permeability coefficient of the specimen can be calculated. According to Darcy’s law, the seepage flow is calculated using the following formula:
Q = K A J t = K A σ 1 σ 2 ρ g L t
where t = t 2 t 1 , σ = σ 1 σ 2 ; the permeability coefficient can be expressed as
K = Q L ρ g A σ t
where Q represents the permeation flow rate; K is the permeability coefficient of the specimen; A is the cross-sectional area of the specimen; J is the hydraulic gradient; σ 1 is the pressure at the inlet of the grouting pipe at t 1 ; σ 2 is the pressure at the inlet of the grouting pipe at t 2 ; L is the length of the specimen; ρ is the density of water; and g is the acceleration due to gravity.
In this experiment, three levels were investigated for each factor under consideration. An orthogonal experimental design table with three factors and three levels was utilized. Additionally, three parallel samples were prepared for each mixture ratio. The specimen ratio of gravel grouting test is shown in Table 4.
Table 5 presents the results of the permeability coefficient and compressive strength tests of the slurry–stone body after 28 days under different slurry ratios, grouting pressures, and formation drainage velocities. Analysis of the test results in Table 3 shows that the compressive strength of the stone body is above 1.5 MPa at 28 days. The permeability coefficient of the stone body is significantly affected by the grouting parameters and formation drainage velocity. There are differences in the permeability coefficients of the slurry–stone bodies under different parameters, and each group’s permeability coefficient is around 1 × 10 6 c m / s 1 . This indicates that the clay-solidified slurry can fully meet the requirements of water-rich karst formations for reinforcement and impermeabilization by filling and grouting.

3.2.1. Range Analysis of Permeability Coefficient Test

To evaluate the effects of OPC content (Factor A), GO content (Factor B), and gradation (Factor C) on the permeability coefficient of the slurry–stone body, range analysis was performed on nine sets of experimental results. The range analysis results are listed in Table 6.
In the table above, Q i represents the experimental index for the range analysis level; R is the range of variation in the experimental index. The larger R is, the greater the impact of the factor on the experimental index. The magnitude of R can also be used to determine the importance of the factors.
According to Table 6, the order of factors affecting the permeability coefficient of the grout-strengthened stone body is OPC content > GO content > gradation. Each factor has a certain influence on the permeability coefficient of the grouted stone body. Among these factors, the OPC (ordinary Portland cement) content has the most pronounced effect on the permeability coefficient of the grout-strengthened body. Following that, the GO (graphene oxide) content has a significant impact, while the gradation of materials has the weakest influence on the permeability coefficient of the grout-strengthened body. The research results show that when each factor changes, the permeability coefficient of the grout-strengthened body decreases with the increase in OPC content and GO content. Among all the influencing factors, the permeability coefficient of the grout-strengthened body fluctuates greatly under the influence of OPC content, followed by GO content, and is least affected by formation conditions.

3.2.2. Variance Analysis of Permeability Coefficient Test Results

To further evaluate and verify the effects of OPC content (Factor A), GO content (Factor B), and gradation (Factor C) on the permeability coefficient of the grout-strengthened body, a variance analysis was conducted on the results obtained from the nine sets of experiments. The results are shown in Table 7.
The F-value is the ratio of the two mean square deviations. The error sums of squares and degrees of freedom are 2.605 and 2, respectively. By consulting the F-distribution table for a degree of freedom of (2,2) for significance levels of 0.1, 0.05, and 0.01, we can determine that F0.1(3,3) = 9, F0.05(3,3) = 19, and F0.01(3,3) = 99. From Table 7, it can be seen that Factor A satisfies both F0.1(2,2) and F0.05(2,2), while none of the factors satisfy F0.01(3,3). Comparing the F-values, it can be that the influence of GO content (Factor B) is greater than the influence of gradation concluded (Factor C). Based on a comprehensive analysis, it can be concluded that the OPC content (Factor A) has a significant influence on the permeability coefficient of the grout-strengthened body. The GO content (Factor B) also demonstrates a relatively significant impact. In contrast, the gradation of materials (Factor C) shows no significant influence on the permeability coefficient of the grout-strengthened body.

3.2.3. Multiple Regression Analysis of Permeability Coefficient Influencing Factors

The experimental data were processed using regression analysis. Regression analysis is employed to establish a mathematical relationship between variables by utilizing mathematical expressions. This analytical approach enables the prediction of the dependent variable’s value based on the independent variable’s value. By doing so, regression analysis aims to unveil the underlying statistical patterns hidden within the randomness of the data. When the independent variables are multiple factors, the significance of the influence of each variable on the dependent variable can be found using variance analysis. The formation permeability coefficient K is used as the dependent variable, and the OPC content, GO content, and gradation are used as independent variables. Through regression analysis, the influence of OPC content, GO content, and gradation on the formation permeability coefficient can be obtained.
The multiple linear regression analysis method is used to process the test data. It is assumed that there are m independent variables, which are recorded as x1, x2, …, xi, …, xm. The dependent variable y is the test result. If n sets of data are measured in the test,
(x11, x21, …, xi1, …, xm1, y1)
(x12, x22, …, xi2, …, xm2, y2)
……
(x1n, x2n, …, xin, …, xmn, yn)
The multivariate linear regression equation is expressed as follows:
y ^ = a + b 1 x 1 + b 2 x 2 + + b m x m
where a is a constant, and bi(i = 1, 2, ⋯, m) is a partial regression coefficient. According to the principle of the least square method, the unknown parameters can be solved by minimizing the residual sum of squares of the regression equation. The specific calculation method is as follows:
The residual sum of squares Qe can be obtained using the following formula:
Q e = j = 1 n y j y J ^ 2 = j = 1 n y j a + b 1 x 1 j + b 2 x 2 j + + b m x m j 2  
The partial derivatives of the residual sum of squares for a and bi can be obtained:
Q e a = 2 j = 1 n y j a + b 1 x 1 j + b 2 x 2 j + + b m x m j 2 = 0  
Q e b i = 2 j = 1 n y j a + b 1 x 1 j + b 2 x 2 j + + b m x m j 2 = 0  
The above two equations form a set of (m + 1) equations;
a and bi can be obtained by solving the equations.
They obey the following equation:
K = A · O B · H C · N D
where O is OPC content; H is GO content; N is the ground level; and K is the permeability coefficient of the stratum.
A, B, C, and D are undetermined coefficients. The equation is a nonlinear equation, taking the logarithm on both sides:
log K = log A + B · log O + C · log H + D · log N  
k = log K , a = log A ,   o = log O , h = log H ,   n = log N . The equation is transformed into a linear equation:
k = a + B · o + C · h + D · n  
The partial regression coefficients B, C, D, and E of constant A can be obtained by using the multiple linear regression method to analyze the experimental data. The standardized regression coefficient Beta can be obtained by standardizing the partial regression coefficients:
k = 1.258070 + 0.612667 o + 14.719298 h 0.348333 n  
b o = 0.923 ,   b h = 0.112 ,   b n 0.105 ,   R 2 = 0.875
where b o ,   b h ,   b n are the standardized regression coefficients Beta of grouting volume to OPC content, GO content, and gradation, respectively, and R2 is the multiple correlation coefficient. After transformation, the regression equation can be obtained:
K = 0.055 · O 0.613 · H 14.712 · N 0.348
According to the analysis, the multiple regression analysis shows that the coefficient of multiple determination is 0.875, indicating a strong correlation between the grouting reinforcement material and the OPC dosage, GO dosage, and gradation. The standardized analysis of partial regression coefficients shows that b o > b h > b n . This indicates that the OPC dosage has the most significant influence on the permeability coefficient of the grouting reinforcement material, followed by the GO dosage. On the other hand, geological conditions have the weakest impact.

3.3. The Microstructural Characteristics of the Grout–Solid Interface

The cemented broken gravel sample undergoes a microscopic damage process, which involves deterioration and cracking of the structure. As a result, a distinctive microcrack surface morphology is formed. There exists a significant correlation between the microcrack surface morphology and the mechanical properties of the sample [39]. The degree of damage to the sample can be inferred from the microcrack surface morphology, which also reflects the resistance strength of the cemented broken gravel sample to uniaxial load. Therefore, scanning electron microscopy was used to observe the fracture surface of the samples, allowing for further analysis of the reinforcing effect of industrial-grade graphene oxide on broken gravel.
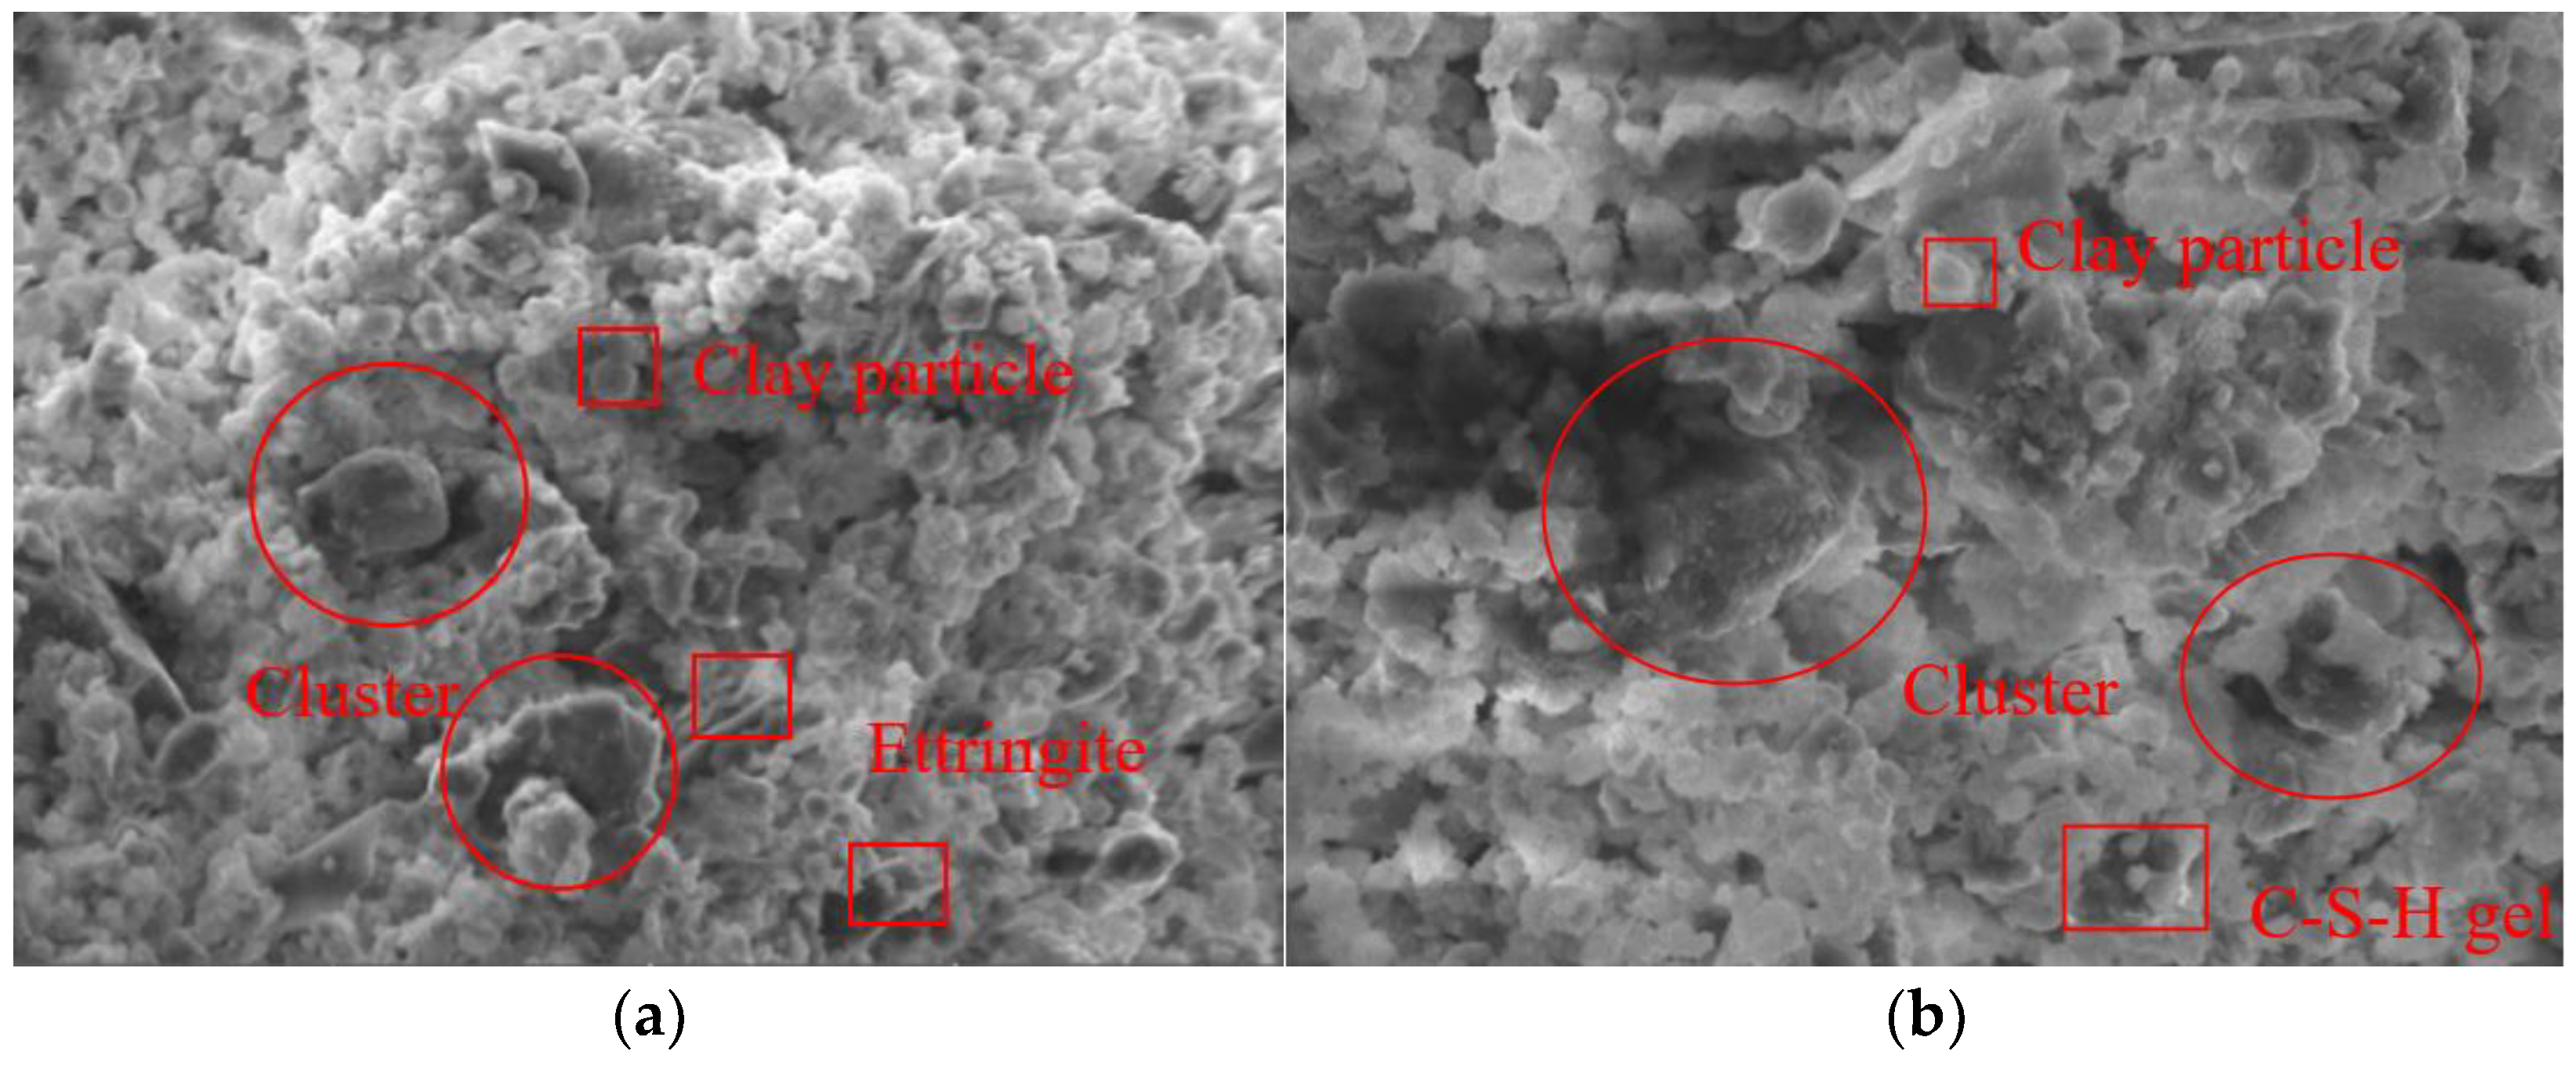
This study summarizes and compares the micro-reinforcement modes of different grouting materials for the GO-0 and GO-5 samples with GO dosages of 0% and 0.05%, respectively (refer to Figure 7). Figure 7a shows the presence of clay–cement agglomerates at the GO-0 cement–gravel interface, surrounded by a large number of clay particles forming a skeleton structure with the agglomerates as the core. However, these agglomerates have small volumes with noticeable cracks and low bonding degrees, significantly affecting the macroscopic strength of the reinforcement material. This is the fundamental reason why traditional clay–cement grouts and their reinforced bodies exhibit low initial anti-permeability and filtration abilities in underground water-rich and erosion environments, exhibit low stone strength, and are prone to brittle failure.
In contrast, Figure 7b illustrates a significant amount of well-developed clay–cement agglomerate particles at the GO-5 cement–gravel interface, improving the density of the interface structure compared with GO-0. Additionally, there is no CH crystal present at the cement–gravel interface. A substantial amount of C-S-H gel has already reacted, and the mineral composition is reasonable. The microstructure of the structural body is dense, and the surface bonding density is high. These factors are highly conducive to significantly enhancing the bonding strength of the transition zone between the cement paste and gravel. Compared with the GO-0-reinforced body, GO-5 offers advantages such as a reasonable mineral composition, dense structure, and high interface bonding strength. These characteristics ensure excellent mechanical properties and long-term stability in water-rich environments.
These findings align with the results of Y. Gao et al. [40], which suggest that oxidized graphene nanosheets have the capability to enhance the hydration reaction in injection materials. This enhancement is achieved through facilitating the nucleation of oxygen-containing functional groups and altering the morphology of hydration products. This enhancement of the slurry’s microstructure contributes to its consistency. In this experiment, the improvement of binding gravel through oxidized graphene primarily lies in the integrity and regularity of the fracture surface. Previous studies have highlighted two main mechanisms by which carbon nanotubes, graphene, oxidized graphene [41], and other nanomaterials enhance the microstructure of cement-based composites to improve their performance. Firstly, the nanomaterials themselves have a nucleation effect, promoting the hydration reaction of cement to generate more C-S-H and transmit additional cement hydration products in microcapillary pores. Secondly, the nanomaterials act as bridges in the microwrinkles of materials [42].
In recent years, there has been an increasing application of fractal theory in quantitatively characterizing rock fracture surfaces [43]. Wang and Xiong [44] proposed that the failure of specimens under constant external loads is essentially a nonlinear and statistically significant superposition of various microscopic deformation variables. Therefore, this study employed the fractal box dimension method to investigate the fractal characteristics of the fractured surface of oxidized graphene composite cement-based material and its control group. These materials were bound with fragmented gravel samples that underwent uniaxial compression failure. By applying fractal theory, the researchers explored the intricacies of the surface patterns and structures at a microscopic level.
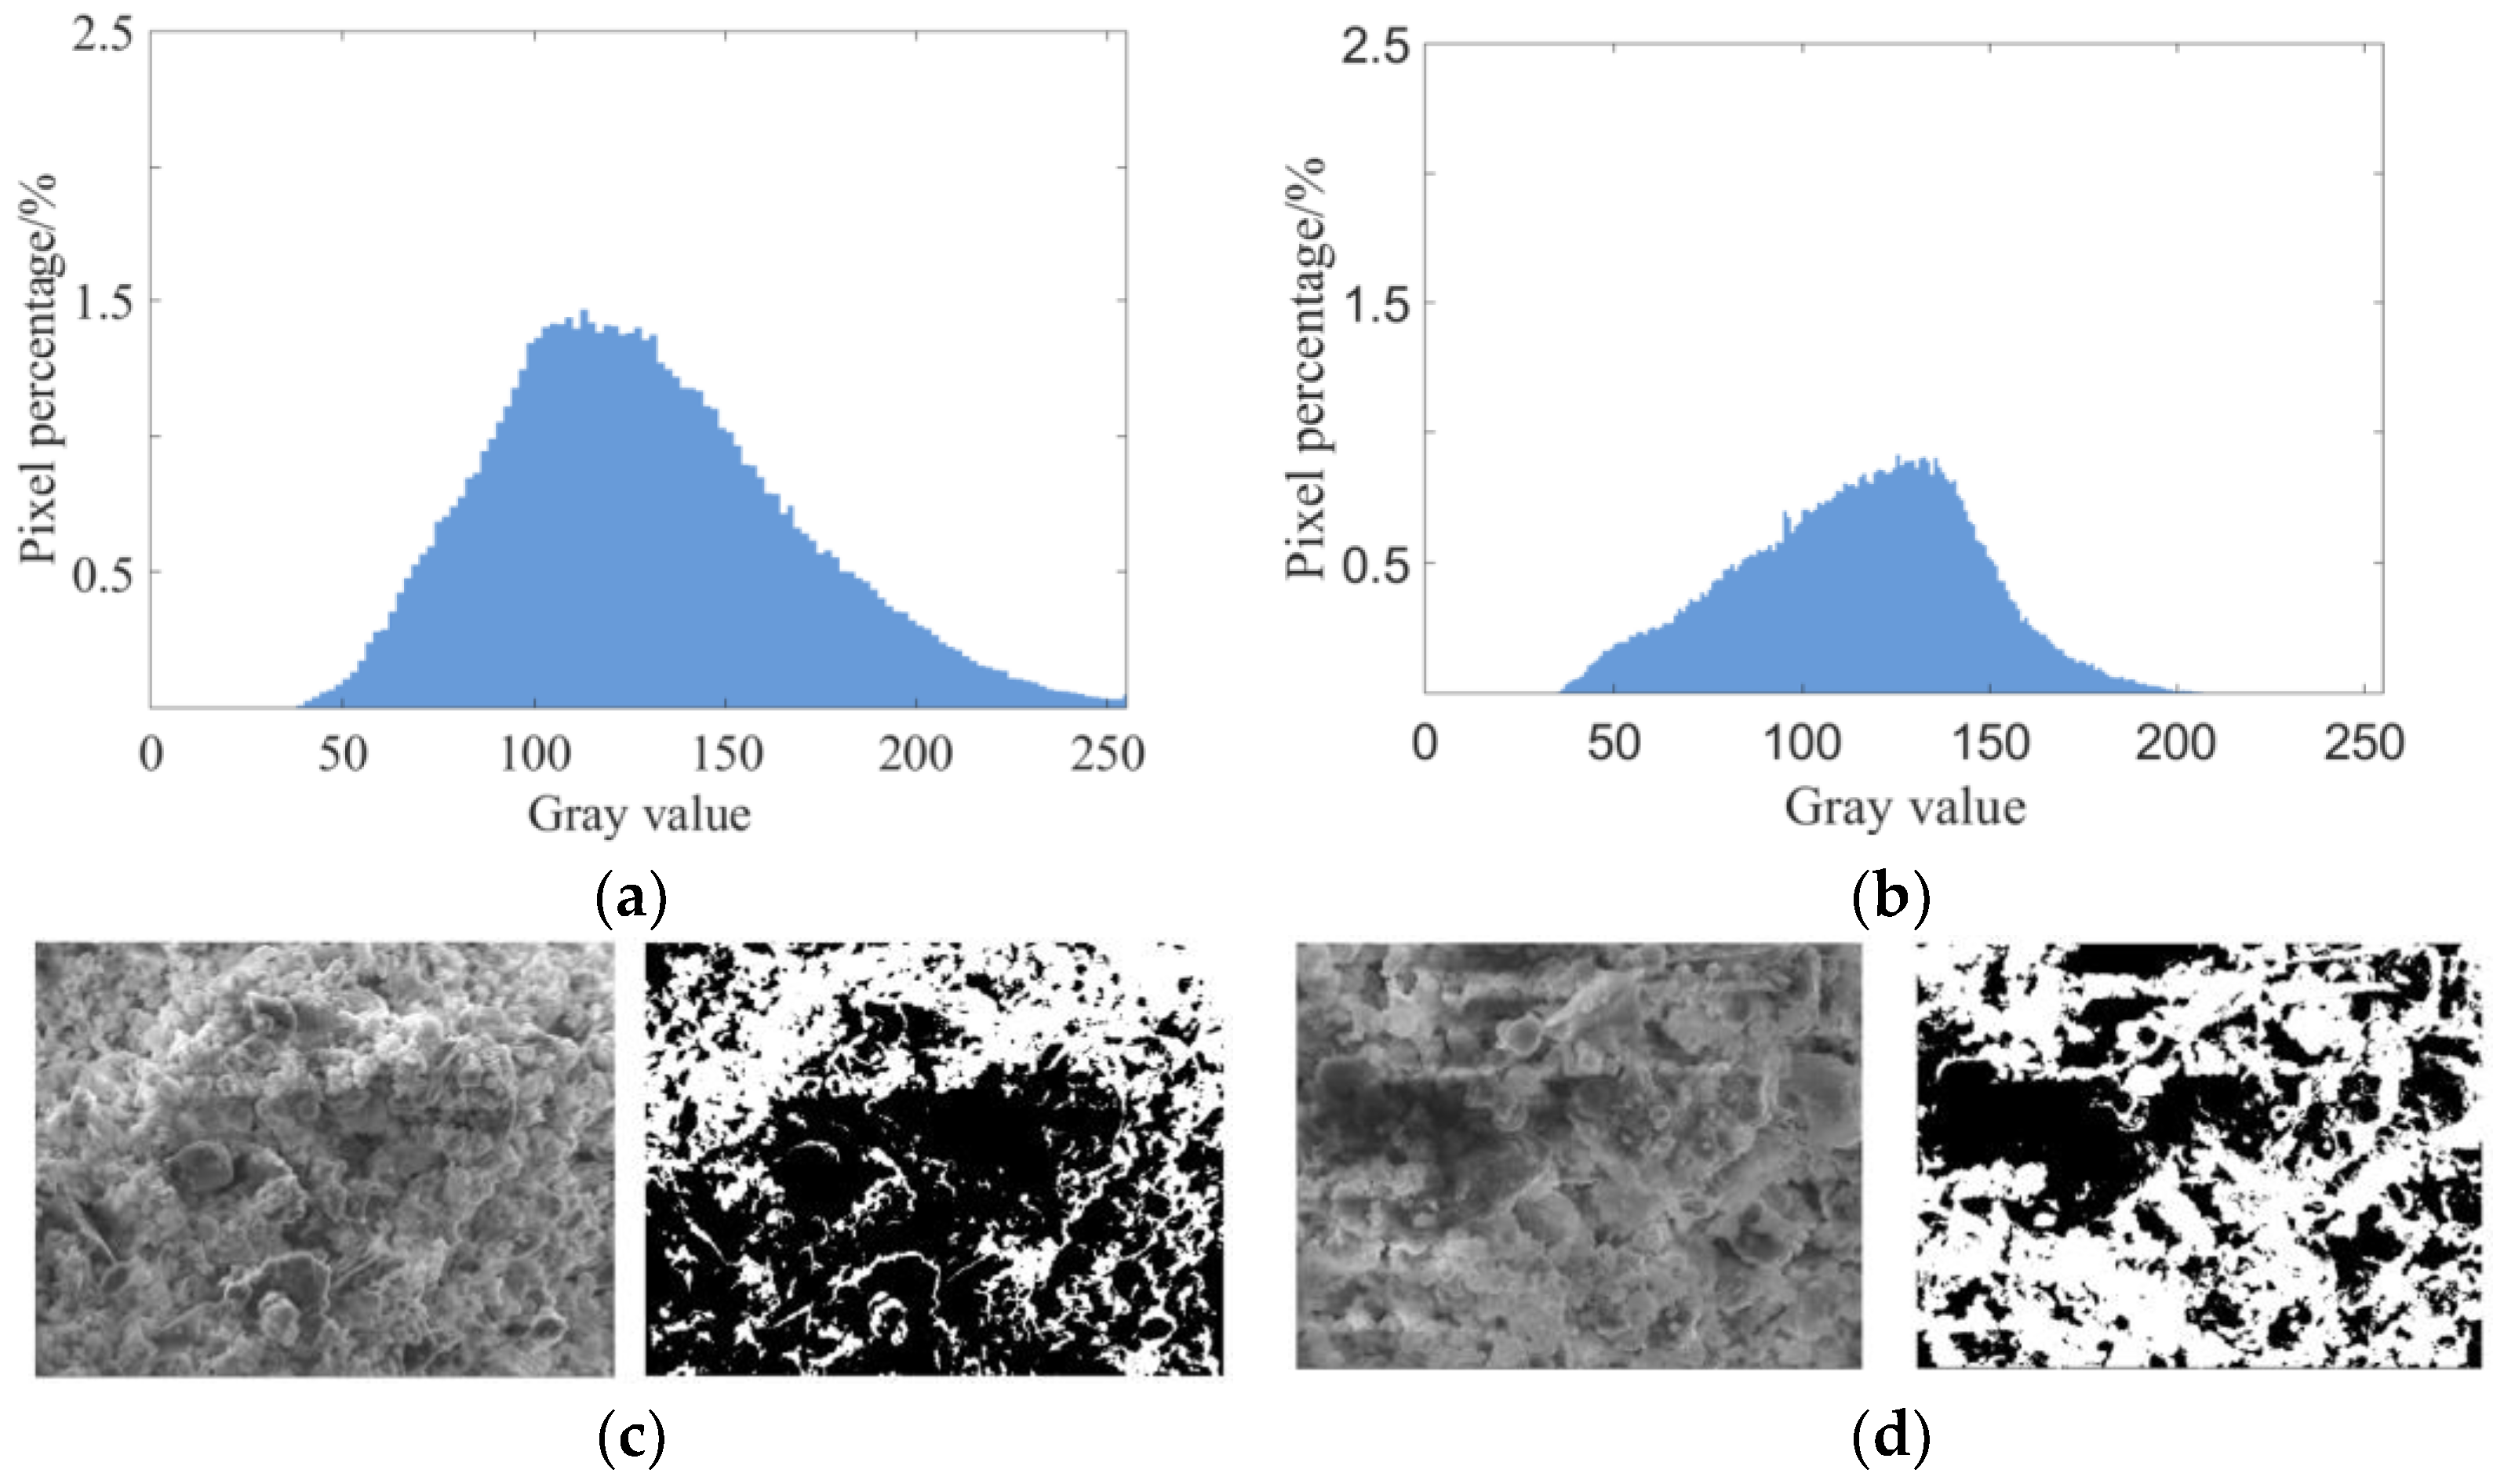
To facilitate the processing of scanning electron microscopy (SEM) images, the Matlab function T = graythresh(I) was employed, and the Otsu method [45] was utilized to calculate the global threshold T based on the grayscale image I. The Otsu method selects a threshold that minimizes the intraclass variance in thresholded black and white pixels. As depicted in Figure 8, by determining the image threshold, SEM images can be converted into binary form. The processed image is shown in Figure 8c,d, where the white area appears relatively complete and regular, displaying consistent color. Conversely, the black area appears relatively scattered and discrete, exhibiting noticeable color differences.
The calculation method of the fractal box dimension is as follows [46]: B R n ,   B Ø ,   r > 0 ; ( B ) is defined as the minimum value of the n-dimensional square required to cover the n-dimensional set B and r is the side length of the square. If there is d when r 0 , the following is true:
N r ( B ) 1 / r d  
d is regarded as the fractal box dimension of set B , where there exists a unique positive number a, such that the following is true:
l i m r 0 N r B 1 r d = a
Taking the absolute value of the logarithm on both sides of the above formula, the fractal box dimension d can be calculated:
d = l i m r 0 lg a lg N r B lg r = l i m r 0 lg N r B lg r  
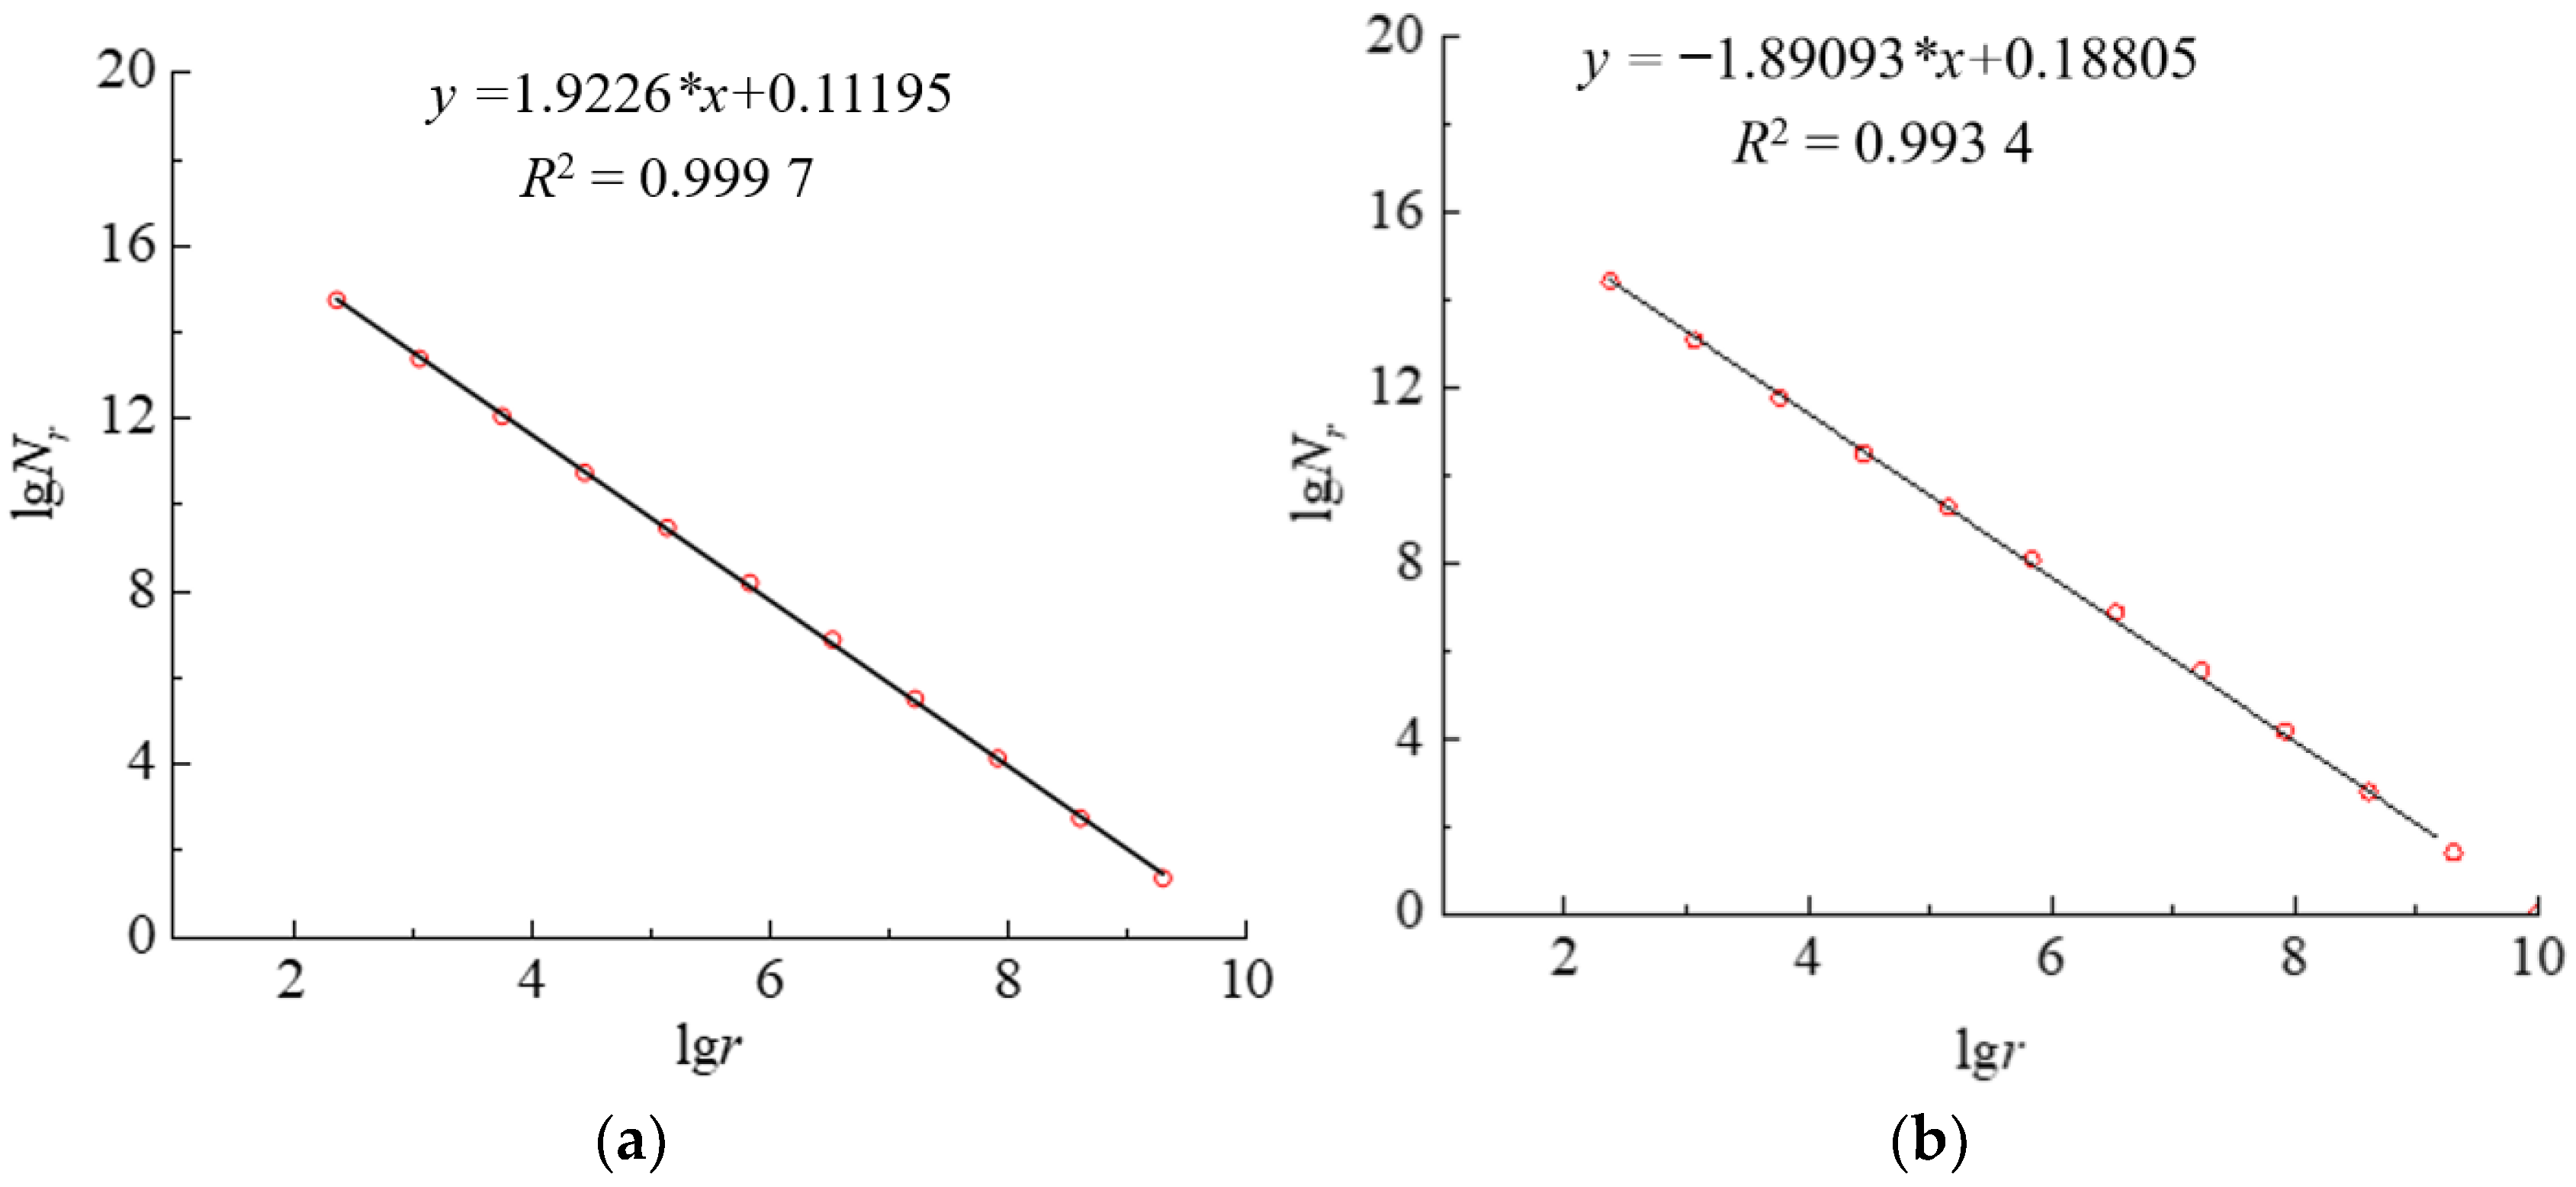
According to the above method, taking the SEM image of the GO-0 sample as an example, the calculation process of the fractal box dimension on the fractured surface of the fragmented gravel is explained. Black squares with different side lengths are used to cover the scanning electron microscope (SEM) image of the specimen’s fracture surface, and the number N r B of squares required to cover the black area is counted. As the side length r of the square increases, the number of squares required N r B also decreases continuously until the number of boxes is small enough. Then, by drawing a scatter plot of ( lg r i , lg N r i B ) and performing linear fitting, the fractal box dimension of the fractured surface of the fragmented gravel after the uniaxial compression test can be obtained. Upon observing the fitted curve, it becomes apparent that the fractured surface’s micromorphology after uniaxial compression of the specimen exhibits self-similarity. The fitting degree is very high ( R 2 = 0.9997 ), which is consistent with the conclusion that the microscopic morphology of rock fracture surfaces has fractal characteristics obtained by Wang, Z. and Xiong, J. [44]. The fitting line of the fractal box dimension of GO-0 and GO-5 is shown in Figure 9.
In this paper, five randomly selected fractured surfaces of oxidized graphene composite clay–cement slurry materials and their control group bound with fragmented gravel were calculated. The results are shown in Table 8.
The statistical analysis reveals that the addition of oxidized graphene to the injection reinforcement section can lead to a reduction in the fractal dimension from 1.9266 to 1.7815–1.8922. This finding is consistent with the research conducted by B. Wei et al. [47], which proposed a close relationship between the fractal dimension and the complexity, nonuniformity, and regularity of microstructures on fracture surfaces. A higher fractal dimension indicates a more irregular, nonuniform, and less cohesive fracture surface, indicating greater damage to the specimen. Therefore, it can be concluded that incorporating oxidized graphene into clay–cement slurry materials effectively enhances the integrity and regularity of fragmented gravel samples, thereby improving their load-bearing capacity.

4. Conclusions

The purpose of this study was to utilize industrial-grade oxidized graphene as an additive in clay–cement slurry materials for reinforcing bound gravel and developing a high-quality engineering injection material to ensure the stability of underground structures. The main conclusions drawn from the research are as follows:
(1)
The addition of just 0.08wt% of industrial-grade oxidized graphene to reinforce fragmented gravel can increase the uniaxial compressive strength by 7.2% to 32.5% compared with traditional clay–cement slurries. This trend is observed across different mixing ratios. Increasing the content of oxidized graphene leads to higher uniaxial compressive and shear strengths, reaching a maximum near a 0.03% growth rate. Plastic strength slightly increases with the rise in oxidized graphene content within 12 h, but after 14 h, plastic strength is significantly enhanced. Industrial-grade oxidized graphene demonstrates a substantial effect on improving the mechanical properties of low-strength bound gravel, thus ensuring the safety of injection reinforcement.
(2)
Through orthogonal experiments, range analysis, variance analysis, and multiple regression analysis, it was determined that there is a strong correlation between the injection reinforcement body and three factors: OPC content, oxidized graphene (GO) content, and geological conditions. Among these factors, OPC content has the most significant impact on the permeability coefficient of the injection reinforcement body, followed by GO content, while geological conditions have the least influence. Industrial-grade oxidized graphene enhances the anti-seepage performance of the injection reinforcement body, contributes to early strength improvements, and ensures structural stability.
(3)
SEM image characterization of the fractured surface further validates that the addition of oxidized graphene stimulates the formation of large-volume clay–cement particle aggregates, resulting in a dense aggregate skeleton, a mesh-like structure filled with clay particles, and a compact mineral structure. The GO-5 reinforcement exhibits advantages such as rational mineral composition, compact structure, and high interface bond strength compared with the GO-0 reinforcement. It guarantees excellent mechanical properties and long-term stability in water-rich environments. Calculation of the fractal box dimension shows that incorporating oxidized graphene into cement-based bonded materials can reduce the fractal box dimension of the fractured surface by 3% to 5%, confirming its role in enhancing the load-bearing capacity of specimens.

Author Contributions

J.S. proposed the idea and designed the scheme; Q.T., Z.X. and Z.Y. assisted with the experimental operation; J.S. analyzed the data; J.S. wrote and submitted the paper; S.L. and J.Z. provided funding support; S.L. and J.Z. reviewed and edited the paper. All authors have read and agreed to the published version of the manuscript.

Funding

This research was financially supported by the National Natural Science Foundation of China (Grant No. 51804157) and the Bingtuan Financial Science and Technology Project (Grant No. 20237189), which are all gratefully acknowledged.

Institutional Review Board Statement

Not applicable.

Informed Consent Statement

Not applicable.

Data Availability Statement

The data used to support the findings of this study are included within the article.

Conflicts of Interest

The authors declare no conflict of interest.

References

  1. Zheng, G.; Cheng, X.S.; Zhou, H.Z. Resilient evaluation and control in geotechnical and underground engineering. China Civ. Eng. J. 2022, 55, 1–38. [Google Scholar]
  2. Xie, H.P. Research review of the state key research development program of China: Deep rock mechanics and mining theory. J. China Coal Soc. 2019, 5, 1283–1305. [Google Scholar]
  3. Zhang, H.W.; Jiang, H.; Liu, S.Q.; Zhao, Y.X.; Sun, X.P.; Ping, Q.; Liu, B.; Zhang, T. Mechanism of grouting diffusion and consolidation of rock mass based on D-Rb-C coupled model. J. China Coal Soc. 2023, 48, 1464–1475. [Google Scholar]
  4. Zhang, J.; Wang, C.; Li, Z.; Gao, Y.; Zhang, W. Experimental study on the engineering characteristics of red mud-based green high-performance grouting material. Chin. J. Rock Mech. Eng. 2022, 41, 3339–3352. [Google Scholar]
  5. Ma, J.; Sun, S.; Zhao, W.; Wang, L.; Ma, Y.; Liu, H.; Zhang, W.; Chen, H.; Chen, L.; Wei, Y. Review on China’s Traffic Tunnel Engineering Research: 2022. China J. Highw. Transp. 2022, 35, 1–40. [Google Scholar]
  6. Wang, Y.L.; Tang, H.Y.; Sun, J.X.; He, H.; Zhao, Y.J.; Wang, J.J. Effect of sodium sulfate and gypsum on performances of expansive grouting material with aluminum as expansion agent. Constr. Build. Mater. 2023, 394, 132212. [Google Scholar] [CrossRef]
  7. Sun, Y.; Zhang, P.; Yan, W. Grouting material development and dynamic grouting test of broken rock mass. J. Mater. Civ. Eng. 2022, 34, 04022072. [Google Scholar] [CrossRef]
  8. Yao, N.; Zhang, W.; Luo, B. Exploring on Grouting Reinforcement Mechanism of Expansive Slurry. Rock Mech. Rock Eng. 2023, 56, 4613–4627. [Google Scholar] [CrossRef]
  9. Liu, S.J.; Sun, J.Z.; Ding, Z.Y.; Zhang, J.W. Experimental Study on Performance of Graphene Oxide Modified Clay-cement Slurry. Met. Mine 2023, 3, 59–64. [Google Scholar]
  10. Zhang, Y.; Gao, G.R.; Gao, X.G. Theoretical analysis of clay-cement slurry diffusion mechanism considering time-dependent behavior of rheology parameters. Coal Eng. 2022, 5, 164–168. [Google Scholar]
  11. Yu, W.; Zhou, M.; Wan, X. Experimental study on physical properties of superfine cement grouting material. Front. Mater. 2022, 9, 1056135. [Google Scholar] [CrossRef]
  12. Mokhtar, M.M.; Abo-El-Enein, S.A.; Hassaan, M.Y. Mechanical performance, pore structure and micro-structural characteristics of graphene oxide nano platelets reinforced cement. Constr. Build. Mater. 2017, 138, 333–339. [Google Scholar] [CrossRef]
  13. Wang, K.; Li, S.C.; Yang, L.; Zhang, Q.S.; Li, Z.F.; Yuan, J.Q. Grouting Simulation Experiment on Reinforcement Characteristics of Completely Decomposed Granite. J. Tianjin Univ. Sci. Technol. 2017, 50, 1199–1209. [Google Scholar]
  14. Qian, Z.W.; Jiang, Z.Q.; Cao, L.W.; Sun, Q. Experiment study of penetration grouting model for weakly cemented porous media. Rock Soil Mech. 2013, 34, 139–142+147. [Google Scholar]
  15. Li, Z.P.; Zhang, L.Z.; Zhang, Q.S.; Liu, R.T.; Yang, W.D.; Chu, T.Y. Simulation test for permeation grouting reinforcement effect of sand layer. J. China Coal Soc. 2018, 43, 3488–3497. [Google Scholar]
  16. Feng, H.; Zhang, X.M.; Ou, X.F.; Zhang, C.; Jiang, J.; Guo, T.F.; Zhou, X.Y. Experimental Study on Geopolymer Grouting Material in Rapid Grouting Reinforcement of Fractured Rock. J. South China Univ. Technol. Nat. Sci. Ed. 2020, 48, 43–50. [Google Scholar]
  17. Newell, M.; Garcia-Taengua, E. Fresh and hardened state properties of hybrid graphene oxide/nanosilica cement composites. Constr. Build. Mater. 2019, 221, 433–442. [Google Scholar] [CrossRef]
  18. Peng, L.; Xu, Z.; Liu, Z.; Wei, Y.Y.; Sun, H.Y.; Li, Z.; Zhao, X.L.; Gao, C. An iron-based green approach to 1-h production of single-layer graphene oxide. Nat. Commun. 2015, 6, 5716. [Google Scholar]
  19. Luan, V.H.; Tien, H.N.; Hoa, L.T.; Hien, N.; Oh, E.; Chung, J.; Kim, E.J.; Choi, W.M.; Kong, B.; Hur, S.H. Synthesis of a highly conductive and large surface area graphene oxide hydrogel and its use in a supercapacitor. J. Mater. Chem. A 2012, 1, 208–211. [Google Scholar] [CrossRef]
  20. Sheshmani, S.; Fashapoyeh, M.A. Suitable Chemical Methods for Preparation of Graphene Oxide, Graphene and Surface Functionalized Graphene Nanosheets. Acta Chim. Slov. 2013, 60, 813–825. [Google Scholar]
  21. Li, Q.C.; He, C.; Zhou, H.; Xie, Z.Y.; Li, D.X. Effects of polycarboxylate superplasticizer-modified graphene oxide on hydration characteristics and mechanical behavior of cement. Constr. Build. Mater. 2021, 272, 121904. [Google Scholar] [CrossRef]
  22. Li, D.B.; Lei, P.B.; Zhang, H.C.; Liu, J.P.; Lu, W. Co-Effects of Graphene Oxide and Cement on Geotechnical Properties of Loess. Adv. Mater. Sci. Eng. 2021, 2021, 7429310. [Google Scholar] [CrossRef]
  23. Zhang, C.; Wang, W.; Zhu, Z.D.; Li, N.; Pu, S.Y.; Wan, Y.; Huo, W.W. Triaxial mechanical characteristics and microscopic mechanism of graphene-modified cement stabilized expansive soil. Geotech. Eng. 2021, 26, 96–106. [Google Scholar] [CrossRef]
  24. Valizadeh, M.; Choobbasti, A.J. Evaluation of nano-graphene effect on mechanical behavior of clayey sand with microstructural and self-healing approach. J. Adhes. Sci. Technol. 2020, 34, 299–318. [Google Scholar] [CrossRef]
  25. Zhou, G.X.; Zhong, J.; Zhang, H.; Hu, X.Y.; Wu, J.L.; Koratkar, N.; Shi, X.M. Influence of releasing graphene oxide into a clayey sand: Physical and mechanical properties. RSC Adv. 2017, 7, 18060–18067. [Google Scholar] [CrossRef] [Green Version]
  26. Tong, T.; Fan, Z.; Liu, Q.; Wang, S.; Tan, S.; Yu, Q. Investigation of the effects of graphene and graphene oxide nanoplatelets on the micro- and macro-properties of cementitious materials. Constr. Build. Mater. 2016, 106, 102–114. [Google Scholar] [CrossRef]
  27. Lu, C.; Lu, Z.; Li, Z.; Leung, C.K. Effect of graphene oxide on the mechanical behavior of strain hardening cementitious composites. Constr. Build. Mater. 2016, 120, 457–464. [Google Scholar] [CrossRef]
  28. Pan, Z.; Wenhui, D.; Li, D.; Collins, F. Graphene Oxide Reinforced Cement and Concrete; Google Patents; Monash University: Melbourne, Australia, 2013. [Google Scholar]
  29. GB/T 1345-2005; The Test Sieving Method for Fineness of Cement. Standardization Administration of the People’s Republic of China: Beijing, China, 2005.
  30. Liu, S.J.; Sun, J.Z.; Zhang, J.W.; Xie, Z.D.; Yu, Z.J. Effect of Graphene Oxide on the Mechanical Property and Microstructure of Clay-Cement Slurry. Materials 2023, 16, 4294. [Google Scholar] [CrossRef]
  31. GB/T 17671-1999; Cement Mortar Strength Test Standard Cement Mortar Strength Test Method (ISO Method). Standardization Administration of the People’s Republic of China: Beijing, China, 1999.
  32. GB/T 1346-2011; Test Methods for Water Requirement of Normal Consistency, Setting Time and Soundness of the Portland Cements. Standardization Administration of the People’s Republic of China: Beijing, China, 2011.
  33. Gao, Y.; Jing, H.; Yu, Z.; Wu, J.; Yin, Q.; Fu, G. Experimental study on the mechanical properties of crushed stone cemented by graphene oxide and cement-based composite grouting materials. Chin. J. Rock Mech. Eng. 2022, 41, 1898–1909. [Google Scholar]
  34. Zhong, X.; Gao, G. Grouting Construction Manual, 1st ed.; China Coal Industry Publishing House: Beijing, China, 2013; pp. 41–42. [Google Scholar]
  35. Lu, S.; Sun, T.; Ma, Y.; Qiu, C.; Ding, H.; Liu, J. Regulation of grapheme oxide on microstructure of hydration crystals of cement composites and its impact on reinforcing toughness. Concrete 2013, 11, 105–112. [Google Scholar]
  36. Qi, M.; Pu, Y.D.; Yang, S.; Sheng, K.; Yun, X.Y. Effect of graphene oxide on the impermeability of cementitious capillary crystalline waterproofing. Acta Mater. Compos. Sin. 2023, 40, 1598–1610. [Google Scholar]
  37. Li, S.; Zhang, X.; Zhang, Q.; Sun, K.; Xu, X.; Zhang, W.; Li, H.; Liu, R.; Li, P. Research on mechanism of grout diffusion of dynamic grouting and plugging method in the water inrush of underground engineering. Chin. J. Rock Mech. Eng. 2011, 30, 2377–2396. [Google Scholar]
  38. Yuan, J.; Chen, W.; Huang, S. Experimental study on physico-mechanical properties of grouted completely weathered granite. Chin. J. Rock Mech. Eng. 2016, 35, 2876–2882. [Google Scholar]
  39. Wang, C.; Yang, C.; Heng, S.; Mao, H. CT test for evolution of mudstone fractures under compressive load. Rock Soil Mech. 2015, 36, 1591–1597. [Google Scholar]
  40. Gao, Y.; Jing, H.; Fu, G.; Zhao, Z.; Shi, X. Studies on combined effects of graphene oxide-fly ash hybrid on the workability, mechanical performance and pore structures of cementitious grouting under high W/C ratio. Constr. Build. Mater. 2021, 281, 122578. [Google Scholar] [CrossRef]
  41. Chen, S.J.; Li, C.Y.; Wang, Q.; Duan, W.H. Reinforcing mechanism of graphene at atomic level: Friction, crack surface adhesion and 2D geometry. Carbon 2017, 114, 557–565. [Google Scholar] [CrossRef]
  42. Mohammed, A.; Sanjayan, J.G.; Duan, W.H.; Nazari, A. Incorporating graphene oxide in cement composites: A study of transport properties. Constr. Build. Mater. 2015, 84, 341–347. [Google Scholar] [CrossRef]
  43. Li, S.J.; Li, D.; WU, L.; Cao, L.J. Meso-simulation and fractal characteristics for uniaxial compression test of inhomogeneous rock. J. China Coal Soc. 2014, 39, 849–854. [Google Scholar]
  44. Wang, Z.; Xiong, J.; Yang, Y.; Li, H. A flexible and robust threshold selection method. IEEE Trans. Circuits Syst. Video Technol. 2017, 28, 2220–2232. [Google Scholar] [CrossRef]
  45. Otsu, N. A threshold selection method from gray-level histograms. IEEE Trans. Syst. Man Cybern. 1979, 9, 62–66. [Google Scholar] [CrossRef] [Green Version]
  46. Ai, T.; Zhang, R.; Zhou, H.W.; Pei, J.L. Box-counting methods to directly estimate the fractal dimension of a rock surface. Appl. Surf. Sci. 2014, 314, 610–621. [Google Scholar] [CrossRef]
  47. Wei, B.; Zhao, X.; Wang, L.; Hu, B.; Yu, L.; Tang, H. Analysis of gear surface morphology based on gray level co-occurrence matrix and fractal dimension. PLoS ONE 2019, 14, e0223825. [Google Scholar] [CrossRef] [PubMed] [Green Version]
Figure 1. Diagram of test device.
Applsci 13 08452 g001
Figure 2. Gravel gradation curve.
Applsci 13 08452 g002
Figure 3. Test methods and processes.
Applsci 13 08452 g003
Figure 4. Effect of GO and OPC content on compressive strength of the specimens (water glass of 10 mL/L).
Applsci 13 08452 g004
Figure 5. Effect of GO and OPC content on shear strength of the specimens (water glass of 10 mL/L).
Applsci 13 08452 g005
Figure 6. Effect of GO dosage on time dependence of plastic strength (OPC of 150 g/L, water glass of 10 mL/L) [30].
Applsci 13 08452 g006
Figure 7. Comparison of microscopic reinforcement characteristics of GO composite interfaces: (a) GO-0; (b) GO-5 (50 μm).
Applsci 13 08452 g007
Figure 8. Relationship between gray value and pixel value of sample, diagrams of the microscopic morphology of the sample: (a) GO-0, gray value; (b) GO-5, gray value; (c) GO-0, microscopic morphology; (d) GO-5, microscopic morphology.
Applsci 13 08452 g008
Figure 9. Fitting line of the fractal box dimension of sample: (a) GO-0; (b) GO-5.
Applsci 13 08452 g009
Table 1. Properties of materials [30].
CementPropertyClayPropertyGOProperty
SiO221.32%Water content3.7%Suspension2 mg/mL
Al2O34.31%Plastic limit24.2%Diameter 3~8 nm95%
Fe2O33.38%Liquid limit41.1%Thickness < 3 nm90%
CaO61.26%Plasticity index17.2Purity99%
MgO2.47%Liquid index−1.19--
SO22.55%----
Table 2. Ratio of clay–cement slurry containing graphene oxide [30].
NumberOPC/(kg/m3)GO/%Sodium Silicate/mL/L
OPC-1-050010
OPC-1-1500.0310
OPC-1-2500.0510
OPC-2-0100010
OPC-2-11000.0310
OPC-2-21000.0510
OPC-3-0150010
OPC-3-11500.0310
OPC-3-21500.0510
Table 3. Penetration test record sheet.
Sample GroupWater Permeate/cm3Specimen Height/cmFracture Area/cm2Mean Water Level/cmTime/sPermeability Coefficient/
(cm/s)
I30.01019.64.77100.08
II68.21019.61.50100.58
III33.91019.60.40101.08
Table 4. Gravel grouting test specimen ratio.
NumberOPC/%GO/%Gradation
I30.01019.6
II68.21019.6
III33.91019.6
Table 5. Permeability test results.
Number σ /MPa t /s Q / m3Permeability Coefficient/ 10 7 m · s 1
1-10.173135.00 × 10−91.11
1-20.153108.21 × 10−92.68
1-30.137127.66 × 10−92.33
2-10.221192.94 × 10−83.49
2-20.197161.73 × 10−82.74
2-30.177162.41 × 10−84.23
3-10.141245.11 × 10−87.54
3-20.112122.52 × 10−89.36
3-30.162113.45 × 10−87.6
Table 6. Range analysis of permeability coefficient of grouting reinforcement.
NumberK/m·s−1
OPC/%GO/wt.%n
Q 1 6.12 12.14 14.70
Q 1 10.46 14.78 13.77
Q 1 24.50 14.16 12.61
R 6.130.880.70
Table 7. Variance analysis of permeability coefficient test results.
SourceSquare of DevianceDegree of
Freedom
F-Valuep-Value
1-10.173135.00 × 10−91.11
1-20.153108.21 × 10−92.68
1-30.137127.66 × 10−92.33
2-10.221192.94 × 10−83.49
2-20.197161.73 × 10−82.74
2-30.177162.41 × 10−84.23
3-10.141245.11 × 10−87.54
3-20.112122.52 × 10−89.36
3-30.162113.45 × 10−87.6
Table 8. Fractal dimension calculation results of fracture surfaces.
GO Content/%Fractal Box DimensionFitting Degree
0.001.9266 0.9997
0.011.8963 0.9995
0.021.89220.9973
0.031.78150.9981
0.041.85130.9992
0.051.87100.9947
Disclaimer/Publisher’s Note: The statements, opinions and data contained in all publications are solely those of the individual author(s) and contributor(s) and not of MDPI and/or the editor(s). MDPI and/or the editor(s) disclaim responsibility for any injury to people or property resulting from any ideas, methods, instructions or products referred to in the content.