Article

LoRaWAN Metering Infrastructure Planning in Smart Cities

by
Maciej Piechowiak
1,*,
Piotr Zwierzykowski
2 and
Bartosz Musznicki
2
1
Department of Computer Science, Kazimierz Wielki University, 85-064 Bydgoszcz, Poland
2
Institute of Computer and Communication Networks, Faculty of Computing and Telecommunications, Poznań University of Technology, 60-965 Poznań, Poland
*
Author to whom correspondence should be addressed.
Appl. Sci. 2023, 13(14), 8431; https://doi.org/10.3390/app13148431
Submission received: 30 June 2023 / Revised: 15 July 2023 / Accepted: 19 July 2023 / Published: 21 July 2023
(This article belongs to the Special Issue Artificial Intelligence in Life Quality Technologies)

Abstract

:
The planning of metering network infrastructure based on the concept of the Internet of Things primarily involves the choice of available radio technology. Then, regardless of the type and availability of power sources, energy conservation should be one of the main optimization criteria. For this reason, LPWANs operating in unlicensed ISM bands appear to be a suitable solution in urban environments due to their sub 1 GHz propagation properties. High signal penetration and coverage make them applicable in urban areas with buildings and various obstacles. Therefore, this article presents solutions developed to support the planning process of implementing a LoRaWAN network infrastructure aimed at monitoring and collecting electricity meter data in smart cities. To this end, an algorithm has been proposed to support the selection of the number of LoRaWAN gateways and their deployment, as well as the selection of transmission parameters at the measurement nodes with a particular focus on geographic data from real maps.

1. Introduction

The emergence of the Internet of Things (IoT) has revolutionized the way data are transmitted, protocol designs are created, and network services are provided. Therefore, with the development of artificial intelligence, it is considered the next technological revolution. Designers of IoT solutions face the crucial task of assessing the scalability of a particular technology, particularly when it operates on unlicensed ISM (Industrial, Scientific, and Medical) frequency bands. The growth of the Internet of Things network is particularly evident in the urban environment, where smart technologies and data analytics are being added as part of the network infrastructure to optimize urban processes [1]. Governments worldwide prioritize enhancing ecological practices and automating processes to improve physical infrastructure, bolster the economy, enhance energy efficiency, and elevate citizens’ quality of life [2]. Smart cities aim to support urban management and quality of life processes with minimal human intervention [3]. Smart sensors and measurement systems can help develop future cities, but there are many challenges, including the need to improve energy efficiency by planning effective and efficient infrastructure.
Today, electricity operators and suppliers are showing a keen interest in the possibilities of remote reading, acquisition, and processing of metering data. Electricity meters are electronic devices that record information such as electricity consumption, voltage level, current consumption, and power factor. This information is transmitted to the electric operator for system monitoring and customer billing. They can also be transmitted to the consumer for greater transparency of consumption behavior. Usually, these meters capture real-time energy consumption and regularly transmit the data at frequent intervals throughout the day, utilizing diverse data transmission technologies. Advanced Metering Infrastructure (AMI) is an integrated system of smart meters, interconnecting communication networks, and data processing systems that allow two-way communication between energy companies and customers. The system provides a range of functionalities that were previously not possible or had to be performed manually in Automatic Meter Reading (AMR), such as the ability to automatically and remotely measure electricity consumption, connect and disconnect services, tamper detection, power outage detection, and voltage monitoring. In combination with solutions for dedicated end-user technologies, such as home displays and programmable communication thermostats, AMI also enables the collection of data on customer behavior to adjust electricity tariffs and encourages customers to reduce peak demand and energy consumption.
The amount of energy consumed by household electrical appliances is significantly influenced by the behavior and habits of customers. The test results showed that the savings measures reduced daily energy consumption by 15.88%. On the other hand, weekly energy consumption decreased by 6.43%. During the three months of observation, there was a 33.77% decrease in energy consumption [4]. Such savings not only limit related expenses but also help to achieve one of the key sustainability objectives, i.e., limiting carbon dioxide emissions caused by coal and gas power stations.
Communication from the metering devices to the network can take place using a variety of wired and wireless technologies. The native method of wired communication offered by the operator is undoubtedly Power Line Carrier (PLC). In contrast, common wireless communication solutions include many more options: mobile cellular communication, Wi-Fi, ZigBee, Wi-SUN (Smart Utility Networks), wireless ad hoc networks over Wi-Fi, wireless mesh networks, and, finally, Low-Power Wide Area Networks (LPWANs). The basic requirements for data transmission technologies in the Internet of Things are low power consumption, low cost, and low complexity of end nodes with the capability to transmit data over long distances. Under these assumptions, terminal devices can be battery-powered or operate autonomously using photovoltaic cells. In some technologies and radio bands short-range communication is used [5], whereas in others, it can span from hundreds of meters to several kilometers, and the network can be designed in a star topology. As a result, routing issues in this network type are deemed insignificant and are not considered or addressed [6,7].
There are several popular LPWAN solutions available in the market that cater to the diverse needs of IoT deployments. A prominent LPWAN technology is LoRaWAN (LoRa Wide Area Network), which offers long-range connectivity, low power consumption, and scalability for IoT applications [8,9,10,11,12,13]. The Semtech LoRa radio modules have important features for IoT applications, such as long range, low power consumption, and secure data transmission [14].
Another notable LPWAN solution is NB-IoT (Narrow Band IoT), which is a cellular-based LPWAN solution, supported by major telecom operators, offering deep penetration and wide coverage using existing infrastructure [15,16,17,18,19,20,21]. LTE-M (Long-Term Evolution for Machines) is another cellular LPWAN technology that provides higher bandwidth and lower latency, suitable for applications requiring real-time communication.
LoRaWAN has become highly popular in Western European countries due to its license-free spectrum usage, scalability, flexibility, collaborative ecosystem, standardization efforts, interoperability, and cost-effectiveness. These factors have enabled the widespread adoption of LoRaWAN for IoT applications in urban areas, agriculture, asset tracking, and more, making it a preferred choice for businesses, organizations, and communities in the region. In Poland, for example, there are the first municipalities to put into practice solutions based on LoRaWAN technology. There is a well-founded belief that the wider use of sensors of this type is an opportunity for business, administration, and individual customers [22]. This technology is compatible with public, private, or hybrid networks, offering broader coverage compared to cellular networks. It seamlessly integrates with existing infrastructure and facilitates the deployment of cost-effective battery-powered IoT applications. Semtech’s LoRa chips are integrated into a wide range of devices that are manufactured by many IoT solution providers. They connect to WANs and use WANs, and network services are supported by dedicated cloud solutions.
Building and implementing a wireless network for the Internet of Things with any of the technologies presented is costly and time-consuming and must be preceded by a performance evaluation based on computer simulations. The most important objective of the solution presented in this paper is to determine the optimal number of gateways and to select the transmission parameters of the measurement nodes. The problem of gateway deployment is equally important from the point of view of providing services in a given geographical area at the expected quality level. It turns out that a small number of gateways is sufficient to provide communication within a small city. Simulation studies are therefore not limited to synthetic datasets but make use of open databases collecting data on the placement of urban infrastructure elements. In this view, similar studies have not been conducted. To the authors’ best knowledge, such studies have not been undertaken to this date.
This paper presents the use of machine-learning mechanisms and the application of a reliable radio loss model to determine the effective coverage of a network of measurement nodes operating in LoRaWAN technology. In Section 2, a literature review is presented. Section 3 shows how the LoRaWAN network infrastructure works and the computational techniques used. Section 4 discusses the desirability of the approach used, supported by the results of the research work in hypothetical scenarios and in the actual topography of the city. The final section contains summaries and conclusions from the research presented in the article.

2. Related Works

There are a small number of items in the literature on LoRaWAN simulation that take into account accurate radio propagation models and how to deploy gateways efficiently. Upon reviewing the literature, it is evident that the majority of articles conducting simulations of LoRa networks primarily focus on analyzing access to the common channel solely for the traffic generated by the end nodes. As if by design, multi-access in a radio link is modeled. The Pure Aloha mechanism is used in this context. The authors of [23] included the assumptions of the simulation model for the MAC sublayer of the LoRa network in an application called LoRaSim written using the SimPy framework in Python. The assumptions made by the simulator tend to overlook the impact of imperfect orthogonality between messages generated on the same channel but with different spreading factors (SFs). In simulations, the primary metric used to evaluate the system’s performance is the Data Extraction Rate (DER). DER is defined as the ratio of received messages to sent messages within a specified time frame, providing an assessment of the system’s message retrieval efficiency.
The LoRaWANSim [24] project extends the LoRaSim simulator to support the MAC layer mechanisms of the LoRaWAN protocol and introduces bidirectional communication. The downlink transmission to the end node is applicable for IoT applications with automation of the joining process and generates additional traffic for handshakes, acknowledgment traffic (e.g., ACK messages), and key exchange in cryptographic algorithms. The LoRaWANSim incorporates a duty cycle of 1% for the majority of European subbands. Furthermore, it incorporates a realistic collision model that eliminates collisions for traffic in both directions, even if transmissions occur simultaneously on the same channel and with the same spreading factor. The simulator also considers the retransmission strategy, whereby packets that are not acknowledged due to collisions or duty cycle constraints are retransmitted.
It is worth mentioning that some models make the fairly realistic assumption that LoRaWAN technology is used in applications that exhibit communication asymmetry, meaning that the amount of data in the uplink is greater than in the downlink. In [25], measurements in an urban environment showed that, with a distance of up to 2 km between the measurement node and the gateway, the reliability measured by the packet reception ratio (PRR) was 95.5%.
The problem of how to optimally select the number of gateways and how to optimally deploy them to achieve maximum radio coverage was not considered in the context of the above simulators. This problem is often generalized in the topic of wireless sensor networks (WSNs) as optimal sink node placement. The literature presents numerous techniques devoted to it. These are usually heuristic algorithms or computational intelligence techniques [26]. The use of machine-learning mechanisms in LoRaWAN node placement is a new approach here.

3. Materials and Methods

In order to select the locations of LoRaWAN gateways of a distributed measurement system, it is important to identify an accurate propagation model and suitable machine-learning techniques to enable clustering modeling and the selection of optimal node locations. These issues are presented later in this section.

3.1. LoRaWAN Technology Overview

LoRaWAN, a network standard introduced by the LoRa Alliance [27], utilizes the proprietary LoRa modulation technology, which is based on the Chirp Spread Spectrum modulation technique developed and owned by Semtech Company [14]. It operates in one of the unlicensed ISM radio bands, which is geographically dependent. In Europe, the LoRa Alliance established two specific frequency bands for the implementation of LoRa technology. These bands are EU433, ranging from 433.05 to 434.79 MHz, and EU863, spanning from 863 to 870 MHz. The primary modulation parameter in LoRa technology is the spreading factor (SF), which impacts both the data rate and the range of radio transmission. The spreading factor can range from 7 to 12. Signals modulated with different spreading factors are orthogonal, enabling simultaneous transmission and decoding at the same time and frequency. Additionally, signals with the same spreading factor can be decoded even if there is a power level difference of 6dB between them (Table 1).
The LoRaWAN architecture defines an open protocol standardized by LoRa Alliance at the MAC (Medium Access Control) network layer. A LoRaWAN network follows a star topology, where end nodes such as sensors and physical parameter measurement systems exclusively communicate with LoRaWAN gateways within a specific area. In this network structure, end nodes do not communicate directly with each other. This configuration is depicted in Figure 1. As a result, gateways play the role of packet relays within the network by encapsulating raw data into IP packets using TCP or UDP protocols. Additionally, the network server facilitates the transmission of downlink packets to the end nodes. The specifics of this transmission process depend on the class of the end device. The LoRaWAN standard outlines three classes of end devices: A, B, and C.
In Class A devices, the majority of the time is spent in sleep mode. These devices activate two receive (RX) windows, one and two seconds after completing packet transmission from the end device to the gateway. This mechanism allows the end devices to send acknowledgment packets, indicating successful receipt of the message by the network server. The first window utilizes the same frequency channel for transmission. In the second window, transmission occurs on a channel with a frequency of 869.525 MHz, employing a spreading factor of SF 12 and an increased transmission power of 24 dBm. This mode is designed for low power consumption.
In order to enhance the transmission capabilities towards end nodes, devices operating in Class B mode introduce reception windows at predetermined intervals. The gateway sends downlink beacons to Class B end devices, synchronizing them and notifying the network server about the specific times when an end device will be listening for downlink traffic. On the other hand, Class C devices keep their windows continuously open, remaining available at all times for downlink traffic, except during their own transmission periods.
The LoRaWAN protocol incorporates mechanisms to ensure reliable and secure communications. One such mechanism is the Adaptive Data Rate (ADR), which enables the dynamic management of link parameters to enhance packet delivery rates. The management of transmission parameters is possible on both the end device and network server sides. As per the standard documentation [28], the end device initially attempts to optimize connectivity by increasing its transmit power. If this proves insufficient, the device proceeds to lower the data rate as a further adjustment.
When two nodes utilize different spreading factors (SFs), they can transmit their data simultaneously, provided that neither transmission is received at significantly higher power. In the case of different SFs, each packet can be demodulated if the difference in received power exceeds the SINR (Signal-to-Interference-Plus-Noise Ratio) threshold for each SF, as indicated in Table 1. For instance, a transmission using SF 7 can be successfully received as long as another transmission using SF 8 does not exceed a 16 dB power difference.

3.2. Radio Transmission Range Modeling

The range of wireless transmission is primarily influenced by three key characteristics of these networks: radio range, data transmission rate, and energy consumption. Each technology aims to strike a balance between these properties. For instance, Wi-Fi and Bluetooth-based devices achieve high transmission speeds at the cost of increased energy consumption and limited range, particularly indoors (typically within several dozen meters or less). In contrast, LoRa technology utilizes lower radio bands and lower data rates, allowing for transmission over significantly longer distances with minimal power consumption.
Ensuring optimal coverage involves another crucial factor: direct visibility, which refers to a clear line of sight between the transmitter and the receiver. In radio communication, the radiation area is characterized by Fresnel zones. These zones represent ellipsoids situated between the transmitter and the receiver. The size of each ellipsoid depends on the transmission frequency and the distance separating the two locations.
Objects within the Fresnel zone have a detrimental impact on the signal level and can diminish the communication range. LoRa technology possesses a significant advantage by utilizing the 868 MHz, 915 MHz, and 923 MHz ISM bands. These frequencies are considerably lower than the commonly used 2.4 GHz and 5 GHz bands, resulting in reduced transmission losses and improved penetration through obstacles like building walls or trees. Additionally, the interference from devices operating at 2.4 GHz and 5 GHz, such as Wi-Fi and Bluetooth, is increasingly prevalent in densely populated urban environments.
The log-distance propagation model, also known as the log-normal shadowing model, is a commonly employed method for predicting radio signal propagation and attenuation across various environments [29]. It assumes that propagation losses follow a logarithmic normal distribution, with the mean varying with distance according to a power relationship. The model is versatile and applicable to both line-of-sight scenarios and scenarios beyond line-of-sight, where the signal may encounter obstacles such as buildings and trees:
P r = P t + G t + G r 10 γ l o g 10 ( d ) + X σ ,
where P r is the received signal power and P t is the transmit power. Parameters G t and G r are antenna gains in transmitting and receiving and d is the distance between devices. The γ is empirically determined for different environmental conditions. The X σ component refers to the shadow fading of the received signal power. The log-distance propagation model captures the signal attenuation caused by obstacles such as buildings, trees, or terrain. This attenuation is represented by a random variable that follows a log-normal distribution with a mean of zero and a specific standard deviation σ .
In the literature, various analytical network models for LoRaWAN performance have been described [12,30]. These models differ in terms of the type of interference from the spreading factor that they consider and whether they incorporate channel fading [31] or other interference from technology [30]. On a different note, the mathematical model for LoRa modulation was introduced in [32]. Analytically, it has been demonstrated that LoRa modulation outperforms FSK modulation in scenarios involving frequency selective fading.
The COST-213 Hata model is a radio propagation (that is, path loss) model that extends the Hata model for urban environments. It is based on the Okumura model and designed to cover a wide frequency range up to 2 GHz. It is the most widely cited of the COST-231 models, which were developed as part of a research project funded by the European Union [33]. The model combines empirical and deterministic approaches to estimate path losses in urban areas in the frequency range from 800 MHz to 2000 MHz [34] and incorporates the results of experimental measurements carried out in many cities throughout Europe. For both the reasons mentioned above, as well as its popularity in the literature, it seems reasonable to apply it to studies using LoRaWAN, although the literature related to this radio technology also indicates the validity of the variations of the Lee [35] or Okumura model [36]. The model is expressed by the following formula [34]:
P r = ( 46.3 + 33.9 l o g 10 ( f c ) ) 13.82 l o g 10 ( h b ) C h + + ( 44.9 6.55 l o g 10 ( h b ) ) l o g 10 ( d ) + C ,
where:
C h = h m ( 1.1 l o g 10 ( f c ) 0.7 ) ( 1.56 l o g 10 ( f c ) 0.8 )
and h m is the antenna height of the terminal node [1–10 m], h b is the antenna height of the LoRaWAN gateway [30–200 m], f c is the carrier frequency [500–2000 MHz], d is the transmission distance [up to 20 km], the parameter C takes the value 0 for medium-sized cities and suburban areas and 3 for metropolitan areas.

3.3. Clustering Techniques

In machine learning (ML), clustering techniques are a set of algorithms and methods that are used to group similar data points based on their inherent properties or patterns. This specific task of unsupervised learning is particularly useful when dealing with large datasets and can be applied to various domains, including geographical data analysis. The goal of clustering is to identify natural groups or clusters in a dataset without the need for predefined labels or classes. These techniques are widely used in data mining, exploratory data analysis, pattern recognition, and many other fields [37]. They can be used in the process of clustering the end nodes of LoRaWAN networks to find optimal deployment points for packet forwarders (gateways).
Among clustering algorithms, K-means is one of the most widely used [38]. It aims to partition a dataset into K clusters, where each cluster is represented by its centroid. K-means groups similar data samples in one group away from dissimilar data samples. Its objective is to minimize the Within-Cluster Sum of Squares (WCSS) and maximize the Between-Cluster Sum of Squares (BCSS). The K-means algorithm has various implementations and conceptual variations. Many implementations and libraries focus on the most common method, known as Lloyd’s algorithm (Naive K-means). This algorithm follows an iterative approach to find a suboptimal solution and is convenient for an exact, predetermined number of groups (e.g., to maintain a minimum number of gateways—it is a constraint—a business need) and is more suitable for a small number of clusters [39].
Unlike other clustering methods (e.g., DBSCAN), K-means is computationally efficient, especially for large datasets, because its time complexity is linear with respect to the number of data points. It effectively handles large-scale clustering tasks. Admittedly, DBSCAN determines the optimal number of clusters (although during the design of the network, the number of gateways may already be imposed in advance as an economic factor). However, the result is irregular structures, and the center of gravity of such subgraphs must be determined by additional methods.

4. New Proposals and Results

In the initial stage of this work, it was assumed that the specifics of the designed network consisting of metering nodes installed at AMI meters allowed for a static configuration of the radio parameters of these nodes. The nodes are pre-configured in such a way as to minimize potential collisions that may occur in the common transmission channel.

4.1. K-Means-Based Gateway Deployment

Messages from the individual nodes are sent several times a day and contain compressed AMI profiles and basic measurement values (e.g., voltage, current value of energy consumed, or cosine fi). Minimal downlink traffic is generated for real-time clock synchronization in order to schedule the timing of messages sent by each node (a process in the application server manages the scheduling process to avoid collisions). From the point of view of the efficiency of the designed network, it is important to select the location of the gateway and to establish the radio coverage of the individual nodes.
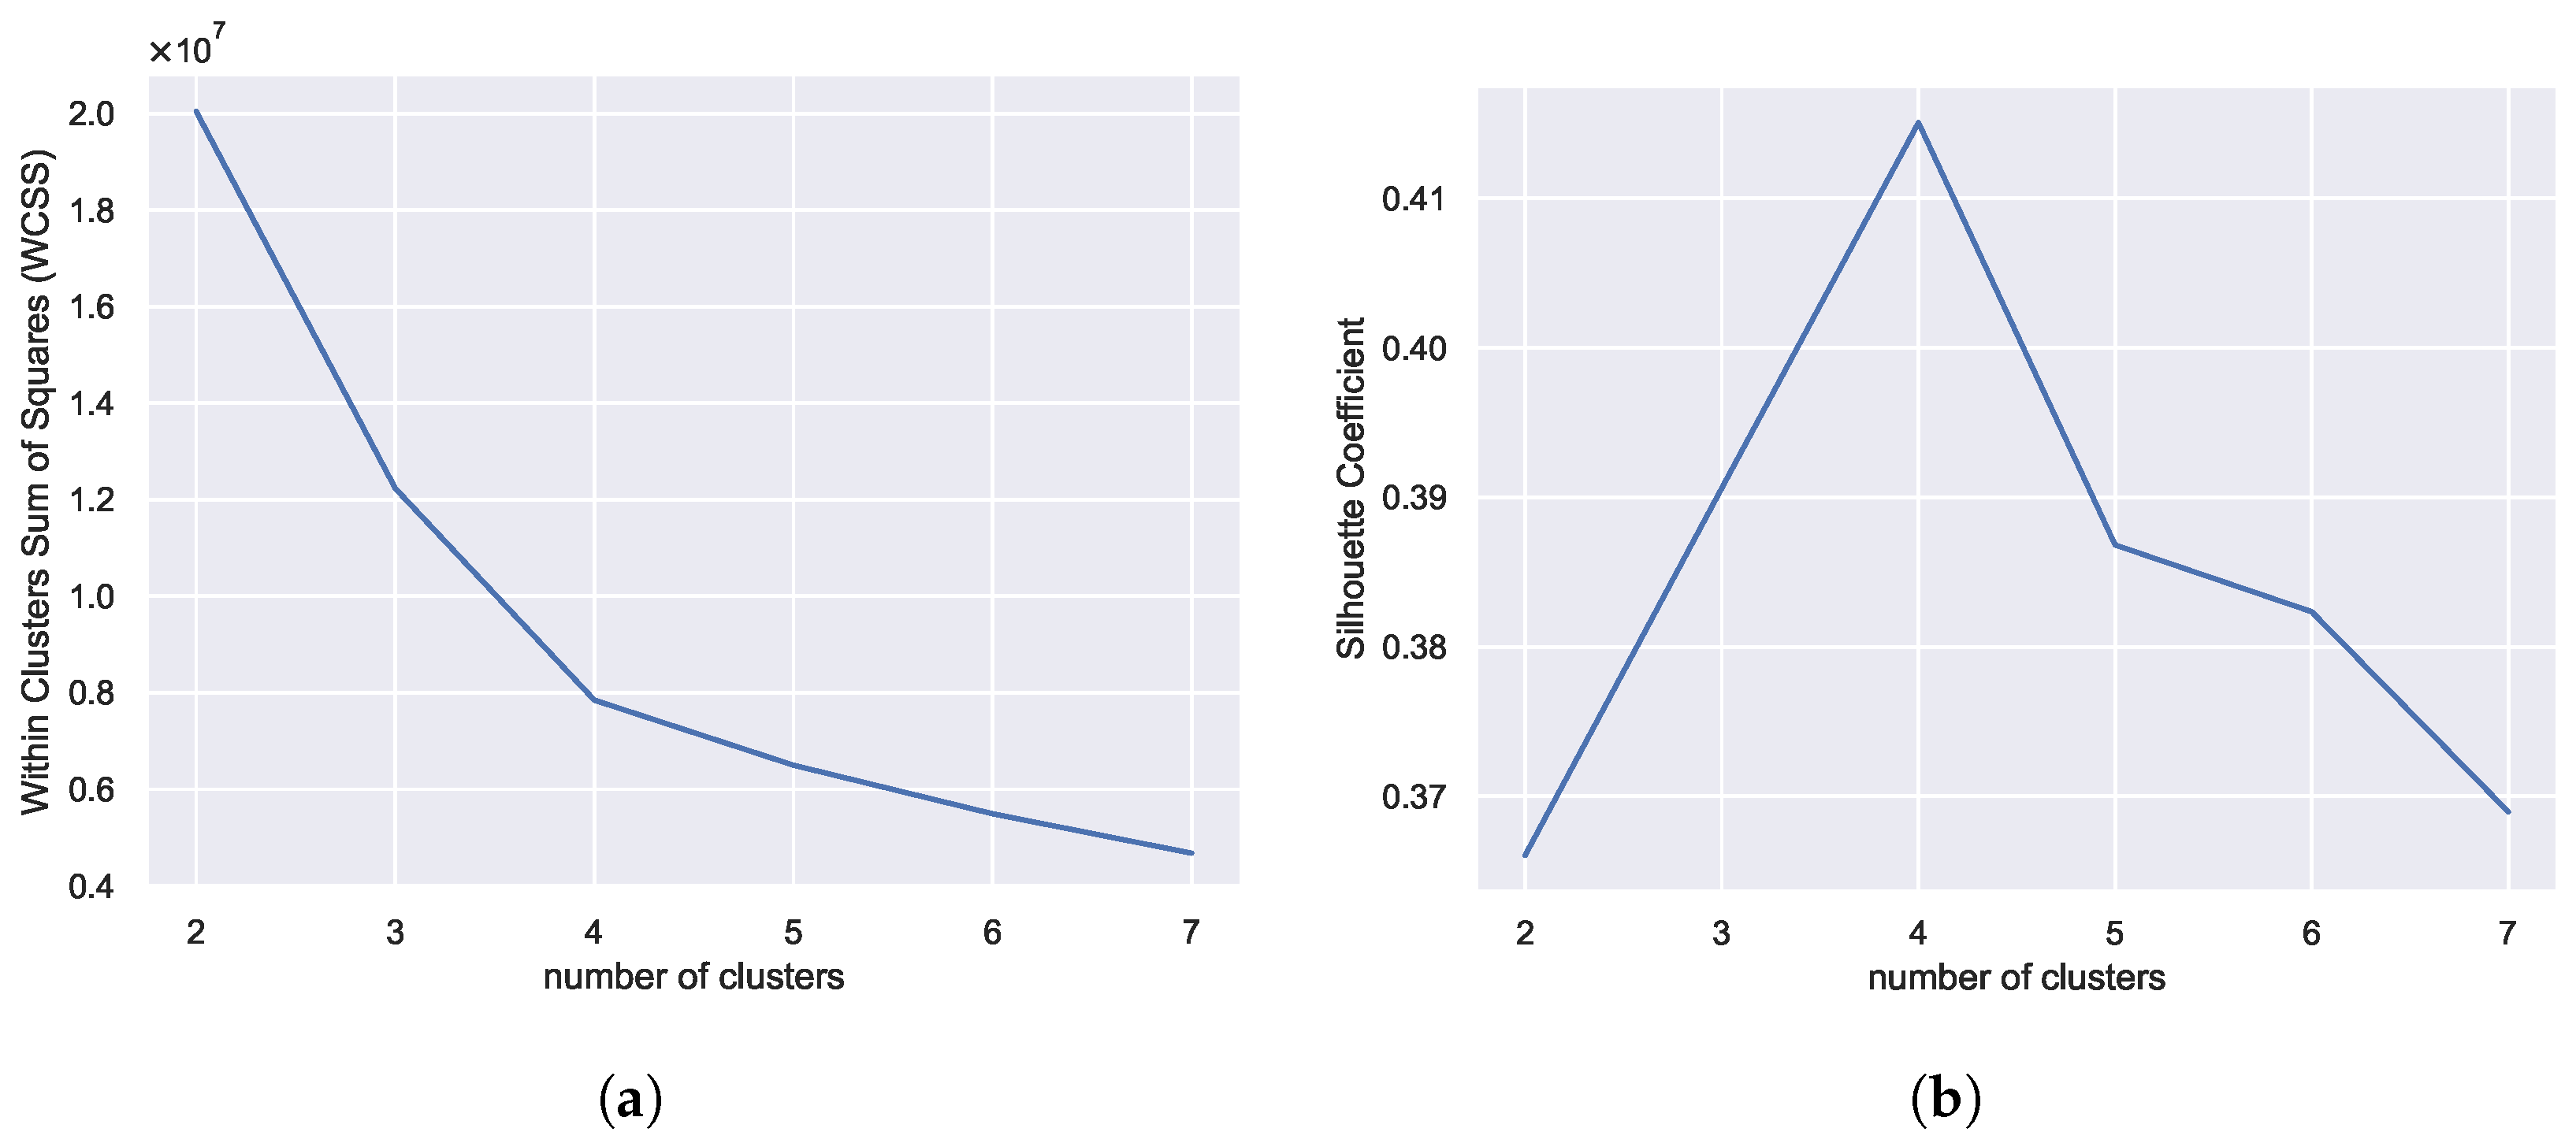
As mentioned in the previous section, the K-means algorithm will be used to cluster the points representing the end nodes of the LoRaWAN network and determine the optimal placement of gateways. To determine the value of the K parameter, two methods were used: elbow method, by determining WCSS and cluster quality, and silhouette coefficient. The so-called elbow method is based on the principle that as the number of clusters increases, the WCSS coefficient, which is the sum of the squares of the Euclidean distances from each node to the centroid, decreases. The silhouette coefficient, on the other hand, measures how well nodes are assigned to their own cluster, yet how far they are from other clusters. This parameter close to 1 means that the data points are in the right cluster, while a silhouette coefficient close to −1 means that the nodes are in the wrong cluster. In both cases, K = 4 was determined as the optimal number of gateways to ensure that each node belonged to the designated clusters (Figure 2).
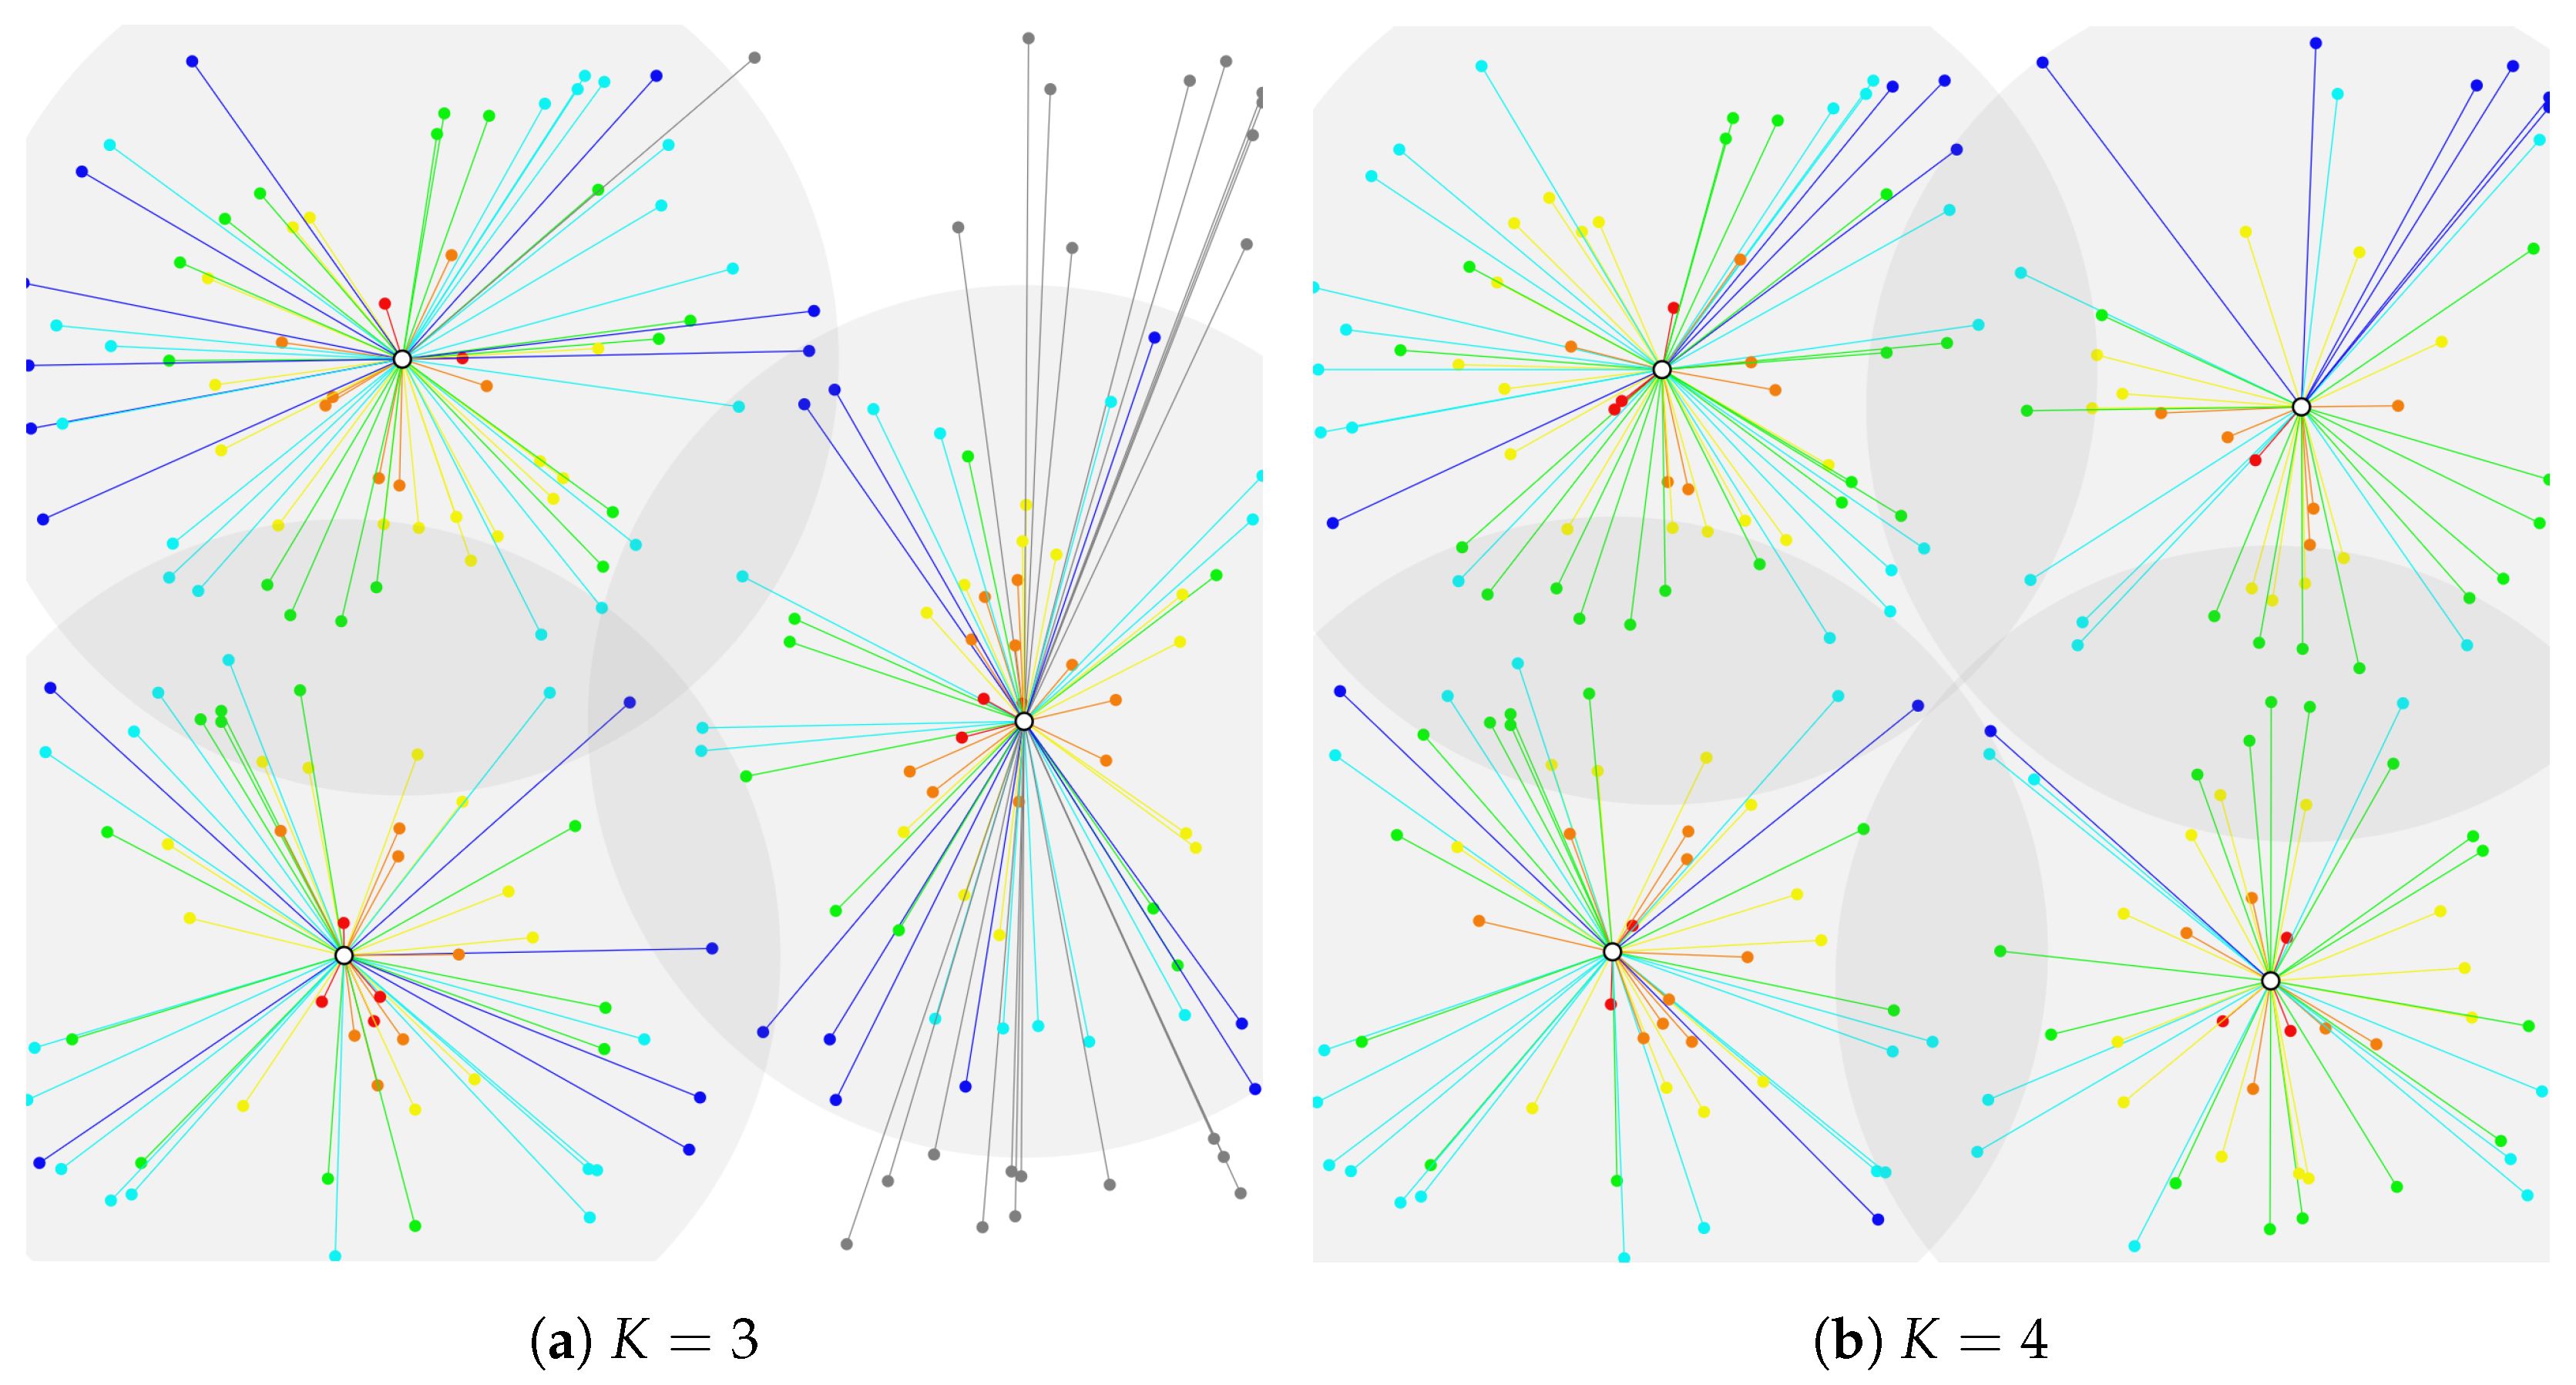
Figure 3 shows the application of the K-means algorithm for LoRaWAN end nodes randomly distributed over a 6 × 6 km square area. Some simplifications have been adopted in this model. All nodes have the same radio range and operate with S F = 7 . They were randomly distributed on the plane. The Euclidean distance was used to determine the distance between each node and the centroid, which was determined from geographical coordinates. The presentation of network coverage and visualization is taken from the TTN Mapper project [40]. The colour of the line and point reflects the value of the RSSI parameter (e.g., red for RSSI > −100 dBm and blue for RSSI < −120 dB). The hypothetical range of the gateway has been marked for the clarity of the figure (the ranges of the nodes would obscure the figure). Note that all nodes were assigned to individual clusters; no noise remained in the clustering process.
Despite the assignment of nodes to the cluster, the radio loss model used (COST-231 Hata) determines the ability to communicate with the gateway. Figure 3a shows grey-colored nodes whose transmit power is too low for the gateway to receive messages or for the gateway to send an uplink message in the first transmission window (RX1) [14]. If the number of clusters is increased to 4 in the same network, full radio coverage can be achieved (Figure 3b). Figure 2 shows two ways to determine the optimal number of clusters (elbow collapse and the maximum value of the form factor occurs for K = 4 ).

4.2. Spreading Factor Optimization

Paper [41] analyzed the impact of adding new clusters (resulting in new gateways) on the power efficiency of LoRaWANs. As the number of gateways increased, the distances shortened, leading to an increase in SNR, causing the ADR algorithm to recommend smaller values for the transmit power P t and S F factor. However,  [42] showed that the ADR technique has a long convergence time and is not able to adapt to changing link conditions, sometimes requiring several hours to several days to reach a reliable and energy-efficient communication state. Given the one-time approach in infrastructure planning and the additional energy consumption resulting from bidirectional communication in ADR, it seems important to plan the deployment of metering nodes and such settings to minimize both SF and the number of gateways. This approach presents the SFArrangement Algorithm 1.
Algorithm 1 SFArrangement
Parameters: n , K , S F , R S S I = f ( S F ) .
1:
Determine the deployment of end nodes by transforming the geographic coordinates to a Cartesian system.
2:
Determine the deployment of LoRaWAN gateways based on the K-means algorithm.
3:
Starting with S F = 7 , determine the received signal power at each end node according to the propagation model.
4:
Assign nodes for which R S S I < m a x ( R S S I S F 7 ) → with S F = 7 .
5:
If there are nodes in the cluster that do not meet the above condition, increase the SF to 8 and assign to nodes that meet the condition R S S I < m a x ( R S S I S F 8 ) → with S F = 8 .
6:
Increase SF sequentially until it reaches 12.
7:
Termination condition: all nodes have been assigned SF values or the step for S F = 12 has been performed.
The algorithm determines the so-called coverage ratio, defined as the ratio of the number of metering nodes in range of the gateway (whose range allows transmission to the gateway) to the number of all nodes in the metering network. Figure 4 shows visualizations of the network for different parameters and different stages of the algorithm obtaining the same coverage factor with nodes spread over a 10 × 10 km area. The circles indicate the maximum radio coverage for successive values of the spreading factor (SF = 7 11). The calculation of the maximum radio range is based on the sensitivity of the widely used Semtech SX1276 radio module for different 868 MHz bandwidths (Table 2) and the transformation of COST-231 Hata radio loss model used (Formula (2)) for different BW and SF parameters. The accuracy and desirability of the adopted radio loss model has been demonstrated in the literature, and field tests of node coverage confirm these results [43,44].
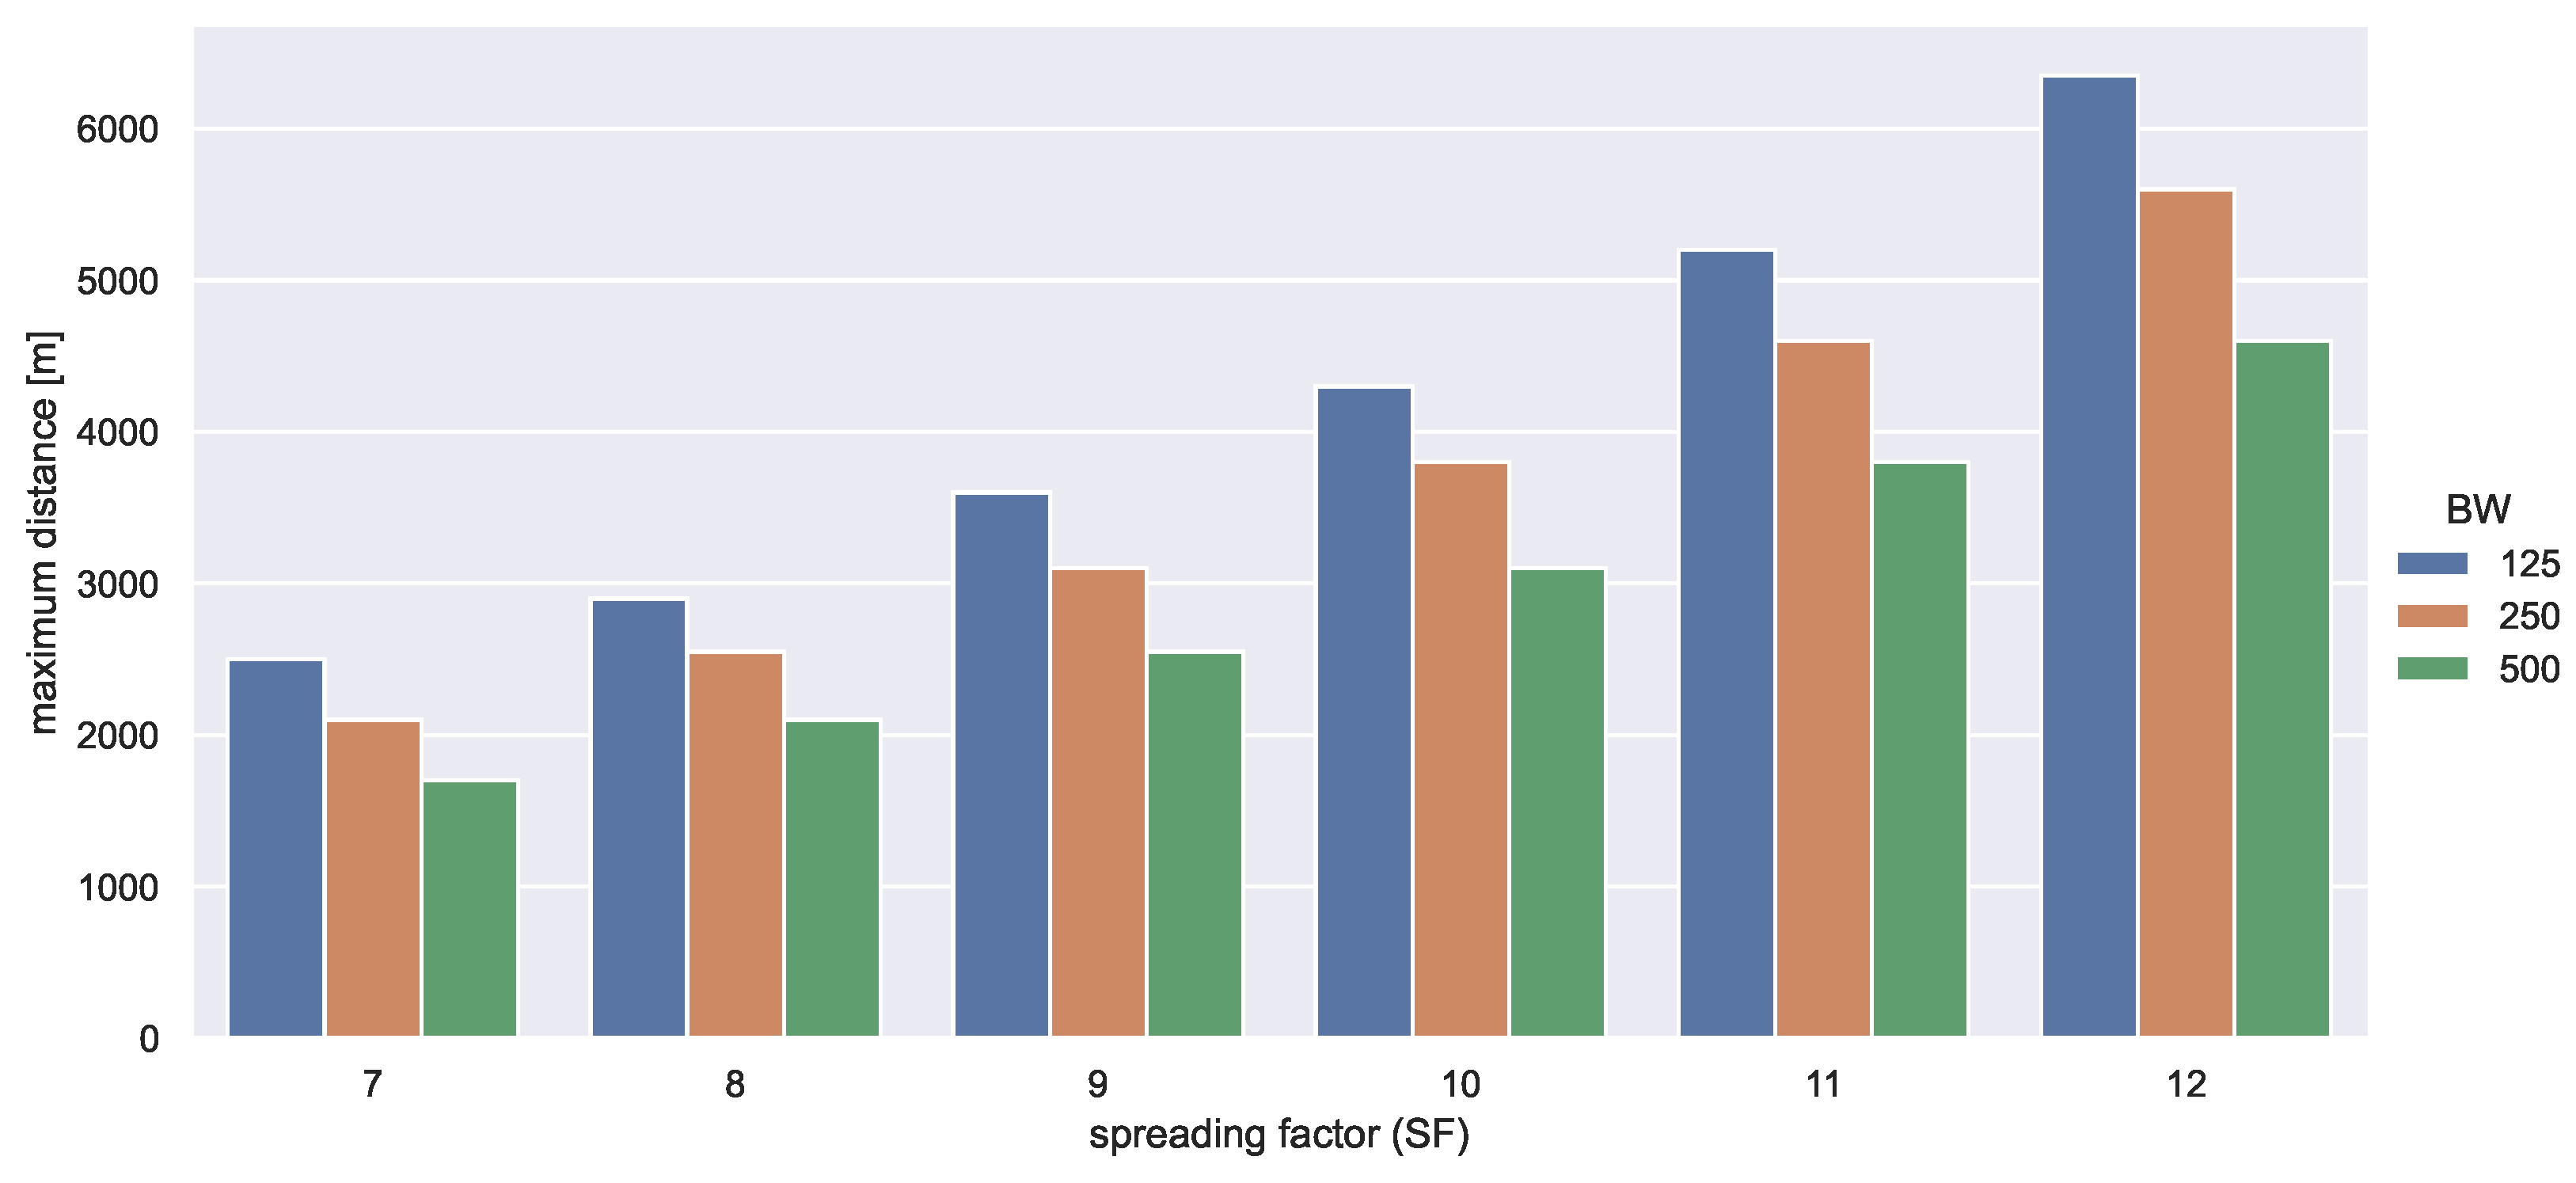
According to Figure 5, the maximum range is 2500 m for S F = 7 and 6350 m for S F = 12 (at B W = 125 kHz). It is worth noting that as the SF increases, the measurement nodes may remain in range of more gateways and reduce the transmission efficiency within these gateways due to a higher probability of collisions. By knowing the radio parameters of each node, it is possible to determine the transmission airtime based on the length of the messages sent and, as a result, the energy efficiency of the entire system [41].
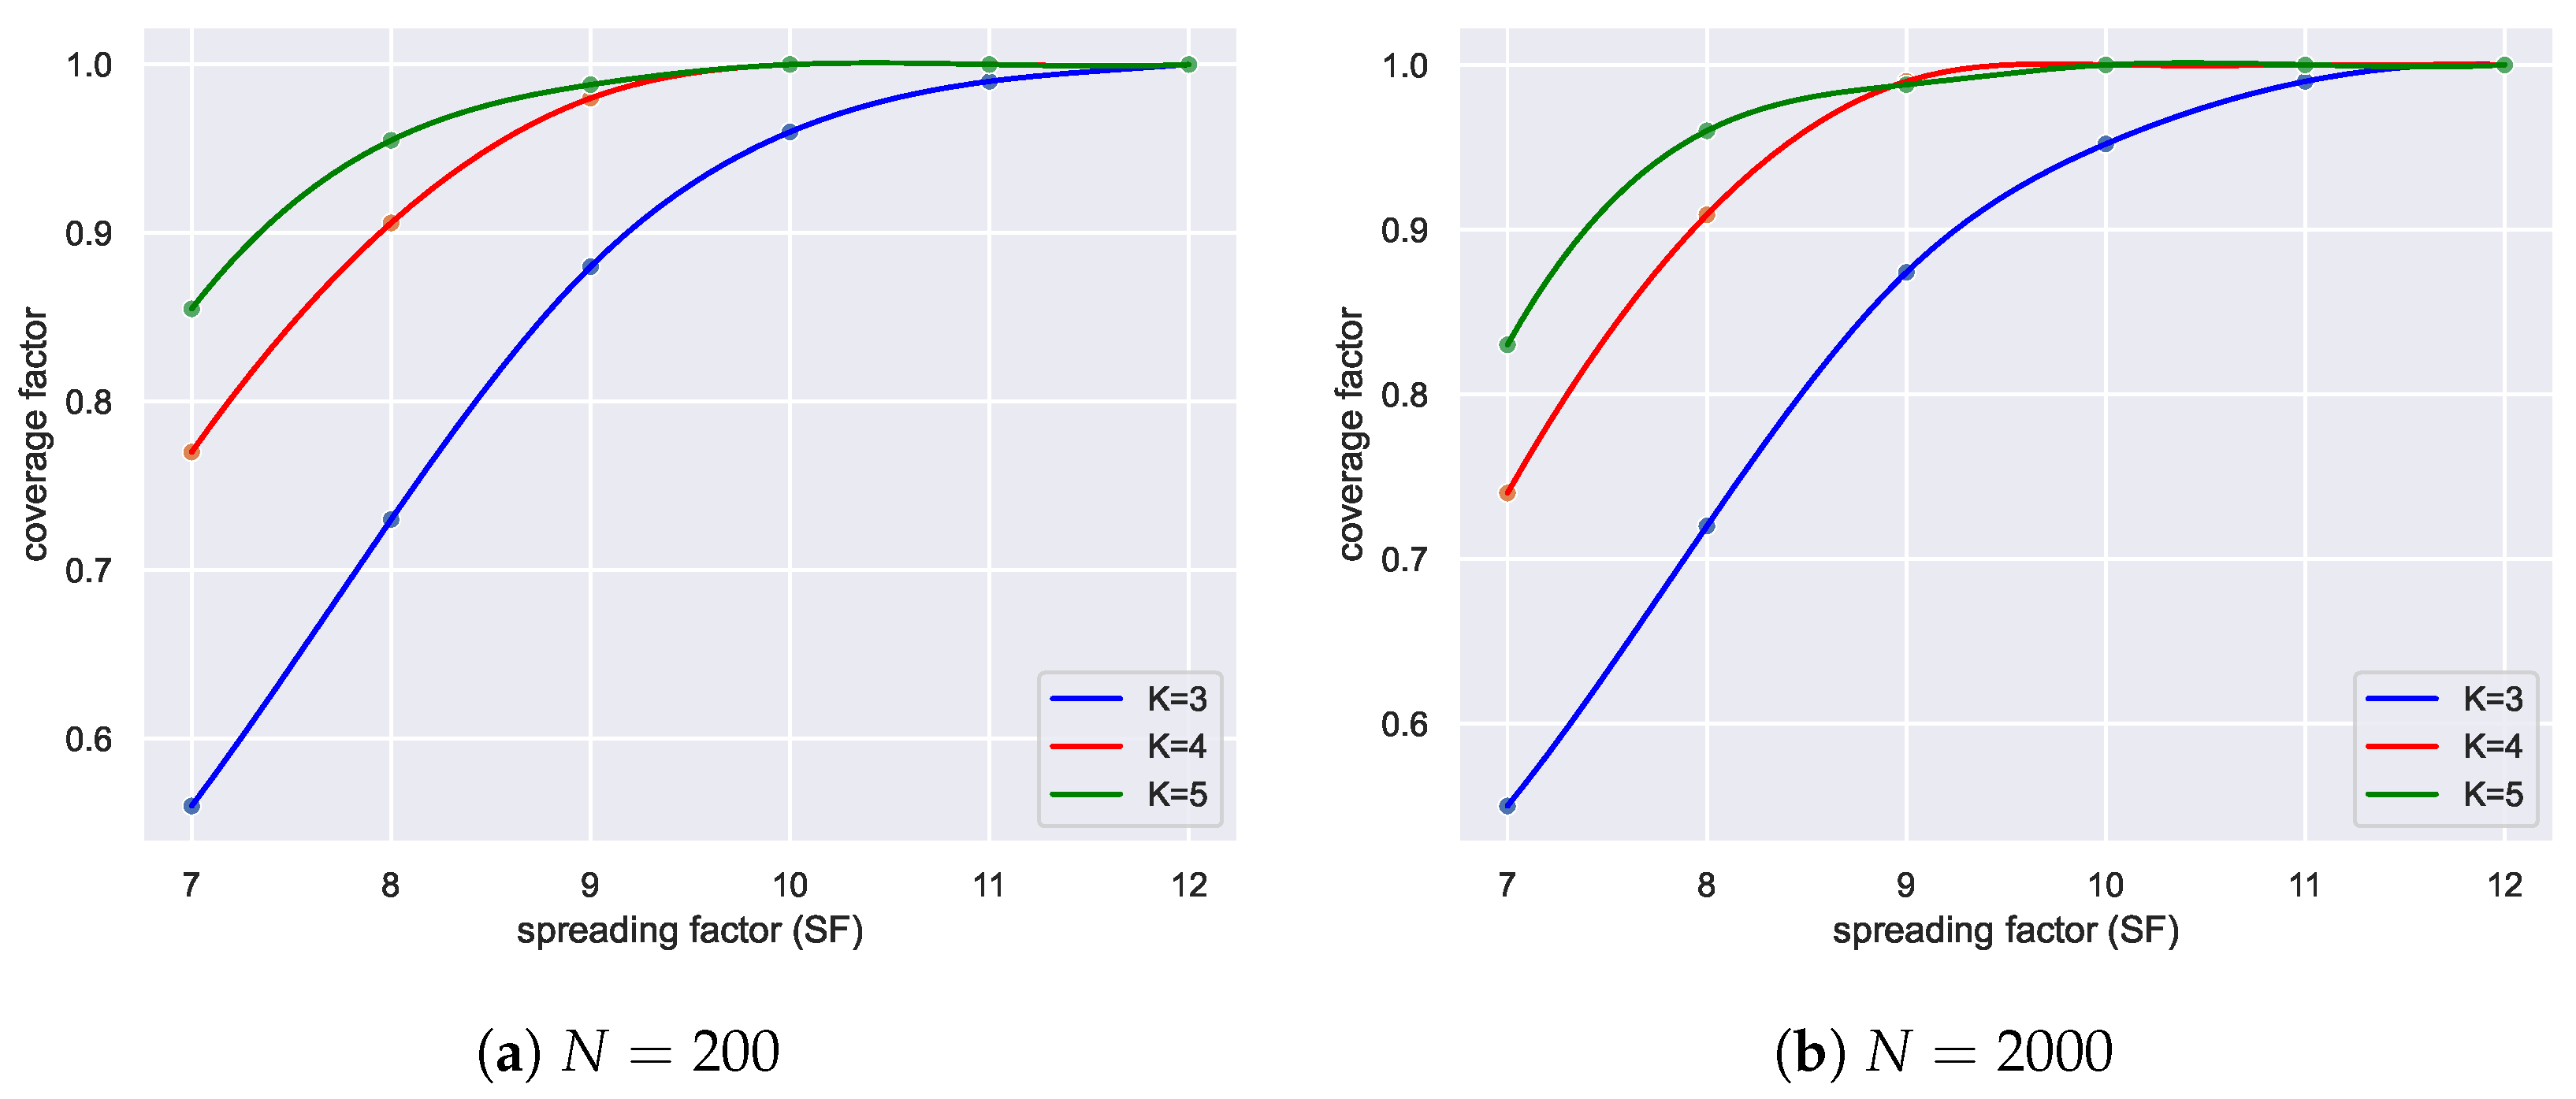
The results shown in Figure 6 show the dependence of the coverage ratio on both the SF and the number of gateways used. The study was conducted for a wide number of measurement nodes N (from 100 to 2000). A coverage factor was determined for a random distribution of nodes for 100 instances. The use of high SF values (11 and 12) only seems justified when the installation of new gateways is not possible (for K = 2 , 3 ). Then, however, the energy efficiency and the transmission restrictions imposed by The Things Networks recommendations (fair use policy) make the solution ineffective [45]. A coverage ratio of 1 can already be achieved at S F = 10 for K = 4 , 5 . Further increases in the number of gateways in a given area are not justified.

4.3. Node Deployment Based on Real Geospatial Data

The use of random network scenarios provides general observations and guidance for network planning. The use of these research results is crucial when planning infrastructure for specific realities. Then, infrastructure elements are located based on terrain maps and the distribution of nodes is described in recognized formats such as GeoJSON [46] or GTFS [47]. Using OpenStreetMap [48] data from Python is convenient thanks to an API called Overpass Turbo [49,50], which can be used to query geospatial data from OpenStreetMap. In general, all elements in the maps are expressed by a set of points, each of which has a single latitude and longitude. These points are called nodes and roads, where nodes are single points usually used to mark places such as individual shops. It is, therefore, possible to use OpenStreetMaps data to pre-plan the placement of LoRaWAN network metering nodes and associate them with the location of the energy meter.
Due to research related to the pilot construction of a wireless data network in the city of Bydgoszcz, the techniques presented in this article were tested in close connection with the aforementioned location. Bydgoszcz is a city located in northern Poland, situated on the Brda and Vistula rivers. It is the eighth-largest city in the country and the capital of the Kuyavian-Pomeranian Voivodeship. As of the latest available data, Bydgoszcz has a population of approximately 330,000 people. In terms of population density, Bydgoszcz is relatively densely populated, with an average density of around 1875 people per square kilometer. Similar studies have been carried out on the example of Paris [51] but these mainly focused on the reliability of the transmission itself, without taking into account how the gateways were deployed (these were distributed evenly, with LoRaWAN nodes clustered around them).
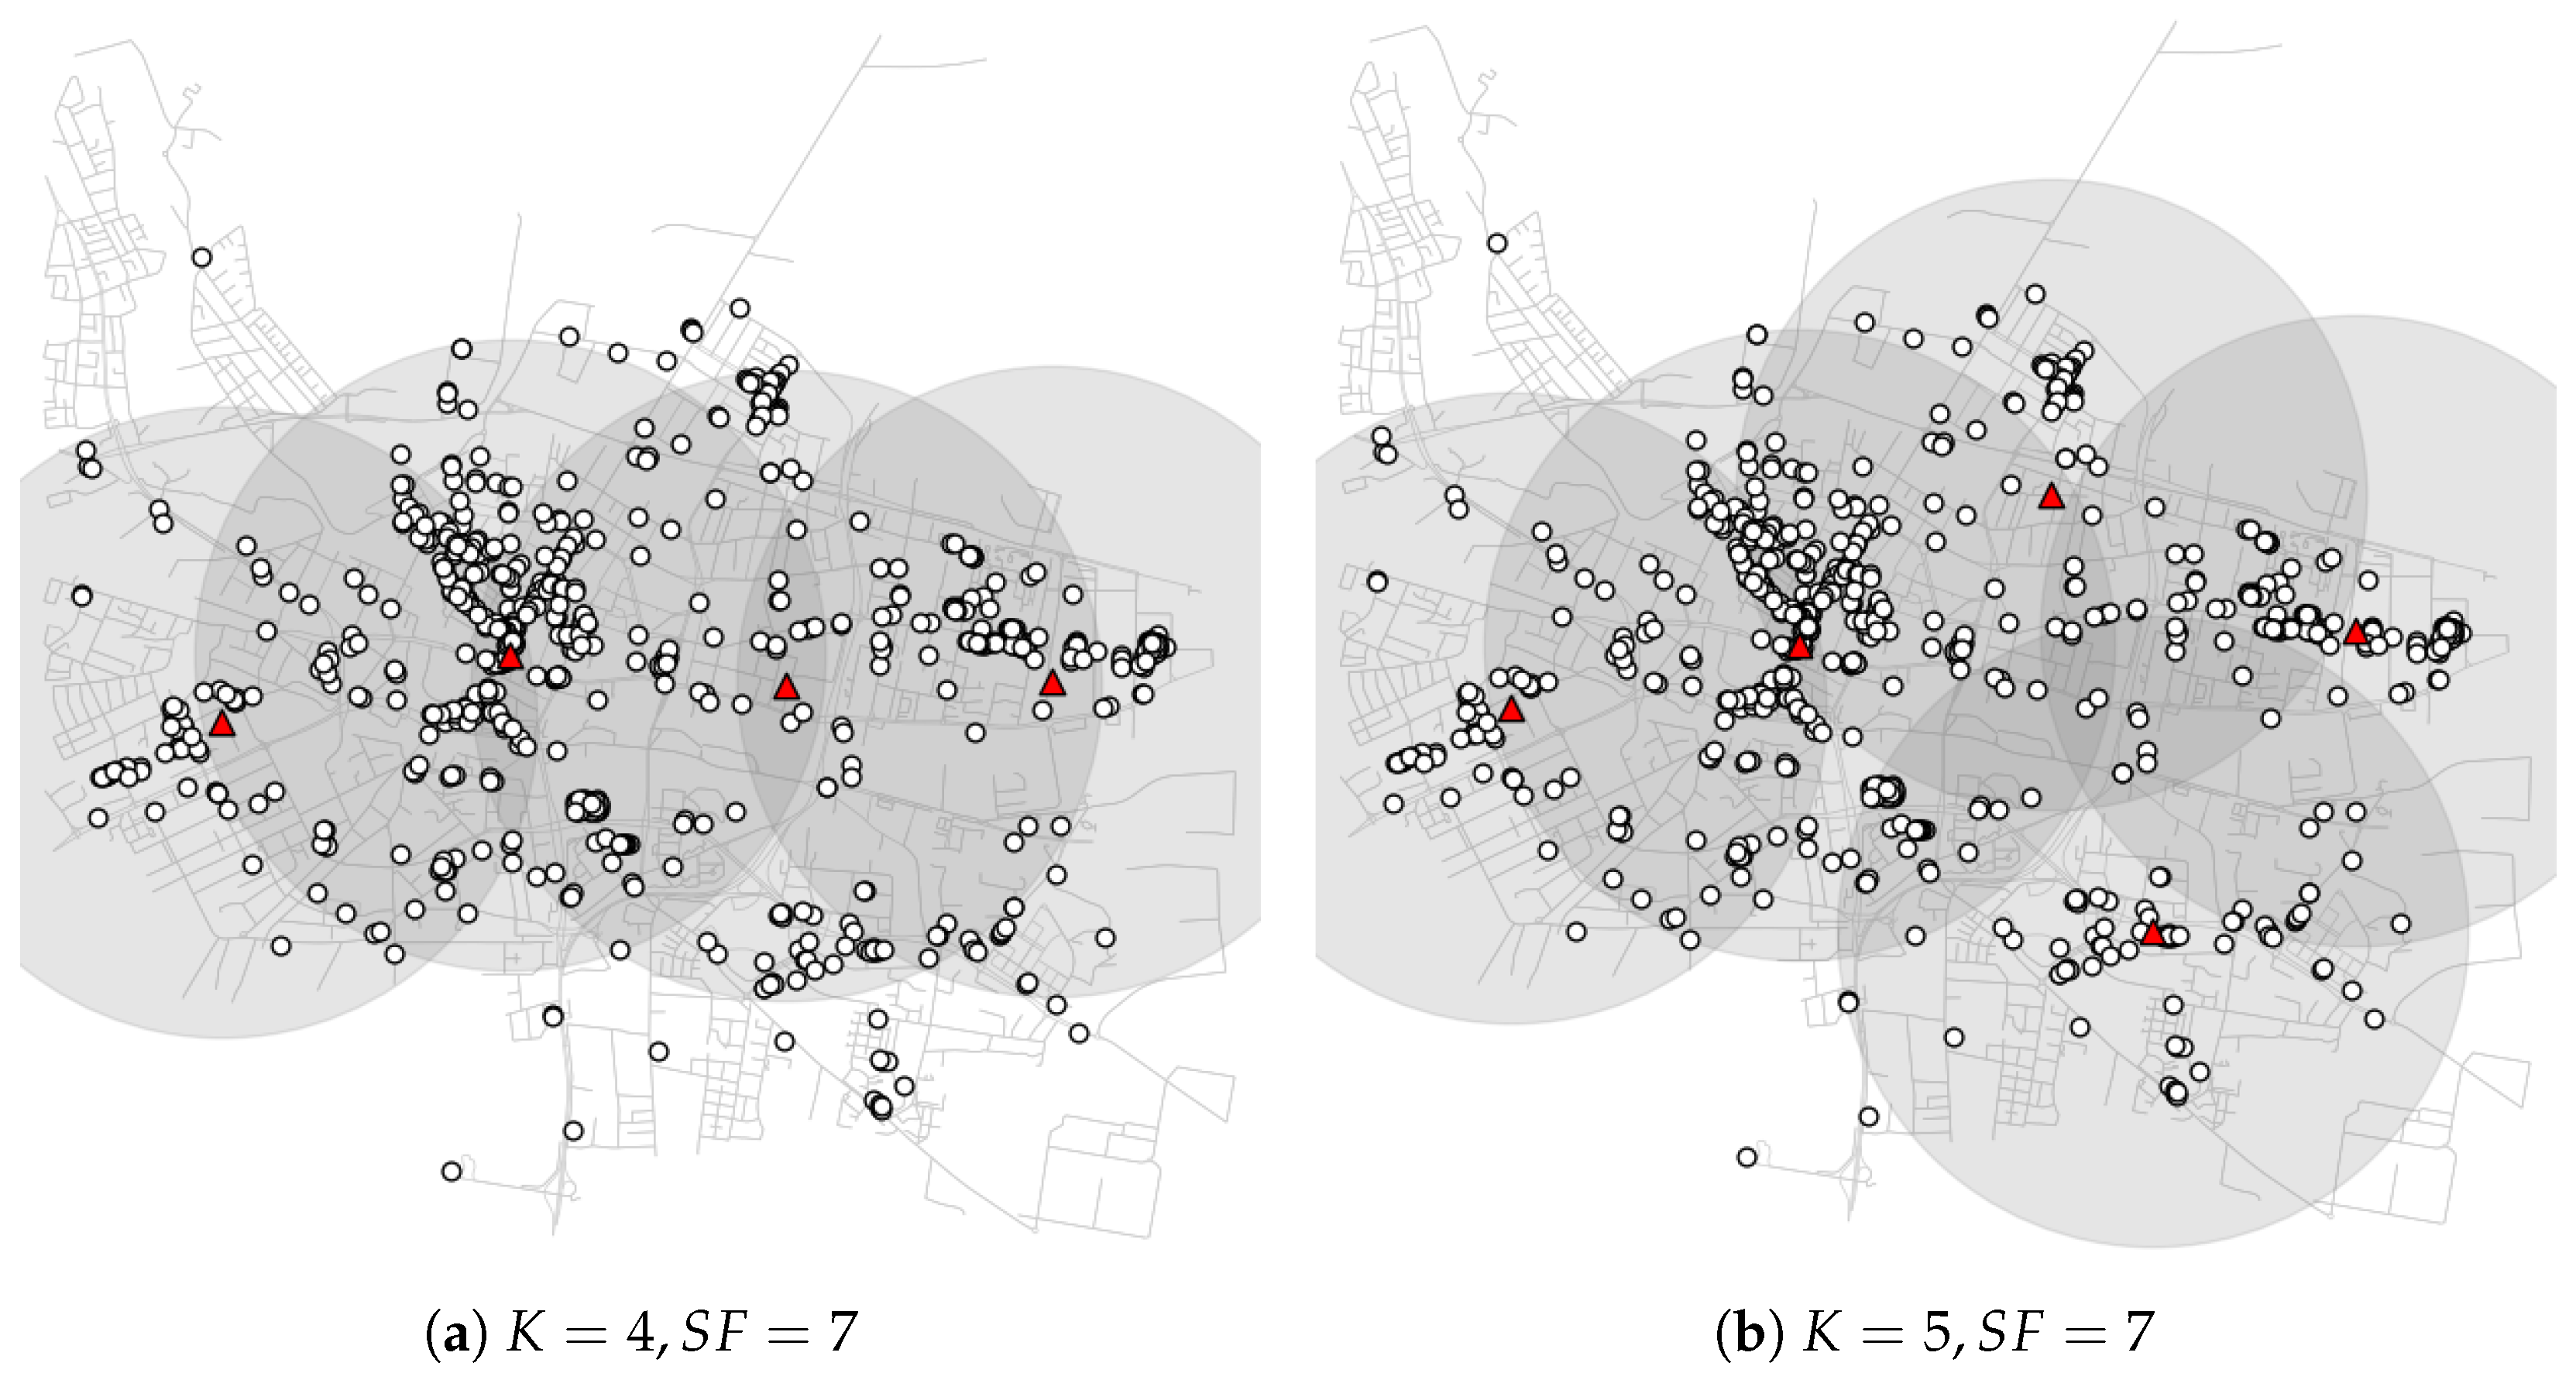
For this part of the research, the geographical coordinates of shops and retail outlets were downloaded (there are 741 sites in the OpenStreetMaps database). Geographical coordinates were then converted to Cartesian coordinates and the Euclidean metric was used in the application of the K-means algorithm. An area of the city of 10 × 10 km was established for the visualization (Figure 7). The white circles indicate the metering nodes and the red triangles indicate the LoRaWAN gateways. A coverage factor of 0.969 was obtained for 4 gateways (Figure 7a) and for 5 gateways—0.996 with SF = 7 (Figure 7b).

5. Conclusions

Algorithms to support gateway placement combined with radio coverage modeling in urban environments are challenges facing computer simulation environments. This paper presents a new algorithm to locate gateways collecting data from wireless IoT sensor networks. The research was conducted on the example of a 330,000-strong city in Poland. The proposed algorithm, according to the authors, enables efficient deployment of data collection gateways. The authors’ involvement in a research agenda focused on data transmission from electricity meters enables a comparison between the results of simulation tests and real-world metering networks employing LoRaWAN technology. As far as the authors are aware, this is the first study that employs machine-learning (ML) techniques to determine the location of data-collecting nodes in LoRaWAN networks.
The proposed solution is the first stage of building a simulation environment, which does not yet include traffic models that allow accurate simulation of uplink and downlink traffic. Assumptions have been made to avoid collisions and message overlap, but an accurate model will take these aspects into account. No less, the application created at this stage allows planning the deployment of network nodes for measurement. The implemented mechanisms for communication with geospatial databases will in the future be able to be applied to areas with varying degrees of urbanization with the possibility of using different path loss radio models.
It is noteworthy that the algorithm presented in the paper can have an impact on the careful design and implementation of networks to reduce energy consumption and radio bandwidth usage. Moreover, when the required coverage and continuous monitoring are provided, it will be possible to draw realistic conclusions and take action based on the data collected. Thus, this could become the next step toward the implementation of a smart city concept, whose functionality and capabilities will be optimized for the convenience and safety of residents.

Author Contributions

M.P., P.Z. and B.M.: conceptualization, validation, and writing—review and editing; M.P., B.M. and P.Z.: methodology; M.P.: simulations, data analysis, investigation, resources, software, visualization, and writing—original draft; P.Z.: project administration and supervision. All authors have read and agreed to the published version of the manuscript.

Funding

This work was supported in part by the grant to maintain research potential of Kazimierz Wielki University (Ministry of Education and Science, grant 2023).

Institutional Review Board Statement

No applicable.

Informed Consent Statement

No applicable.

Data Availability Statement

No applicable.

Conflicts of Interest

The authors declare no conflict of interest.

References

  1. Silva, B.N.; Khan, M.; Han, K. Towards sustainable smart cities: A review of trends, architectures, components, and open challenges in smart cities. Sustain. Cities Soc. 2018, 38, 697–713. [Google Scholar] [CrossRef]
  2. Dell’Isola, M.; Ficco, G.; Canale, L.; Palella, B.I.; Puglisi, G. An IoT integrated tool to enhance user awareness on energy consumption in residential buildings. Atmosphere 2019, 10, 743. [Google Scholar] [CrossRef] [Green Version]
  3. Abbas, S.; Khan, M.A.; Falcon-Morales, L.E.; Rehman, A.; Saeed, Y.; Zareei, M.; Zeb, A.; Mohamed, E.M. Modeling, simulation and optimization of power plant energy sustainability for IoT enabled smart cities empowered with deep extreme learning machine. IEEE Access 2020, 8, 39982–39997. [Google Scholar] [CrossRef]
  4. Mursid, S.; Santoso, H. Analysis of the Effectiveness of the Utilization of Power Monitoring Devices in Reducing Electric Energy Consumption. J. Phys. Conf. Ser. 2019, 1364, 012055. [Google Scholar] [CrossRef]
  5. Musznicki, B.; Piechowiak, M.; Zwierzykowski, P. Modeling Real-Life Urban Sensor Networks Based on Open Data. Sensors 2022, 22, 9264. [Google Scholar] [CrossRef] [PubMed]
  6. Shabbir, N.; Hassan, S.R. Routing Protocols for Wireless Sensor Networks (WSNs). In Wireless Sensor Networks; Sallis, P., Ed.; IntechOpen: Rijeka, Croatia, 2017; Chapter 2. [Google Scholar] [CrossRef]
  7. Mehmood, G.; Khan, M.Z.; Bashir, A.K.; Al-Otaibi, Y.D.; Khan, S. An Efficient QoS-Based Multi-Path Routing Scheme for Smart Healthcare Monitoring in Wireless Body Area Networks. Comput. Electr. Eng. 2023, 109, 108517. [Google Scholar] [CrossRef]
  8. Almuhaya, M.A.M.; Jabbar, W.A.; Sulaiman, N.; Abdulmalek, S. A Survey on LoRaWAN Technology: Recent Trends, Opportunities, Simulation Tools and Future Directions. Electronics 2022, 11, 164. [Google Scholar] [CrossRef]
  9. Leonardi, L.; Lo Bello, L.; Patti, G.; Pirri, A.; Pirri, M. Simulative Assessment of the Listen before Talk Adaptive Frequency Agility Medium Access Control Protocol for LoRaWAN Networks in IoT Scenarios. Appl. Syst. Innov. 2023, 6, 16. [Google Scholar] [CrossRef]
  10. Peruzzi, G.; Pozzebon, A. Combining LoRaWAN and NB-IoT for Edge-to-Cloud Low Power Connectivity Leveraging on Fog Computing. Appl. Sci. 2022, 12, 1497. [Google Scholar] [CrossRef]
  11. Leonardi, L.; Lo Bello, L.; Patti, G.; Pirri, A.; Pirri, M. Combined Use of LoRaWAN Medium Access Control Protocols for IoT Applications. Appl. Sci. 2023, 13, 2341. [Google Scholar] [CrossRef]
  12. Noreen, U.; Bounceur, A.; Clavier, L. A study of LoRa low power and wide area network technology. In Proceedings of the 2017 International Conference on Advanced Technologies for Signal and Image Processing (ATSIP), Fez, Morocco, 22–24 May 2017; pp. 1–6. [Google Scholar] [CrossRef]
  13. Saban, M.; Aghzout, O.; Medus, L.D.; Rosado, A. Experimental Analysis of IoT Networks Based on LoRa/LoRaWAN under Indoor and Outdoor Environments: Performance and Limitations. IFAC-PapersOnLine 2021, 54, 159–164. [Google Scholar] [CrossRef]
  14. Semtech—LoRa Developer Portal. Available online: https://lora-developers.semtech.com/documentation/tech-papers-and-guides/lora-and-lorawan/ (accessed on 10 June 2023).
  15. Muhammad, W.; Zhang, W.; Raza, M.T.; Imran, M.A. Narrowband Internet of Things: A Survey. IEEE Internet Things J. 2019, 6, 2243–2274. [Google Scholar]
  16. Paredes-Parra, J.M.; Jiménez-Segura, R.; Campos-Peñalver, D.; Mateo-Aroca, A.; Ramallo-González, A.P.; Molina-García, A. Democratization of PV Micro-Generation System Monitoring Based on Narrowband-IoT. Sensors 2022, 22, 4966. [Google Scholar] [CrossRef] [PubMed]
  17. Parrino, S.; Peruzzi, G.; Pozzebon, A. LoPATraN: Low Power Asset Tracking by Means of Narrow Band IoT (NB-IoT) Technology. Sensors 2021, 21, 3772. [Google Scholar] [CrossRef] [PubMed]
  18. Daraghmi, Y.A.; Daraghmi, E.Y.; Daraghma, R.; Fouchal, H.; Ayaida, M. Edge–Fog–Cloud Computing Hierarchy for Improving Performance and Security of NB-IoT-Based Health Monitoring Systems. Sensors 2022, 22, 8646. [Google Scholar] [CrossRef]
  19. Zheng, Y.; Wu, Y.; Gao, J.; Cui, S. NB-IoT based method for monitoring the tilt status of transmission towers. J. Phys. Conf. Ser. 2021, 2108, 012033. [Google Scholar] [CrossRef]
  20. Sinha, R.S.; Wei, Y.; Hwang, S.H. A survey on LPWA technology: LoRa and NB-IoT. ICT Express 2017, 3, 14–21. [Google Scholar] [CrossRef]
  21. Nimaje, D.S.; Ragam, P. Performance evaluation of LoRa LPWAN technology for IoT-based blast-induced ground vibration system. J. Meas. Eng. 2019, 7, 119–133. [Google Scholar] [CrossRef] [Green Version]
  22. MISOT Group: Polish Internet of Things. Available online: https://misot.pl/mdi/ (accessed on 30 May 2023).
  23. Bor, M.C.; Roedig, U.; Voigt, T.; Alonso, J.M. Do LoRa Low-Power Wide-Area Networks Scale? In Proceedings of the Proceedings of the 19th ACM International Conference on Modeling, Analysis and Simulation of Wireless and Mobile Systems, New York, NY, USA, 13–16 November 2016; MSWiM’16, pp. 59–67. [Google Scholar] [CrossRef] [Green Version]
  24. Pop, A.I.; Raza, U.; Kulkarni, P.; Sooriyabandara, M. Does Bidirectional Traffic Do More Harm Than Good in LoRaWAN Based LPWA Networks? In Proceedings of the GLOBECOM 2017—2017 IEEE Global Communications Conference, Singapore, 4–8 December 2017; pp. 1–6. [Google Scholar] [CrossRef] [Green Version]
  25. Wixted, A.J.; Kinnaird, P.; Larijani, H.; Tait, A.; Ahmadinia, A.; Strachan, N. Evaluation of LoRa and LoRaWAN for wireless sensor networks. In Proceedings of the 2016 IEEE SENSORS, Orlando, FL, USA, 30 October–3 November 2016; pp. 1–3. [Google Scholar] [CrossRef]
  26. Houssein, E.H.; Saad, M.R.; Hussain, K.; Zhu, W.; Shaban, H.; Hassaballah, M. Optimal Sink Node Placement in Large Scale Wireless Sensor Networks Based on Harris’ Hawk Optimization Algorithm. IEEE Access 2020, 8, 19381–19397. [Google Scholar] [CrossRef]
  27. LoRa Alliance. Available online: https://lora-alliance.org/ (accessed on 20 May 2023).
  28. LoRaWAN Specification v1.1. Available online: https://lora-alliance.org/resource_hub/lorawan-specification-v1-1/ (accessed on 20 May 2023).
  29. Agrawal, D.; Zeng, Q. Introduction to Wireless and Mobile System, 4th ed.; CL Engineering: Flushing, NY, USA, 2016. [Google Scholar]
  30. de Castro Tomé, M.; Nardelli, P.H.J.; Alves, H. Long-Range Low-Power Wireless Networks and Sampling Strategies in Electricity Metering. IEEE Trans. Ind. Electron. 2019, 66, 1629–1637. [Google Scholar] [CrossRef] [Green Version]
  31. Mahmood, A.; Sisinni, E.; Guntupalli, L.; Rondon, R.; Hassan, S.; Gidlund, M. Scalability Analysis of a LoRa Network Under Imperfect Orthogonality. IEEE Trans. Ind. Inform. 2018, 15, 1425–1436. [Google Scholar] [CrossRef] [Green Version]
  32. Vangelista, L. Frequency Shift Chirp Modulation: The LoRa Modulation. IEEE Signal Process. Lett. 2017, 24, 1818–1821. [Google Scholar] [CrossRef]
  33. COST: European Cooperation in Science & Technology. Available online: https://cost.eu (accessed on 15 May 2023).
  34. COST Action 231 Final Report. Available online: http://www.lx.it.pt/cost231/final_report.htm (accessed on 15 May 2023).
  35. Dobrilović, D.; Malić, M.; Malić, D.; Sladojevic, S. Analyses and optimization of Lee propagation model for LoRa 868 MHz network deployments in urban areas. J. Eng. Manag. 2017, 7, 55–62. [Google Scholar] [CrossRef] [Green Version]
  36. Harinda, E.; Hosseinzadeh, S.; Larijani, H.; Gibson, R. Comparative Performance Analysis of Empirical Propagation Models for LoRaWAN 868MHz in an Urban Scenario. In Proceedings of the 2019 IEEE 5th World Forum on Internet of Things (WF-IoT), Limerick, Ireland, 15–18 April 2019; pp. 154–159. [Google Scholar] [CrossRef] [Green Version]
  37. Andruloniw, P.; Kowalik, K.; Zwierzykowski, P. Unsupervised Learning Data-Driven Continuous QoE Assessment in Adaptive Streaming-Based Television System. Appl. Sci. 2022, 12, 8288. [Google Scholar] [CrossRef]
  38. Scikit-Learn Clustering Documentation. Available online: https://scikit-learn.org/stable/modules/clustering.html#clustering (accessed on 30 April 2023).
  39. Di Pietro, M. Clustering Geospatial Data Plot Machine Learning & Deep Learning Clustering with Interactive Maps. Available online: https://towardsdatascience.com/clustering-geospatial-data-f0584f0b04ec (accessed on 11 June 2023).
  40. TTN Mapper. Available online: https://ttnmapper.org (accessed on 5 May 2023).
  41. Correia, F.P.; Silva, S.R.d.; Carvalho, F.B.S.d.; Alencar, M.S.d.; Assis, K.D.R.; Bacurau, R.M. LoRaWAN Gateway Placement in Smart Agriculture: An Analysis of Clustering Algorithms and Performance Metrics. Energies 2023, 16, 2356. [Google Scholar] [CrossRef]
  42. Li, S.; Raza, U.; Khan, A. How Agile is the Adaptive Data Rate Mechanism of LoRaWAN? In Proceedings of the 2018 IEEE Global Communications Conference (GLOBECOM), Abu Dhabi, United Arab Emirates, 9–13 December 2018. [Google Scholar] [CrossRef] [Green Version]
  43. Lepicka, K.; Dzieza, M. RESEARCH on Transmission Quality and Coverage of LoRaWAN Networks in environments with Varying Degrees of Urbanisation. Bachelor’s Thesis, Kazimierz Wielki University, Bydgoszcz, Poland, 2022. [Google Scholar]
  44. Villarim, M.; Holanda de Luna, J.; Medeiros, D.; Pereira, R.; Souza, C.; Baiocchi, O.; Martins, F. An Evaluation of LoRa Communication Range in Urban and Forest Areas: A Case Study in Brazil and Portugal. In Proceedings of the 2019 IEEE 10th Annual Information Technology, Electronics and Mobile Communication Conference (IEMCON), Vancouver, BC, Canada, 17–19 October 2019; pp. 0827–0832. [Google Scholar] [CrossRef]
  45. The Things Network: Fair Use Policy Explained. Available online: https://www.thethingsnetwork.org/forum/t/fair-use-policy-explained/1300 (accessed on 15 May 2023).
  46. Butler, H.; Daly, M.; Doyle, A.; Gillies, S.; Schaub, T.; Hagen, S. The GeoJSON Format. RFC 7946. 2016. Available online: https://datatracker.ietf.org/doc/html/rfc7946 (accessed on 1 June 2023).
  47. GTFS Realtime Overview. Available online: https://developers.google.com/transit/gtfs-realtime (accessed on 1 June 2023).
  48. OpenStreetMap. Available online: https://www.openstreetmap.org/copyright (accessed on 1 June 2023).
  49. Overpass API. Available online: http://overpass-api.de/ (accessed on 1 June 2023).
  50. Wiza, M. How to Count the Number of Buildings in an Area by Category Using OpenStreetMap API? Available online: https://mateuszwiza.medium.com/how-to-count-the-number-of-buildings-in-an-area-by-category-using-openstreetmap-api-7163d77289e9 (accessed on 15 May 2023).
  51. Varsier, N.; Schwoerer, J. Capacity limits of LoRaWAN technology for smart metering applications. In Proceedings of the 2017 IEEE International Conference on Communications (ICC), Paris, France, 21–25 May 2017; pp. 1–6. [Google Scholar] [CrossRef]
Figure 1. LoRaWAN system architecture [14].
Applsci 13 08431 g001
Figure 2. Determination of the optimal number of clusters using the elbow method (a) and silhouette coefficient (b).
Applsci 13 08431 g002
Figure 3. An example of a network topology using the K-means algorithm to determine LoRaWAN gateway locations.
Applsci 13 08431 g003
Figure 4. Two cases of network topology that for different parameters give the same coverage factor of approximately 0.755.
Applsci 13 08431 g004
Figure 5. Maximum radio range values determined for the SX1276 module using COST-231 Hata.
Applsci 13 08431 g005
Figure 6. Dependence of the coverage factor on the spreading factor (SF) for different numbers of LoRaWAN gateways.
Applsci 13 08431 g006
Figure 7. Locations of shops and retail outlets as metered electricity consumption sites, together with the location of LoRaWAN gateways determined using the K-means algorithm (Bydgoszcz, Poland).
Applsci 13 08431 g007
Table 1. Interference thresholds for different SF (SINR) [dBm].
SF ref SF7SF8SF9SF10SF11SF12
76−16−18−19−19−20
8−246−20−22−22−22
9−27−276−23−25−25
10−30−30−306−26−28
11−33−33−33−336−29
12−36−36−36−36−366
Table 2. Semtech SX1276 sensitivity of LoRa receiver (dBm).
BW [kHz]SF7SF8SF9SF10SF11SF12
125−126−129−132−135−138−141
250−124−127−130−133−136−139
500−121−124−127−130−133−136
Disclaimer/Publisher’s Note: The statements, opinions and data contained in all publications are solely those of the individual author(s) and contributor(s) and not of MDPI and/or the editor(s). MDPI and/or the editor(s) disclaim responsibility for any injury to people or property resulting from any ideas, methods, instructions or products referred to in the content.