Abstract
Wind and photovoltaic (PV) power forecasting are crucial for improving the operational efficiency of power systems and building smart power systems. However, the uncertainty and instability of factors affecting renewable power generation pose challenges to power system operations. To address this, this paper proposes a digital twin-based method for predicting wind and PV power. By utilizing digital twin technology, this approach provides a highly realistic simulation environment that enables accurate monitoring, optimal control, and decision support for power system operations. Furthermore, a digital twin platform for the AI (Artificial Intelligence) Grid is established, allowing real-time monitoring, and ensuring the safe, reliable, and stable operation of the grid. Additionally, a deep learning-based model WPNet is developed to predict wind and PV power at specific future time points. Four datasets are constructed based on weather conditions and historical wind and PV power data from the Flanders and Wallonia regions. The prediction models presented in this paper demonstrate excellent performance on these datasets, achieving mean square error (MSE) values of 0.001399, 0.001833, 0.000704, and 0.002708; mean absolute error (MAE) values of 0.025164, 0.027854, 0.018592, and 0.033501; and root mean square error (RMSE) values of 0.037409, 0.042808, 0.026541, and 0.052042, respectively.
1. Introduction
As a result of the consumption of non-renewable energy and the quest for energy independence and low-carbon development, the primary focus of energy sources in the 21st century is progressively shifting towards sustainable energy. Sustainable energy encompasses renewable energy, nuclear energy, and natural gas, all of which can be utilized continuously and efficiently over an extended period without causing harm to the environment. In comparison to natural gas and nuclear energy, renewable energy offers greater security, lower long-term costs, and superior environmental performance. Consequently, renewable energy has emerged as the foremost direction for sustainable energy development.
With the increasing adoption of renewable energy and ongoing reforms in the power market, the implementation of AI (Artificial Intelligence) Grid technology has emerged as a prominent trend in power system development [1]. However, the inherent instability and uncertainty associated with renewable energy sources pose significant challenges to power load forecasting, resulting in operational inefficiencies and safety risks within the power system.
Digital twin technology has the capability to integrate historical load data, weather data, renewable energy data, and other parameters to establish prediction models in the field of renewable energy power load forecasting. These models are used to forecast the future power generation situation within a specific time range. Furthermore, digital twin technology utilizes simulation techniques to enable online monitoring and analysis of critical nodes in the power system, facilitating real-time optimization and control [2]. Specifically, in the domains of wind energy and photovoltaic (PV) power generation, digital twin technology can utilize weather data such as wind speed, wind direction, and temperature to construct collaborative power generation prediction models that incorporate multiple factors. The application of statistical models aims to improve the operational efficiency and reliability of the power system.
In the context of the AI Grid, digital twin technology plays a crucial role by seamlessly integrating physical systems with virtual models [3]. This integration creates a highly realistic simulation environment enabling accurate monitoring, optimal control, and decision support for power system operations. For example, in the field of power equipment operation and maintenance management, digital twin technology facilitates online monitoring and status diagnosis of equipment, enabling timely detection of faults and abnormalities, and providing appropriate solutions [4,5,6,7]. Additionally, digital twin technology enables comprehensive data analysis and modeling of the power system, empowering participants in the power market with more accurate and reliable decision support.
1.1. Literature Review
In recent years, there has been an increasing amount of research conducted by scholars on power forecasting models. Currently, these models can be broadly classified into three main categories. The first category comprises functional statistical models (FSM), followed by regression prediction models (RPM) as the second category, and deep learning (DL) prediction models based on big data as the third category.
The functional statistical model of power forecasting comprises various techniques such as the Kalman filter [8], regression analysis [9,10,11], and time series methods [12]. Takeda et al. (2016) [8] employed the ensemble Kalman filter (EnKF) technique and shrinkage/multiple regression methods to develop a power load modeling framework. This framework enabled the prediction and analysis of power load conditions. While the Kalman filter method for electricity forecasting can mitigate the impact of data noise on the forecasting results, it may not achieve optimal performance in nonlinear scenarios. Charytoniuk et al. (1998) [9] proposed a nonparametric regression-based forecasting method that can predict future load data using historical load data. Zivanovic (2001) [10] proposed a local polynomial regression-based load forecasting method that utilized a data mining algorithm with a robust location estimator (M-estimator) to preprocess historical load data and approximate the functional relationship between load and load influencing factors through Taylor expansions. Dudek (2016) [11] introduced a local linear regression model that simplified the load forecasting problem by using linear regression to model the relationship between individual variables (modes) in the current data neighborhood. Regression analysis methods are simple to implement and encompass multiple factors affecting the load, but they require complete and error-free historical data. Additionally, these methods do not account for factors such as temporal effects and lack autonomous learning capabilities. Clements et al. (2016) [12] proposed a multi-equation time series model based on least squares, which incorporated seasonal models with intra-day dependence to address the characteristics of the load in the posterior. This model effectively tackles the load forecasting problem with a limited amount of historical data, thereby enhancing efficiency. However, the time series model may be less sensitive to factors such as climate and environment.
Unlike functional statistical models, regression predictive models are often better equipped to handle nonlinear data. As research progresses, some scholars have proposed the utilization of regression learning models for power prediction. For example, Dong et al. [13] proposed a convolutional neural network (CNN) combined with the K-means algorithm [14] for electricity load forecasting. This approach solved the problem of electricity forecasting models not adapting to large datasets. However, it often led to the electricity forecasting results reaching local optimum rather than the global optimum.
Wang et al. [15] and Ren et al. [16] used particle swarm and simulated annealing particle swarm optimization algorithms, respectively, to optimize the SVM algorithm for power load forecasting. These approaches improved the convergence ability of the model and reduced computing time. However, such algorithms are not applicable to medium and large datasets.
In recent years, the use of deep learning algorithms based on big data has garnered significant attention from researchers in the field of time series forecasting. For instance, Muzaffar et al. [17] used LSTM networks for multivariate power load forecasting. They predicted power load values at future moments using power load data with exogenous variables such as historical temperature, humidity, and wind speed. Choi et al. [18] proposed a power load forecasting framework combining hybrid models of ResNet [19] and LSTM, which utilized ResNet to extract potential features of the data, and then used LSTM to predict the power load data. Meng et al. [20] proposed a hybrid model for wind power prediction based on a dual-attention mechanism and cross-optimization. The dual-attention mechanism enhanced the model’s sensitivity to important information, and cross-optimization improved the generalization capability of the model.
Zheng et al. [21] used the least absolute shrinkage and selection operator (Lasso) and partial correlation analysis to analyze the effects of temperature, humidity, rainfall, and wind speed on loads. They used the average temperature as an input variable to predict electrical loads for residential communities through the GRU model. Poczeta et al. [22] combined fuzzy cognitive maps and artificial neural networks to construct an energy usage power load forecasting model. Pombo et al. [23] integrated a PV performance model into a machine learning algorithm model to predict PV power using physical information features related to PV power generation. Moisés et al. [24] compared the performance of a PV production forecasting model with that of a deep learning approach by comparing the performance of a machine learning and deep learning approach in a PV production prediction application, the results showed that the deep learning approach is better in this application scenario. The literature review is shown in Table 1.

Table 1.
Literature review summary.
1.2. Research Gap, Contirbutions, and Objectives
The Kalman filtering method for power prediction can reduce the impact of data noise on the prediction results, but the method can not achieve the optimal prediction effect in non-linear scenarios. The regression analysis method is simple, easy to operate, and covers multiple factors affecting the load, but it requires complete historical data without large errors, and the method does not take into account factors such as the decreasing influence of time and lacks the ability to learn on its own. The time series model requires a small amount of historical data, which effectively improves the work efficiency, but the method is not sensitive to climate, environment, and other influencing factors.
The regression prediction model compared to the function statistical model accuracy and processing data speed has been improved, but there are still some problems. For example, [13] it is easy to fall into local optimal solutions [15,16] which are only applicable to small datasets.
Most of the existing deep learning algorithms are used for predicting power loads from non-renewable energy sources [17,18,20,22], while there is not enough research related to predicting renewable energy power based on weather data. Refs. [23,24] mainly considered the physical information factors related to PV power load prediction, which makes the prediction model only applicable to PV power prediction and the use of the model relatively limited.
To address the aforementioned issues, this paper introduces a digital twin power forecasting platform for AI Grids. This platform utilizes digital twin technology to create a highly realistic simulation environment while accurately forecasting wind and PV (PV) power loads. The objective is to achieve precise monitoring, optimal control, and decision support for power system operation states. The main elements of this work are outlined below:
(1) Construction of a digital twin visualization platform for AI Grids: this platform enables real-time monitoring of the grid’s status, ensuring safe, reliable, and stable grid operation.
(2) A wind energy and PV power load forecasting model called WPNet, based on deep learning, has been developed. This model is capable of predicting the power output of wind energy and PV power generation at specific future time points. It enhances the power forecasting accuracy from daily to hourly intervals, ensuring real-time performance in model predictions.
(3) A data set for wind energy and photovoltaic power loads is constructed by using real data, and the effectiveness of the lightweight model for power load forecasting proposed in this paper is verified. Through this platform, more accurate and reliable decision support can be provided for power market participants, and more efficient, intelligent, and reliable operation management of the power system can be realized.
1.3. Paper Structure
2. Materials and Methods
This study focuses on constructing power forecasting models for two renewable energy sources: wind and PV. To enhance the analysis and visualization process, digital twin technology is utilized to build 3D models and visualization interfaces. Figure 1 illustrates the overall implementation of this study, which consists of three main steps: dataset creation, power forecasting model construction, and the digital twin visualization module. Among them, Figure 1a indicates the creation of the dataset part: Elia Open Renewable Energy Generation Data [25] is used as the original data, and the wind and PV power dataset is constructed by integrating and cleaning the data; Figure 1b indicates the power prediction module: wind and PV power prediction models are established by using deep learning algorithms, and predicting the power data in a; Figure 1c represents the digital twin visualization module: establishing digital twin 3D models and a digital twin visualization platform, which can provide more accurate and reliable decision support for power market participants and realize more efficient, intelligent, and reliable operation and management of power systems. Each module of the method is described in detail in this section.
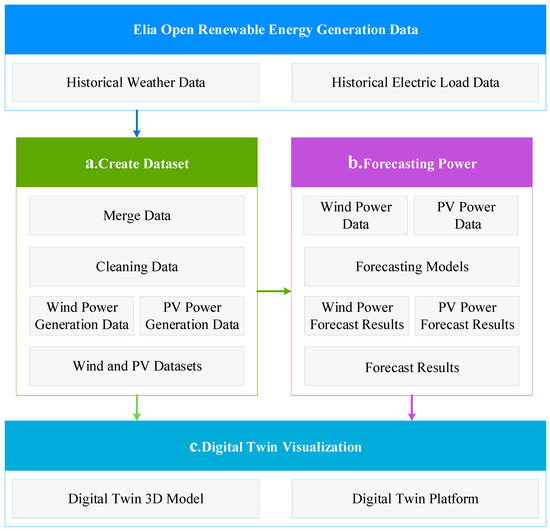
Figure 1.
Overall Architecture of Wind Energy and PV Power Forecasting.
2.1. Creating a Dataset
The raw data used in this study comprises PV power, wind power, generation impact factor, and weather conditions data. The PV generation, wind generation, and generation impact factor are sourced from the Elia Open Data Portal [25], while the weather conditions data is based on Brussels.
To ensure the relevance of the weather data, the renewable energy generation impact factor [25] is utilized as a criterion for filtering out irrelevant weather data. Among the weather variables, the following variables are retained in the dataset: T (temperature), Po (atmospheric pressure), P (precipitation), Pa (air pressure at sea level), U (relative humidity), DD (wind direction), Ff (mean wind speed), ff3 (maximum wind speed), N (cloud cover), H (average number of cloud layers), and TD (dew point temperature). For the specific meaning of each variable, see Table A1 in Appendix A.
Renewable energy generation power was selected from the historical generation data of Flanders and Walloon regions, respectively, with 28,460 and 28,419 historical records of wind power generation and 18,366 historical data of photovoltaic power generation each.
The above cleaned data were divided into four datasets: Flanders_PV, Wallonia_PV, Flanders_wind, and Wallonia_wind. Each data entry consists of 11 weather variables and a historical record of power generation, and the details of the datasets are shown in Table 2.
Table 2.
Data set details.
2.2. Wind Energy and PV Prediction Model
The model structure of the proposed WPNet model in this study is illustrated in Figure 2. The model comprises three main layers: a data processing layer, a GRU layer, and a Dense layer. The specific structure and algorithm of the model are as follows:
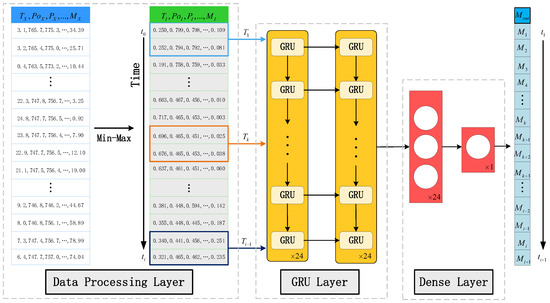
Figure 2.
Wind and PV power prediction model WPNet. Among them, Min-Max is the normalization process, t is the time series, T is the time step, and Mout is the prediction result.
We changed it to be italics to match with Equation (1). Please confirm and check full text carefully.
(1) Data processing layer: The input data is weather characteristic data and the corresponding renewable energy power generation X, and the Min-Max function is used to normalize the raw data X to generate I, and after data normalization, the features of different dimensions (T, Po, …, Td and M) have the same measurement scale, and the gradient decline rate have been improved. The calculation equation is shown below:
where Min and Max are the minimum and maximum values of the corresponding features, respectively, t represents a certain moment, ,,,…, are the data corresponding to 11 weather features, and is the amount of electricity generated by the corresponding renewable energy sources at this moment.
(2) GRU Layer: This layer consists of 24 GRU units in two layers, which can extract time series information and data feature information. Each GRU unit contains a reset gate and an update gate to control the flow and retention of information. The details of the algorithm of GRU units are shown below:
represents the sigmoid function, represents the element-by-element multiplication, and represent the weight matrix and bias vector, respectively, represents the input at the current moment, represents the hidden state at the previous moment, represents the candidate hidden state, represents the updated hidden state, represents the reset gate, which controls which information in the hidden state at the previous moment needs to be reset, represents the update gate, which controls the extent to which the previous state information is incorporated into the current state.
(3) Fully connected layers: Multiple fully connected layers (also called Dense layers) are used for feature fusion and output, and finally a linear activation function is used as the activation function of the output layer to output the predicted wind and PV power load values.
The model takes the time series of wind and PV load forecasts, along with the corresponding weather condition data at moment t, as inputs. These inputs are then processed by the model, which subsequently generates wind and PV generation forecasts for pre-t + 1 moments through multi-layer processing.
2.3. Digital Twin Visualization Module
This section introduces the process of building a digital twin visualization module for PV (PV) and wind power generation plants. The specific steps are illustrated in Figure 3. Firstly, relevant data is collected, and a complete three-dimensional digital twin model is established. Secondly, the power data is preprocessed to filter out weather data that impacts wind and PV power generation. Next, the power forecasting model WPNet is utilized to predict the power generation for future time intervals. Finally, a visualization platform is constructed to display the information from the database and the digital twin model. This platform provides data analysis and forecasting capabilities, assisting users in managing and optimizing the operation of the power generation plants.
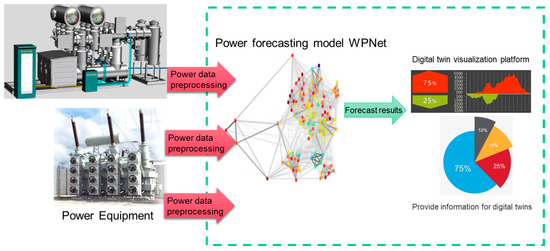
Figure 3.
Digital Twin Visualization Module. This module is supported by the power forecasting model and historical generation and weather data, which provide data support.
Here, we show a data update process as an example. First, the local server imports the results of the prediction model into the database, as depicted in Figure 4a, Second, the cloud server periodically retrieves data from the database for hot updates. The specific meanings of each parameter in the database can be found in Table A1 in Appendix A, as shown in Figure 4b. Once the latest data is retrieved, it is sent to the visualization platform where it is displayed, as demonstrated in Figure 4c, with these steps, a complete round of data updating is concluded.
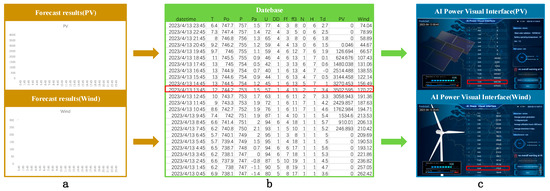
Figure 4.
Data update process. (a) indicates the power forecast result; (b) indicates the database information; (c) indicates the digital twin visual data display.
3. Simulation Experiments
Due to the increasing consumption of non-renewable energy and the growing emphasis on energy independence and low-carbon development, the focus of power generation in the 21st century is gradually shifting towards renewable energy sources. Among them, wind and PV energy are the most prominent representatives. However, the generation of renewable energy is highly influenced by weather conditions, and the existing forecasting methods often fall short in accurately predicting the future power generation of wind and PV power. This inadequacy poses challenges to the efficiency and reliability of power systems.
To tackle these challenges, we have developed four power prediction datasets based on actual weather conditions and wind and PV power data from the Flanders and Wallonia regions of EILA. These datasets serve as the foundation for evaluating our power prediction model. Additionally, we have constructed a digital twin visualization platform for wind and PV power generation. By utilizing real wind and PV power generation equipment as examples, this platform enables more efficient, intelligent, and reliable operation and management of power systems.
3.1. Dataset
In this paper, four datasets, namely Flanders_PV, Wallonia_PV, Flanders_wind, and Wallonia_wind, are utilized for conducting simulation experiments. The training set in this paper consists of 80% of the data, while the remaining 20% is reserved as the test set.
For Flanders_PV, the dataset includes a total of 18,366 PV power generation records and corresponding weather conditions from 4 March 2021, 19:45 to 14 April 2023, 23:45 in the Flanders region. Similarly, Wallonia_PV encompasses 18,366 PV power generation records and weather conditions from the same period in the Wallonia region. Flanders_wind selects a total of 28,460 wind power generation records and weather conditions in Flanders from 1:45 on 1 January 2020 to 23:45 on 13 April 2023, and Wallonia_wind selects Wallonia on 1 January 2020 from 1:45 to 5:45 on 12 April 2023: a total of 28,419 wind power generation records and weather conditions. Figure 5 displays the visualization results of hourly PV and wind power sequences for both the Flanders and Wallonia regions after preprocessing the data.
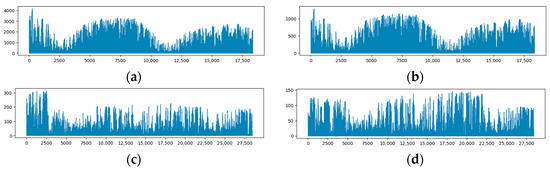
Figure 5.
Sequence of PV and wind power generation per hour in the Flanders and Walloon regions. (a) Flanders hourly PV power generation sequence; (b) Wallonia hourly PV power generation sequence; (c) Flanders hourly wind power generation sequence; (d) Wallonia hourly wind power generation sequence.
Taking the Flanders PV power generation dataset as an example, Figure 6 shows the data visualization results of T, Po, P, Pa, U, DD, Ff, ff3, N, H, and Td, respectively.
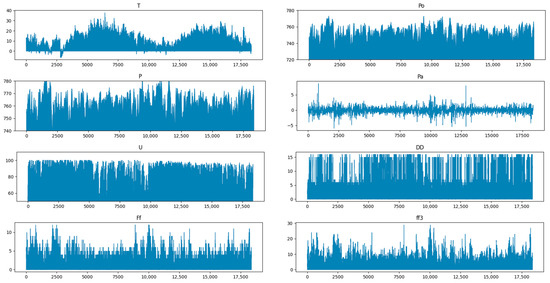
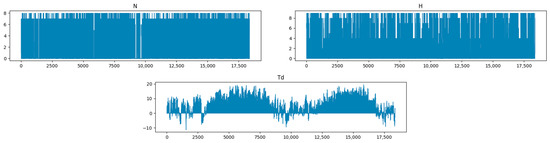
Figure 6.
Visualization results of weather conditions in Flanders_wind.
3.2. Experimental Setup
The wind energy and PV power prediction model WPNet, proposed in this paper, is implemented using the Keras framework. The model is trained and tested on a Windows environment using a 1080 Ti GPU with 8 GB of video memory. During the training process, the Adam optimizer is utilized for optimization. The batch size is set to 8, and the initial learning rate is lr = 1 × 10⁻³. To enhance the efficiency and convergence speed of the model prediction, a total of 50 epochs are trained. The time step is set to 2, and the weather data at time t, power generation data, and weather data at time t + 1 are used as inputs to predict the power generation at time t + 1. This approach ensures both accuracy and real-time performance of the model.
3.3. Evaluation Indicators
To ensure a scientific and comprehensive evaluation of the wind and PV power load forecasting model proposed in this study, we have selected mean square error (MSE), mean absolute error (MAE), and root mean square error (RMSE) as the evaluation metrics. These metrics are commonly used to assess the accuracy of forecasting models, and a smaller value indicates that the forecasting results are closer to the true values. The calculation formulas for these evaluation metrics are as follows:
where, is the predicted data, is the original data, and is the total sample size.
3.4. Analysis of Simulation Experiment Results
3.4.1. Experimental Analysis of Power Load Forecasting Model
In this section, a comparative analysis was conducted to compare the performance of the existing mainstream power load forecasting models, including LSTM, CNN, Attention, and Transformer models, with the proposed model WPNet in terms of MSE, MAE, and RMSE values. The input for the models was the weather conditions and power load values at the previous time step, and the output was the predicted power load value for the next time step. By comparing the MSE, MAE, and RMSE values with those of LSTM, CNN, Transformer, and Attention models, the following analysis results were obtained:
(1) As shown in Figure 7a, the proposed model WPNet in this paper outperforms other models in the Flanders_PV test dataset. As shown in Table 3, the model achieves MSE, MAE, and RMSE values of 1.399 × 10⁻³, 2.5164 × 10⁻², and 3.7409 × 10⁻², respectively.
Figure 7.
Comparison of accuracy across different datasets. (a) Error display in the Flanders_PV dataset. (b) Error display in the Wallonia_PV dataset. (c) Error display in the Flanders_Wind dataset. (d) Error display in the Wallonia_Wind dataset.
Table 3.
Flanders_PV accuracy comparison.
(2) As shown in Figure 7b, the proposed model WPNet in this paper outperforms other models in the Wallonia_PV test dataset. As shown in Table 4, the model achieves MSE, MAE, and RMSE values of 1.833 × 10⁻³, 2.7854 × 10⁻², and 4.2808 × 10⁻², respectively.
Table 4.
Wallonia_PV accuracy comparison.
(3) As shown in Figure 7c, the proposed model WPNet in this paper outperforms other models in the Flanders_wind test dataset. As shown in Table 5, the model achieves MSE, MAE, and RMSE values of 0.704 × 10⁻³, 1.8529 × 10⁻², and 2.6541 × 10⁻², respectively.
Table 5.
Flanders_wind accuracy comparison.
(4) As shown in Figure 7d, the proposed model WPNet in this paper outperforms other models in the Wallonia_wind test dataset. As shown in Table 6, the model achieves MSE, MAE, and RMSE values of 2.708 × 10⁻³, 3.2501 × 10⁻², and 5.2042 × 10⁻², respectively.
Table 6.
Wallonia_wind accuracy comparison.
To further demonstrate the effectiveness of the proposed model in predicting wind and PV power loads, the predicted values for the last 500 data points in the test set were visualized. Figure 8 presents a detailed comparison of each model’s performance across the four datasets. The thick blue line represents the ground truth data, while the other colored lines represent the predictions of each algorithm. Figure 8a,b represent the PV power generation data for Flanders and Wallonia regions, respectively, while Figure 8c,d represent the wind power generation data for Flanders and Wallonia regions, respectively. The black boxes in Figure 8a–c indicate that the predictions of the Transformer model have significant deviations from the actual results. In the black box of Figure 8d, the predictions of both CNN and Transformer do not match the actual results. Overall, the performance of LSTM, Attention, and the proposed method WPNet is highly stable and accurate. However, compared to the predictions of LSTM and Attention, the proposed method WPNet exhibits the closest resemblance to the ground truth across all four datasets.
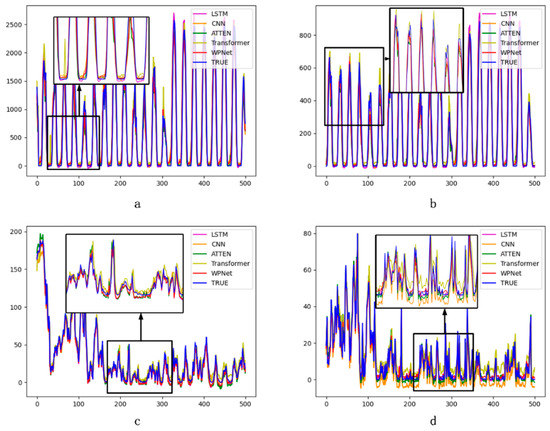
Figure 8.
Visualization of Power Prediction Results. (a) PV power Generation in Flanders; (b) PV power generation in Wallonia; (c) Wind power generation in Flanders; (d) Wind power generation in Wallonia.
In summary, the above analysis results demonstrate that the proposed wind and PV power load prediction model WPNet in this paper can accurately forecast the renewable energy generation power for the next time step. For the complete training process, see Figure A1 in Appendix A.
3.4.2. Digital Twin AI Grid Simulation Experiments
In this study, a real wind and PV power plant was utilized as the research scenario. A corresponding digital twin was constructed using data graphing, dynamic model changes, and separate front-end and back-end development modes. The client periodically sends polling requests to the server to retrieve data and update the view in real-time. The simulation results are presented in Figure 9. The left image illustrates the physical entities of the wind and PV plants in the actual space, while the right image depicts the corresponding digital twin 3D model in the digital space. For overall power plant digital twin (3D model) visualization results, see Figure A2 in Appendix A.
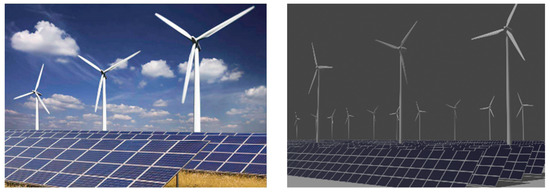
Figure 9.
Digital twin of wind and PV plants. The left image shows the wind and PV power generation equipment in real space, while the right image shows the corresponding digital twin 3D model of the equipment.
Figure 10 showcases the digital twin visualization platform. The platform retrieves real-time updated database data and presents it in the visualization interface. Text-based data is transformed into intuitive and effective chart types, effectively reducing the data volume while highlighting data trends and future directions. The data is segmented into multiple time points, and the date selection module in the upper left corner simplifies the process of selecting the desired forecasting date. The generation details page offers a comprehensive overview of the projected daily power generation for the upcoming period. Additionally, it allows users to monitor generator details such as failures, shutdowns, maintenance, and more, facilitating improved management and optimization of power plant operations.
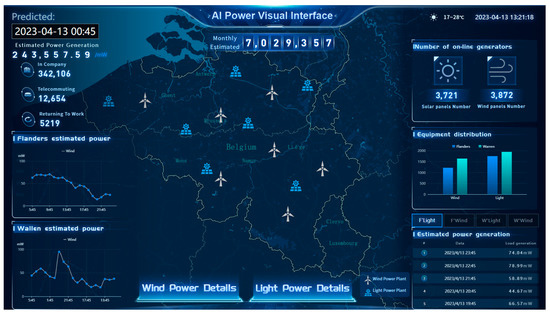
Figure 10.
Digital twin visualization platform.
4. Summary
To apply digital twin technology in the AI Grid and renewable energy power forecasting domain, this paper proposes a digital twin power forecasting platform for the AI Grid. The platform utilizes weather conditions and historical power load data to predict future wind and PV power generation. It then maps the power generation information from the physical world to the digital space, enabling precise monitoring, optimal control, and decision support for power system operations. Subsequently, a simulation experiment was conducted using wind and PV power generation data from Flanders and Wallonia in Belgium. The experimental results validate the effectiveness of the proposed study.
This study has achieved milestones through a digital twin-based approach to wind and photovoltaic power forecasting, but there are still some limitations and shortcomings. Specifically, the current study has not yet addressed the impacts of cross-region forecasting, cross-system forecasting, and equipment issues. Therefore, future work will focus on the following two aspects: (1) Cross-region or cross-system forecasting: by comprehensively analyzing weather conditions and power system operation data in different regions, we will strive to achieve a wider range of power system operation optimization and planning decision support. (2) Impact of equipment failures or changes in scale: We will take into account the impact of equipment failures and the challenges posed by changes in the scale of equipment in order to provide more accurate and reliable forecasts of power production.
With these improvements in our future work, we expect to further improve the accuracy and reliability of renewable power forecasts and provide stronger support for smart grid operation optimization and planning decisions.
Author Contributions
Y.W. (Yonggui Wang), Conceptualization, methodology, software, validation, formal analysis, investigation, resources, writing, review and editing, visualization, project administration; Y.Q., conceptualization, methodology, software, formal analysis, resources, writing, review and editing, visualization, supervision, project administration; J.L., conceptualization, methodology, validation, formal analysis, resources, writing, supervision, project administration; L.H., validation, investigation, review and editing, visualization; Y.L., validation, investigation, review and editing; B.X., validation, writing, review and editing, visualization; Y.W. (Yongshan Wang), validation, resources, review and editing; All authors have read and agreed to the published version of the manuscript.
Funding
The research was funded by the Shaanxi Provincial Department of Education Service Local Special Plan Project (22JC019).
Institutional Review Board Statement
Not applicable.
Informed Consent Statement
Not applicable.
Acknowledgments
We wish to acknowledge the support of the Shaanxi Provincial Department of Education Service Local Special Plan Project (22JC019). In this study, we also express our deep gratitude and respect to Bin He, whose guidance and support played an important role for me in the study.
Conflicts of Interest
The authors declare no conflict of interest.
Appendix A
Table A1.
Specific meaning of weather variables.
Table A1.
Specific meaning of weather variables.
| Weather Variables | Specific Meaning |
|---|---|
| T | Atmospheric temperature at 2 m above ground level (degrees Celsius) |
| Po | Atmospheric pressure at weather station level (mmHg) |
| P | Atmospheric pressure at mean sea level (mmHg) |
| Pa | Change in atmospheric pressure (mmHg) during the three hours prior to the observation |
| U | Relative humidity at ground height 2 m (%) |
| DD | Wind direction (compass bearing) at a ground height of 10~12 m within 10 min before observation |
| Ff | Average wind speed (m/s) at a ground height of 10~12 m during the 10 min before the observation |
| ff3 | Maximum gust at 10–12 m ground level between two observations (m/s) |
| N | Total Cloud Volume |
| H | Height of the lowest cloud base (m) |
| Td | Dew point temperature at ground level 2 m (Celsius) |
Figure A1 shows the transformation curve between training loss and test loss value of the model during training on four different data sets, where blue represents training loss, orange represents test loss, and the loss function uses cross entropy loss. Figure A1a,b, respectively represent the loss value transformation curves of PV power generation data in the Flanders and Wallonia regions, while Figure A1c,d, respectively represent the loss value transformation curves of wind power generation data in the Flanders and Walloon regions.

Figure A1.
Visualization of training loss. (a) Demonstration of the training process for the dataset Flanders_PV. (b) Demonstration of the training process for the dataset Wallonia_PV. (c) Demonstration of the training process for the dataset Flanders_Win. (d) Demonstration of the training process for the dataset Wallonia_Wind.
In the process of modeling, in order to achieve a better presentation effect, we have planned the deployment of power generation equipment and plants according to the layout of a real power plant. By using 3DSMAX modeling tool, the basic framework of the model was constructed according to the standard parameters, and at the same time, Blender 3.4 was used to refine the model. For the power generation equipment, models of inverters, transformers, power lines, generators, control systems and monitoring equipment were created through the investigation of actual wind and solar power stations. To ensure the quality of the model, Blender3.4 was used to strictly limit the scale of the model, so that it can correctly express the effect while restoring the real scale. After completing the overall model design, the texture of the fan blades of the real wind turbine and the combination of the solar panels are used to further improve the overall framework, so that the final rendering effect has a clearer reference significance. Among them, the overall simulation results of the inverter, transformer, power lines and other connecting components are shown in Figure A2.

Figure A2.
Overall simulation results of inverter, transformer, power line and other connecting elements to the plant.
References
- Fang, X.; Misra, S.; Xue, G.; Yang, D. AI Grid-The new and improved power grid: A survey. IEEE Commun. Surv. Tutor. 2011, 14, 944–980. [Google Scholar] [CrossRef]
- Brosinsky, C.; Westermann, D.; Krebs, R. Recent and prospective developments in power system control centers: Adapting the digital twin technology for application in power system control centers. In Proceedings of the 2018 IEEE International Energy Conference (ENERGYCON) of the Conference, Limassol, Cyprus, 3–7 June 2018. [Google Scholar]
- Liu, M.; Fang, S.; Dong, H.; Xu, C. Review of digital twin about concepts, technologies, and industrial applications. J. Manuf. Syst. 2021, 58, 346–361. [Google Scholar] [CrossRef]
- Kummerow, A.; Nicolai, S.; Brosinsky, C.; Westermann, D.; Naumann, A.; Richter, M. Digital-Twin based Services for advanced Monitoring and Control of future power systems. In Proceedings of the 2020 IEEE Power & Energy Society General Meeting (PESGM) of the Conference, Montreal, QC, Canada, 2–6 August 2020. [Google Scholar]
- Zhou, M.; Yan, J.; Feng, D. Digital twin framework and its application to power grid online analysis. CSEE J. Power Energy Syst. 2019, 5, 391–398. [Google Scholar]
- Saad, A.; Faddel, S.; Mohammed, O. IoT-based digital twin for energy cyber-physical systems: Design and implementation. Energies 2020, 13, 4762. [Google Scholar] [CrossRef]
- Jain, P.; Poon, J.; Singh, J.P.; Spanos, C.; Sanders, S.R.; Panda, S.K. A digital twin approach for fault diagnosis in distributed photovoltaic systems. IEEE Trans. Power Electron. 2019, 35, 940–956. [Google Scholar] [CrossRef]
- Takeda, H.; Tamura, Y.; Sato, S. Using the ensemble Kalman filter for electricity load forecasting and analysis. Energy 2016, 104, 184–198. [Google Scholar] [CrossRef]
- Charytoniuk, W.; Chen, M.S.; Van, O.P. Nonparametric regression based short-term load forecasting. IEEE Trans. Power Syst. 1998, 13, 725–730. [Google Scholar] [CrossRef]
- Zivanovic, R. Local regression-based short-term load forecasting. J. Intell. Robot. Syst. 2001, 31, 115–127. [Google Scholar] [CrossRef]
- Dudek, G. Pattern-based local linear regression models for short-term load forecasting. Electr. Power Syst. Res. 2016, 130, 139–147. [Google Scholar] [CrossRef]
- Clements, A.E.; Hurn, A.S.; Li, Z. Forecasting day-ahead electricity load using a multiple equation time series approach. Eur. J. Oper. Res. 2016, 251, 522–530. [Google Scholar] [CrossRef]
- Xishuang, D.; Lijun, Q.; Lei, H. Short-term load forecasting in AI Grid: A combined CNN and K-means clustering approach. In Proceedings of the 2017 IEEE International Conference on Big Data and Smart Computing (BigComp) of the Conference, Jeju, Republic of Korea, 13–16 February 2017. [Google Scholar]
- Hartigan, J.A.; Wong, M.A. Algorithm AS 136: A k-means clustering algorithm. J. R. Stat. Soc. Ser. C (Appl. Stat.) 1979, 28, 100–108. [Google Scholar] [CrossRef]
- Wang, J.; Zhou, Y.; Chen, X. Electricity Load Forecasting Based on Support Vector Machines and Simulated Annealing Particle Swarm Optimization Algorithm. In Proceedings of the 2007 IEEE International Conference on Automation and Logistics of the Conference, Jinan, China, 18–21 August 2007. [Google Scholar]
- Ren, G.; Wen, S.; Yan, Z.; Hu, R.; Zeng, Z.; Cao, Y. Power load forecasting based on support vector machine and particle swarm optimization. In Proceedings of the 2016 12th World Congress on Intelligent Control and Automation (WCICA) of the Conference, Guilin, China, 12–15 June 2016. [Google Scholar]
- Muzaffar, S.; Afshari, A. Short-term load forecasts using LSTM networks. Energy Procedia 2019, 158, 2922–2927. [Google Scholar] [CrossRef]
- Choi, H.; Ryu, S.; Kim, H. Short-Term Load Forecasting based on ResNet and LSTM. In Proceedings of the 2018 IEEE International Conference on Communications, Control, and Computing Technologies for AI Grids (SmartGridComm) of the Conference, Aalborg, Denmark, 29–31 October 2018. [Google Scholar]
- He, K.; Zhang, X.; Ren, S.; Sun, J. Deep residual learning for image recognition. In Proceedings of the 2016 IEEE Conference on Computer Vision and Pattern Recognition (CVPR) of the Conference, Las Vegas, NV, USA, 26 June 2016. [Google Scholar]
- Meng, A.; Chen, S.; Ou, Z.; Ding, W.; Zhou, H.; Fan, J.; Yin, H. A hybrid deep learning architecture for wind power prediction based on bi-attention mechanism and crisscross optimization. Energy 2022, 238, 121795. [Google Scholar] [CrossRef]
- Zheng, J.; Chen, X.; Yu, K.; Gan, L.; Wang, Y.; Wang, K. Short-term Power Load Forecasting of Residential Community Based on GRU Neural Network. In Proceedings of the 2018 International Conference on Power System Technology (POWERCON) of the Conference, Guangzhou, China, 6–8 November 2018. [Google Scholar]
- Poczeta, K.; Papageorgiou, E.I. Energy Use Forecasting with the Use of a Nested Structure Based on Fuzzy Cognitive Maps and Artificial Neural Networks. Energies 2022, 15, 7542. [Google Scholar] [CrossRef]
- Pombo, D.V.; Bacher, P.; Ziras, C.; Bindner, H.W.; Spataru, S.V.; Sørensen, P.E. Benchmarking physics-informed machine learning-based short term PV-power forecasting tools. Energy Rep. 2022, 8, 6512–6520. [Google Scholar] [CrossRef]
- Cordeiro-Costas, M.; Villanueva, D.; Eguía-Oller, P.; Granada-Álvarez, E. Machine learning and deep learning models applied to photovoltaic production forecasting. Appl. Sci. 2022, 12, 8769. [Google Scholar] [CrossRef]
- Elia Open Data Portal. Available online: https://opendata.elia.be/pages/home/ (accessed on 14 April 2023).
Disclaimer/Publisher’s Note: The statements, opinions and data contained in all publications are solely those of the individual author(s) and contributor(s) and not of MDPI and/or the editor(s). MDPI and/or the editor(s) disclaim responsibility for any injury to people or property resulting from any ideas, methods, instructions or products referred to in the content. |
© 2023 by the authors. Licensee MDPI, Basel, Switzerland. This article is an open access article distributed under the terms and conditions of the Creative Commons Attribution (CC BY) license (https://creativecommons.org/licenses/by/4.0/).