Article

The Role of the Distance between Fine Non-Metallic Oxide Inclusions on the Fatigue Strength of Low-Carbon Steel

Faculty of Technical Sciences, University of Warmia and Mazury in Olsztyn, 10-719 Olsztyn, Poland
Appl. Sci. 2023, 13(14), 8354; https://doi.org/10.3390/app13148354
Submission received: 12 June 2023 / Revised: 28 June 2023 / Accepted: 18 July 2023 / Published: 19 July 2023
(This article belongs to the Section Mechanical Engineering)

Abstract

:
The fatigue strength of steel is an important parameter determining the use of the alloy. Conducting material durability tests depending on the working conditions of the material requires a lot of work. Therefore, the industry knows methods to estimate the fatigue life of steel on the basis of other parameters or measurements of other mechanical properties. One of such parameters is the fatigue strength coefficient, which allows one to link the fatigue strength with the hardness results of a specific steel grade. Alloys produced in industrial conditions contain impurities that can affect the properties of steel, including fatigue strength. Impurities in steel depend mainly on the technology of its production. One of the technologies that allows one to obtain high-purity steel is by subjecting it to secondary metallurgy treatment consisting of desulfurization and refining with argon. The fatigue strength of steel depends, among other things, on the morphology of impurities. In the work, the influence of the distance between small non-metallic inclusions with a diameter of less than 2 µm on the fatigue strength of steel, expressed by the fatigue resistance factor, was assessed. The research was carried out in industrial conditions on seven independent melts of low-carbon steel capable of forming a martensite microstructure. Several dozen fatigue strength tests were carried out for each of the casts. The volume fraction, size, and distribution of pollutants were examined. It was found that the main impurity is Al2O3, with a diameter of about 1.8 µm occurring at a distance of about 12 µm. The distance between small non-metallic inclusions affects the fatigue resistance factor, and small non-metallic inclusions with a diameter of less than 2 µm hinder the destruction of high-ductility steel. The paper presents an example of the structure of non-metallic inclusions for heat, the relative volume of inclusions, the average impurity diameter and impurity spacing for impurity dimensional ranges, the impurity spacing λ for the total volume of impurities, and the bending fatigue strength coefficient tested in steel after hardening and tempering at different tempering temperatures.

1. Introduction

Low-carbon steels capable of forming a martensitic microstructure are used to produce machine parts and structural elements. Elements made of them work under static loads but also under variable loads, causing premature wear [1,2,3,4,5,6,7]. Fatigue strength is one of the most sensitive parameters describing the properties of steel. It depends on a number of factors, which include, among others, steel microstructure, type and nature of the load, shape of the element, and impurities in the steel [8,9,10,11,12]. The complete elimination of non-metallic inclusions from the steel microstructure is still technologically impossible. Also, achieving each degree of higher purity of steel is paid for with a disproportionately increasing cost of production relative to the effect achieved [13,14,15,16]. Non-metallic inclusions can be introduced into steel, most often with the charge material recycled after exploitation, or they can be formed in the metallurgical process [17,18,19,20,21]. Non-metallic inclusions occurring in steel can be divided into two groups [22,23]. The first are endogenous inclusions. These include sulfides, oxides, and silicates formed in liquid steel during the steelmaking process. The second is exogenous inclusions entering the liquid steel from the outside. These include particles introduced into the steel through the use of contaminated recycled feedstock. This group also includes particles from technological equipment used in production, e.g., refractory materials constituting the lining of the furnace, launders, etc. [24,25,26].
The vast majority of works describing the impact of inclusions on steel durability analyze hard steels, most often bearing and tool steels (this is the same group of steels) [27,28,29,30,31,32]. In these steels, almost every brittle inclusion is a structural micro-notch, which is the focus of the crack. Inclusions with a low tendency to brittle fracture are attributed to a decrease in the durability of steel due to the impact on the boundary of the inclusion and its matrix. The authors report that the size of inclusions at 5 µm significantly reduces the fatigue strength of steel. As a rule, hard steels tend to develop a discontinuity that causes a fracture when a critical discontinuity is formed, which is a natural notch [33,34,35,36].
A different group of materials is steel, which has high plasticity. These steels are prone to slippage of atomic planes and plastic deformations, both in micro-areas and on a macroscopic scale. In these steels, the impact of non-metallic inclusions is not as negative as in hard steels. The complexity of the interaction is likely the reason why researchers are less interested in these materials. There are also studies indicating the influence of inclusions of small dimensions on increasing the durability of steel. The results of these works were also confirmed by the author’s research. This topic is a relatively new research problem and is worthy of attention [37,38,39,40,41,42,43].
Determining the fatigue strength of steel is a complex process that requires long-term research. The literature presents the results of tests carried out on several samples, but taking into account the statistical distribution of the tested properties, they are not highly reliable. Therefore, work is being carried out to determine the intermediate fatigue strength. Coefficients and relationships are presented to estimate fatigue strength based on other mechanical properties, e.g., material strength determined on the basis of a static tensile test (1), hardness (2), etc. [44,45]:
zg = c · Rm
and
zg = k · HV,
where:
zg—fatigue strength, MPa;
c—coefficients of the equation;
Rm—tensile strength, MPa;
k—fatigue strength coefficient;
HV—Vickers hardness, MPa.
In the work, it was decided to evaluate the influence of the distance between small non-metallic inclusions on the fatigue strength of steel, expressed by the fatigue strength coefficient k, which is the quotient of fatigue strength and Vickers hardness.

2. Materials and Methods

The tests were carried out on steel smelted in an electric arc furnace with a capacity of 140 tons in industrial conditions. The steel was smelted with the addition of about 25% steel scrap. Seven independent melts were carried out. The metal was tapped into a ladle and then desulfurized with a “desulfex” mixture. After the desulfurization process, the metal was refined with argon by blowing through a porous mold. The duration of the procedure oscillated in the range of 8–10 min. After refining, billets with a square cross-section of 100 × 100 mm were rolled from the cast steel using the classical method. 95 sections were taken for testing from individual billets. Five were used to determine the chemical composition of steel and the impurities present in it, while the remaining ones were intended for metallographic and mechanical tests. The following tests were carried out: chemical composition, metallographic, relative volume of non-metallic inclusions, dimensional structure of impurities, phase composition of oxide inclusions, hardness, and fatigue properties. The chemical composition was tested using the ARL FICA Quantometer and classical chemistry methods. Oxygen content was determined with LECO devices. The total volume of non-metallic inclusions was determined by the extraction method. Determination of the dimensional structure of non-metallic inclusions was carried out on an automatic station for dimensional computer analysis using the Quantimet 720 video microscope. For better identification of non-metallic inclusions, a 400× magnification was used. The observation area suitable for observation at 100× magnification has been preserved. Automatic counting of inclusions was carried out for their diameters of 2 µm, 5 µm, and 10 µm. The share of inclusions below 2 µm was calculated by subtracting from the total volume of inclusions the volume determined for a diameter greater than or equal to 2 µm. The analysis was based on the fact that the area of inclusions determined in the elementary section is proportional to the volume of inclusions in the elementary volume.
The tests were carried out on cylindrical samples with a diameter of 10 mm and a working section length of 50 mm (PN-76/H-04327 [46]). Considering that steel works in various applications, and in order to diversify its properties, it was decided to subject the samples to hardening and tempering in the widest possible temperature range. Hardening was carried out after austenitizing at a temperature of 880 °C and cooling in water. Tempering was carried out for 120 min in the range from 200 °C to 600 °C, changing it every 100 °C. Cooling was carried out in air.
Fatigue strength tests were carried out on the MUJ 6000 machine VEB Werkstoffprufmaschinenkombinat, Leipzig, Germany. Rotational bending was carried out at a frequency of 6000 rpm. The value of 107 cycles was adopted as the basis for determining the conventional limit of fatigue strength. During the tests, the stresses were gradually changed, maintaining the intervals between the levels of 40 MPa (which allowed for results in the field of limited fatigue strength). The stress values were selected in such a way that the number of cycles characterizing the limited fatigue strength oscillated within the range of 104–106.
The ranges of chemical composition of the analyzed steel from seven heats are presented in Table 1. The standard deviation of the chemical composition of steel was determined using the Statistica program (for the sample, i.e., the square root of the variance) for 7 heats and three repetitions of measurements for each heat (21 measurements).
Maximum load during the test, depending on the tempering temperature, is presented in Table 2.
Impurity spacing λ for each of the heats were calculated with (3):
λ = 2 3 d 1 V 0 1
where:
d—average diameter of impurity, µm;
V0—relative volume of impurities with a diameter less than 2 µm, %.
The fatigue strength coefficient k for tested steel is presented in the form of linear regression equations of the general form (4):
k(tempering temp.) = a · λ + b,
where:
k(tempering temp.)—fatigue strength coefficient;
λ—impurity spacing, µm;
a, b—coefficients of the equation.
The significance of correlation coefficients r was determined on the basis of the critical value of the Student’s t-distribution for a significance level α = 0.05 and the number of degrees of freedom f = n − 1.
Since during the tests the results obtained for non-metallic sulfur-based inclusions oscillated on the border of the confidence interval, it was decided to omit their analysis in the paper.

3. Results and Discussion of the Research Results

An example of the structure of non-metallic inclusions in two heats is shown in Figure 1.
In the analyzed heat, the largest share of inclusions, amounting to approx. 40%, was found for Al2O3 of all inclusions constituting the oxide phases (Figure 1). Another oxide inclusion observed in the amount of approx. 13% is SiO2. Inclusions of FeO, CaO, and MgO compounds occur in amounts of about 10%, while Cr2O3 and MnO are slightly below 10%.
The relative volume of inclusions for individual dimensional ranges of impurities is shown in Figure 2.
The average impurity diameter for individual dimensional ranges of impurities is shown in Figure 3.
Impurity spacing λ for individual dimensional ranges of impurities is shown in Figure 4.
Impurity spacing λ for the volume of non-metallic inclusions is shown in Figure 5.
The share of inclusions in other tested heats may slightly differ from the values presented for heat no. 2. This is due to the individual course of the process on an industrial scale and, among others, the difference in the charge of steel scrap, which may introduce exogenous impurities. Analyzing the relative volume of inclusions for individual dimensional ranges of impurities (Figure 2), it was found that the largest volume is occupied by fine inclusions with a diameter of less than 2 µm, followed by inclusions with a diameter of 10 µm and more, which account for about 60% of the volume of fine inclusions with a diameter of below 2 µm. The average impurity diameter of inclusions from 10 µm is close to about 11 µm (Figure 3). Thus, inclusions with a diameter significantly exceeding 10 µm are very rare. Inclusions with a diameter of 10 µm occur at an average distance of λ = 170 µm from each other (Figure 4). Inclusions with a diameter smaller than 2 μm have an average diameter of about 1.8 μm (Figure 3) and are spaced about 12 μm apart. Inclusions with diameters of 2 to 5 µm and 5 to 10 µm occur in a similar amount. This is evidenced by the volume ratio (Figure 2) for both of these impurity diameter ranges. For this reason, in Figure 3 and Figure 4, both of these diameter ranges have been merged into one, creating a range from 2 to 10 µm. The average size of inclusions in the diameter range of 2–10 µm is about 3.7 µm. They are separated by an average distance of about 2.3 µm. Comparing Figure 2 and Figure 4, it was found that the steel contains the largest number of fine inclusions with a diameter of less than 2 µm. Non-metallic inclusions with a diameter of 10 µm, commonly recognized in the literature as harmful [44], are present in the tested steel in a very small amount. Impurity spacing λ for all volumes of non-metallic inclusions (Figure 5) shows the proportional relationship described by the first degree line. Its analysis showed a decrease in the distance between the inclusions and an increase in their share of the steel volume. Which is consistent with the known theory and needs no comment.
Impurity spacing λ for the volume of non-metallic inclusions and the value of the correlation coefficient r are presented in Equation (5).
λ = −215.31 · V0 + 30.5; r = 0.9734
The bending fatigue strength coefficient k of tested steel after hardening and tempering at 200 °C depends on impurity spacing λ and is presented in Figure 6.
The regression equation and the value of the correlation coefficient r are presented in Equation (6).
k(200) = −0.0344 · λ + 1.5276 and r = 0.9084
The bending fatigue strength coefficient k of tested steel after hardening and tempering at 300 °C depends on impurity spacing λ and is presented in Figure 7.
The regression equation and the value of the correlation coefficient r are presented in Equation (7).
k(300) = −0.0177 · λ + 1.219 and r = 0.9360
The bending fatigue strength coefficient k of tested steel after hardening and tempering at 400 °C depends on impurity spacing λ and is presented in Figure 8.
The regression equation and the value of the correlation coefficient r are presented in Equation (8).
k(400) = −0.0328 · λ + 1.4589 and r = 0.9333
The bending fatigue strength coefficient k of tested steel after hardening and tempering at 500 °C depends on impurity spacing λ and is presented in Figure 9.
The regression equation and the value of the correlation coefficient r are presented in Equation (9).
k(500) = −0.025 · λ + 1.2769 and r = 0.9409
The bending fatigue strength coefficient k of tested steel after hardening and tempering at 600 °C depends on impurity spacing λ and is presented in Figure 10.
The regression equation and the value of the correlation coefficient r are presented in Equation (10).
k(600) = −0.024 · λ + 1.3556 and r = 0.9330
The bending fatigue strength coefficient k of tested steel after hardening and tempering for all tempering temperatures depends on impurity spacing λ and is presented in Figure 11.
The regression equation and the value of the correlation coefficient r are presented in Equation (11).
k(all) = −0.029 · λ + 1.4047 and r = 0.8500
By analyzing the bending fatigue strength coefficient k depending on the impurity spacing λ for inclusions with a diameter of less than 2 µm at the tempering temperatures used (Figure 6, Figure 7, Figure 8, Figure 9 and Figure 10), a decrease in fatigue strength was found with increasing the distance between fine inclusions. The influence of the tempering temperature on the analyzed fatigue strength has a similar course. The differences in the course of the function describing the changes consist in changing the angle of inclination of the curve (non-standardized coefficient a (4)) and determining the position of the trend line in relation to the size (standardized coefficient b (4)) of the bending fatigue strength coefficient. The proportional effect of the distance between fine impurities together with the stabilized and very high correlation coefficient (Equations (6)–(10)) for each of the tempering temperatures confirms the above statements. Analyzing the dependence of the bending fatigue strength coefficient on impurity spacing for all tempering temperatures (Figure 11), it was found that inclusions with small dimensions below 2 µm occur in three main groups (ranges) of impurity spacing λ. The first group consists of inclusions distant from each other by 10 to 12 µm, the second by 15.5 to 16.5 µm, and the third by about 20.7 µm. It can be assumed that these distances are related to the diameters of non-metallic inclusions. Smaller distances correspond to smaller inclusion diameters, and vice versa. Also, the correlation coefficient at the level of 0.85 for the total impact of fine inclusions is not only statistically significant (statistical significance was confirmed for all relationships presented in the paper), but also high. It should be emphasized that each of the points marked on the graphs is the arithmetic mean of several dozen measurements for seven independent melts, which excludes the randomness of the presented results. Comparing the bending fatigue strength coefficient with impurity spacing λ, it can be assumed that fine inclusions with a diameter below 2 µm occurring in high purity steels capable of deformation constitute barriers hindering the movement of dislocations. At the same time, by absorbing the energy causing the formation of discontinuities, they slow down the decohesion process.
Fatigue strength is one of the important strength parameters. Defining it in a traditional way requires a lot of time and resources. The studies conducted are aimed at developing quick methods of fatigue strength estimation. One of the simpler parameters, while at the same time making this method non-destructive, is hardness. On this basis, it is possible to estimate fatigue strength. Based on the presented test results, it was found that the fatigue strength coefficient k (used to estimate fatigue strength based on steel hardness (2)) depends on impurity spacing λ. Impurities, on the other hand, are a natural component of steel produced on an industrial scale.

4. Conclusions

Based on the results of the tests, it was found that low-carbon steel (with a carbon content bordering on low-carbon and medium-carbon) after melting in industrial conditions with desulfurization and argon refining:
  • Has a very small amount of impurities, i.e., approx. 0.18 vol.%;
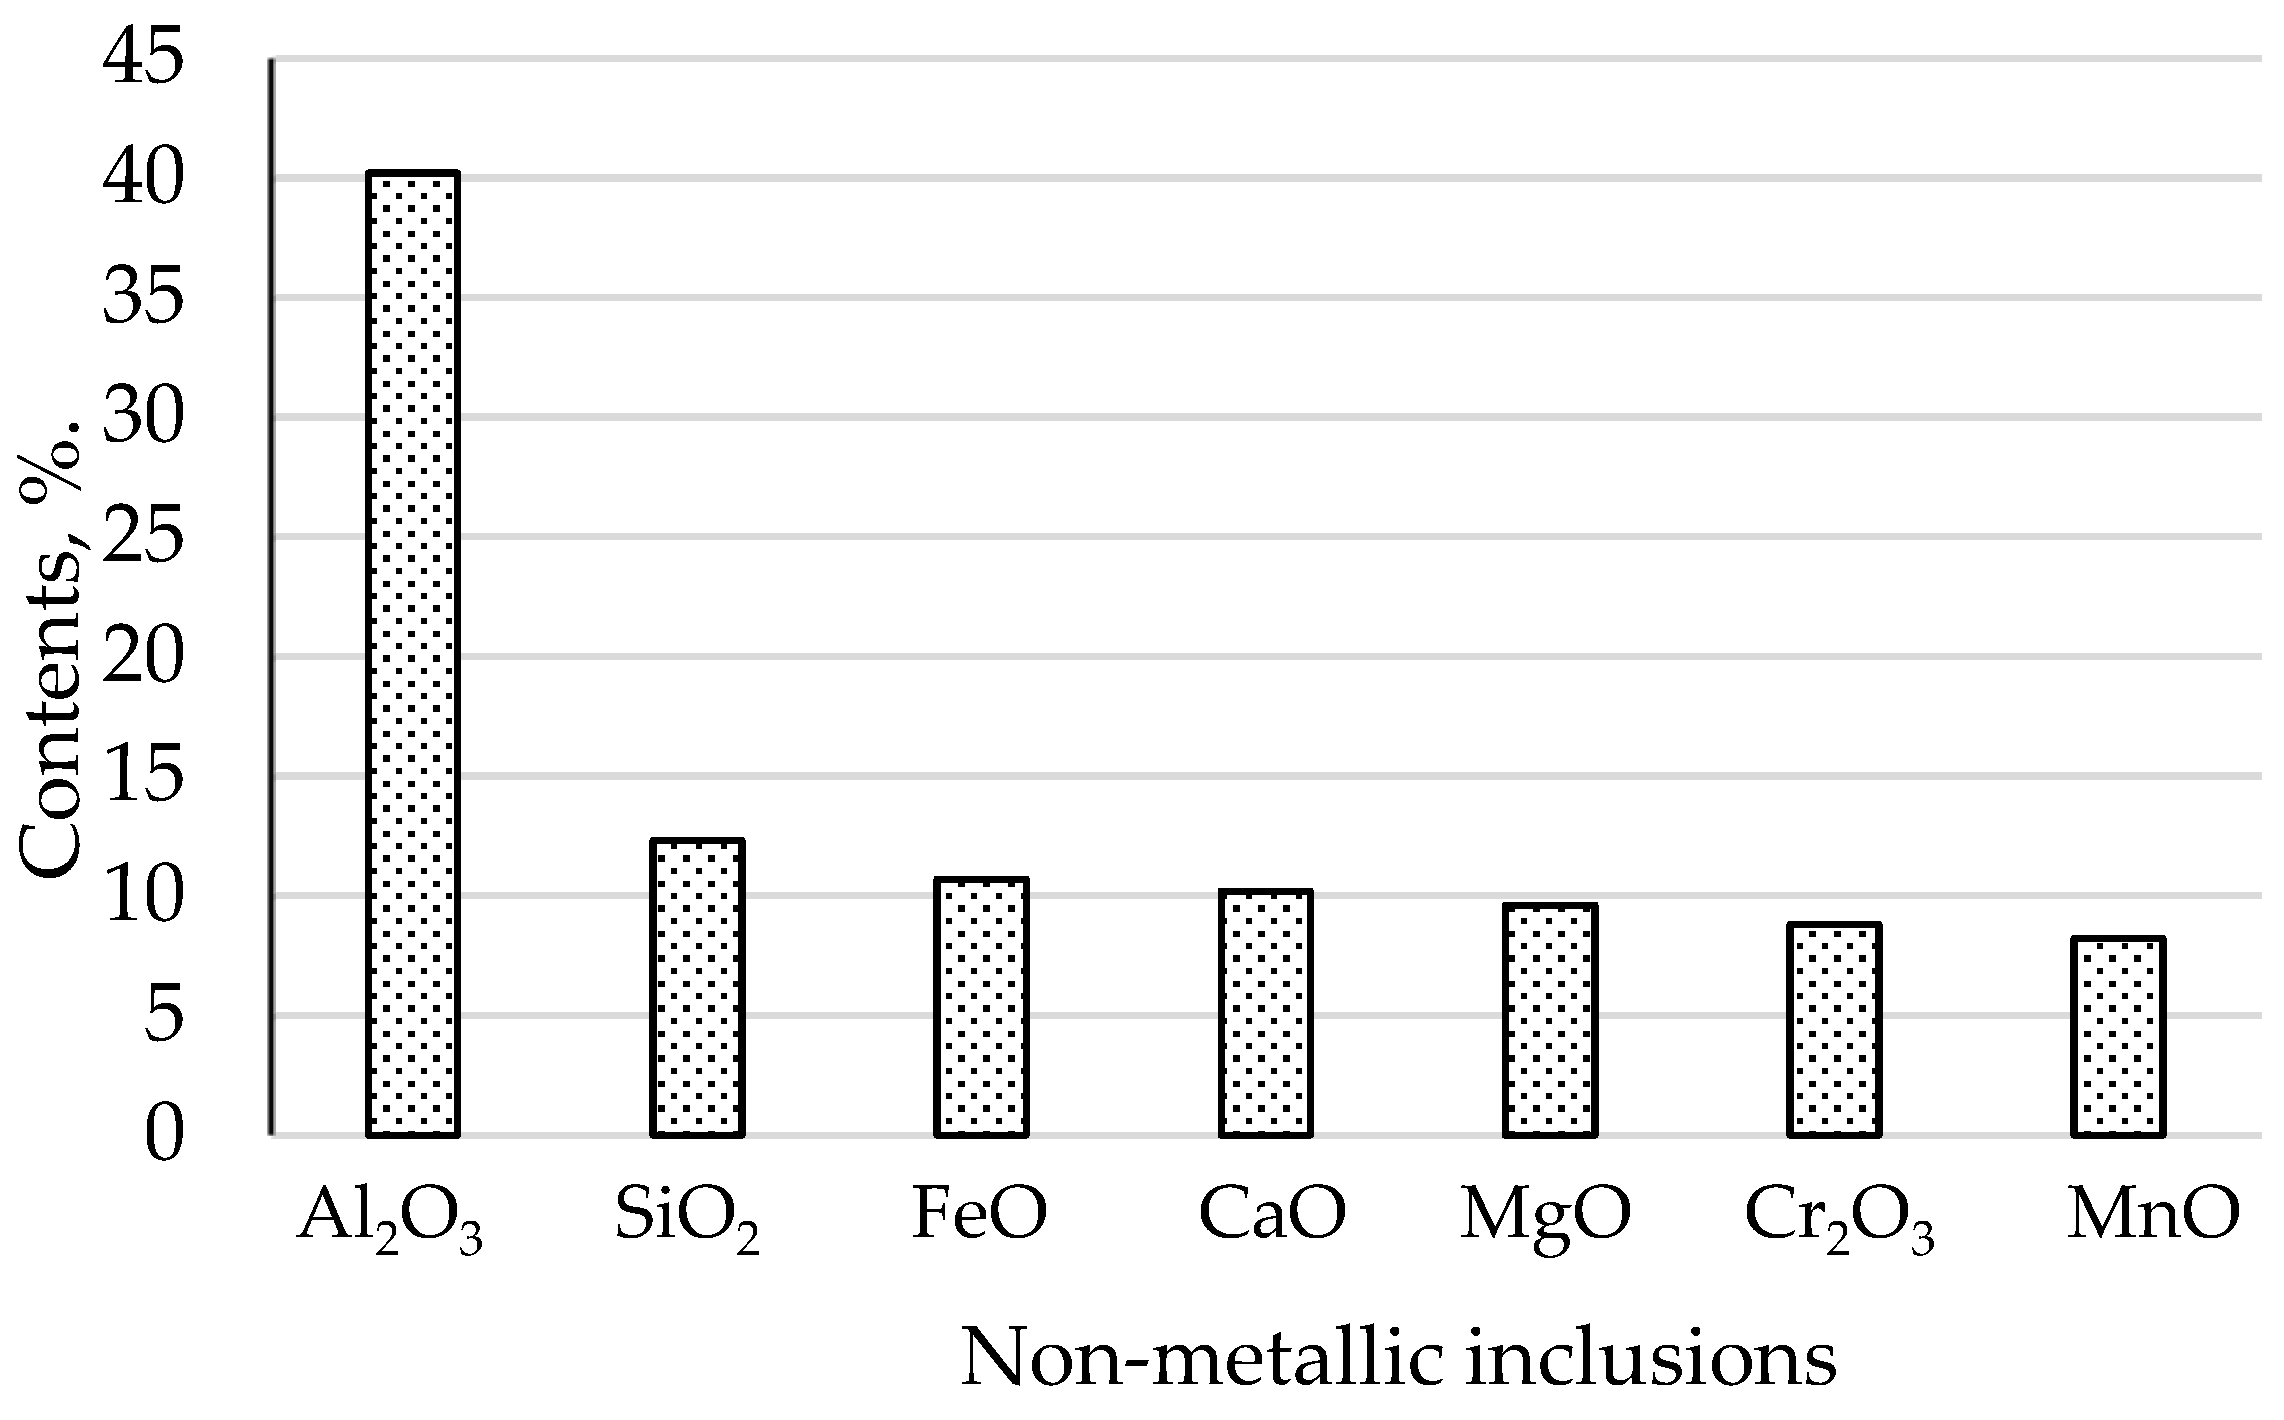
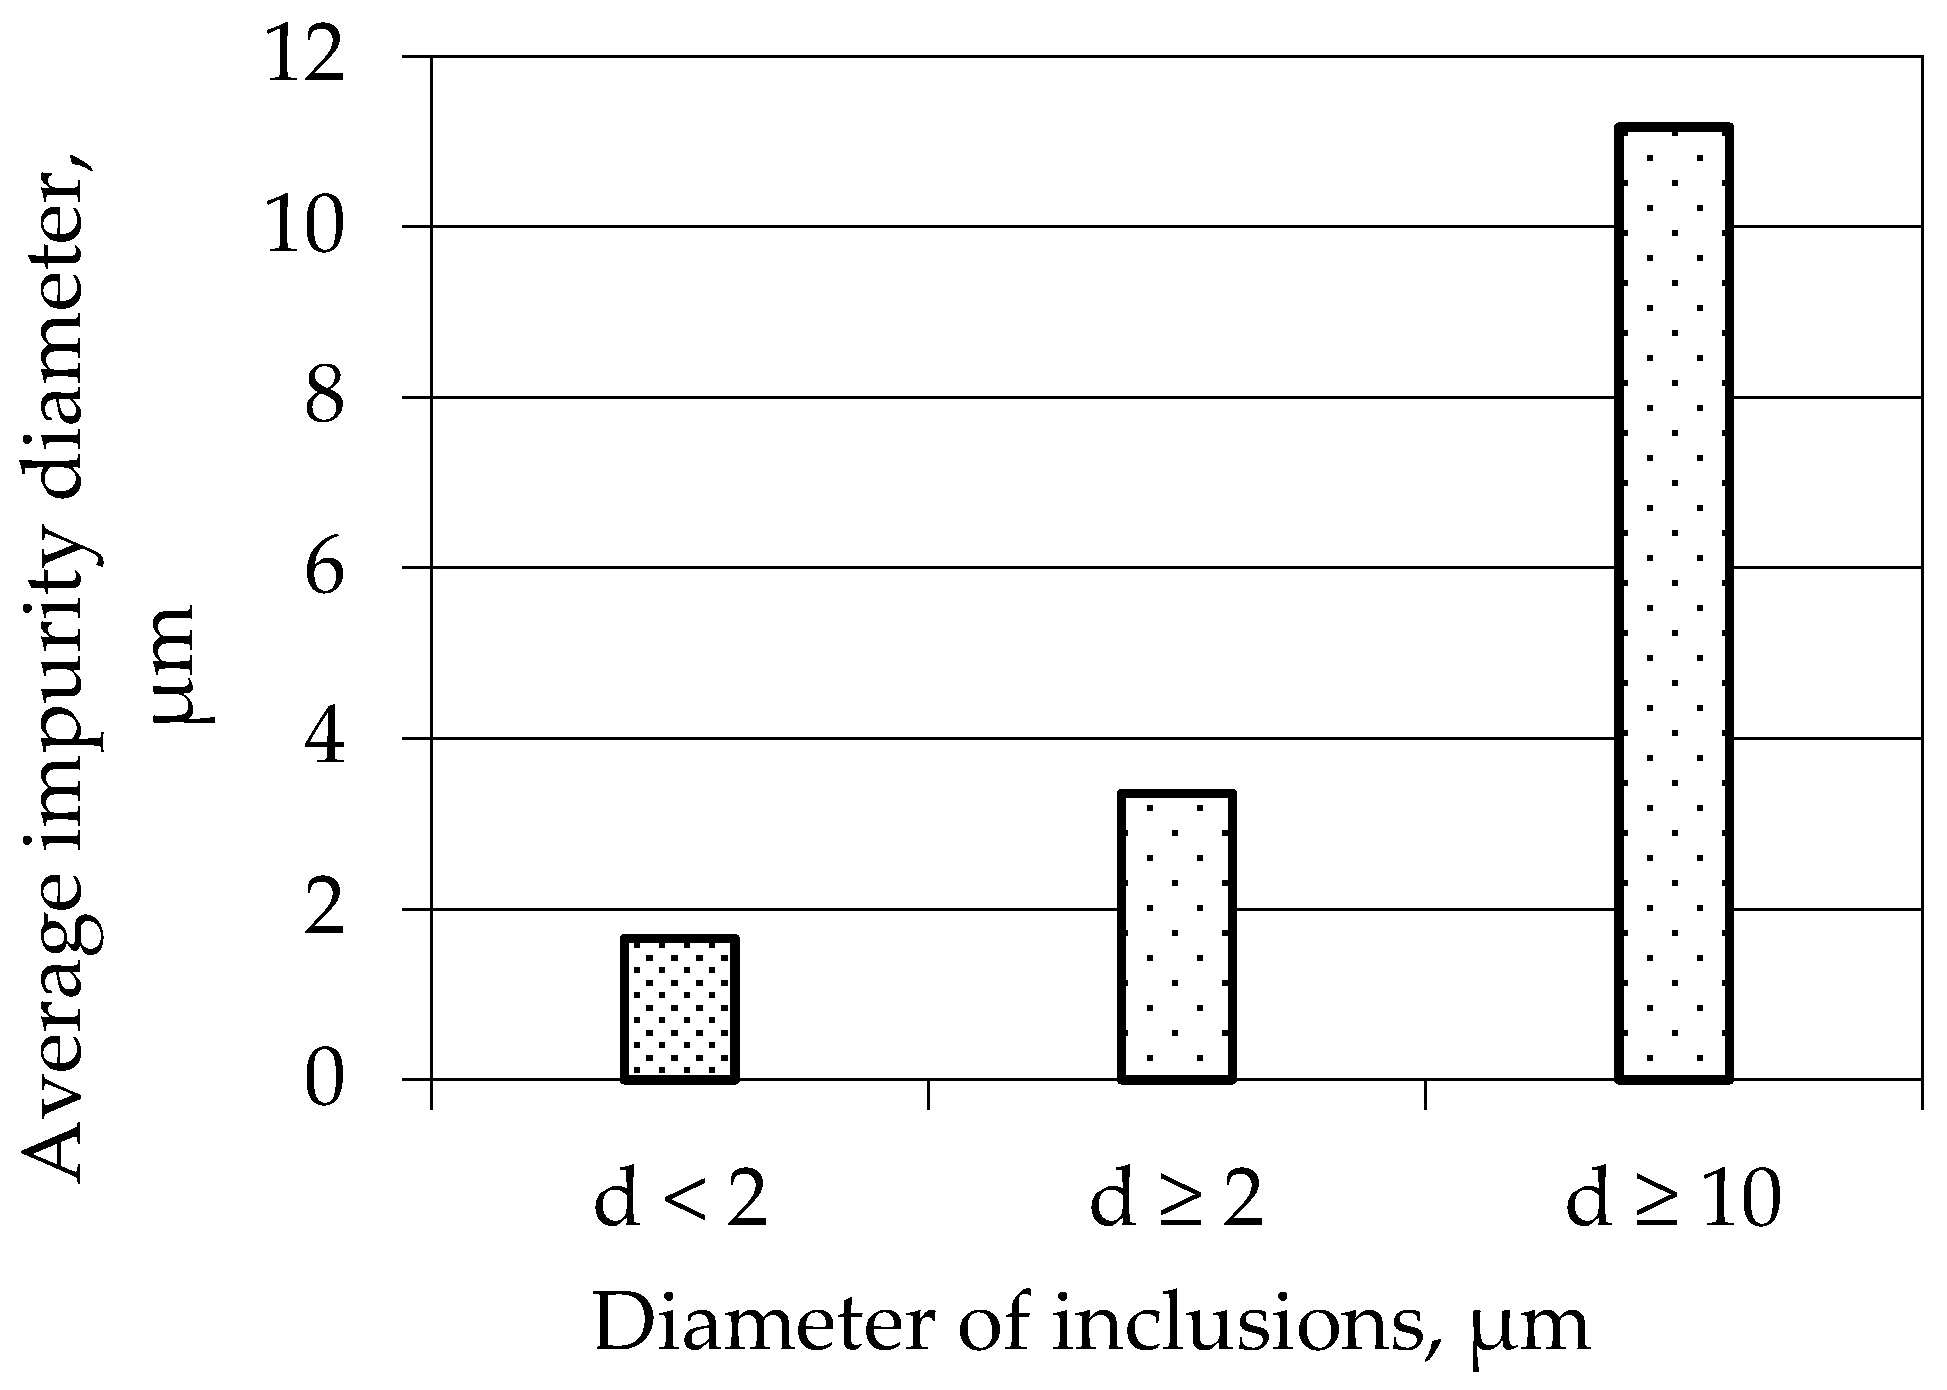
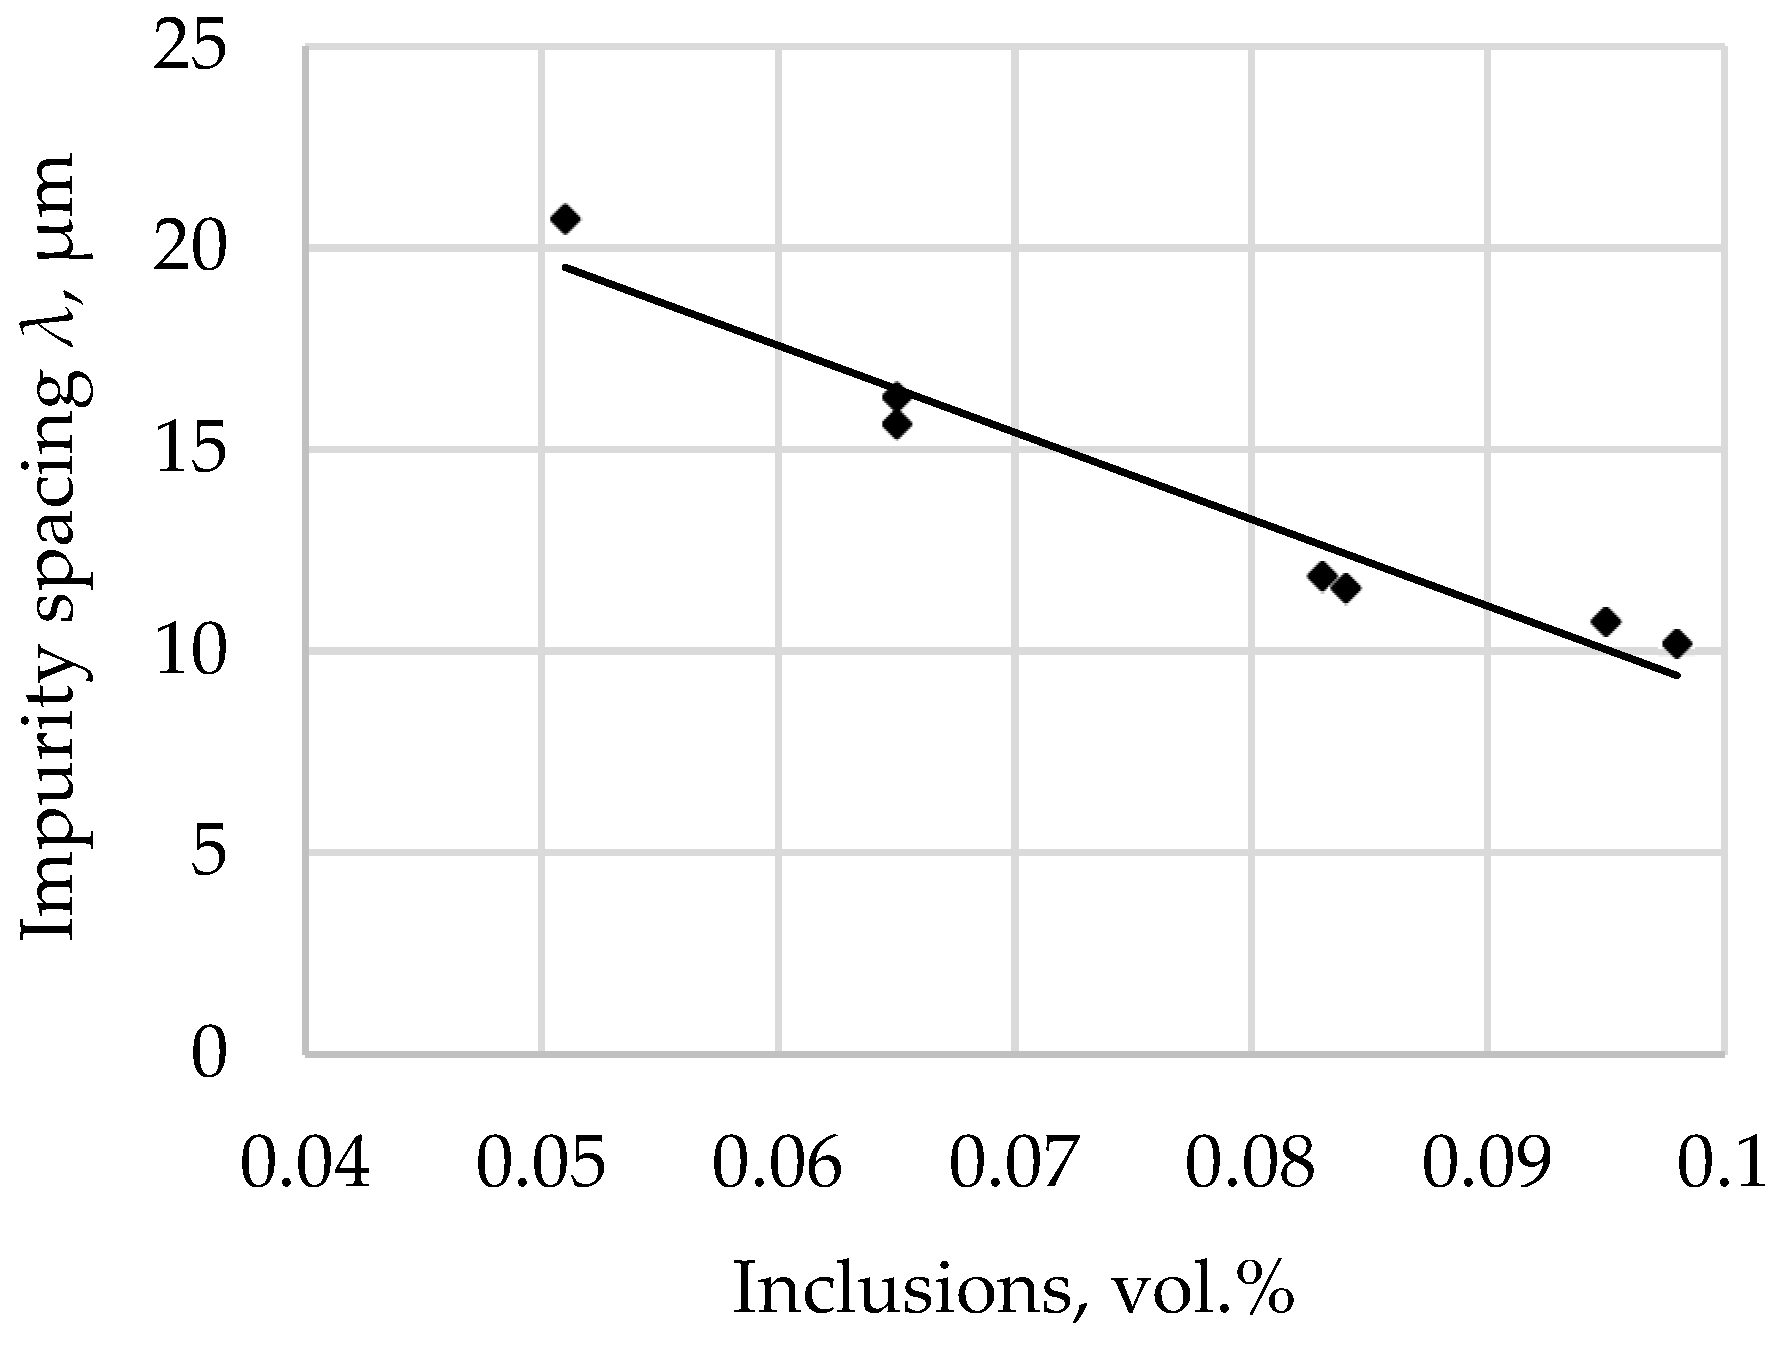
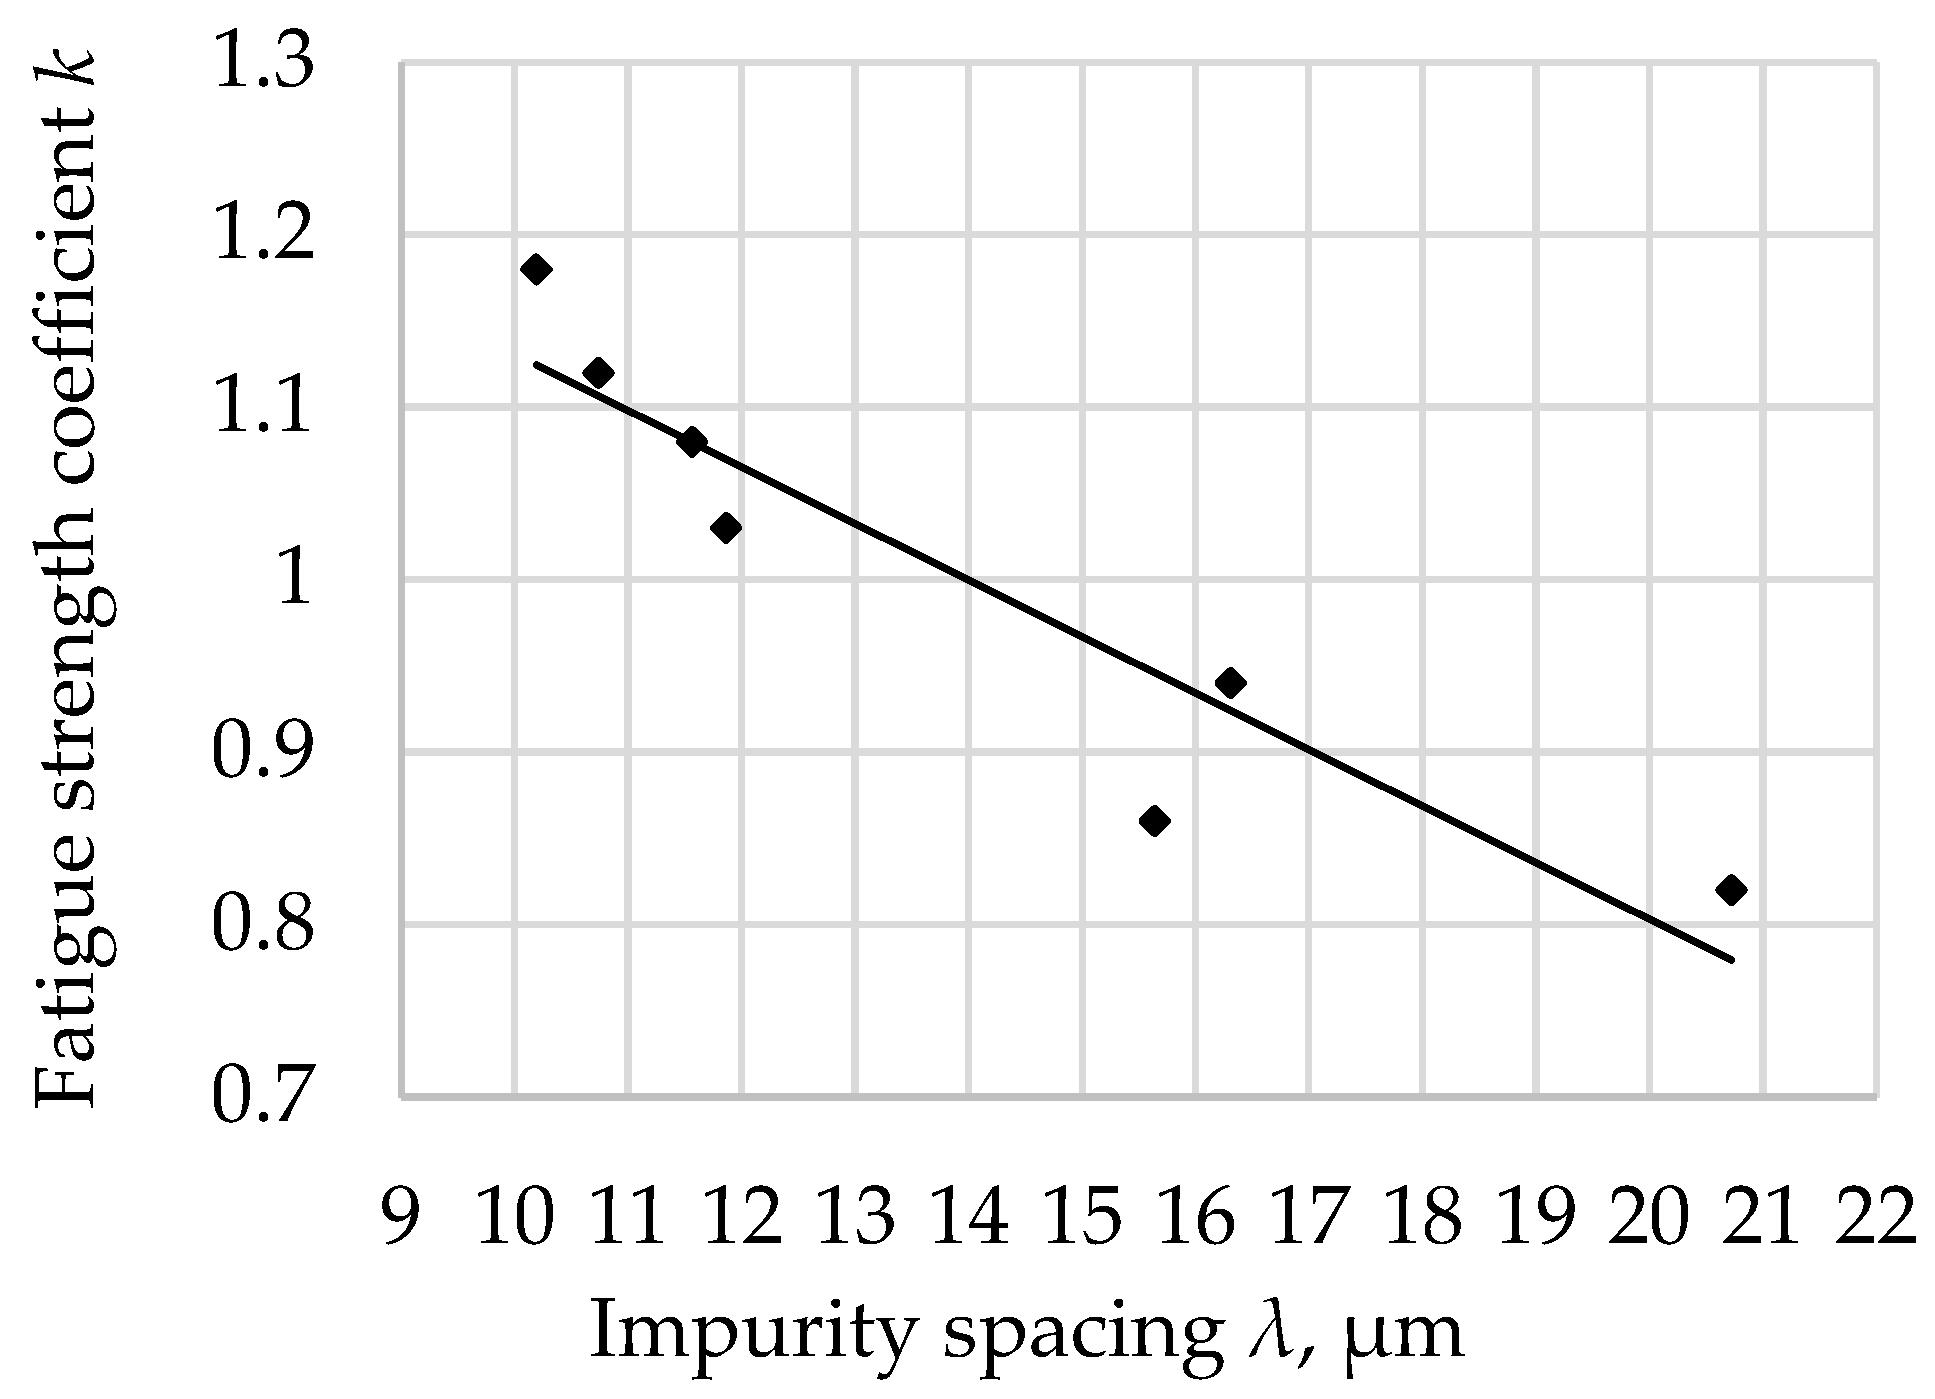
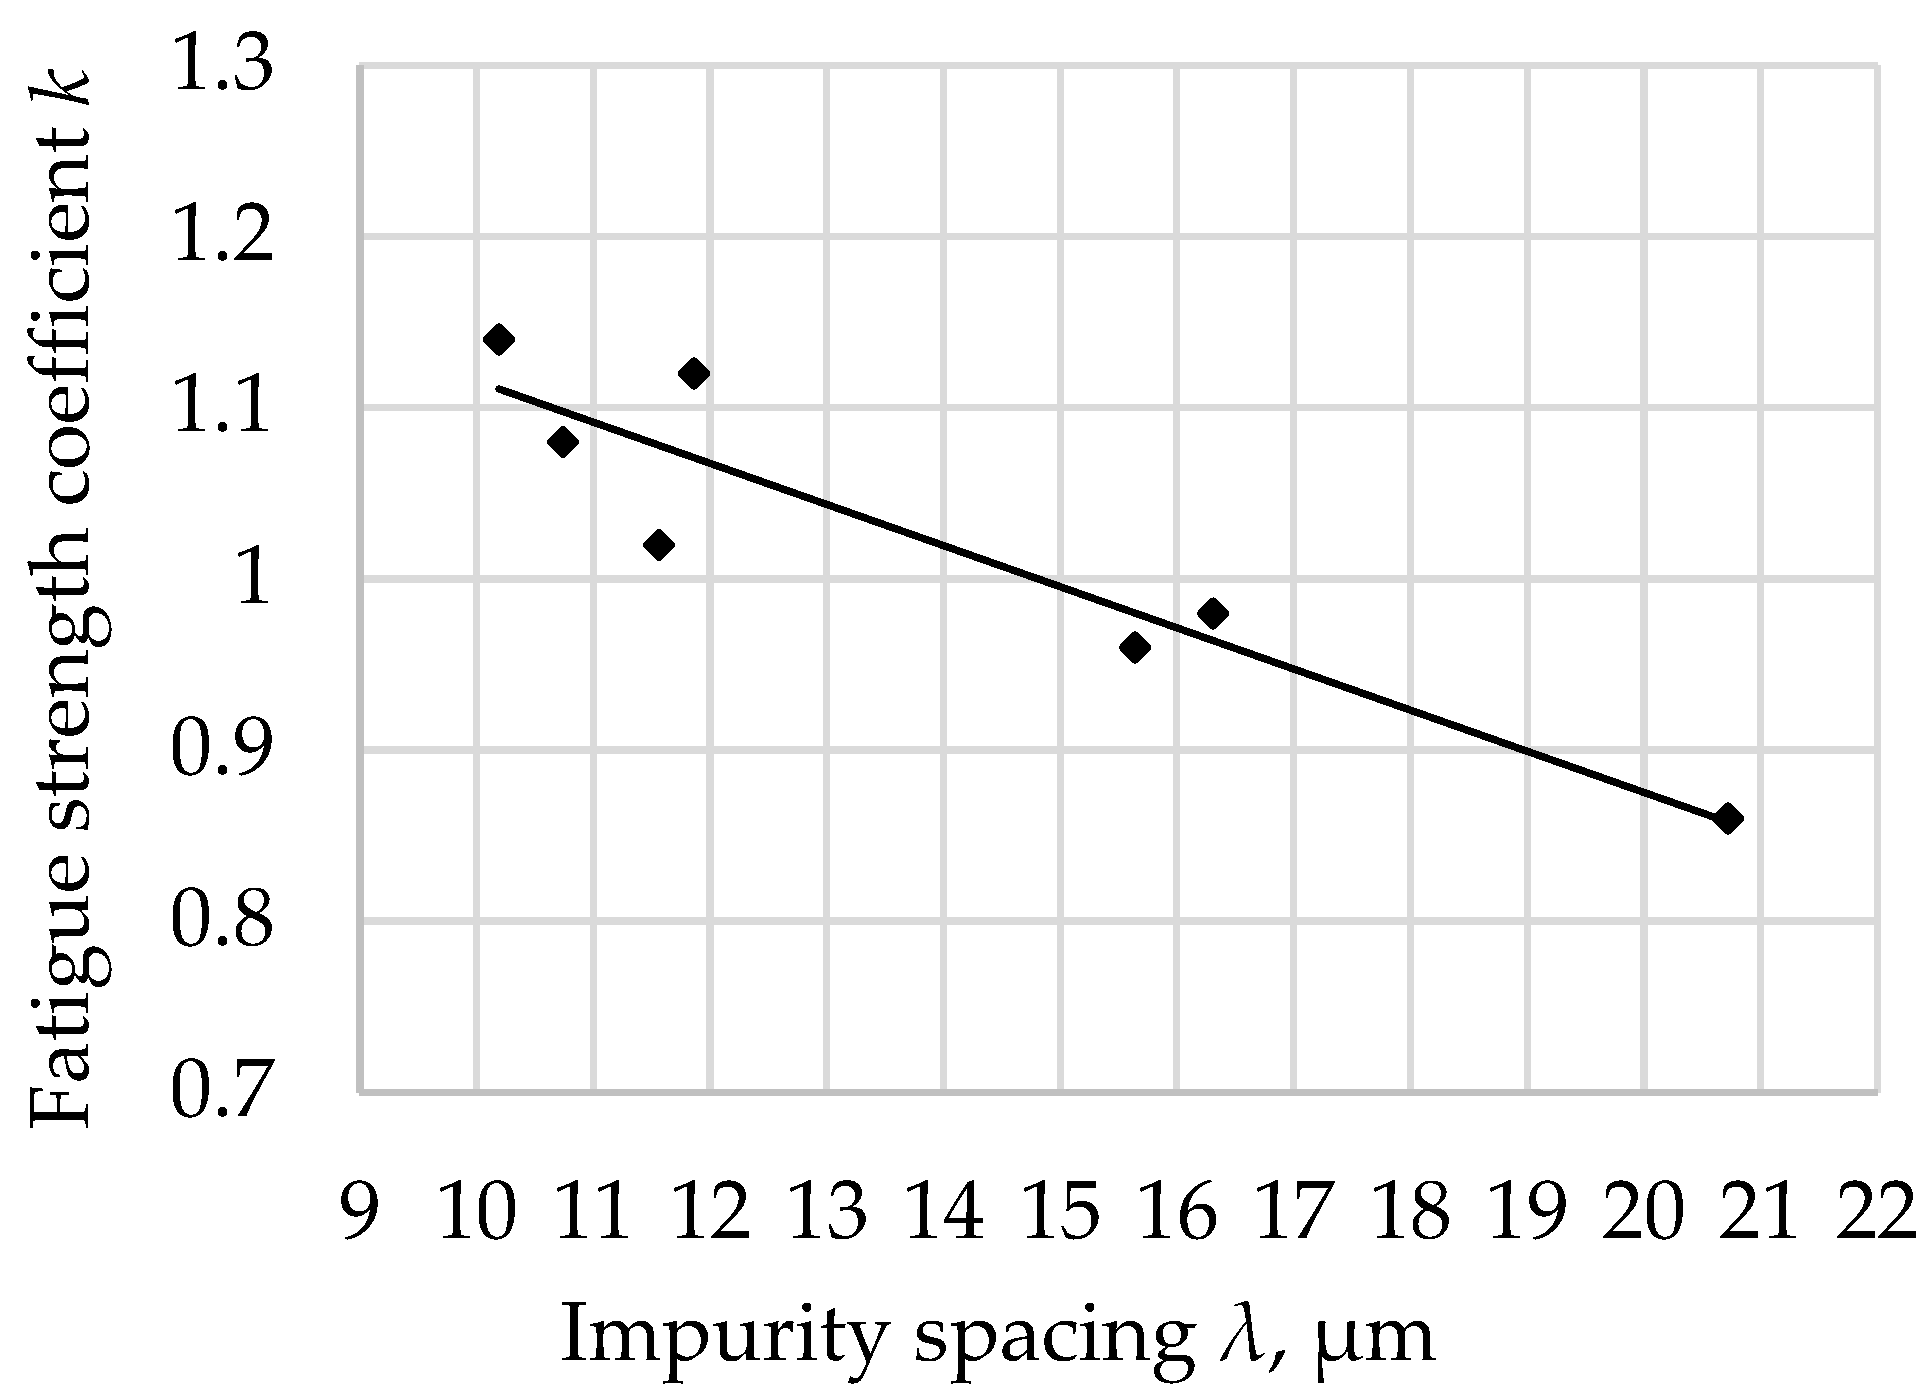
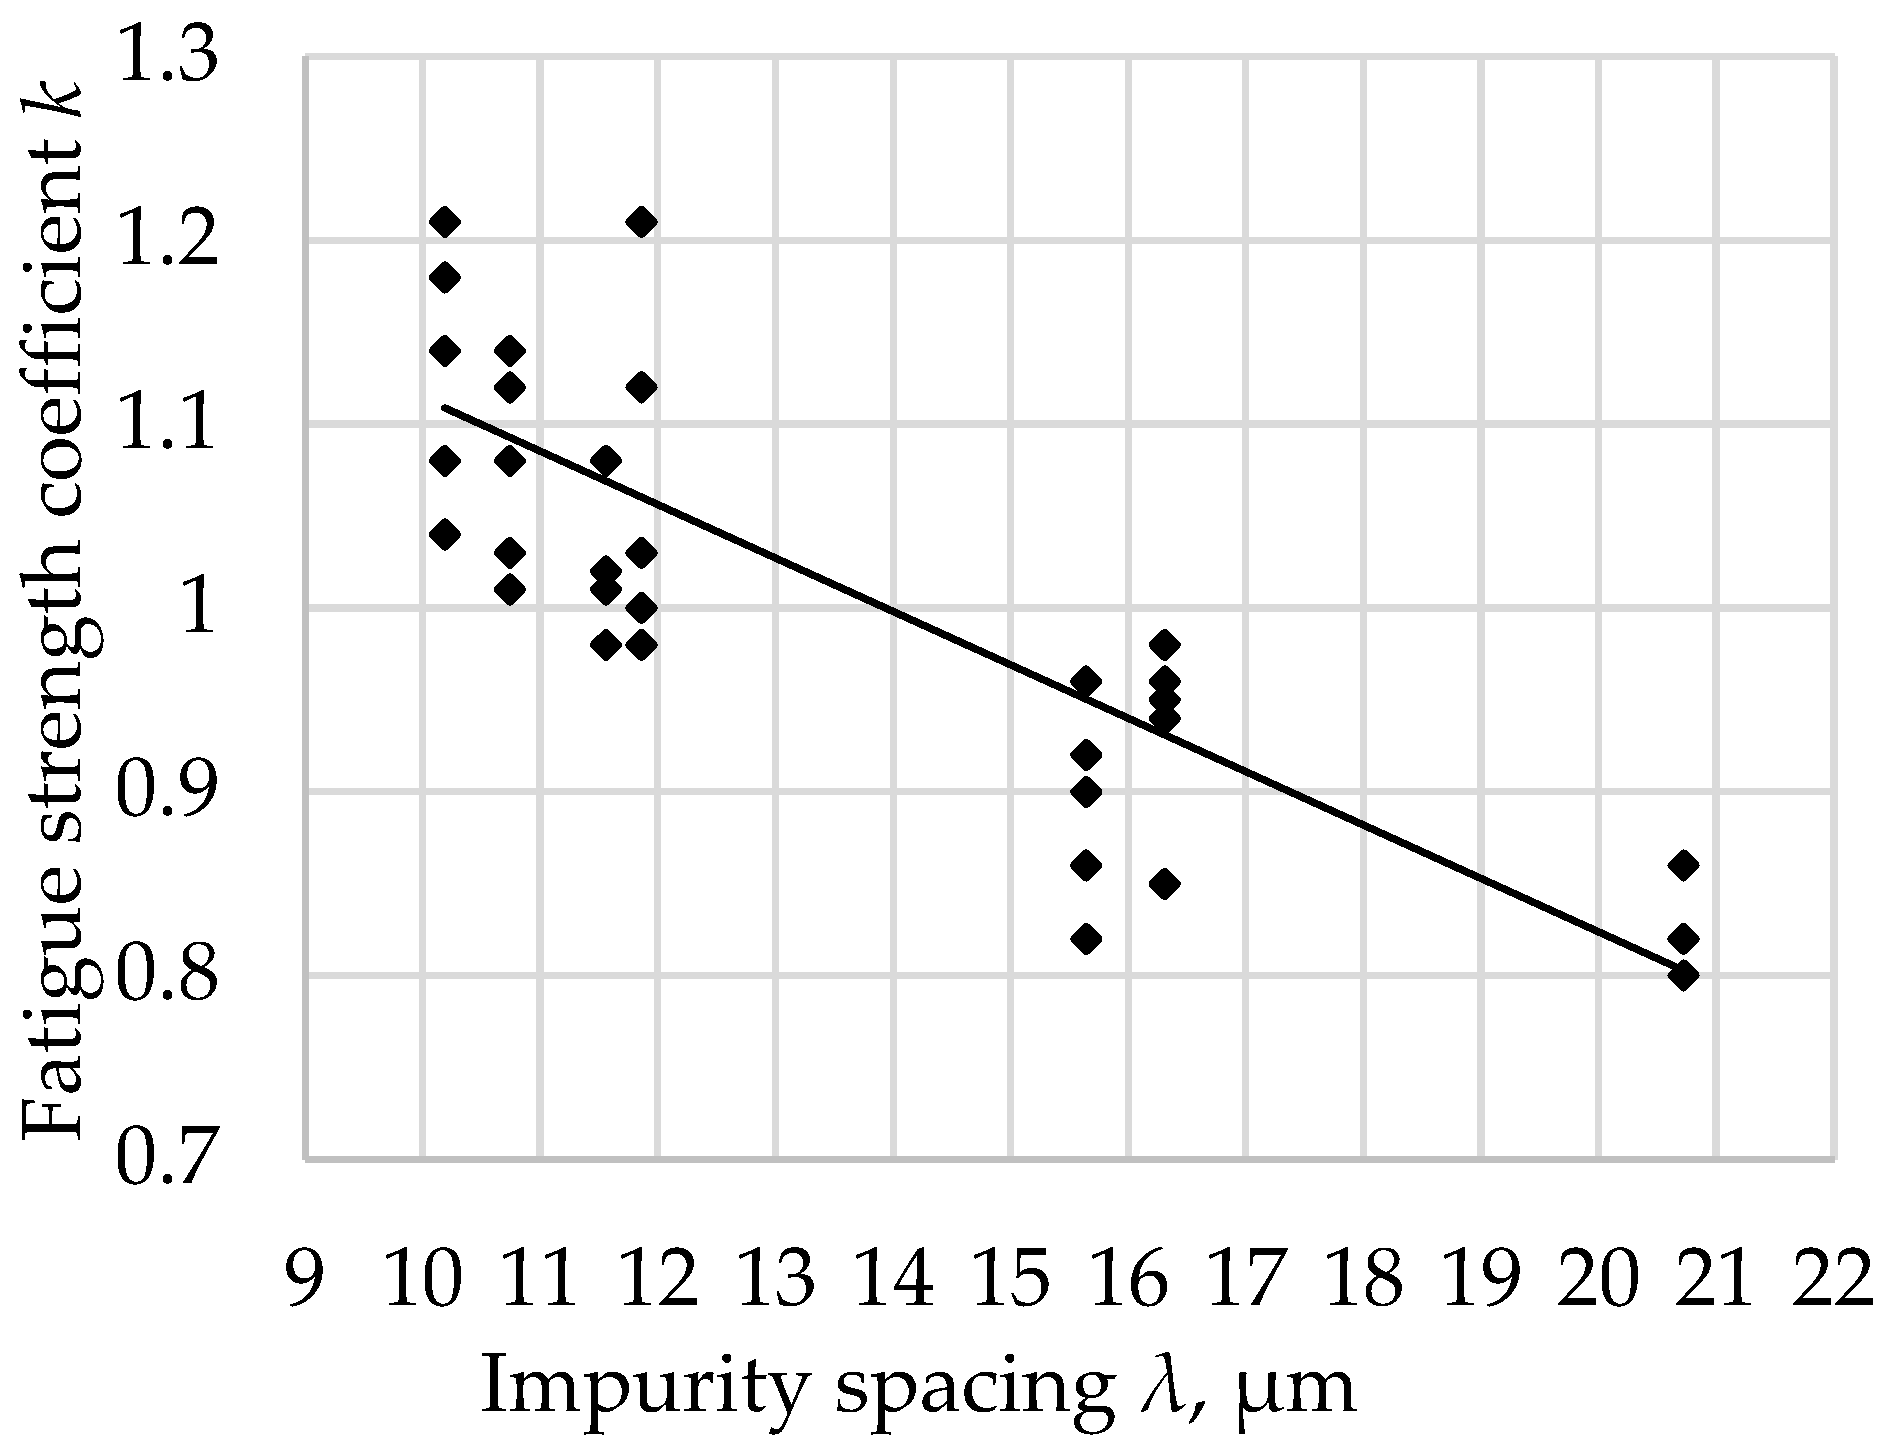
  • The largest amount of impurities is Al2O3, and the main fraction of this oxide is impurities with an arithmetic mean diameter of 1.8 µm and an arithmetic mean distance between these inclusions of 12 µm;
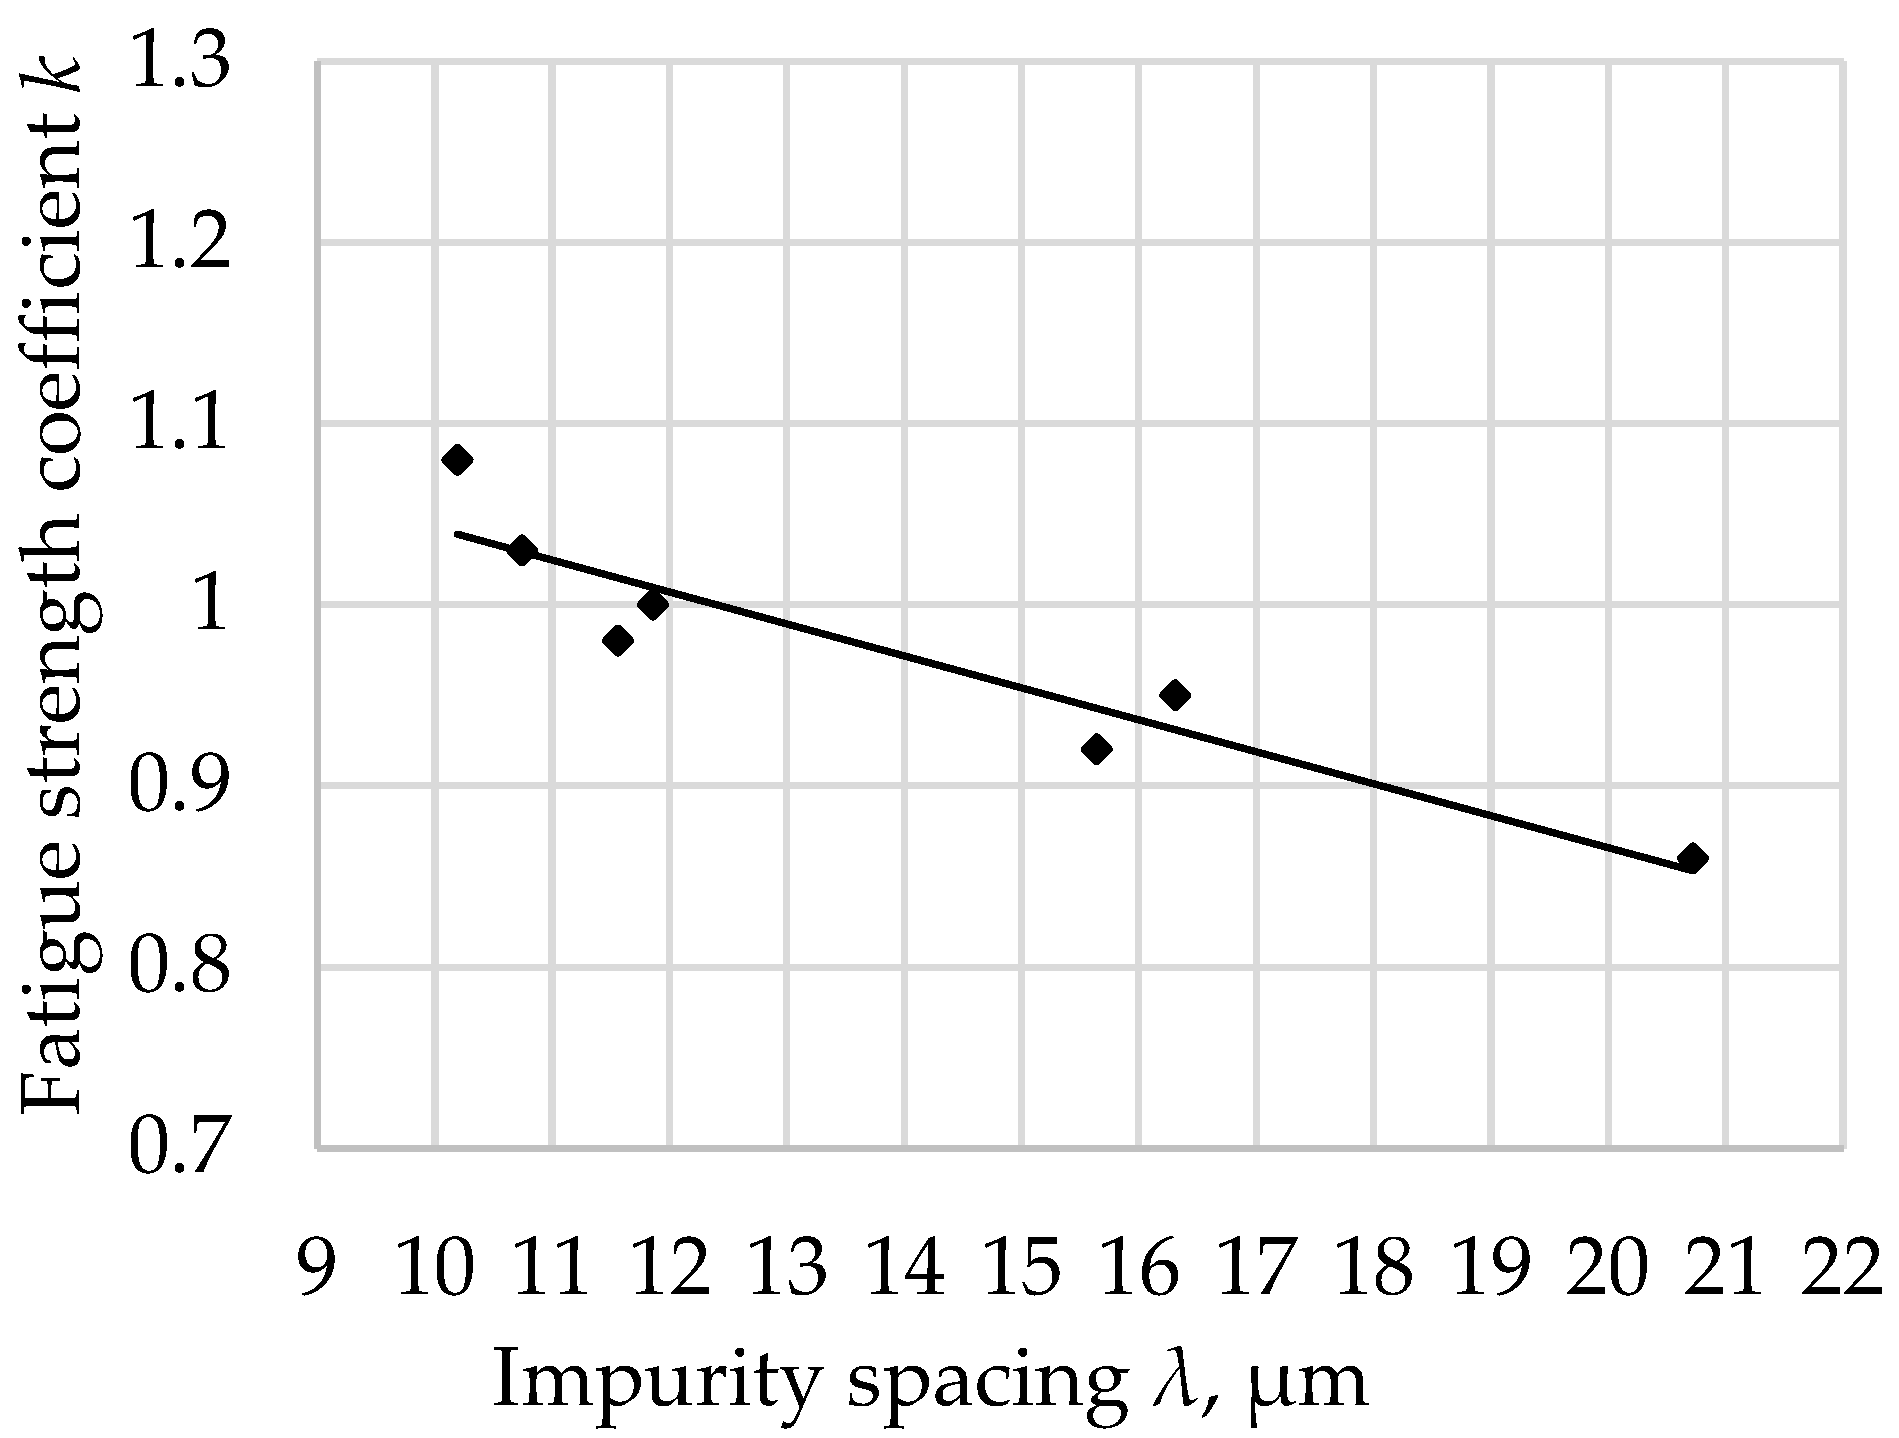
  • The fatigue resistance factor k for non-metallic inclusions with a diameter below 2 µm is inversely proportional to impurity spacing λ.

Funding

This research received no external funding.

Institutional Review Board Statement

Not applicable.

Informed Consent Statement

Not applicable.

Data Availability Statement

Not applicable.

Conflicts of Interest

The author declares no conflict of interest.

References

  1. Bricín, D.; Kříž, A. Influence of the Boriding Process on the Properties and the Structure of the Steel S265 and the Steel X6CrNiTi18-10. Manuf. Technol. 2021, 21, 37–44. [Google Scholar] [CrossRef]
  2. Hua, L.; Deng, S.; Han, X.; Huang, S. Effect of material defects on crack initiation under rolling contact fatigue in a bearing ring. Tribol. Int. 2013, 66, 315–323. [Google Scholar] [CrossRef]
  3. Dobrzański, L.A. Heat treatment as the fundamental technological process of formation of structure and properties of the metallic engineering materials. In Proceedings of the 8th Seminar of the International Federation for Heat Treatment and Surface Engineering IFHTSE, Dubrovnik-Cavtat, Croatia, 12–14 September 2001; pp. 1–12. [Google Scholar]
  4. Yanase, K.; Endo, M. Multiaxial high cycle fatigue threshold with small defects and craks. Eng. Mech. 2014, 123, 182–196. [Google Scholar]
  5. Ivanytskyj, Y.L.; Lenkovskiy, T.M.; Molkov, Y.V.; Kulyk, V.V.; Duriagina, Z.A. Influence of 65G steel microstructure on crack faces friction factor under mode fatigue fracture. Arch. Mater. Sci. Eng. 2016, 82, 49–56. [Google Scholar] [CrossRef]
  6. Blikharskyy, Y.; Selejdak, J.; Kopiika, N. Corrosion fatigue damages of rebars under loading in time. Materials 2021, 14, 3416. [Google Scholar] [CrossRef]
  7. Jonšta, P.; Jonšta, Z.; Brožová, S.; Ingaldi, M.; Pietraszek, J.; Klimecka-Tatar, D. The Effect of Rare Earth Metals Alloying on the Internal Quality of Industrially Produced Heavy Steel Forgings. Materials 2021, 14, 5160. [Google Scholar] [CrossRef]
  8. Halford, G.L. Low Cycle Thermal Fatigue; NASA: Washington, DC, USA, 1986.
  9. Lipiński, T. Influence of non-metallic inclusions on bending fatigue strength of high-quality carbon constructional steel heated in an industrial electric arc furnace. Materials 2022, 15, 6140. [Google Scholar] [CrossRef]
  10. Qayyum, F.; Umar, M.; Elagin, V.; Kirschner, M.; Hoffmann, F.; Guk, S.; Prahl, U. Influence of non-metallic inclusions on local deformation and damage behavior of modified 16MnCrS5 steel. Crystals 2022, 12, 281. [Google Scholar] [CrossRef]
  11. Suresh, S. Fatigue of Materials; Cambridge University Press: Cambridge, UK, 1998. [Google Scholar]
  12. Wang, Z.; Xing, Z.; Wang, H.; Shan, D.; Huang, Y.; Xu, Z.; Xie, F. The relationship between inclusions characteristic parameters and bending fatigue performance of 20Cr2Ni4A gear steel. Int. J. Fatigue 2022, 155, 106594. [Google Scholar] [CrossRef]
  13. Fernandes, M.; Pires, J.C.; Cheung, N.; Garcia, A. Influence of refining time on nonmetallic inclusions in a low-carbon, silicon-killed steel. Mater. Charact. 2003, 51, 301–308. [Google Scholar] [CrossRef]
  14. Lipiński, T. Effect of Non-Metallic Inclusions on the Fatigue Strength Coefficient of High-Purity Constructional Steel Heated in Industrial Conditions. Appl. Sci. 2022, 12, 9292. [Google Scholar] [CrossRef]
  15. Srivastava, A.; Ponson, L.; Osovski, S.; Bouchaud, E.; Tvergaard, V.; Needleman, A. Effect of inclusion density on ductile fracture toughness and roughness. J. Mech. Phys. Solids 2014, 63, 62–79. [Google Scholar] [CrossRef]
  16. Saberifar, S.; Mashreghi, A.; Novel, A. Method for the Prediction of Critical Inclusion Size Leading to Fatigue Failure. Metall. Mater. Trans. 2012, 43, 603–608. [Google Scholar] [CrossRef]
  17. Petrovic, D.S.; Jenko, M.; Hraes, M. Study of the morphology of non-metallic inclusions in non-oriented electrical steel containing Cu and Se. Vacuum 2003, 71, 33–40. [Google Scholar] [CrossRef]
  18. Roiko, A.; Hänninen, H.; Vuorikari, H. Anisotropic distribution of non-metallic inclusions in a forged steel roll and its influence on fatigue limit. Int. J. Fatigue 2012, 41, 158–167. [Google Scholar] [CrossRef]
  19. Zhang, L.; Pluschkell, W. Nucleation and growth kinetics of inclusions during liquid steel deoxidation. Ironmak Steelmak. 2003, 30, 106–110. [Google Scholar] [CrossRef]
  20. Gulyakov, V.S.; Vusikhis, A.S.; Kudinov, D.Z. Nonmetallic Oxide Inclusions and Oxygen in the Vacuum-Jet Refining of Steel. Steel Transl. 2012, 42, 781–783. [Google Scholar] [CrossRef]
  21. Zhou, D.G.; Fu, J.; Chen, X.C.; Li, J. Study on oxygen content, inclusions and fatigue properties of bearing steels produced by different processes. J. Univ. Sci. Technol. Beijing 2001, 8, 25–27. [Google Scholar]
  22. Moiseeva, L.A.; Moiseev, B.P. Composition, Structure, and Sources of Exogenous Inclusions in Steel. Steel Transl. 2007, 37, 607–613. [Google Scholar] [CrossRef]
  23. Senberger, J.; Zadera, A.; Cech, J. Checking the metallurgy with the aid of inclusion analysis. Arch. Foundry Eng. 2011, 11, 118–122. [Google Scholar]
  24. Luo, C.; Stahlberg, U. Deformation of inclusions during hot rolling in steels. J. Mater. Process. Technol. 2001, 114, 87–89. [Google Scholar] [CrossRef]
  25. Alatarvas, T.; Podor, R.; Heikkinen, E.; Shu, Q.; Singh, H. Revealing the Kinetics of Non-metallic Inclusion Reactions in Steel using In-situ High Temperature Environmental Scanning Electron Microscopy. Mater. Des. 2023, 112139. [Google Scholar] [CrossRef]
  26. Kiessling, R. Non-Metallic Inclusions in Steel; The Institute of Materials: London, UK, 1978. [Google Scholar]
  27. Hawryluk, M.; Lachowicz, M.; Łukaszek-Sołek, A.; Lisiecki, Ł.; Ficak, G.; Cygan, P. Structural Features of Fatigue Crack Propagation of a Forging Die Made of Chromium–Molybdenum–Vanadium Tool Steel on Its Durability. Materials 2023, 16, 4223. [Google Scholar] [CrossRef] [PubMed]
  28. Spriestersbach, D.; Grad, P.; Kerscher, E. Influence of different non-metallic inclusion types on the crack initiation in high-strength steels in the VHCF regime. Int. J. Fatigue 2014, 64, 114–120. [Google Scholar] [CrossRef]
  29. Lv, B.; Xia, S.; Zhang, F.; Yang, G.; Long, X. Comparison of Novel Low-Carbon Martensitic Steel to Maraging Steel in Low-Cycle Fatigue Behavior. Coatings 2022, 12, 818. [Google Scholar] [CrossRef]
  30. Gao, S.; Meng, H.; Wu, Y.; Wang, X.; Wang, Y.; Wu, J.; Wang, P. Examination of the Effects of Different Frequencies on Rock Fracturing via Laboratory-Scale Variable Amplitude Fatigue Loading Experiments. Appl. Sci. 2023, 13, 4908. [Google Scholar] [CrossRef]
  31. Lv, H.; Zhang, Z.; Li, J.; Liu, Y.; Chen, H.; He, H.; Cheng, J.; Chen, Y. The Effect of Process-Induced Porosity on Fatigue Properties of Ti6Al4V Alloy via High-Power Direct Energy Deposition. Coatings 2022, 12, 822. [Google Scholar] [CrossRef]
  32. Ulewicz, R.; Szataniak, P.; Novy, F. Fatigue properties of wear resistant martensitic steel. In Proceedings of the METAL 2014–23rd International Conference on Metallurgy and Materials, Brno, Czech Republic, 21–23 May 2014; pp. 784–789. [Google Scholar]
  33. Zhang, X.; Liu, F.; Shen, M.; Han, D.; Wang, Z.; Yan, N. Ultra-High-Cycle Fatigue Life Prediction of Metallic Materials Based on Machine Learning. Appl. Sci. 2023, 13, 2524. [Google Scholar] [CrossRef]
  34. Gocál, J.; Vičan, J.; Jošt, J. Real Stiffness and Fatigue Resistance of Stringer-to-Cross-Girder Connection of Riveted Steel Railway Bridges. Appl. Sci. 2023, 13, 2278. [Google Scholar] [CrossRef]
  35. Concli, F.; Maccioni, L.; Fraccaroli, L.; Cappellini, C. Effect of Gear Design Parameters on Stress Histories Induced by Different Tooth Bending Fatigue Tests: A Numerical-Statistical Investigation. Appl. Sci. 2022, 12, 3950. [Google Scholar] [CrossRef]
  36. Velázquez, J.C.; Hernández-Huerta, J.J.; Diaz-Cruz, M.; Hernández-Sánchez, E.; Cervantes-Tobón, A.; Capula-Colindres, S.I.; Cabrera-Sierra, R. Study on the Influence of Non-Metallic Inclusions on the Pitting Corrosion of API 5L X60 Steel. Coatings 2023, 13, 1040. [Google Scholar] [CrossRef]
  37. Murakami, Y. Metal Fatigue, Effects of Small Defects and Nonmetallic Inclusions; Elsevier: Oxford, UK, 2002; pp. 57–115. [Google Scholar]
  38. Lipiński, T. Influence of the Scatter Index of Non-Metallic Inclusions in Structural Steel on the Fatigue Resistance Coefficient. Materials 2023, 16, 2758. [Google Scholar] [CrossRef]
  39. Jovičević-Klug, P.; Jovičević-Klug, M.; Rohwerder, M.; Godec, M.; Podgornik, B. Complex Interdependency of Microstructure, Mechanical Properties, Fatigue Resistance, and Residual Stress of Austenitic Stainless Steels AISI 304L. Materials 2023, 16, 2638. [Google Scholar] [CrossRef]
  40. Lipiński, T. Effect of Impurities Spacing on Fatigue Strength Coefficient. Coatings 2023, 13, 242. [Google Scholar] [CrossRef]
  41. Bermond, A.; Roume, C.; Stolarz, J.; Lenci, M.; Carton, J.-F.; Klocker, H. Low Cycle Fatigue of G20Mn5 Cast Steel Relation between Microstructure and Fatigue Life. Materials 2022, 15, 7072. [Google Scholar] [CrossRef]
  42. Lipiński, T.; Ulewicz, R. The effect of the impurities spaces on the quality of structural steel working at variable loads. Open Eng. 2021, 11, 233–238. [Google Scholar] [CrossRef]
  43. Murakami, Y.; Kodama, S.; Konuma, S. Quantitative evaluation of effects of non-metallic inclusions on fatigue strength of high strength steels, I: Basic fatigue mechanism and fatigue fracture stress and the size and location of non-metallic inclusions. Int. J. Fatigue 1989, 11, 291–298. [Google Scholar] [CrossRef]
  44. Kocańda, S. Fatigue Failure of Metals; WNT: Warsaw, Poland, 1985. (In Polish) [Google Scholar]
  45. Guide engineer. Mechanic; Scientific and Technical Publishing: Warsaw, Poland, 1970. (In Polish) [Google Scholar]
  46. PN-74/H-04327; Metals Testing for Fatigue. Axial Tensile-Compression Test at a Constant Cycle of External Loads. Polish Committee for Standardization: Warsaw, Poland, 1974.
Figure 1. Non-metallic inclusions for two heats.
Applsci 13 08354 g001
Figure 2. The relative volume of inclusions for different dimensional ranges of impurities.
Applsci 13 08354 g002
Figure 3. Average impurity diameter for different dimensional ranges of impurities.
Applsci 13 08354 g003
Figure 4. Impurity spacing λ for different dimensional ranges of impurities.
Applsci 13 08354 g004
Figure 5. Impurity spacing λ for volume of non-metallic inclusions.
Applsci 13 08354 g005
Figure 6. The bending fatigue strength coefficient k of tested steel after hardening and tempering at 200 °C depends on impurity spacing.
Applsci 13 08354 g006
Figure 7. The bending fatigue strength coefficient k of tested steel after hardening and tempering at 300 °C depends on impurity spacing.
Applsci 13 08354 g007
Figure 8. The bending fatigue strength coefficient k of tested steel after hardening and tempering at 400 °C depends on impurity spacing.
Applsci 13 08354 g008
Figure 9. The bending fatigue strength coefficient k of tested steel after hardening and tempering at 500 °C depends on impurity spacing.
Applsci 13 08354 g009
Figure 10. The bending fatigue strength coefficient k of tested steel after hardening and tempering at 600 °C depends on impurity spacing.
Applsci 13 08354 g010
Figure 11. The bending fatigue strength coefficient k of tested steel after hardening and tempering for all tempering temperatures depends on impurity spacing.
Applsci 13 08354 g011
Table 1. Average chemical composition of tested steel from seven heats [wt.%].
Chemical ElementCSiMnPSCrNiMoCuB
Contents0.20–0.250.22–0.321.05–1.400.014–0.240.010–0.0160.43–0.550.42–0.500.20–0.250.13–0.170.002–0.004
Standard deviation0.0170.0460.1230.00390.00360.0560.0400.0160.0140.0008
Table 2. Maximum load during the test depending on the tempering temperature.
Tempering Temperature, °C200300400500600
Vickers hardness, HV432412372333275
Maximum load, MPa650600600600540
Disclaimer/Publisher’s Note: The statements, opinions and data contained in all publications are solely those of the individual author(s) and contributor(s) and not of MDPI and/or the editor(s). MDPI and/or the editor(s) disclaim responsibility for any injury to people or property resulting from any ideas, methods, instructions or products referred to in the content.

