1. Introduction
Machine learning has become a staple in several fields and industries, most prominently in the field of medicine. Applications in medicine include but are not limited to Anti-cancer Drug Discovery [
1], screening and diagnosis of diabetes [
2], HIV clinical research and care [
3], medical image analysis [
4], automated seizure detection [
5], and COVID-19 pandemic mitigation [
6,
7]. Discovering patterns in large datasets and the consequential information gain that allows experts in multiple fields of medicine to apply those findings to save lives is an indispensable quality, especially in this day and age where big data is becoming the standard data quantity [
8].
While machine learning provides a clear solution to an enormous problem, it does so at a cost. The transparency and the ability to explain the decisions behind all black-box models is a challenge that is being tackled and intensely studied in over recent years under the umbrella term explainable as artificial intelligence (XAI) [
9]. The aim of XAI is to add an explanation and a layer of transparency to models that are inherently black-box and therefore do not enable the user to infer the logic behind the decisions made by the model. On the other hand, XAI also promotes the usage and development of white-box models [
10] that, by default, enable the user to grasp the idea behind the decision. The white-box machine learning approach focuses on developing transparent and interpretable models, allowing humans to understand and validate their decision-making process. By examining internal variables, coefficients, or rules, researchers gain insights into how and why predictions are made. This approach facilitates model debugging, error analysis, and bias identification, enhancing performance and fairness. It is particularly useful in domains like medicine and finance, where interpretability is crucial for regulatory compliance and ethical considerations. The white-box approach promotes transparency, accountability, and trustworthiness in machine learning systems. White-box models differ by the type of visualization and the possibility of interaction and allow professionals in the domain of application to visualize and, if possible, interact with the resulting model.
In software development, various methods promote efficient, robust, and agile development. Among those, the most prevalent principle is the agile development process [
11] which can be applied to almost any area of interest where there is a need to be able to quickly, efficiently, robustly, and continuously develop or manage a solution. Because the main aim of the agile development process is software development, it is worth noting that all machine learning algorithms are software and that a system consisting of several software components is still software. Agility, speed, and adaptation are the most prevalent needs in medical systems when agile as a process is concerned [
12]. Introducing this popular software development principle to the area of white-box machine learning algorithms and, with this, allowing medical experts to ad hoc improve on the final model presents a unique possibility for expert knowledge infusion into the end models.
The development of an agile machine learning expert-driven framework is highly dependent on the white-box algorithm and its representation of the model, the need for XAI in the field of application, and the expertise of the end user concerning the train data. Data canyons were the applied machine learning white-box model because they provide a graphical explanation layer that can be easily understood and interpreted. Additionally, Data canyons allow easy manipulation of attributes and their inclusion or restriction while offering a clear instance-based visualization of instance alignment. Medicine presents a field of application of machine learning algorithms where there is a great need for XAI because of the high-risk decision-making nature of the domain. Providing that the end user of the agile framework is an expert in the domain of application, the framework presents a great potential for creating new expert-infused machine learning models. All three presented parts are equally important for the development of an agile machine learning framework. Without an intuitive and transparent white-box model, the expert cannot easily understand and manipulate the model. If the field of application has no inherent need for transparency and the decision-making process has low risks associated with it, there is no need for white-box machine learning algorithms or agile expert-infused models. Lastly, if the user is not a domain expert, his knowledge and experiences cannot be infused into the final model.
The field of XAI is gradually gaining traction, as evidenced by the increasing number of publications in recent years. A literature search conducted on Scopus using the term “explainable artificial intelligence” revealed that the most relevant subject area for its application is medicine, preceded by computer science, engineering, and mathematics, which primarily focus on method development. Within the domain of medicine, a significant majority (over 90%) of the publications have been published within the last 3 years, indicating a current and pressing interest in this area. Notably, one highly cited article has expressed concerns regarding the limitations of existing XAI approaches [
13], while other relevant articles have primarily focused on showcasing XAI applications in medicine. However, the inclusion of the term “agile” in the search string did not yield any results, suggesting a lack of research on agile frameworks for XAI in the context of medicine. This literature survey highlights the currency and relevance of XAI in medicine and indicates the need for further advancements and novel approaches in this domain, including the exploration of agile methodologies.
The aim of this paper is to present the process of continuous improvement of a novel white-box machine learning algorithm, namely Data canyons, using agile medical expert interaction. Data canyons allow for a unique presentation of the created model that enables experts to interpret the model as such and manipulate it based on their own understanding and expert knowledge in order to better understand the dynamics of the attributes interaction and to infuse their knowledge that lies outside of the boundaries of the used data. This approach combines XAI’s objectives and agile development principles to form a symbiotic human–computer machine learning agent. In this test scenario, a labeled dataset using patient bloodwork obtained during infarction and reinfarction was used to create a model to classify the possibility of reinfarction.
2. Materials and Methods
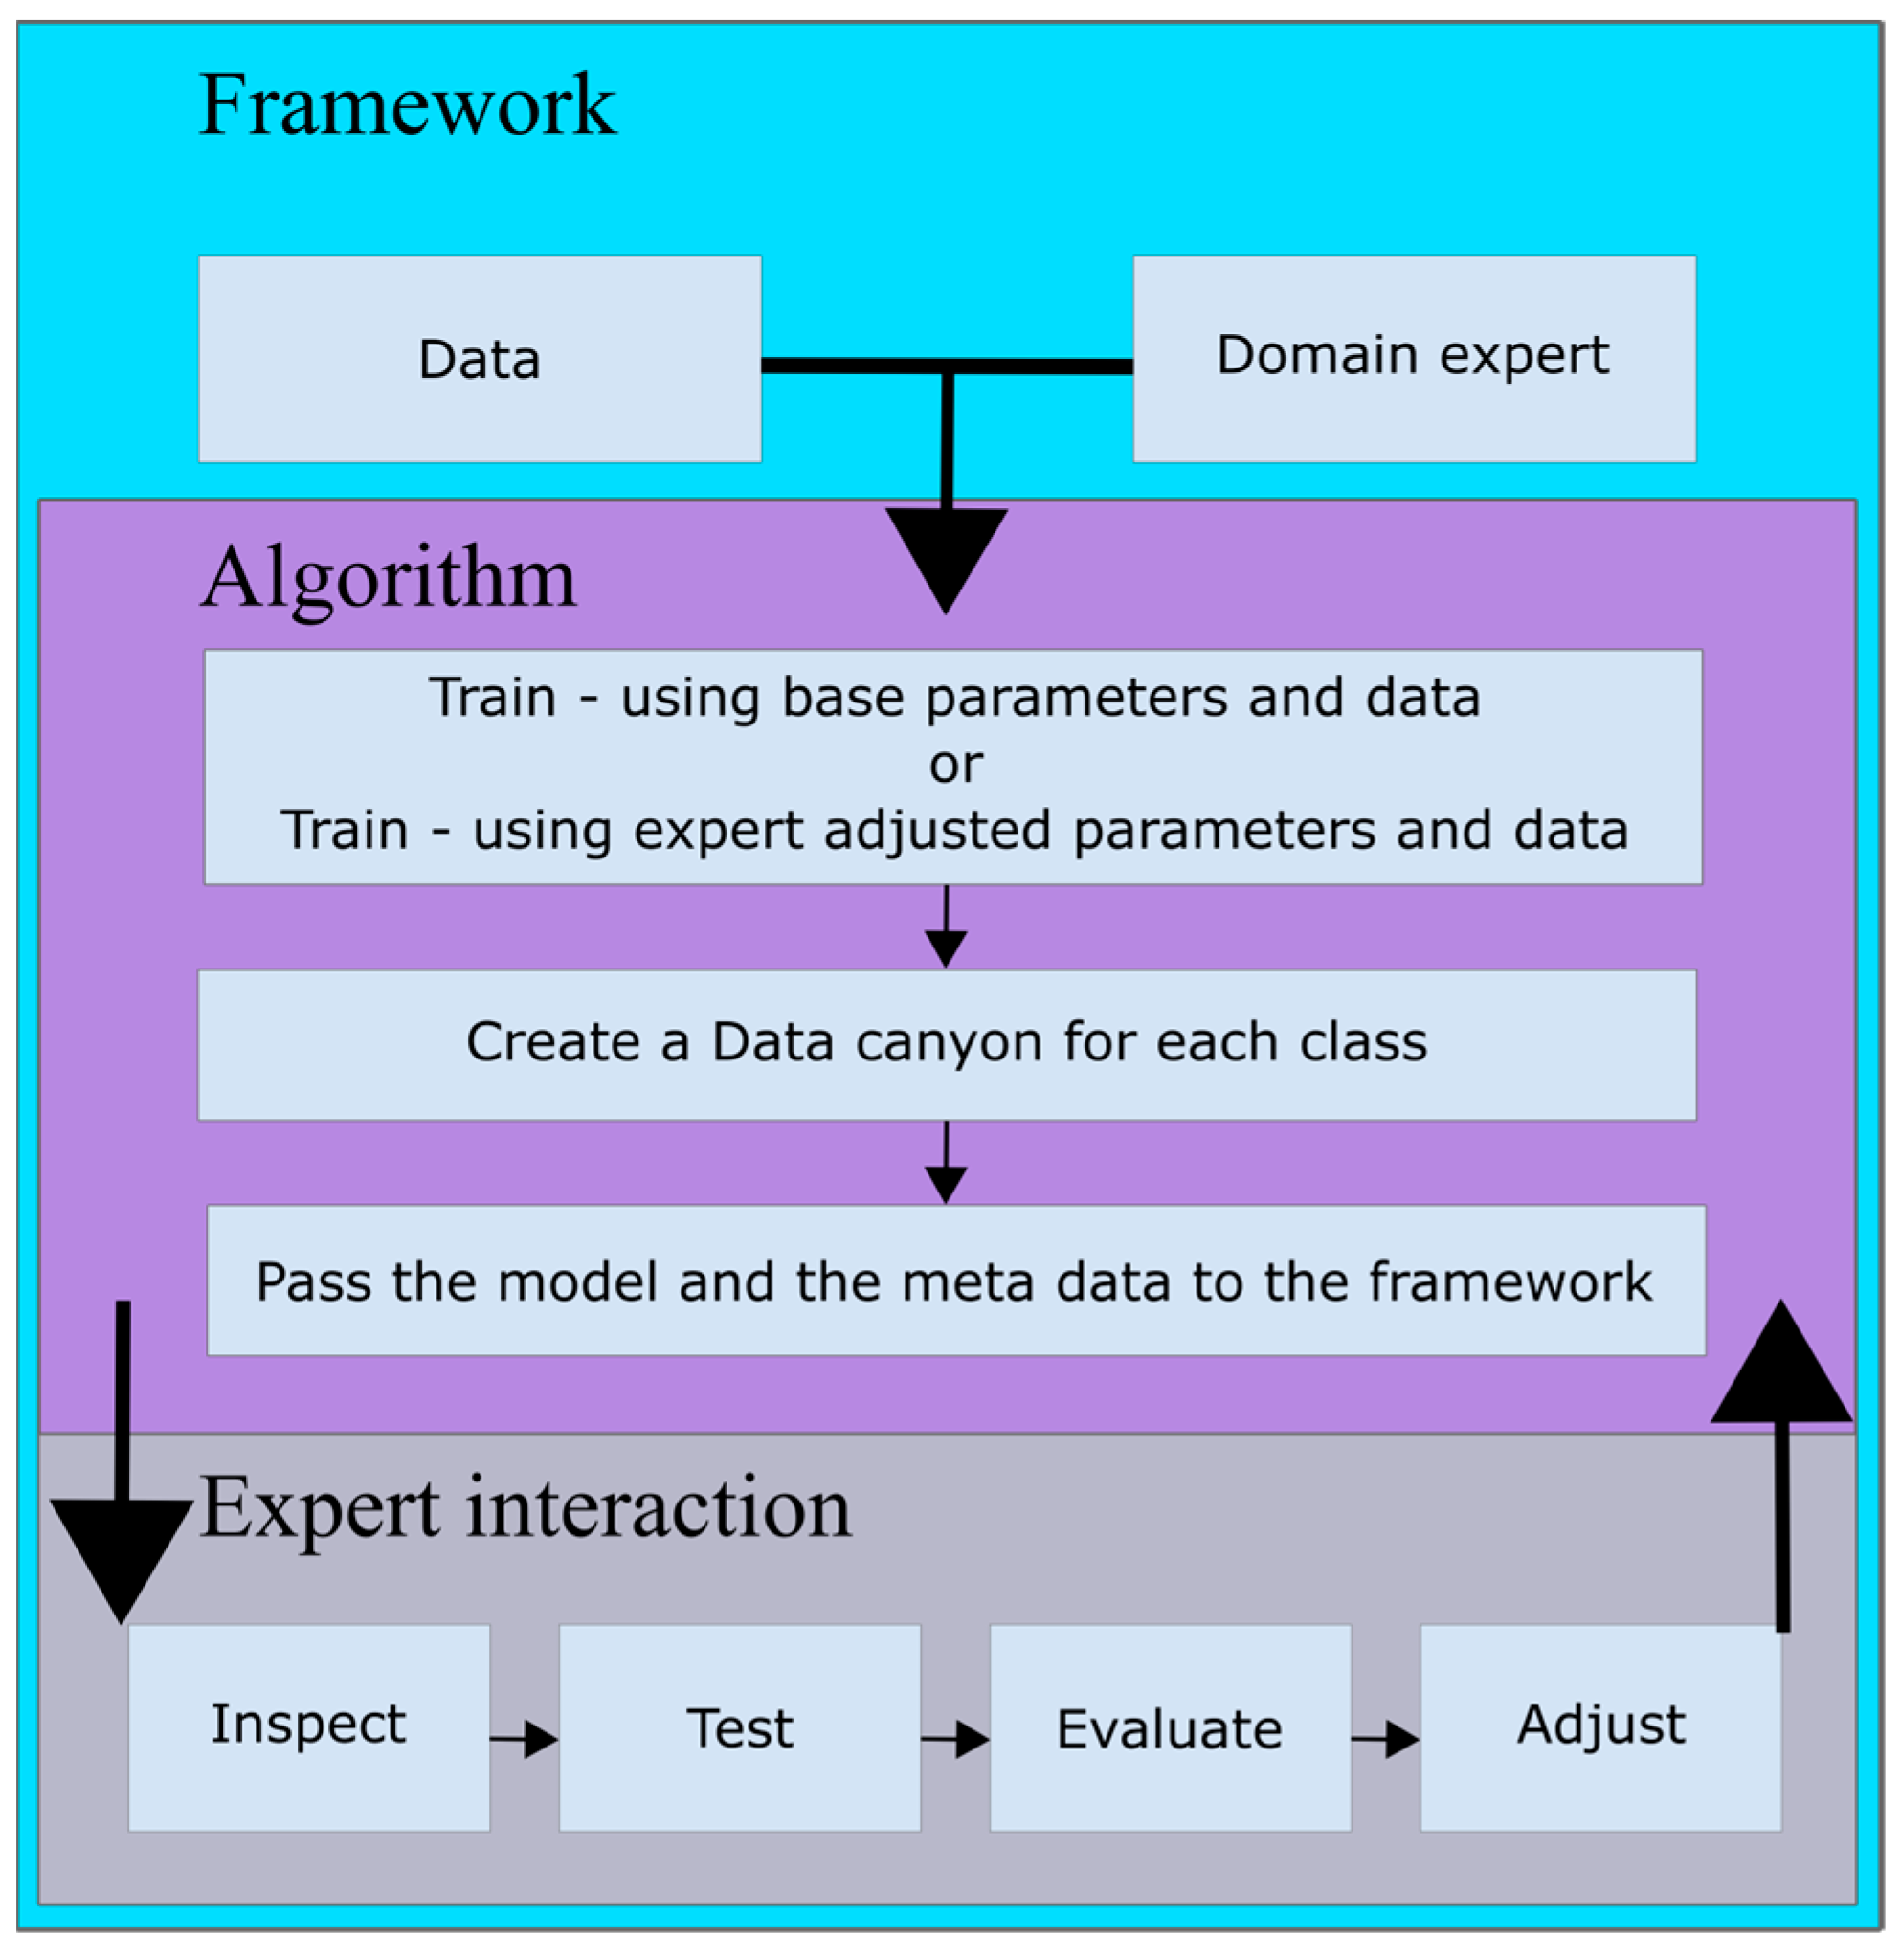
The presented framework encompasses two main parts: the white-box machine learning model and the interactive visualization and manipulation user interface, as can be seen in
Figure 1. The domain expert provides the data to the machine learning algorithm. In the first instance, the algorithm runs with the base parameters and with all parameters. The algorithm separately creates a canyon for each class using the provided data and parameters. The stored metadata and the model are forwarded to the visualization and manipulation user interface. The expert can then visually inspect the canyons through the interactive 3D plots for all canyons. The canyons can be easily rotated and enlarged. Individual instances can be viewed in the canyons to test how they relate to each canyon. The expert can evaluate the results through the visual inspection, testing of instances, and standard metrics and can then adjust the inclusion of attributes and the parameters of the machine learning algorithm and start a new phase.
2.1. The Data
The data for presenting the approach of expert-driven agile machine learning model creation were gathered from University Medical Centre Maribor, which is a Slovenian-based non-profit public health care institute performing health care services on the secondary and tertiary level. The data were anonymized, and the ethical comity of University Medical Centre Maribor authorized the use of the data. The data in question consist of detailed blood work of patients, including the diagnosis. To examine a meaningful case, we focused on a subset of this data, where the aim was to distinguish between people with infarction and people with reinfarction. The final dataset consists of 2274 entries, of which 308 are examples of reinfarctions. Each entry consists of 8 attributes: age, gender, S-Lp(a), S-cholesterol, S-HDL-cholesterol, S-LDL-cholesterol, S-triglycerides, and whether or not it is classified as reinfarction.
2.2. Data Canyons
As the aim of this article is to present the symbiotic cooperation between computer science, medical expertise, and an agile approach to manipulation and improvement of the output machine learning model, we will only briefly introduce Data canyons to understand the underlying logic and the visualization concept. Data canyons are a novel machine learning approach with a human-interpretable output model. Because it is inherently interpretable, it aligns well with the concepts of XAI. As the name suggests, the concepts of Data canyons are derived from the natural phenomenon of river canyons. The idea of transferring nature’s concepts into machine learning is not new; there are several concepts and algorithms of machine learning and AI that owe their existence to nature [
14,
15].
The base elements of the natural phenomenon, namely a river canyon, which were utilized in the machine learning algorithm were the river stream, the land mass, and time. The test data represent the river stream and are, throughout the algorithm, referred to as the data stream. The land mass is represented via a 3D surface plot where we represent the terrain of the canyon. What remains is the element of time which, in the case of Data canyons, is represented via the iterative processing of each data instance as a separate data stream in the given time frame. Data canyons are created for each class separately. For n classes, the output gives us n Data canyons.
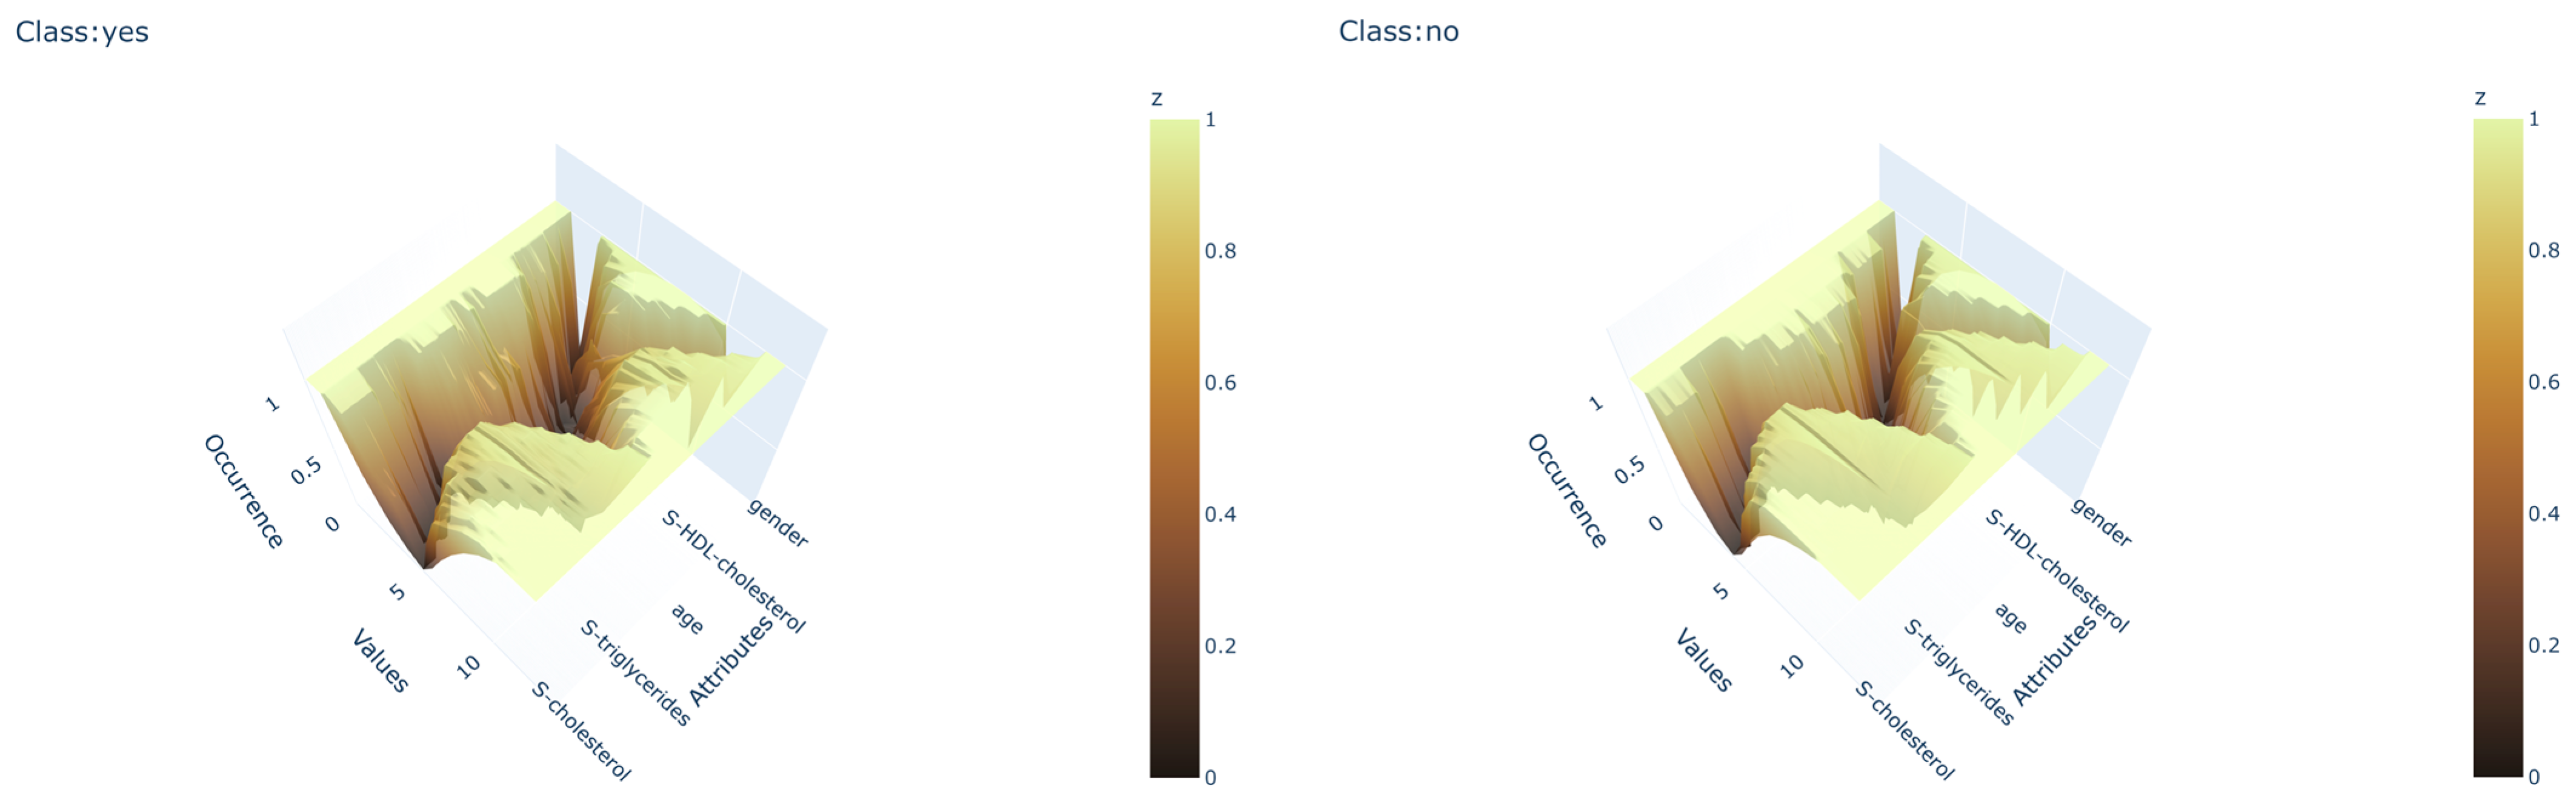
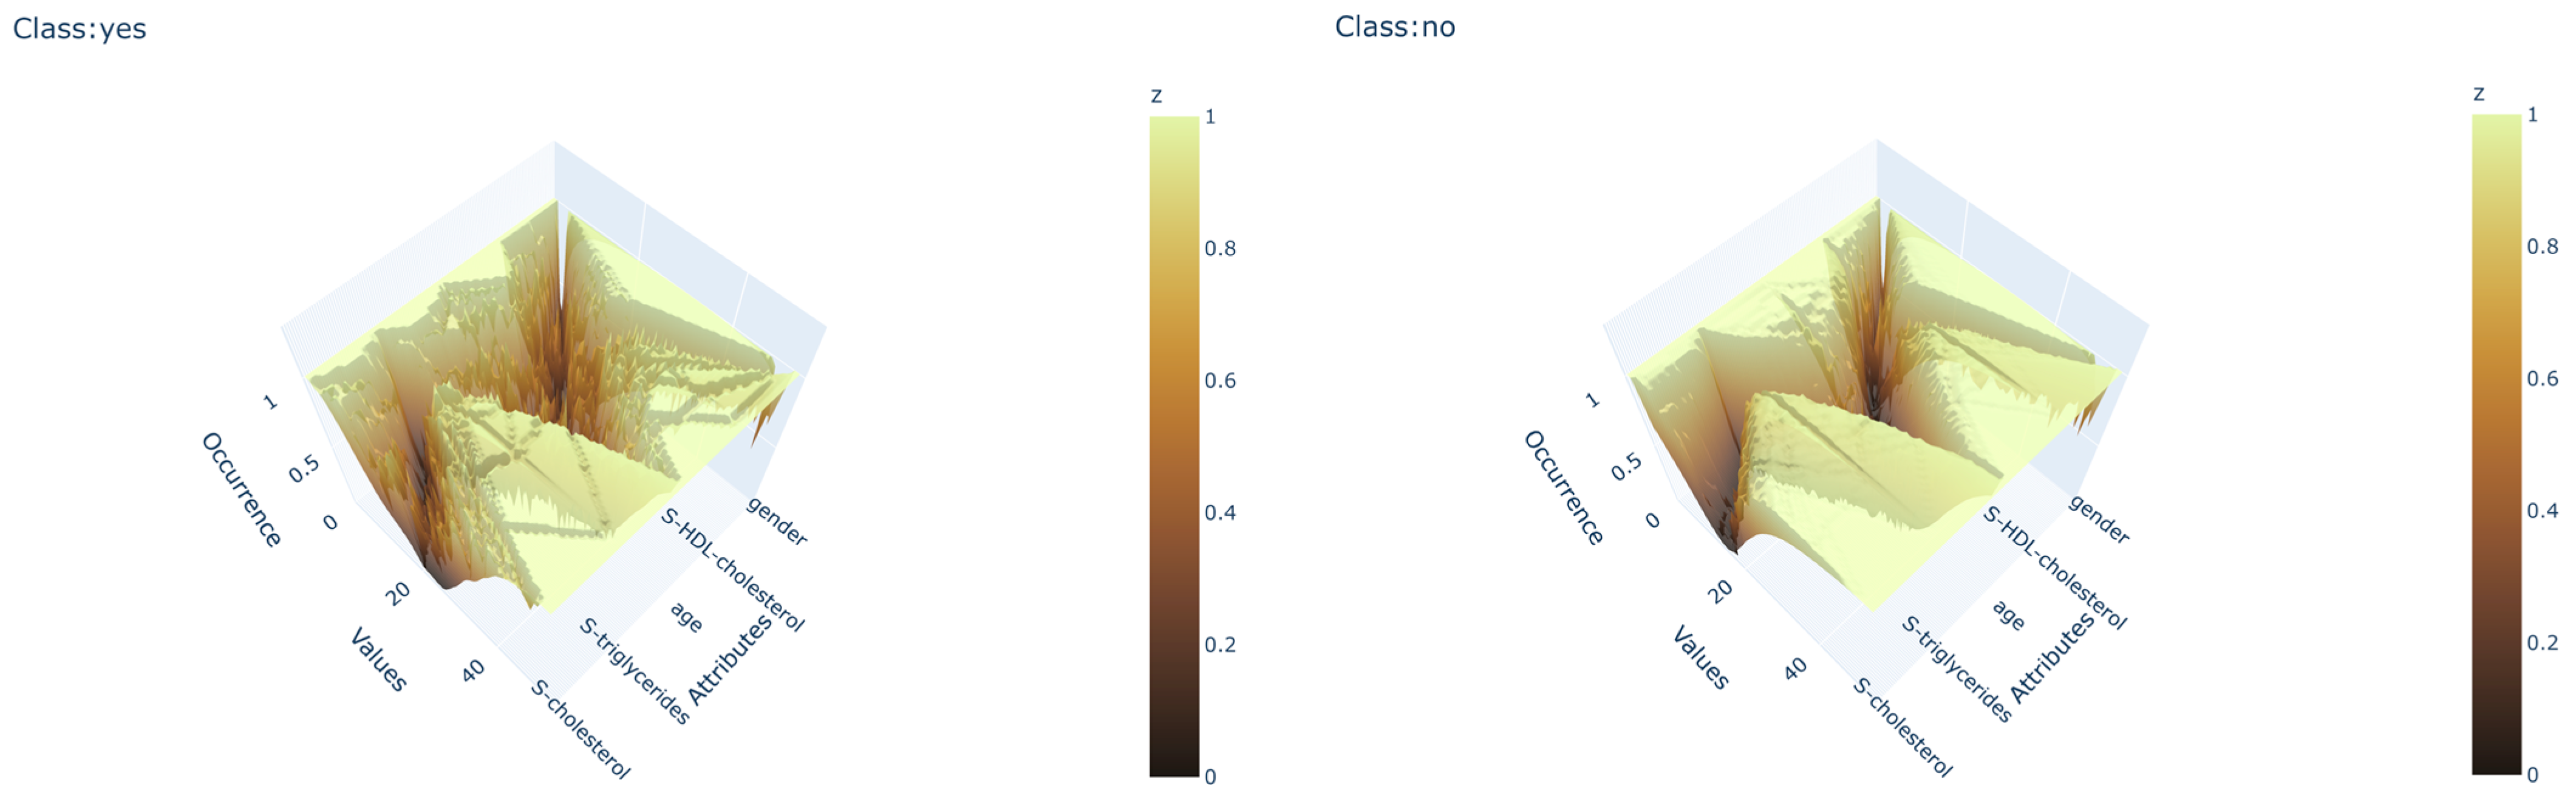
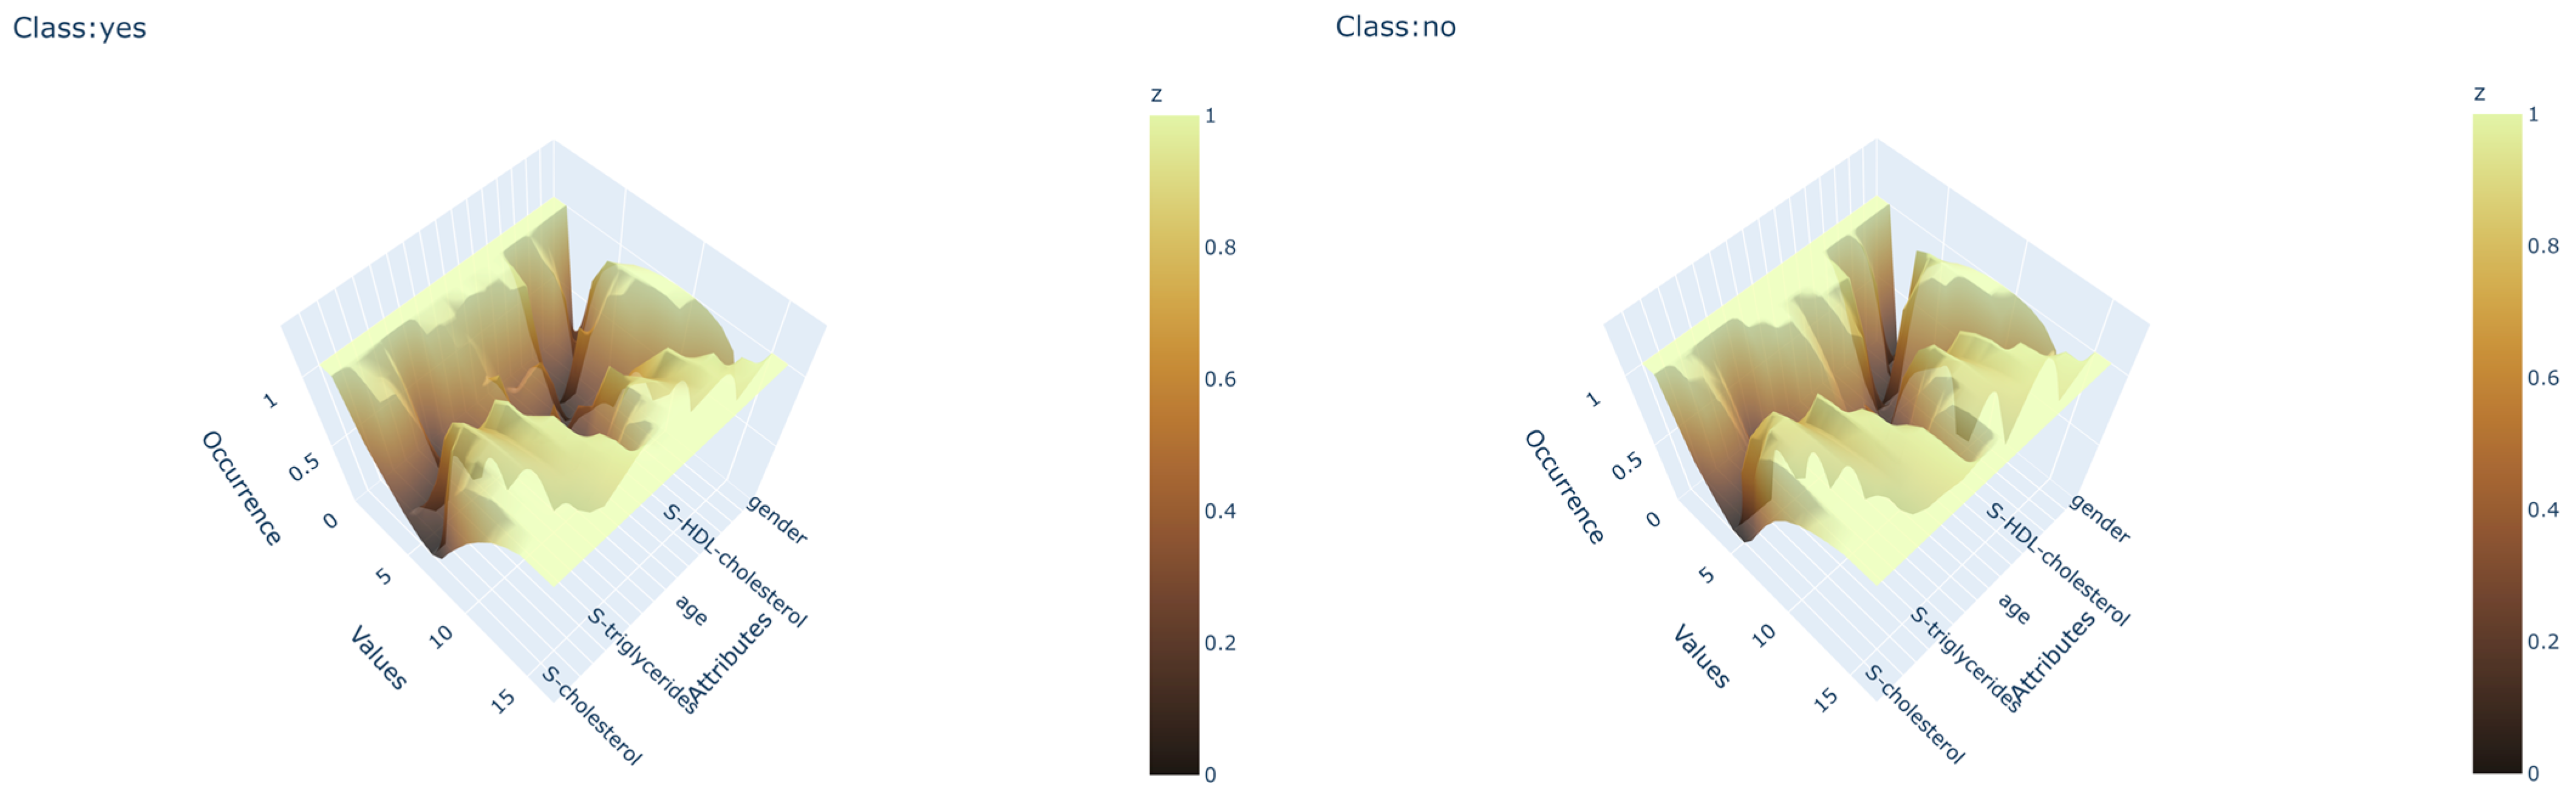
All Data canyons consist of sections that represent the sequential attributes from the train data and can be thought of as cross sections of the canyon that are sequentially equidistant. The terrain of the Data canyon sections is created for each attribute separately, measuring the occurrences of values between the maximum and minimum values of the current attribute. The bridging of the distance between adjoining attributes is created using the same principle as the attribute sections, except that the value is dictated by the connection between the two values of the adjoining attributes. There are two main variables that can be set to fine-tune the performance of the canyons, the length between adjoining attributes, and the width of the canyon. The length between attributes increases or decreases the emphasis on the importance of the connection between two parameters. Longer distance puts the emphasis on the connection between two parameters. A shorter distance puts the emphasis on the values of the sections. The width parameter controls the amount of detail the canyon should capture. Wider canyons focus on more detail, while narrow canyons focus on the higher abstraction of parameters. The difference in the changes of the output canyons, if the main attributes of the canyons are focused on length and width or are neutral, can be observed in
Figure 2,
Figure 3 and
Figure 4.
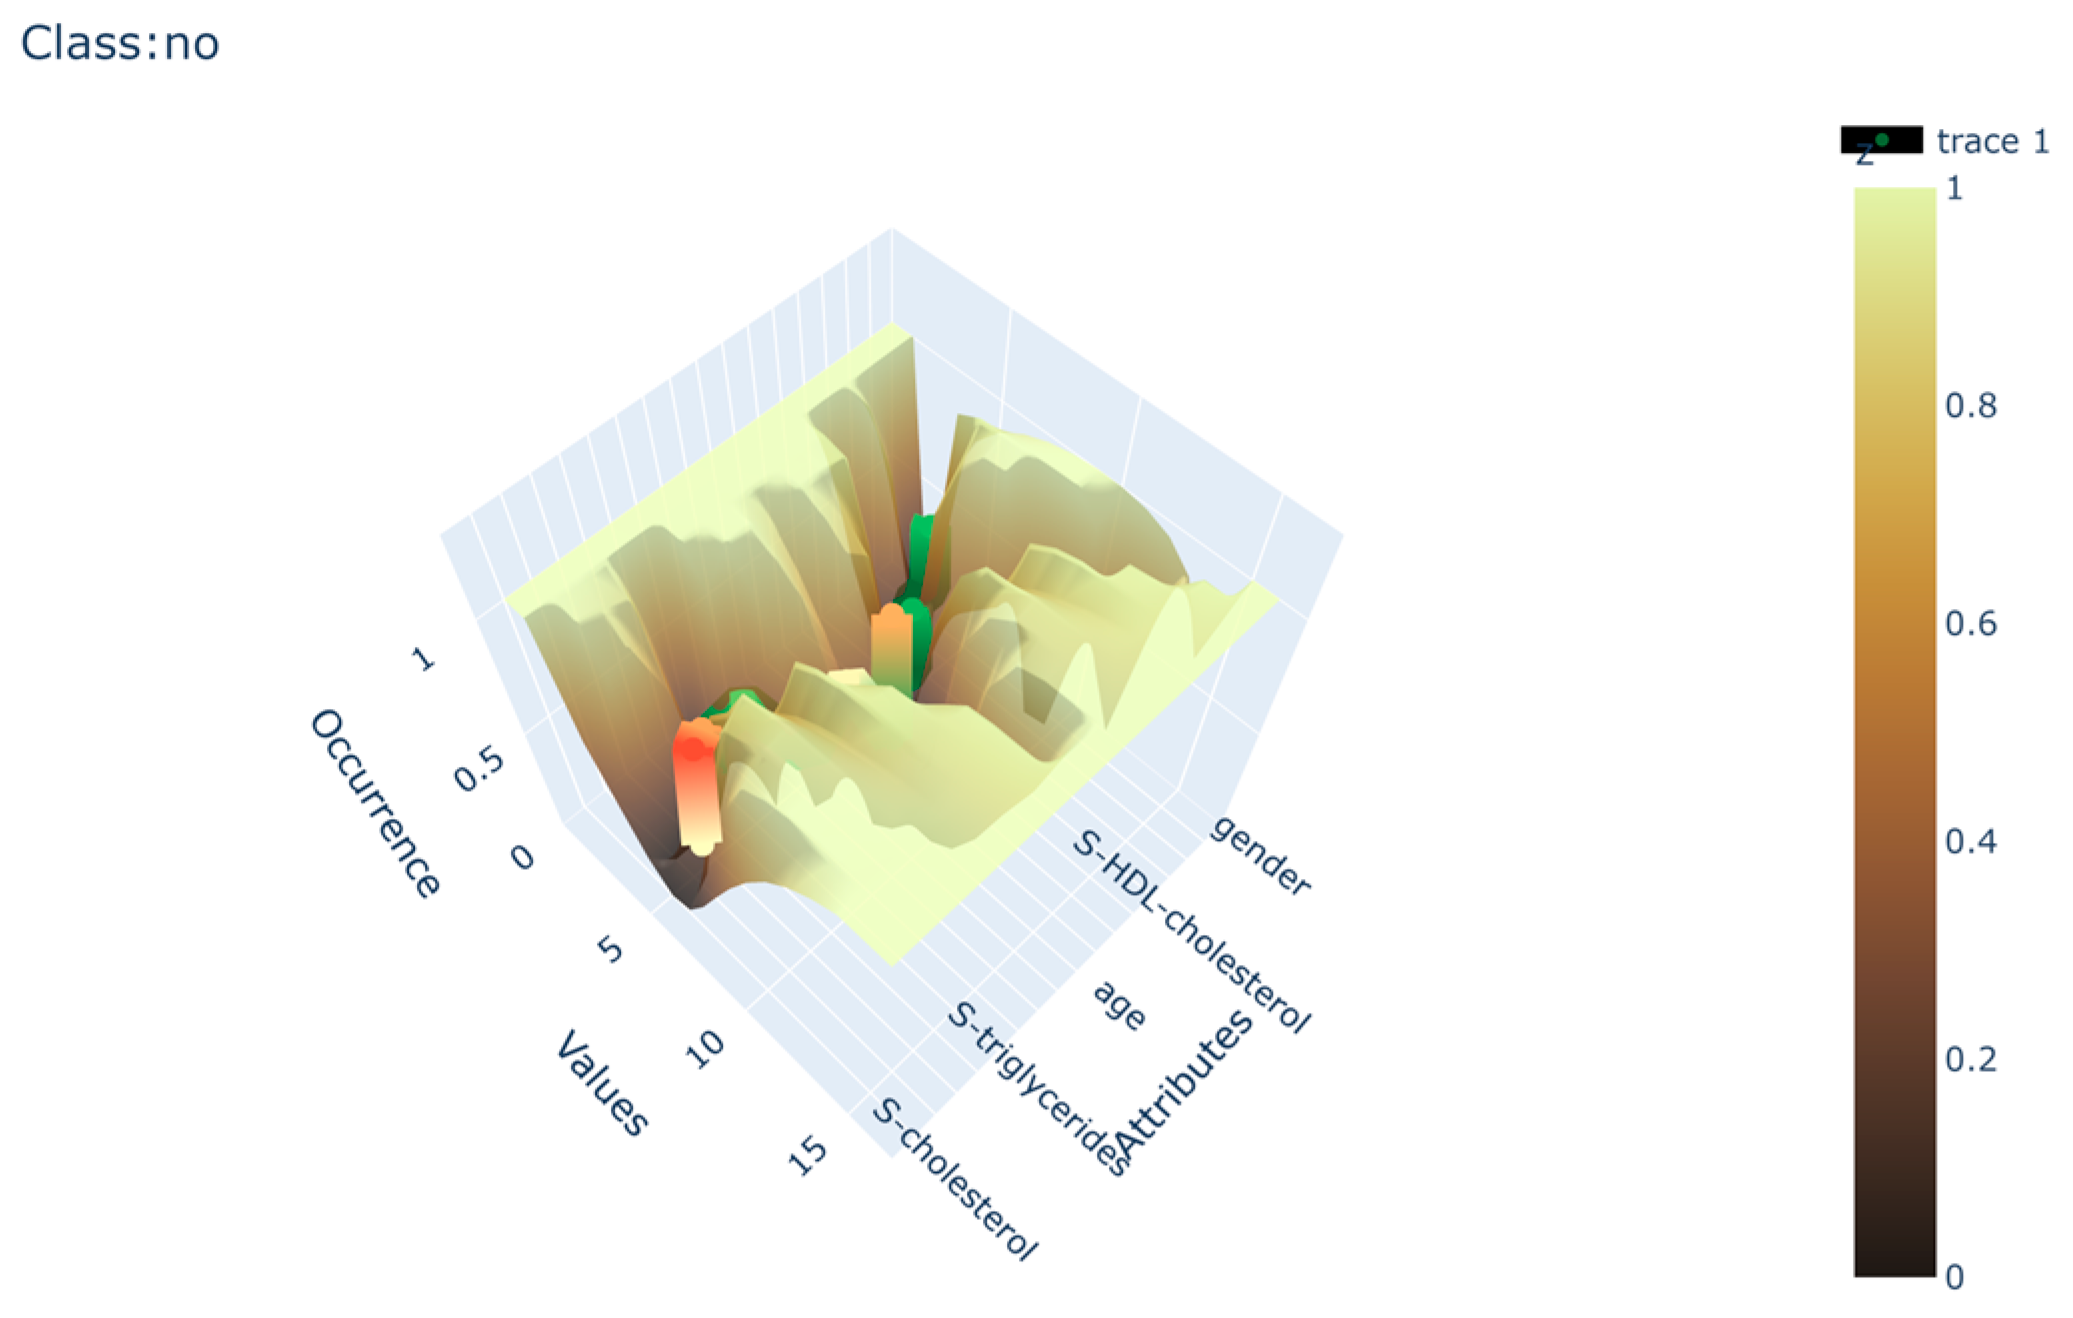
The algorithm gives a visual output of the model in the form of a 3D surface plot where the depth is presented using gradient color changes to mimic the natural appearance of canyons. The depth of each Data canyon presents the occurrence of attribute values in the given area of the canyon. The width and depth are normalized to minimize the influence of unbalanced datasets on the final output. This visualization technique presents the end user with the ability to visually compare any given instance correlation to the output canyons in the form of a color-coded scatter plot. The scatter plot is similar to the canyon coded with a gradient except that there is an interchange from green to red and vice versa, where green presents a perfect fit to the canyon and red a complete mismatch. An example can be seen in
Figure 5.
Data canyons provide an objective method to adjust parameters according to the expert’s knowledge, the visualization of output models, the correlation between the canyon and any given instance, and regular metrics [
16] for algorithms of machine learning.
2.3. Visualization Framework and Explainability
The base Data canyon algorithm is written in Python [
17], where the visualization is performed using Plotly [
18] and Dash [
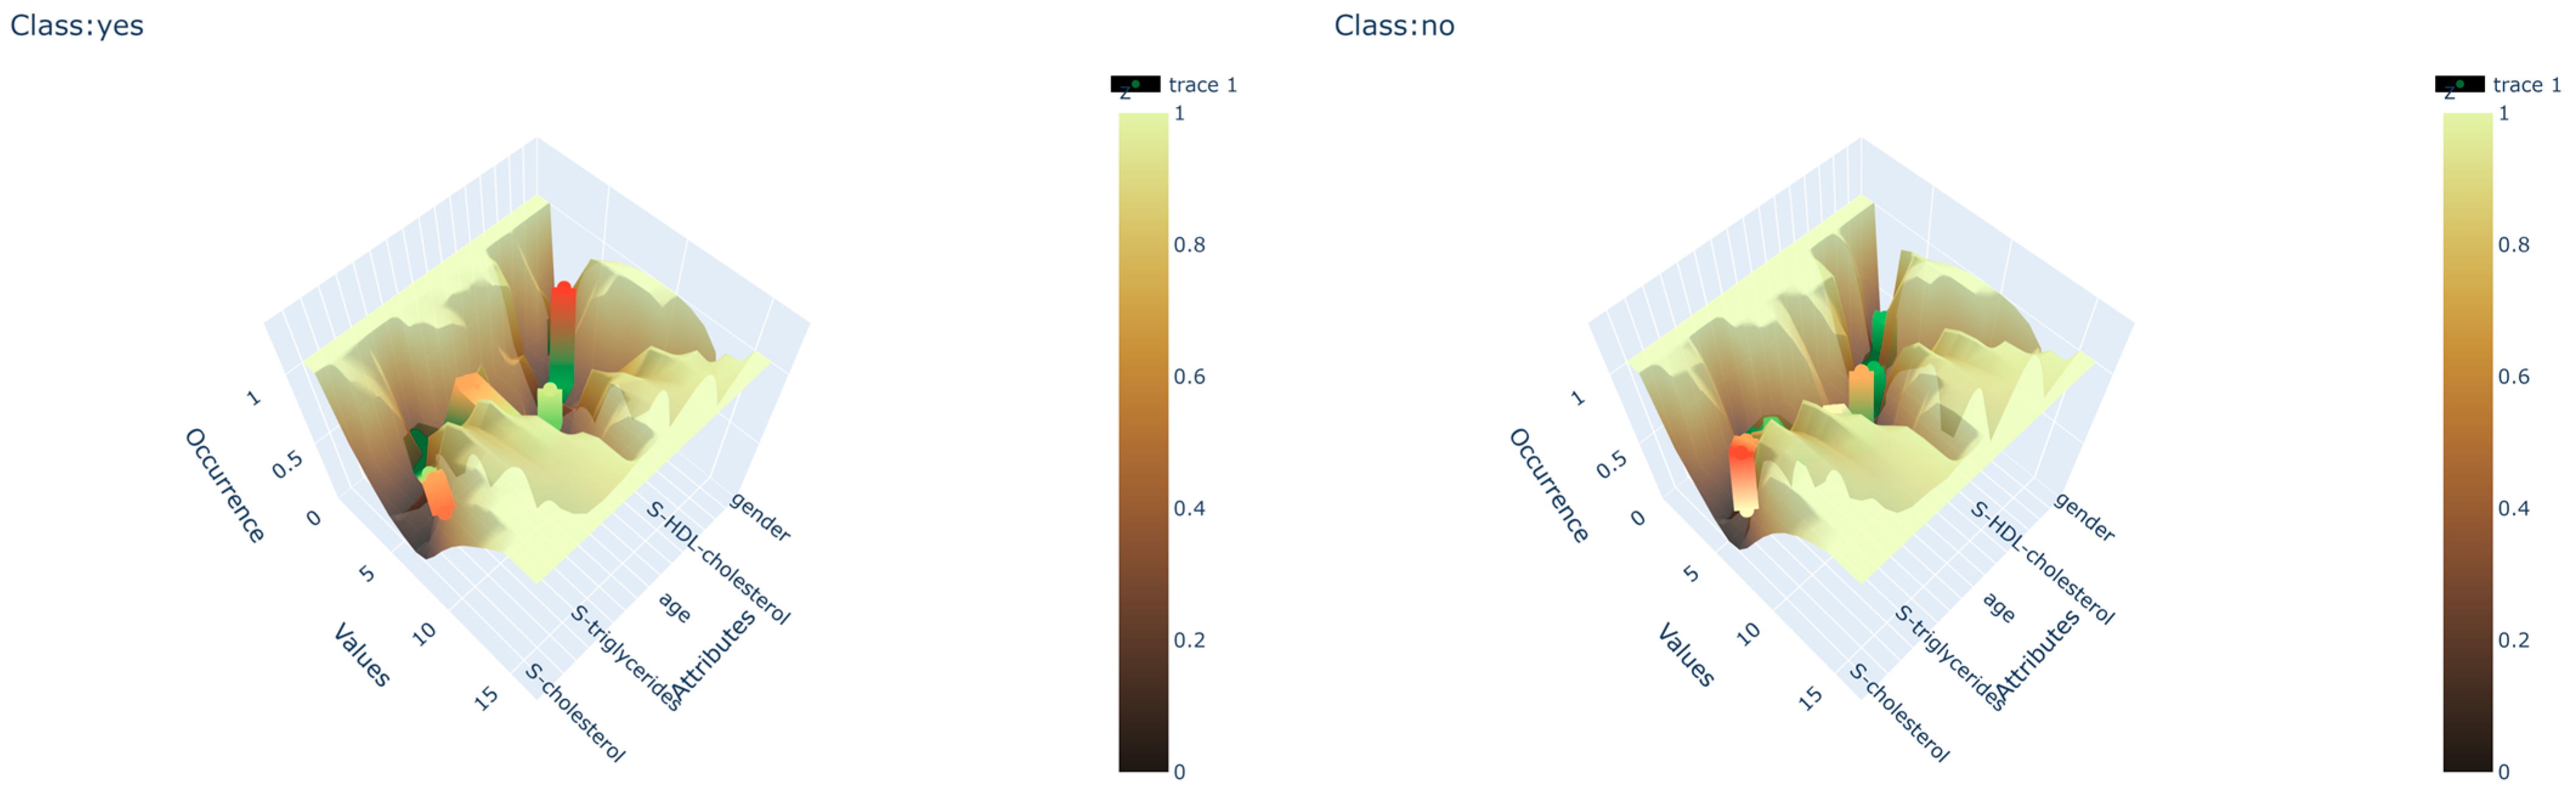
19]. Plotly is a Python graphing library that enables data scientists to create complex interactive graphs. Dash, on the other hand, is a framework for the rapid development of data apps in several programming languages that allows for a full-stack web app development with interactive data visualization. The usage of Plotly and Dash enables data scientists to quickly and dynamically represent data and create an additional layer of interaction for the end user. The utilization of those technologies enabled the creation of the interactive platform used to visualize and manipulate the model of Data canyons. The interface can be hosted as a local web page or as a regular web page that can be accessed via the web address, depending on the needs of the end user. The main areas on the web page focus on the interactive presentation of the model and the correlation between the given test instance and the bed of the Data canyons, as shown in
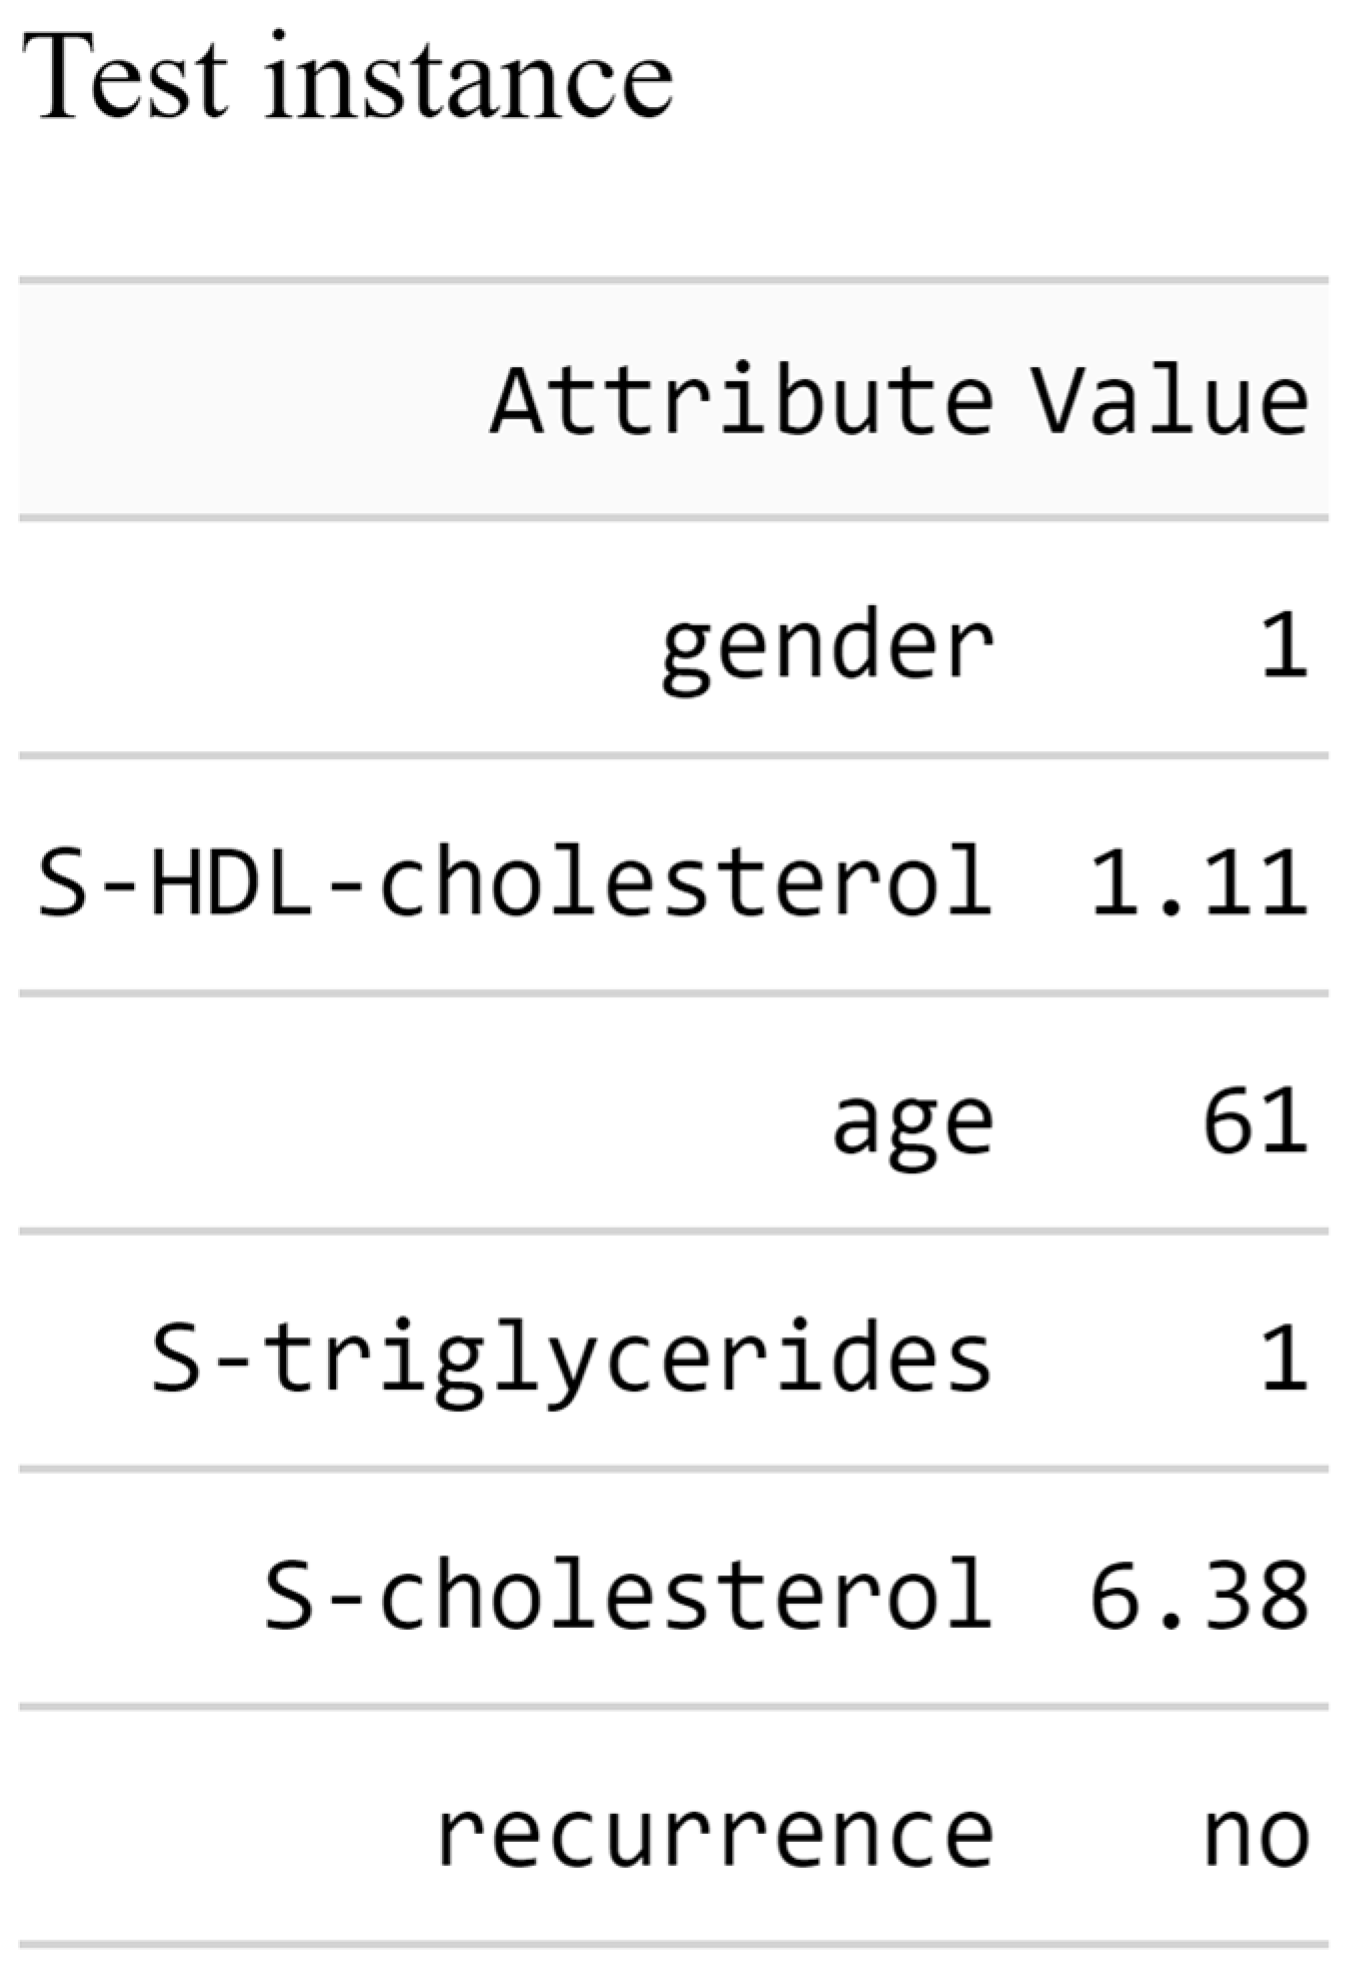
Figure 6. The metadata of the test instance is also presented to provide the experts with a comprehensive picture, as seen in
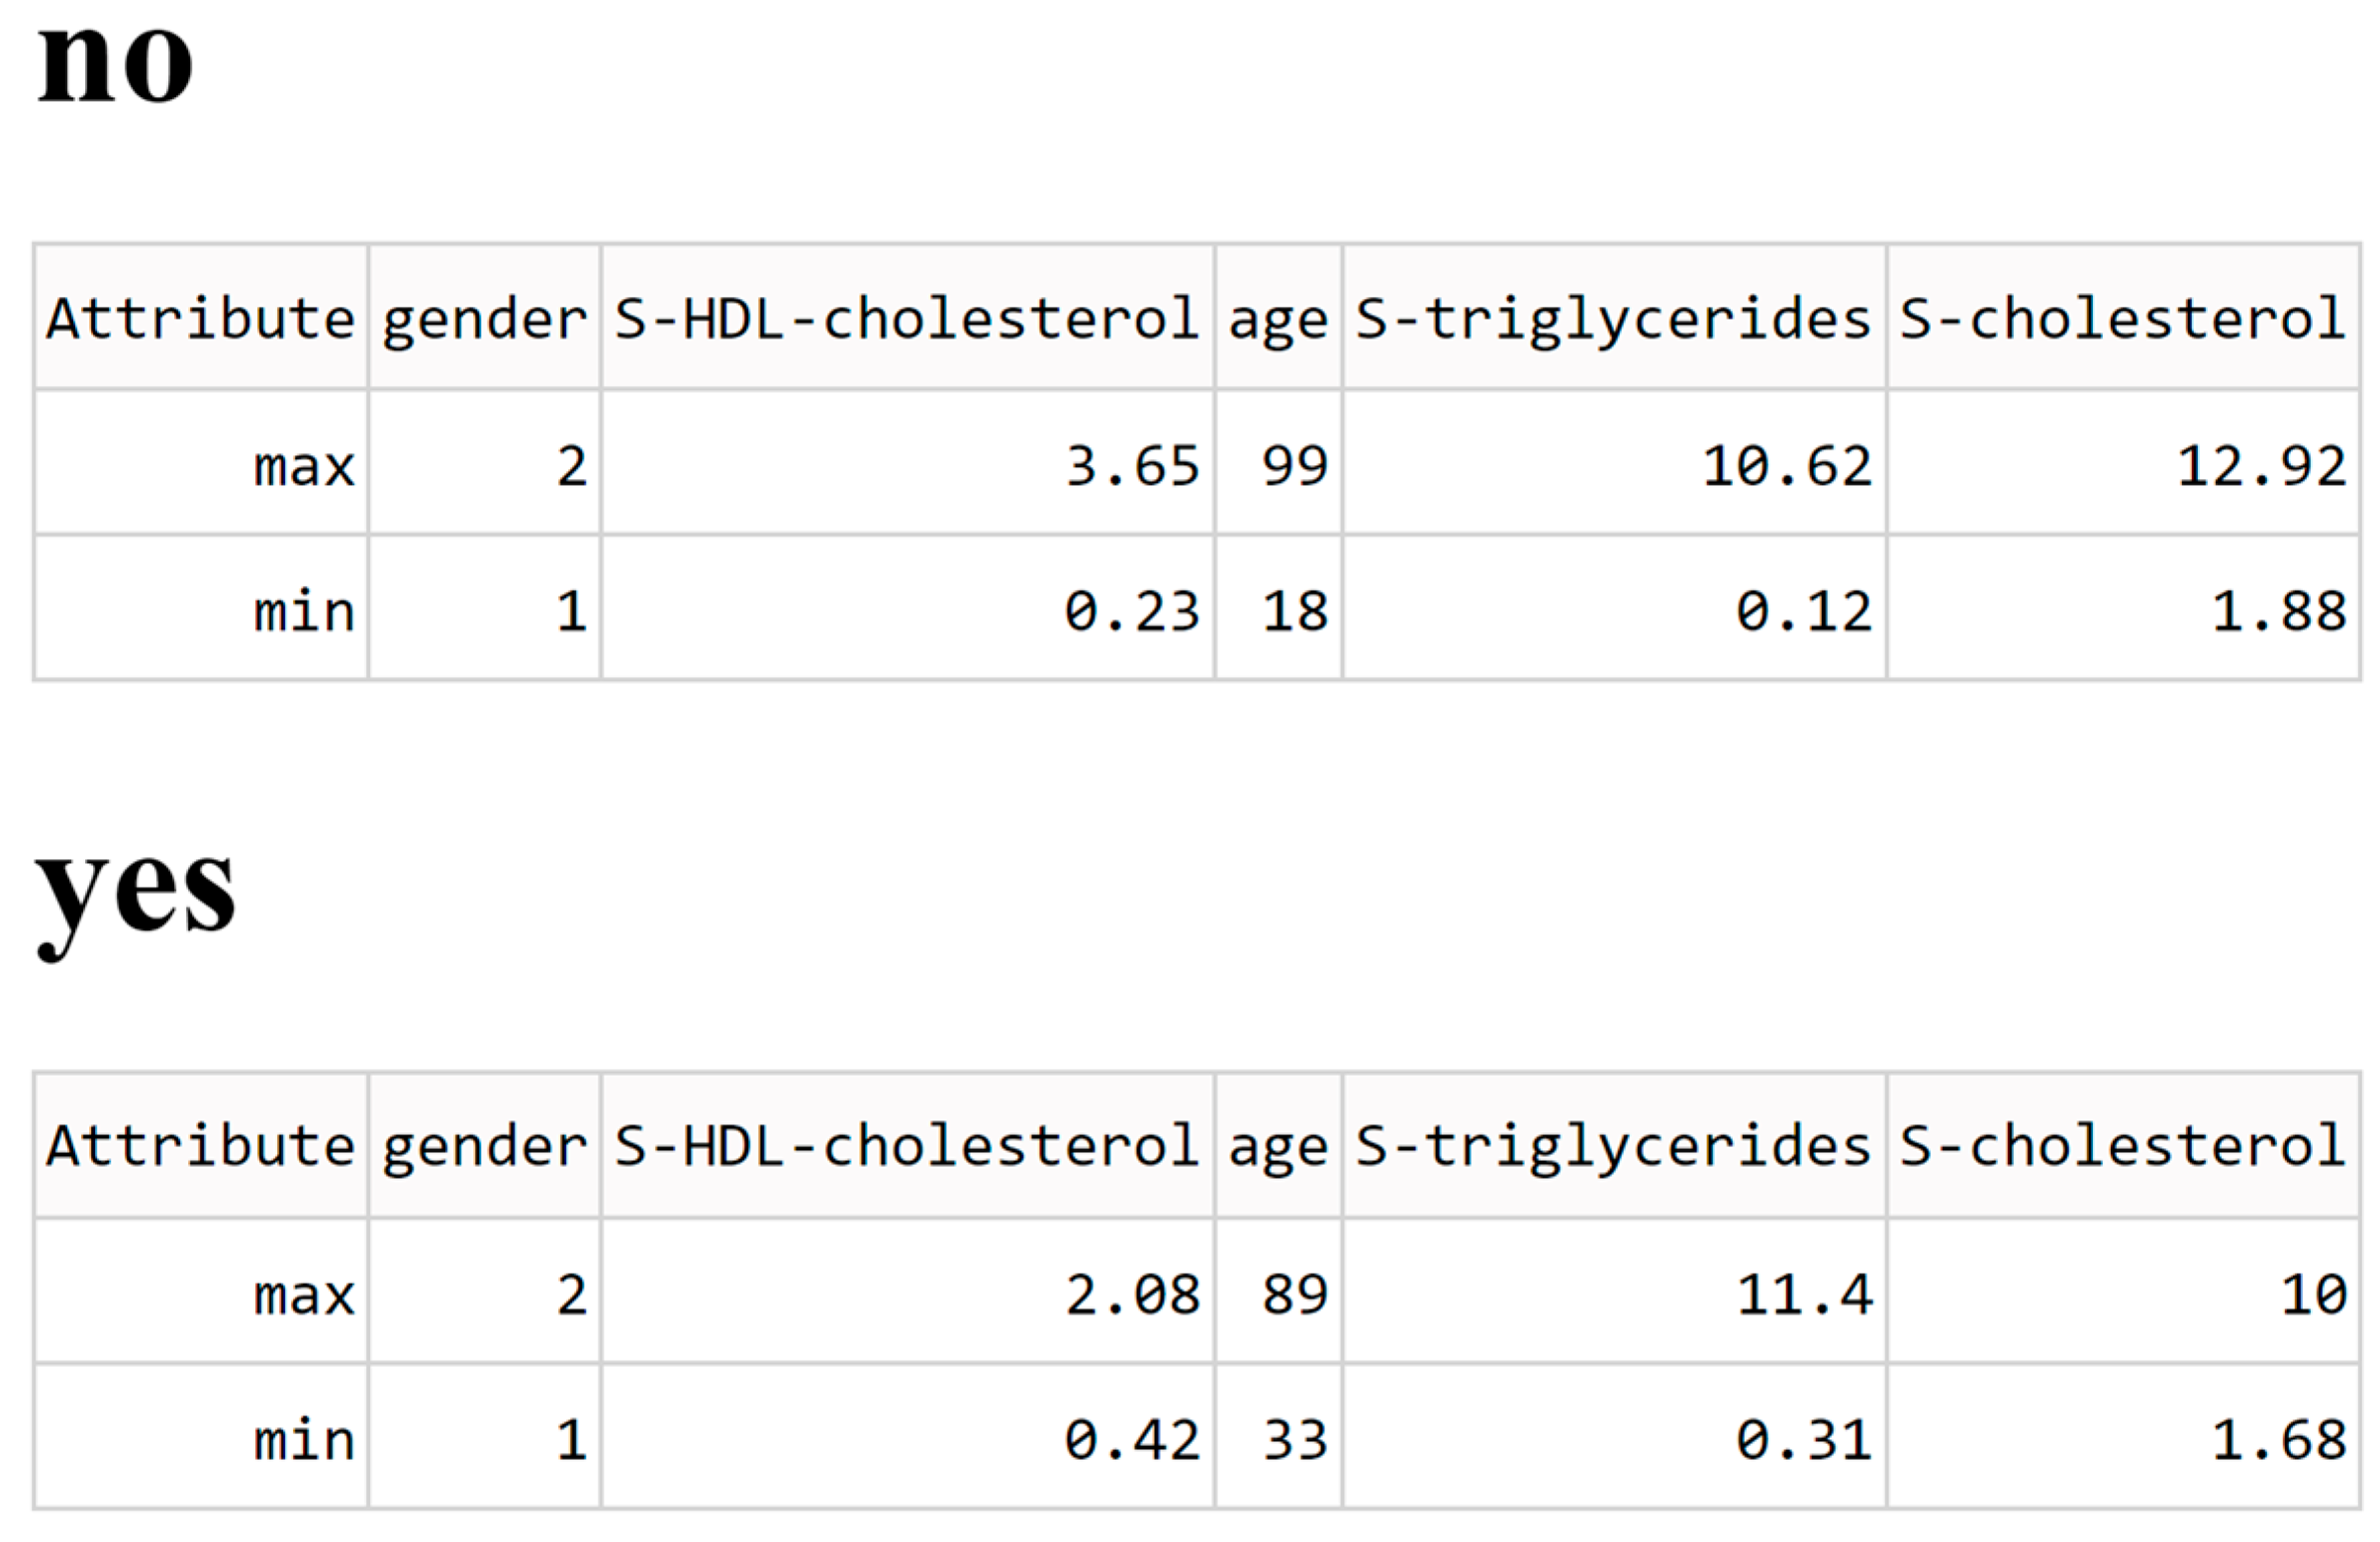
Figure 7. Additionally, some metadata of the canyons can be seen if the expert deems it important. The metadata contains the maximum and minimum values of each Data canyon which is presented in
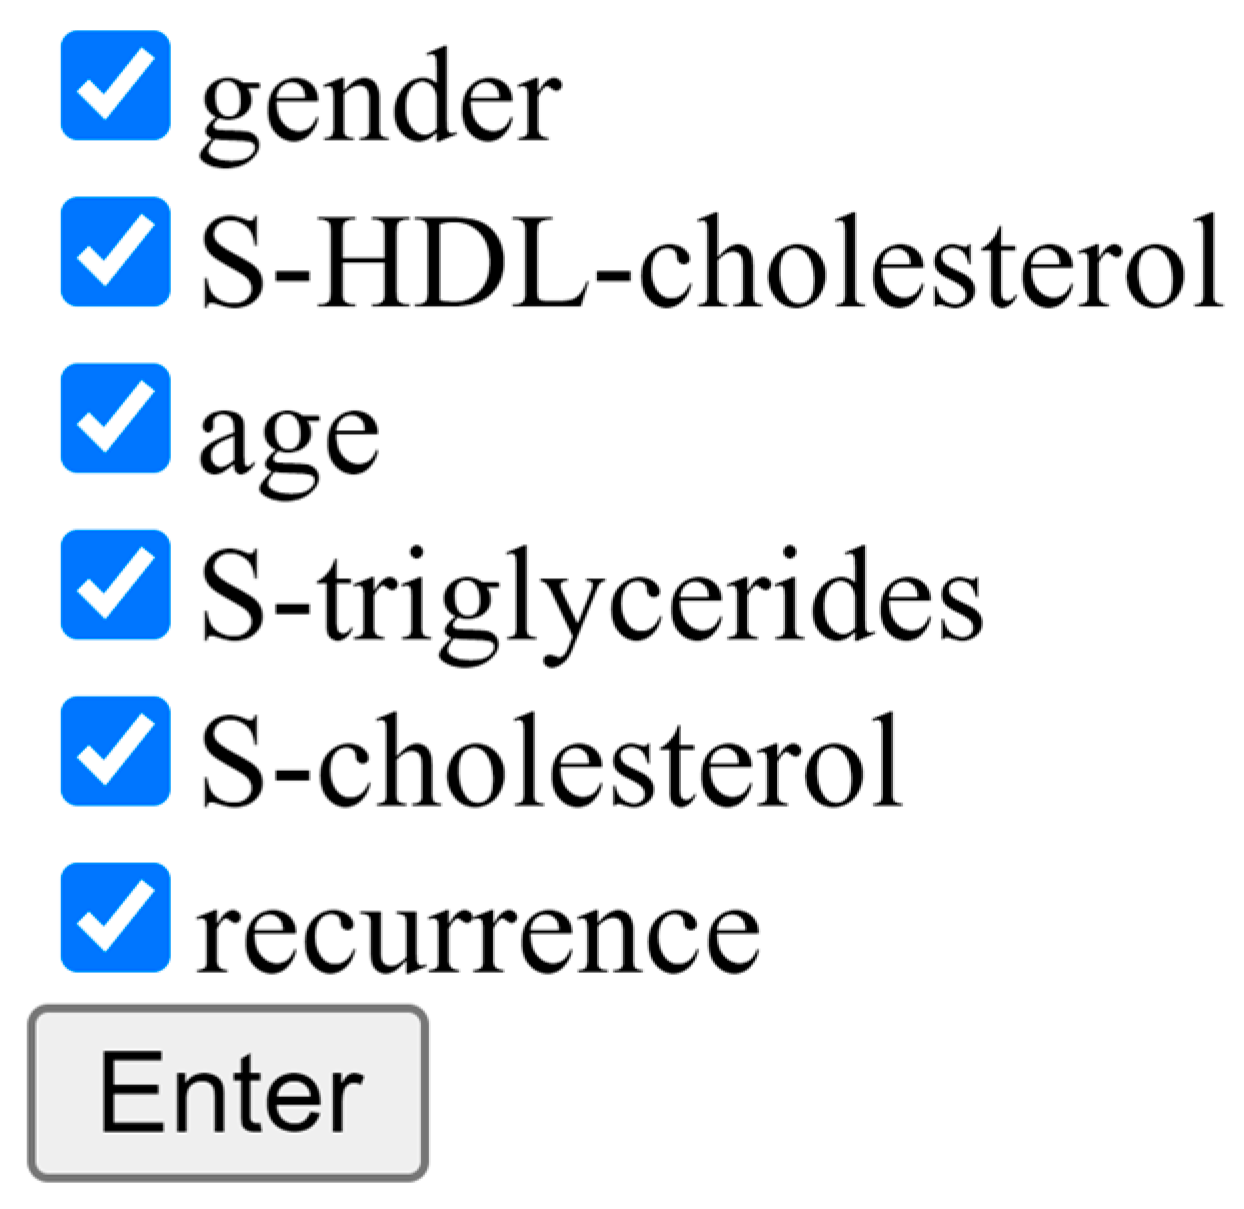
Figure 8. The last portion of the interface is the interaction part, where the end user can select which parameters of the train set he will incorporate to create the Data canyon, as shown in
Figure 9. Accepting the selected attributes instantly presents the end user with the new model, including the first test instance.
2.4. Medical Expert-Driven Agile Model Development and Improvement
Experts in the field where machine learning algorithms are applied are rarely also experts in the field of computer science and machine learning. Therefore, it is important that the interaction with machine learning algorithms and their visualization is presented in a transparent and understandable manner. Base principles of user experience (UX) [
20] need to be considered and, if feasible, applied in order to achieve the most interactive and coherent interface. Experts need to be able to relate to the main concepts and elements of the user interface (UI) without being overwhelmed and confused. The concepts of UX go hand in hand with agile principles of development since agile development inherently demands swift transitions and agility, which can be only achieved if the development environment, in our case the visualization and interaction platform, allows for such development. The base algorithm is like any other machine learning algorithm. It is a complex algorithm and can, in most cases, be only used as an input–output program, adding an abstract layer for interaction, at least for white-box models. The input–output model transforms into an interactive model, where the UX-centered interface allows for an agile exploration and visualization platform. There are other platforms that allow for similar testing and manipulation [
21]. However, what makes our solution special and different is the unique visualization layer of Data canyons that adds a simple graphical interpretation model and the possibility to combine it with on-the-fly interaction through the expert.
2.5. The Interviews
Several methods for evaluating XAI methods exist [
22], and a recent effort has been made to create a model usability evaluation framework for explainable artificial intelligence (MUsE) [
23] that featured a set of questions that were used in interviews to assess the usability of evaluation frameworks. Since white-box machine learning algorithms and their visual representation are subject to the same scrutiny as XAI-based interpretation tools such as Local Interpretable Model-Agnostic Explanations (LIME) [
24] and SHapley Additive exPlanations (SHAP) [
25], the approach of MUsE was therefore consequently applicable to the approach presented in this paper. The only exception were questions that were not applicable to the presented solution and were therefore left out. The interviews were focused on medical experts with extensive knowledge of the medical matter in question. In total, the interview was held with five medical experts. Each interview took 15 min, with a 5 min individual introduction before the interview to familiarize the participants with the logic behind the visualization of Data canyons and the individual parts of the web page. After the initial 15 min introduction, all participants were confident in their ability to use and explore the presented system.
3. Results
The interview was preceded by the previously mentioned introduction, after which the participants were asked the following questions. The questions were then evaluated and are shown in
Table 1. The rating column shows the ratings of individual participants based on the question regarding the interpretability of the results of the provided predictions. The interpretability of the Data canyons output was rated with an average of 8.8, while the average rating for LIME in the study that introduced MUsE [
23] was 7.08.
3.1. The Interview
What do you see in this graph?
Almost all participants initially knew what they were looking at and what they were looking for. Those who were initially struggling to understand the whole picture quickly made sense of it after they found the relevant attributes and then understood the relation between the instance and the appropriate Data canyons.
Which feature influences the prediction and how?
All participants understood the relationship between the color-coded instance and the influence of the attributes in the appropriate Data canyon since Data canyons are 3D figures that medical experts are used to interpreting.
Do you know why the model made this prediction?
All participants understood that the relation between the colors of the instance in one canyon in relation to the colors of the same instance in another canyon was the key component in the decision-making process.
How well can you interpret the results of the prediction of the graph on an increasing scale from 1–10?
Most participants had no trouble interpreting the results, while some had to glance at the provided metadata to interpret the results confidently. The average score was 8.8, which is a consequence of all the parts of the agile framework.
Is there anything that stands out as strange or unusual?
There were no noteworthy remarks made when confronted with this question.
The overall evaluation of the presented system was very positive. Participants had a clear understanding of what they were trying to achieve and a visually adequate representation that they could interpret. What stood out was the positive attitude towards the color-coded nature of the Data canyon and of the instance.
3.2. How Are Data Canyons and the Integrated System in Terms of Achieving Model Interpretability?
Here the focus is effectiveness as to three main factors: completion, accuracy, and negative consequences.
- (a)
How complete is the explanation on a local level?
The explanation is relatable and can be concisely summarized using the provided metadata explored.
- (b)
How complete is the explanation on a global level?
Since the system was integrated with a white-box machine learning algorithm and not an interpretation tool of a black-box algorithm, the explanation on a global level does not suffer.
- (c)
Could accurate results be misinterpreted?
Looking at the whole output that is provided by the presented solution, a misinterpretation by a medical expert is highly unlikely since the metadata combined with the visualization of the white-box algorithm presents a complete picture. However, there is always a chance of misinterpretation, and therefore, in medicine, a conclusion is never reached based only on the output of a machine learning algorithm.
- (d)
What negative consequences arise from a misinterpretation?
In the field of medicine, the output of a support system is only one piece of the puzzle. It is the medical expert’s duty to look at the whole picture and form his own opinion. Therefore, a misinterpretation should not have fatal consequences.
3.3. What Resources Are Consumed in Order to Achieve Interpretability?
Here the focus was on resource efficiency, which was derived from task time, time efficiency, cost-effectiveness, productive time ratio, unnecessary actions, and fatigue.
- (a)
How much time does it take to use the presented system?
The concept behind the visualization is relatively trivial and intuitive. Therefore, interpretation and adaptation to the usage take very little time.
- (b)
What other costs are involved?
From an application standpoint, it would have to be integrated into existing national medical systems, and for wide use, workshops for medical professionals would need to be held.
- (c)
Does this process cause fatigue?
The picture says more than a thousand words hold true in this case of Data canyons as we can grasp the main decision at a glance, which takes very little effort.
3.4. How Satisfying Is the Application of the Presented System?
This last part is highly dependent on the user of the system since it focuses on his satisfaction which can be determined on a per-user basis.
- (a)
Do we have a positive or negative attitude towards the tool?
Since the solution is a standalone system that is served through a web page, it is easily accessible and easy to use. However, for the same reasons, changes to the underlying algorithm or any adjustment would be out of the skill base of the end user and would have to be performed by someone with a high degree of knowledge in computer science.
- (b)
What emotions arise from using it?
The tool arouses favorable emotions since it increases confidence and allows for dynamic manipulation from the end-user site, which implies the importance of expert knowledge in the creation of quality decision-making algorithms.
- (c)
How satisfying is the final result?
The overall experience of working with this tool is positive, and the possibility of interaction visually and the agile approach make for a new and exciting expert-driven framework.

 ,
, 


