Article

The Machine-Learning-Based Prediction of the Punching Shear Capacity of Reinforced Concrete Flat Slabs: An Advanced M5P Model Tree Approach

by
Marwa Hameed Abdallah
1,
Zainab Abdulrdha Thoeny
2,
Sadiq N. Henedy
3,
Nadia Moneem Al-Abdaly
1,
Hamza Imran
4,
Luís Filipe Almeida Bernardo
5,* and
Zainab Al-Khafaji
6
1
Department of Civil Engineering, Najaf Technical Institute, Al-Furat Al-Awsat Technical University, Najaf Munazira Str., Najaf 54003, Iraq
2
Department of Political Thought, Collage of Political Sciences, University of Baghdad, Baghdad 10071, Iraq
3
Department of Civil Engineering, Mazaya University College, Nasiriyah City 64001, Iraq
4
Department of Environmental Science, College of Energy and Environmental Science, Alkarkh University of Science, Baghdad 10081, Iraq
5
Department of Civil Engineering and Architecture, University of Beira Interior, 6201-001 Covilhã, Portugal
6
Building and Construction Techniques Engineeing Department, Al-Mustaqbal University College, Hillah 51001, Iraq
*
Author to whom correspondence should be addressed.
Appl. Sci. 2023, 13(14), 8325; https://doi.org/10.3390/app13148325
Submission received: 12 April 2023 / Revised: 12 July 2023 / Accepted: 17 July 2023 / Published: 19 July 2023

Abstract

:
Reinforced concrete (RC) flat slabs are widely employed in modern construction, and accurately predicting their load-carrying capacity is crucial for ensuring safety and reliability. Existing design methods and empirical equations still exhibit discrepancies in determining the ultimate load capacity of flat slabs. This study aims to develop a robust machine learning model, specifically the M5P model tree, for predicting the punching shear capacity of a RC flat slab without shear reinforcement. A comprehensive dataset of 482 experimentally tested flat slabs without shear reinforcement was gathered through an extensive literature review and utilized for the development of the M5P model. The model takes into account influential parameters, such as slab thickness, longitudinal reinforcement ratios, and concrete strength. The performance of the proposed M5P model was compared with existing design codes and other empirical models. The comparison highlights that the developed M5P model tree provides a more accurate and reliable prediction of the punching shear capacity of RC flat slabs. This study contributes to the advancement of structural engineering knowledge and has the potential to improve the design and safety assessment of concrete flat slab structures.

1. Introduction

Reinforced concrete (RC) flat slabs are slabs with usually a uniform thickness and are supported directly on columns without any downstand or upstand beams. They constitute a popular construction choice owing to their architectural flexibility, as demonstrated in [1] (Figure 1, adapted from [1]). However, their structural performance, particularly in terms of punching shear capacity, has been a topic of concern and extensive research in the field of structural engineering has been made. Flat slabs may be susceptible to punching shear failure, which can be a brittle and sudden mode of failure that occurs around the column–slab connection, which can result in severe consequences if not properly addressed. Diagonal tensile cracks develop from a failure surface around the loaded area of the slab, typically forming in the vicinity of the column–slab connection. These cracks are a manifestation of the local interaction between bending and shear stresses, called punching shear stresses, which are caused by the concentrated forces transmitted from the slab to the column. Failure in RC flat slabs due to punching shear typically occurs along a truncated cone shape, which forms around the column–slab connection. Therefore, accurately predicting and accounting for the punching shear capacity is essential to ensure the safety and stability of RC flat slabs. The entire structure may be prone to sequential failure. Various factors such as (i) concrete strength, (ii) the longitudinal reinforcement ratio (the average area of the upper tensile flexural distributed reinforcements divided by the effective depth of the slab in the punching shear zone), (iii) slab thickness, and (iv) loading conditions need to be considered to determine their impact on capacity.

2. Literature Review

In recent years, several academics have proposed empirical formulas and analytical models for predicting the punching shear resistance. Theodorakopoulos and Swamy [2] presented an easy-to-understand analytical model, which was applied to 60 experimental slab–column connections, and the results were compared with previously developed models. Elshafey et al. [3] created two condensed empirical formulations using 244 experimental data points, and the examination of the prediction accuracies revealed that the two suggested models were capable of generalizing the gathered experimental data.
Moreover, a formula for predicting punching shear resistance was introduced by El-sanadedy et al. [4], based on the experimental results of 61 high-strength concrete slabs. The empirical formula could accurately predict the punching shear resistance of concrete slabs, making it an essential tool for designers and engineers to ensure the safety and stability of RC structures. Also, various formulae have been presented in design codes, such as BS 8110-97 [5], ACI 318-19 [6], and Eurocode 2 [7], for predicting the punching shear resistance of RC interior slabs. Moreover, a significant amount of experimental research has been undertaken to determine the crucial factors affecting the punching shear resistance of these slabs. In order to investigate the impact of input factors like the reinforcement ratio, column size, and concrete strength on the punching shear resistance, Elstner and Hognestad [8] conducted 39 experiments and found a considerable effect of concrete strength on the punching shear resistance. Furthermore, the influence of slab thickness on the punching shear resistance was explored by Baant and Cao [9], providing additional insight into the structural behavior of RC interior slabs.
In recent years, the application of black-box machine learning (ML) and artificial intelligence techniques has shown great promise in predicting complex structural behaviors [1,10,11,12,13,14,15,16,17]. These data-driven methods can have the potential to improve the accuracy and reliability of punching shear capacity predictions by capturing intricate relationships among the influencing factors. XGBoost was applied to predict the punching shear resistance in RC interior flat slabs, achieving the best prediction compared to two other ML models and various design codes [14]. The most significant input variable was shown to be the effective depth of the slab (distance from the bottom face of the slab to the average plane of the upper tensile flexural distributed reinforcements in the punching shear zone). A graphical user interface was created for preliminary estimation. Other research assessed the effectiveness of ML techniques in estimating the punching shear strength of flat slabs without shear reinforcement, utilizing 380 experimental data points [1]. The extreme gradient boosting model surpasses other models and current code provisions, achieving a coefficient of variation of 0.09 and a coefficient of determination of 0.98. The SHapley Additive exPlanation (SHAP) approach was used to elucidate the factors influencing the predictions [1]. In another study [16], an effective prediction model was developed, chosen from eight ML-based models, to determine the failure mode of flat slabs based on 610 experimental data points. XGBoost surpasses other models, achieving a 99.02% accuracy rate. The SHAP analysis offers valuable understanding of the relationship between the failure mode and contributing factors. A study [12] examined design provisions for RC flat slabs, identifying influential parameters through a sensitivity analysis. In this study [12], a Bat-ANN hybrid model was developed for estimating the punching shear strength, achieving a superior accuracy. Key parameters were assessed, highlighting the importance of the flexural reinforcement. In the pursuit of predicting punching shear resistance in reinforced concrete slabs, machine learning models such as artificial neural networks, decision trees, random forests, and extreme gradient boosting made significant strides [17]. Their predictive accuracy surpassed traditional design code models, marking a remarkable advancement. Complementing these developments, a hybrid Extreme Learning Machine for Regression (EPR) technique emerged, melding AI, robust multivariate techniques, and an Akaike weight-based method [18]. This innovative approach provided an accurate, unbiased model for shear strength in RC beams. Simultaneously, the Symbolic Regression—Modified Compression Field Theory (SR-MCFT), a hybrid grey-box model, took a step further [19]. By integrating the modified compression field theory and machine learning, it excelled in predicting punching shear resistance in Fiber-Reinforced-Polymer (FRP)-reinforced slabs. The Evolutionary Polynomial Regression (EPR) added another dimension to this field, successfully enhancing the prediction of shear strength in reinforced concrete circular columns and refining existing models and empirical rules [20]. Lastly, a unique hybrid model that combined Particle Swarm Optimization and Support Vector Regression (PSO-SVR) showcased its predictive prowess, notably improving the prediction of punching shear strength in two-way reinforced slabs and emphasizing the importance of slab depth and thickness [21].
Despite the success of previously developed black-box ML models in predicting the punching shear capacity of RC flat slabs, black-box models cannot generate explicit equations or mathematical representations that elucidate the relationships between input parameters and output predictions. It is crucial to consider models that offer a balance between interpretability and complexity. This balance ensures that engineers and designers can gain a comprehensive understanding of the relationships among various influencing factors, while still benefiting from the enhanced predictive accuracy provided by advanced ML techniques. M5P, a model-tree-based algorithm, presents a promising alternative as it combines the simplicity of decision trees with the power of linear regression, allowing for a greater interpretability without sacrificing predictive performance [22]. This unique combination enables practitioners to make informed decisions while leveraging the advantages of ML in structural design and analyses.
The primary objective of this study was to develop and assess the performance of the M5P model, a model-tree-based algorithm, in accurately predicting the punching shear strength of RC flat slabs without shear reinforcement. To achieve this objective, this study first gathered a comprehensive dataset of experimental results and relevant parameters influencing the punching shear strength of RC flat slabs. This dataset was then used to train and test the M5P model, ensuring its ability to capture the intricate relationships among various influencing parameters, which are the (1) effective depth of the slab (d), (2) longitudinal reinforcement ratio (ρ), (3) compressive strength of concrete (fc), (4) span–depth ratio (λ) (the distance between the face of the support column and the edge of the slab divided by the effective depth of the slab), (5) yield strength of reinforcement (fy), and (6) equivalent column width (b) defined latter. In addition, this research compared the performance of the proposed M5P model with existing empirical formulas and analytical models. This comparative analysis helps to demonstrate the effectiveness and advantages of the M5P model in terms of predictive accuracy and interpretability. Finally, this research investigated the sensitivity of the developed model to the input parameters. The sensitivity analysis identified the most influential parameters on the punching shear strength of a RC flat slab and their effect on the accuracy of the model. This information can be useful for the design and optimization of RC flab slabs to achieve the desired level of punching shear strength.

3. Materials and Methods

The methodology employed in this research relies on a widely recognized and practical decision tree algorithm known as the M5P model tree. All modeling was performed using Weka software (version 3.9.4) [23], a popular suite of machine learning software written in Java. This powerful approach effectively combines the simplicity and interpretability of decision trees with the predictive capabilities of linear regression models, providing a robust and user-friendly tool for understanding complex relationships in data and making informed decisions in various domains. The details of the algorithm, as well as the data collection and pre-processing procedures, are discussed in this section.

3.1. M5P Model Tree Techniques

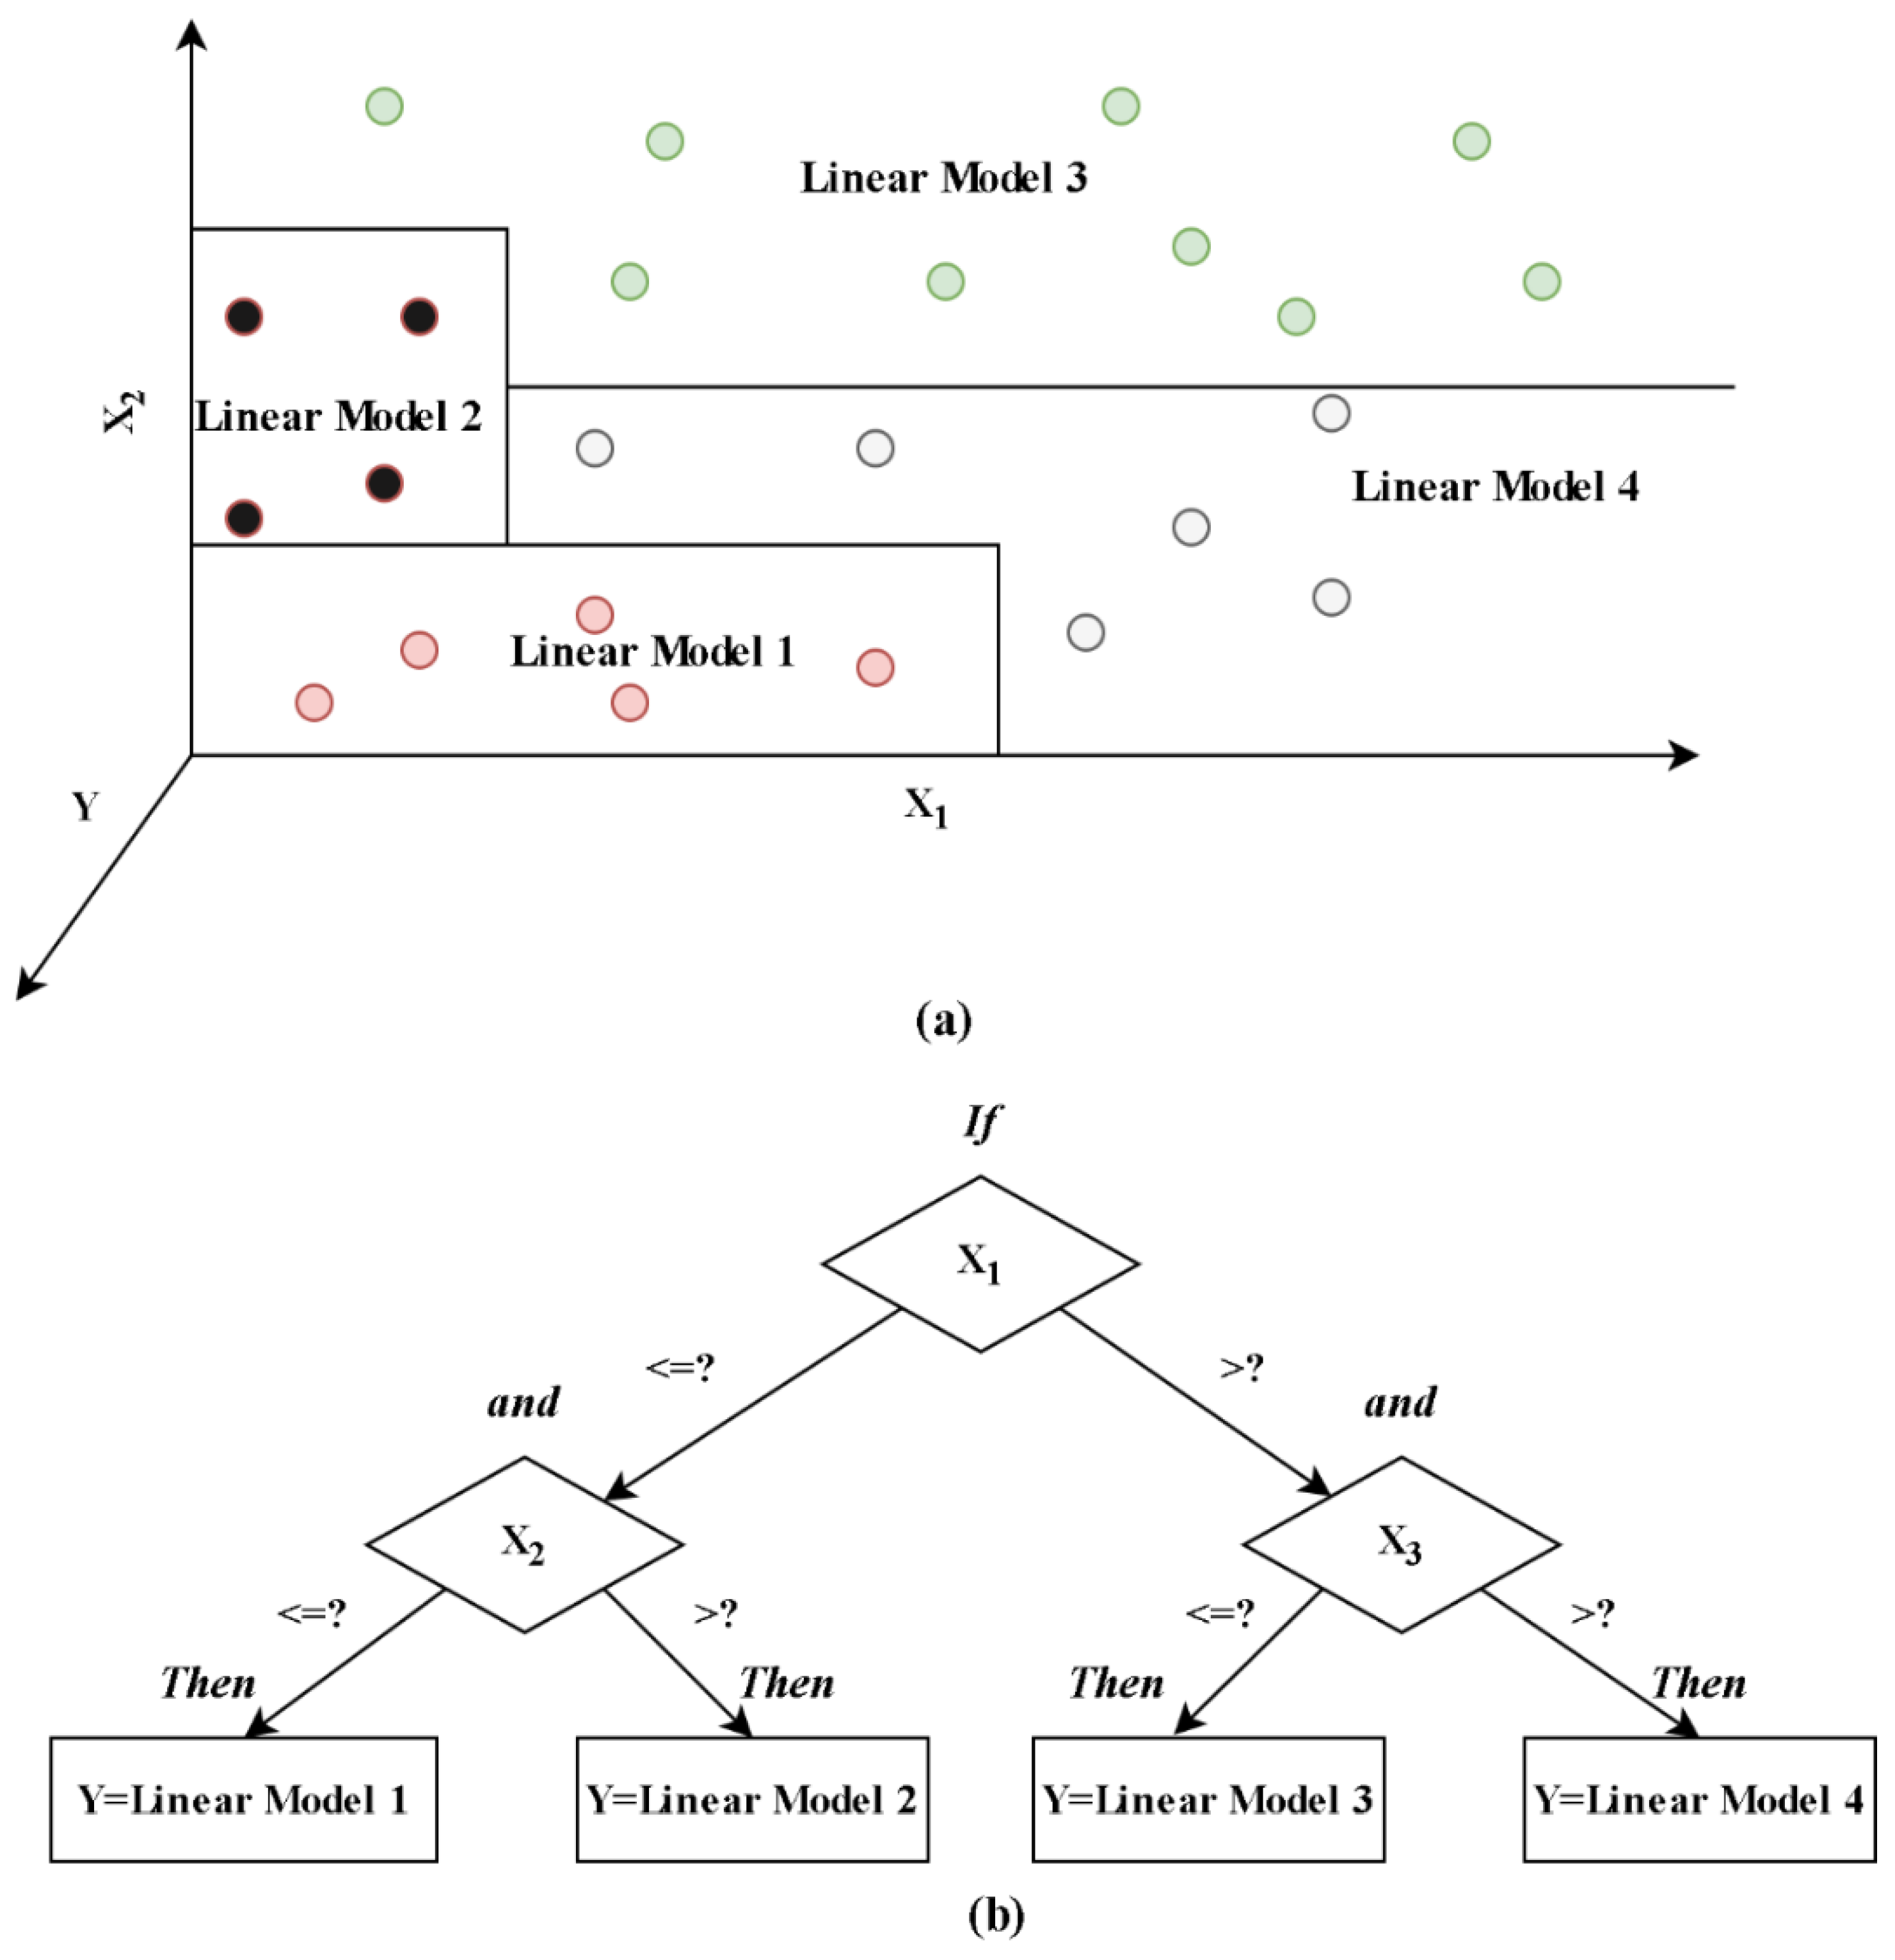
The M5P algorithm, an advanced and efficient technique, is well-suited for analyzing complex systems characterized by a high dimensionality, encompassing a vast number of attributes. Initially introduced by Quinlan [22] as the M5 algorithm, it was designed to address classification and regression problems. Subsequently, Wang and Witten [24] refined the M5 algorithm, resulting in what is commonly referred to as the M5P algorithm. This improved algorithm excels at breaking down complex problems into simpler sub-problems and generating a response that combines the solutions of these sub-problems. The M5P method involves three key steps: constructing the initial tree, pruning it, and applying smoothing techniques. This process relies on the divide-and-conquer strategy, which is employed to partition the data space into smaller, more manageable subspaces. To further illustrate this, the structure of a decision tree, built using the approach for dividing the sample space with two input parameters, is depicted in Figure 2 to offer further context. The resulting model tree resembles an inverted tree, with the leaves at the bottom and the root positioned at the top. The divide-and-conquer strategy is employed to identify the leaves, or subspaces (refer to Figure 2a). Subsequently, a multivariate linear regression (MLR) model is established at each leaf (as shown in Figure 2b).
The decision tree structure in Figure 2a segregates the full dataset into distinct groups using some splitting values. These values are determined to ensure accurate and efficient data partitioning, utilizing input variables that optimize error reduction for each node. The standard deviation reduction (SDR) is employed to calculate inaccuracies at individual nodes as follows:
S D R = s d T i = 1 n T i T s d ( T i )
where s d refers to the standard deviation, T i is the outcome of splitting the node based on the specified split value and attribute, while the set T consists of instances that reach a particular node. The splitting process terminates automatically if the output values of all instances reaching the node differ by less than 5% of the original instance set’s standard deviation, or when only a few instances remain. Upon constructing the tree, a multiple linear regression (MLR) model is built in the lowest subspace. Overfitting is often an unavoidable issue when generating the model tree and MLR model at each split. Usually, a pruning method is used to address this issue. In order to identify and address the issue of overfitting in the model, the algorithm thoroughly examines and derives a well-informed projection of the expected errors contained within the testing dataset.
For the training instances that reach each node, the average absolute errors between the actual values and the expected response ones predicted with the unpruned tree are determined. This process is conducted for every training instance that reaches each individual node. Nonetheless, relying solely on this average value can lead to underestimating the anticipated error for the validation dataset. This issue arises due to the fact that the tree construction process is heavily dependent on the training dataset, which can inadvertently cause a bias in the performance evaluation of the model. To account for this, the response values are multiplied by the ratio (n + v)/(n × v), where v is the number of model attributes that correspond to the output value at that node and n represents the number of training data vectors that reach the node. Consequently, the algorithm can effectively remove generated leaves with estimated errors exceeding those of their preceding nodes (parents).
The M5P method incorporates a unique smoothing phase that operates on several leaves within the pruned tree, aiming to reduce the sudden discontinuity observed between neighboring leaves, also referred to as classes. This approach involves a process where the estimated value of each individual leaf undergoes filtration as it follows the path from the leaf back to the root of the tree. In order to compute the value at every node throughout this process, a specific formula is employed. This formula serves to merge the predicted value generated using the linear model, which is uniquely associated with the particular node in question.
P = n p + k q n + k
In this context, q represents the predicted value generated with the model at the given node, while p denotes the prediction transmitted to the current node from a lower level. P′ refers to the predicted value passed upward to the subsequent higher node. n signifies the number of training instances that have reached the preceding node, and k is a constant, as described by Wang and Witten [24]. As depicted in Figure 2b, the M5P method yields a sequence of multivariate linear equations, also known as rules, which serve to estimate the target values effectively.

3.2. Data Collection and Pre-Processing

The dataset utilized for the calibration and validation of the M5P models, sourced from Shen et al. [16], comprises 610 shear capacity tests on RC flat slabs without shear reinforcement collected from 55 experimental studies conducted between 1956 and 2016. These tests provide valuable information about various factors that influence the punching shear capacity of a RC flat slab, such as concrete strength, the reinforcement ratio, and the shear-span-to-depth ratio. This design choice aimed to focus the study on the punching shear capacity of flat slabs without shear reinforcement, thus isolating the behavior of the primary material components. Only flat slabs with failures primarily occurring due to punching shear (482 points) rather than flexure were considered in this study. This criterion ensured that the dataset accurately represented the performance of RC flat slabs under punching-shear-dominated failure modes, enabling a more targeted investigation of the factors affecting the punching shear capacity of RC flat slabs.
The available data were randomly divided into two sets: a training set for model calibration, which was used to develop and optimize the predictive models, and an independent validation set for model verification, which allowed for the assessment of each model performance and generalizability on previously unseen data. This division strategy ensured a thorough evaluation of the models’ capabilities in accurately predicting the punching shear capacity of RC flat slabs across a wide range of scenarios. A stratified sampling technique was employed to ensure that both subsets were representative of the entire dataset in terms of the distribution of key variables. This approach enabled a more robust evaluation of each model performance and generalizability. Typically, the dataset was split into a 80:20 ratio, with the larger portion reserved for training and the smaller portion for testing. Table 1 offers a comprehensive overview of the distribution and range of values for each parameter in both sets, allowing for a better understanding of the dataset characteristics.
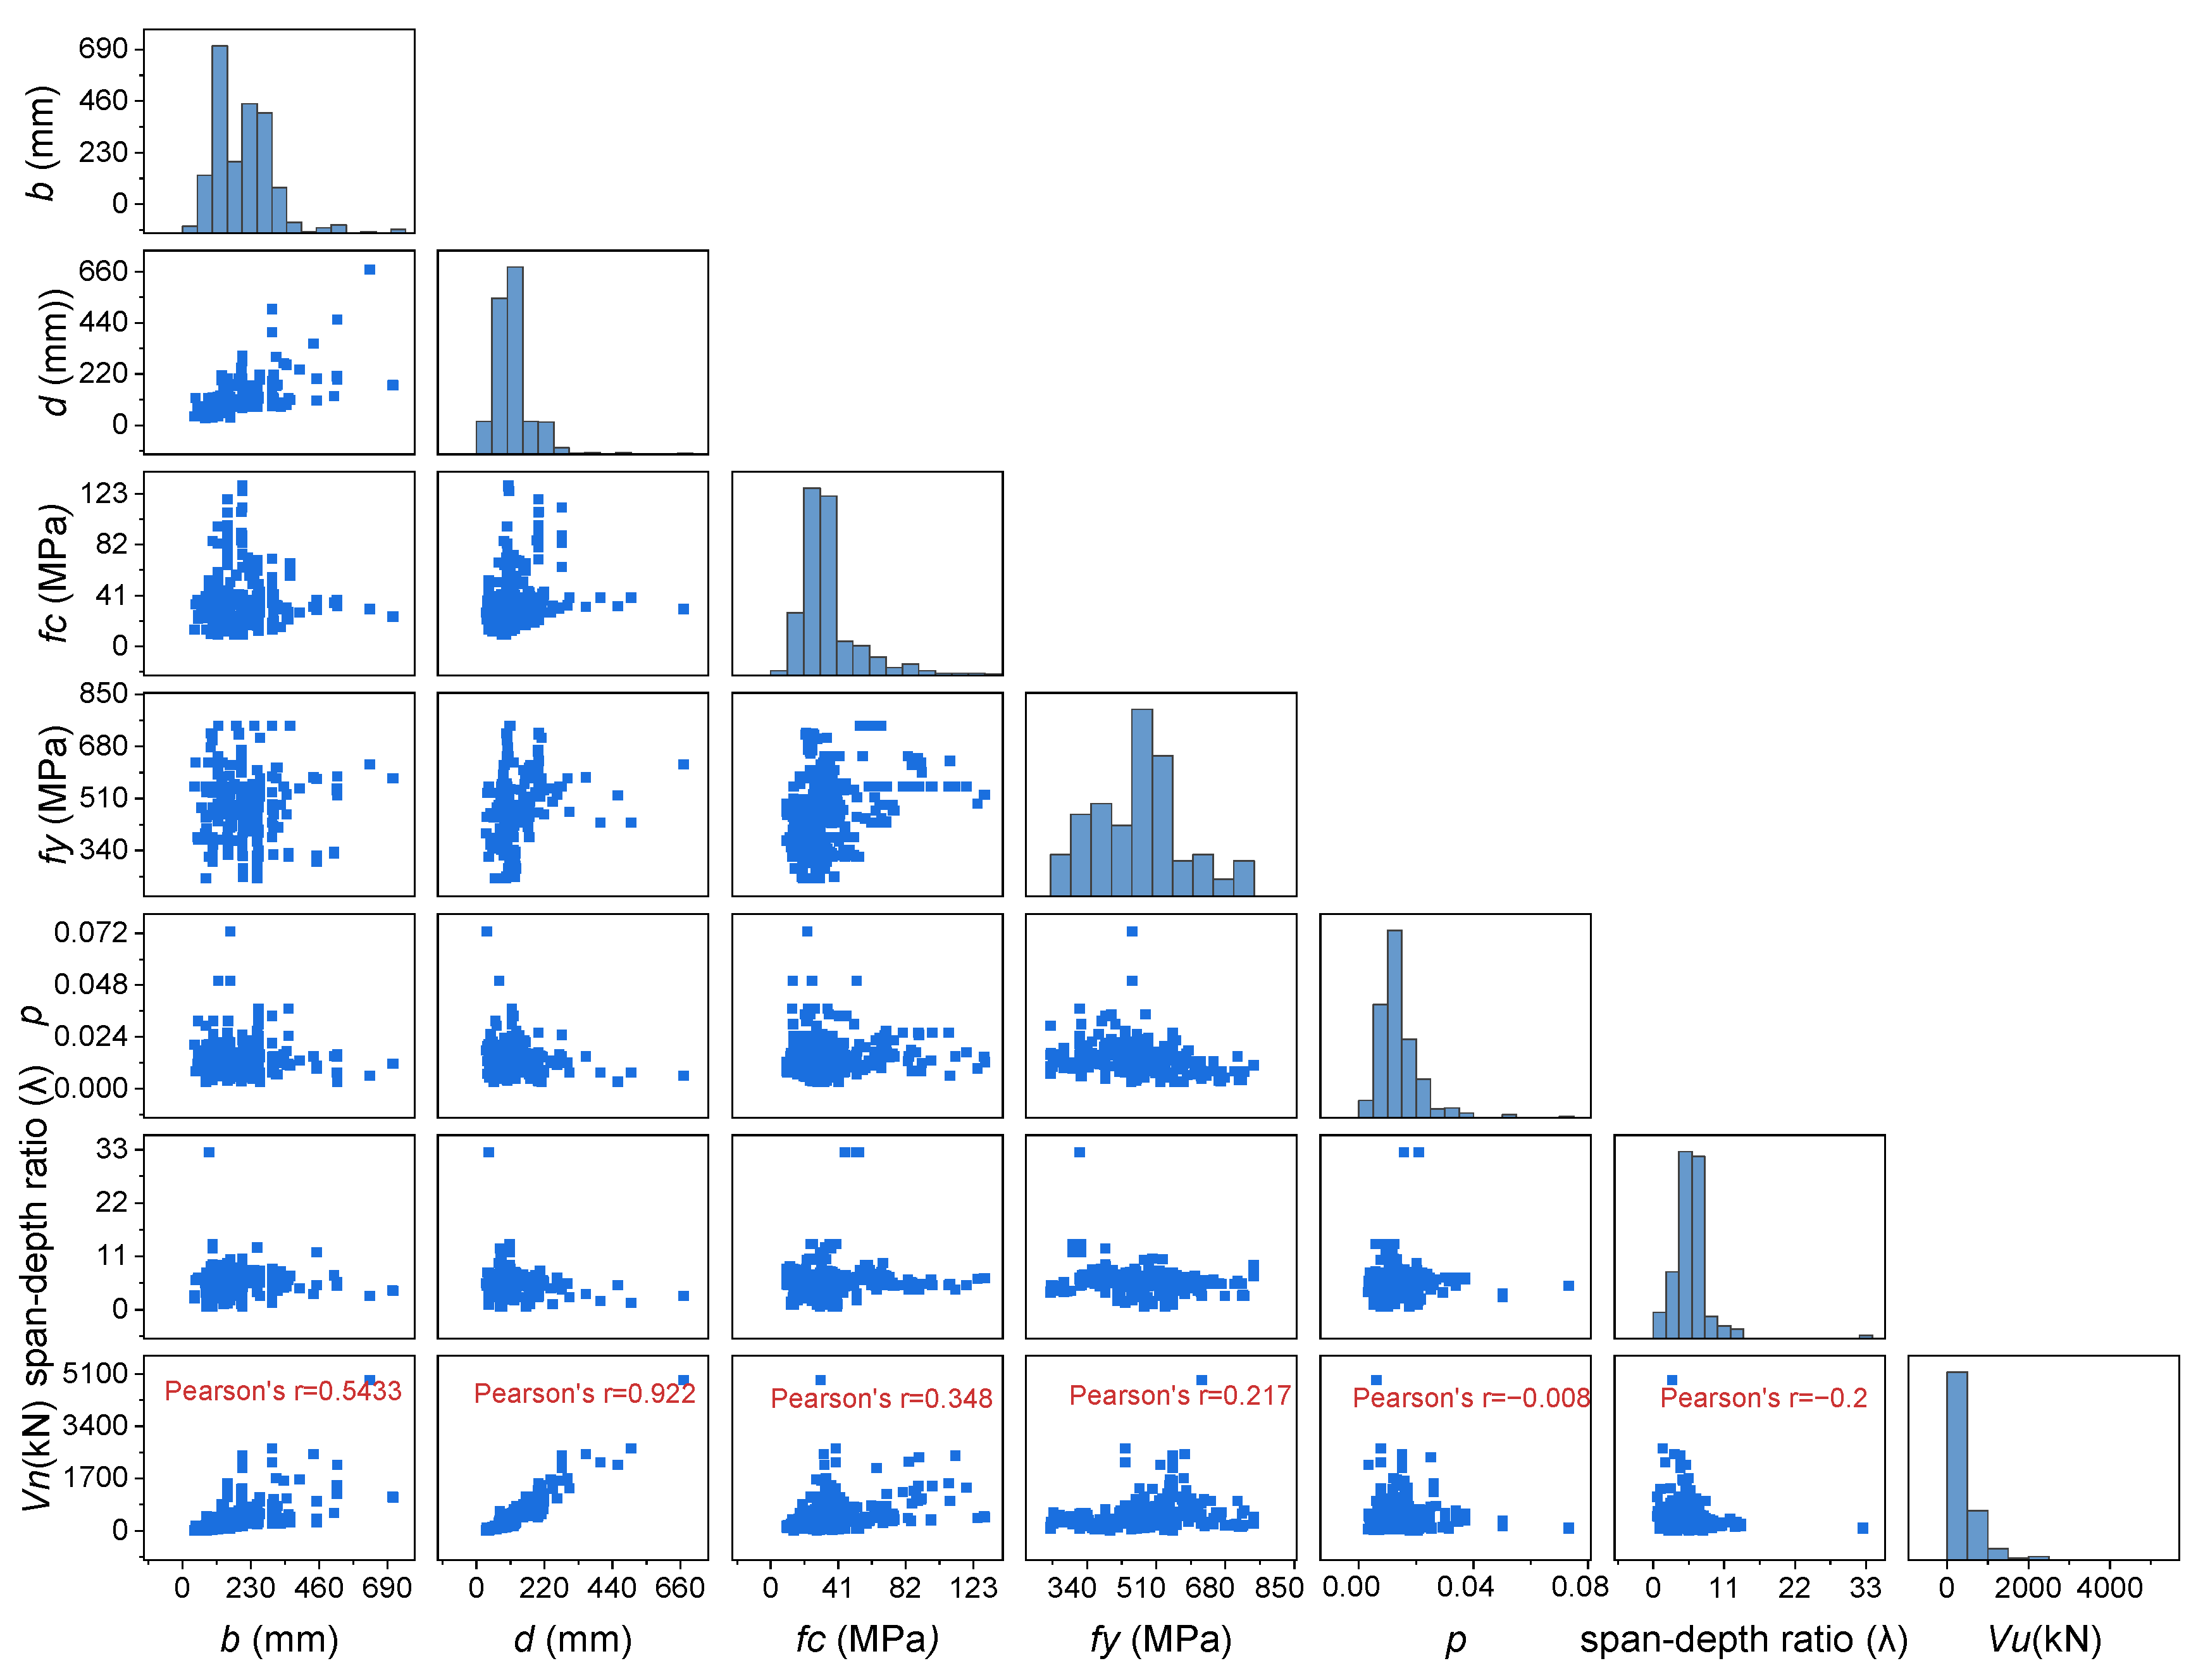
For enhanced visualization and a deeper understanding of the relationships between input and output parameters, a matrix–plot is provided in Figure 3. This plot presents a series of scatterplots showcasing the pairwise relationships among the input variables and their correlation with the output parameter, which in this case is the punching shear capacity of the RC flat slab. The diagonal plots in this matrix showcase the histograms of output and input parameters, representing the frequency distribution of each variable across the entire dataset. It is worth mentioning that the column size is represented as a parameter using the equivalent column width (b); a circular (or rectangular) column was transformed into a corresponding square column that maintains an identical critical shear perimeter. As it can be noticed in Table 1, the depth (d) of the slabs in the training set ranges from 29.970 mm to 668.500 mm, with an average of 117.989 mm and a standard deviation of 62.842 mm. In the testing set, the effective depth varies between 33.166 mm and 400.000 mm, with a mean of 111.895 mm and a standard deviation of 55.409 mm. Table 1 also shows that the shear span–depth ratio (λ) has similar distributions in both the training and testing sets, with comparable mean values and standard deviations. The concrete compressive strength (fc) and reinforcement ratio (ρ) values in Table 1 reveal that the dataset covers a wide range of concrete strengths and reinforcement quantities, which is essential for developing models that can accurately predict the punching shear capacity in various real-world scenarios. Lastly, the shear force (Vu) values demonstrate a relatively wide range of measured punching shear capacities for both the training and testing sets, indicating that the dataset is diverse and representative of different failure modes and load conditions. It is worth noting that the derived predictive models may exhibit a higher degree of reliability within the ranges mentioned where most data points are concentrated. This is because the models have been extensively trained and validated on a larger number of samples within these parameter intervals. Such reliability is crucial for practical applications, as it guarantees accurate predictions for the scenarios most frequently found in real-world design and construction practices.

4. Model Results

4.1. M5P-Derived Models

The M5P algorithm is a method that segments data spaces into numerous smaller regions, known as subspaces. Within each subspace, a local multivariate linear regression (MLR) model is constructed. However, relying solely on local MLR models for predicting outcomes is a shortcoming of the M5P algorithm. To address this issue, we convert all input output and input variables into a logarithmic form. Subsequently, the M5P algorithm is refined within this logarithmic space. Following this transformation, the local MLR models in each individual subspace are restructured to enhance their predictive capabilities and overall accuracy as follows:
V u = a b b d c f c d f y e ρ f λ g
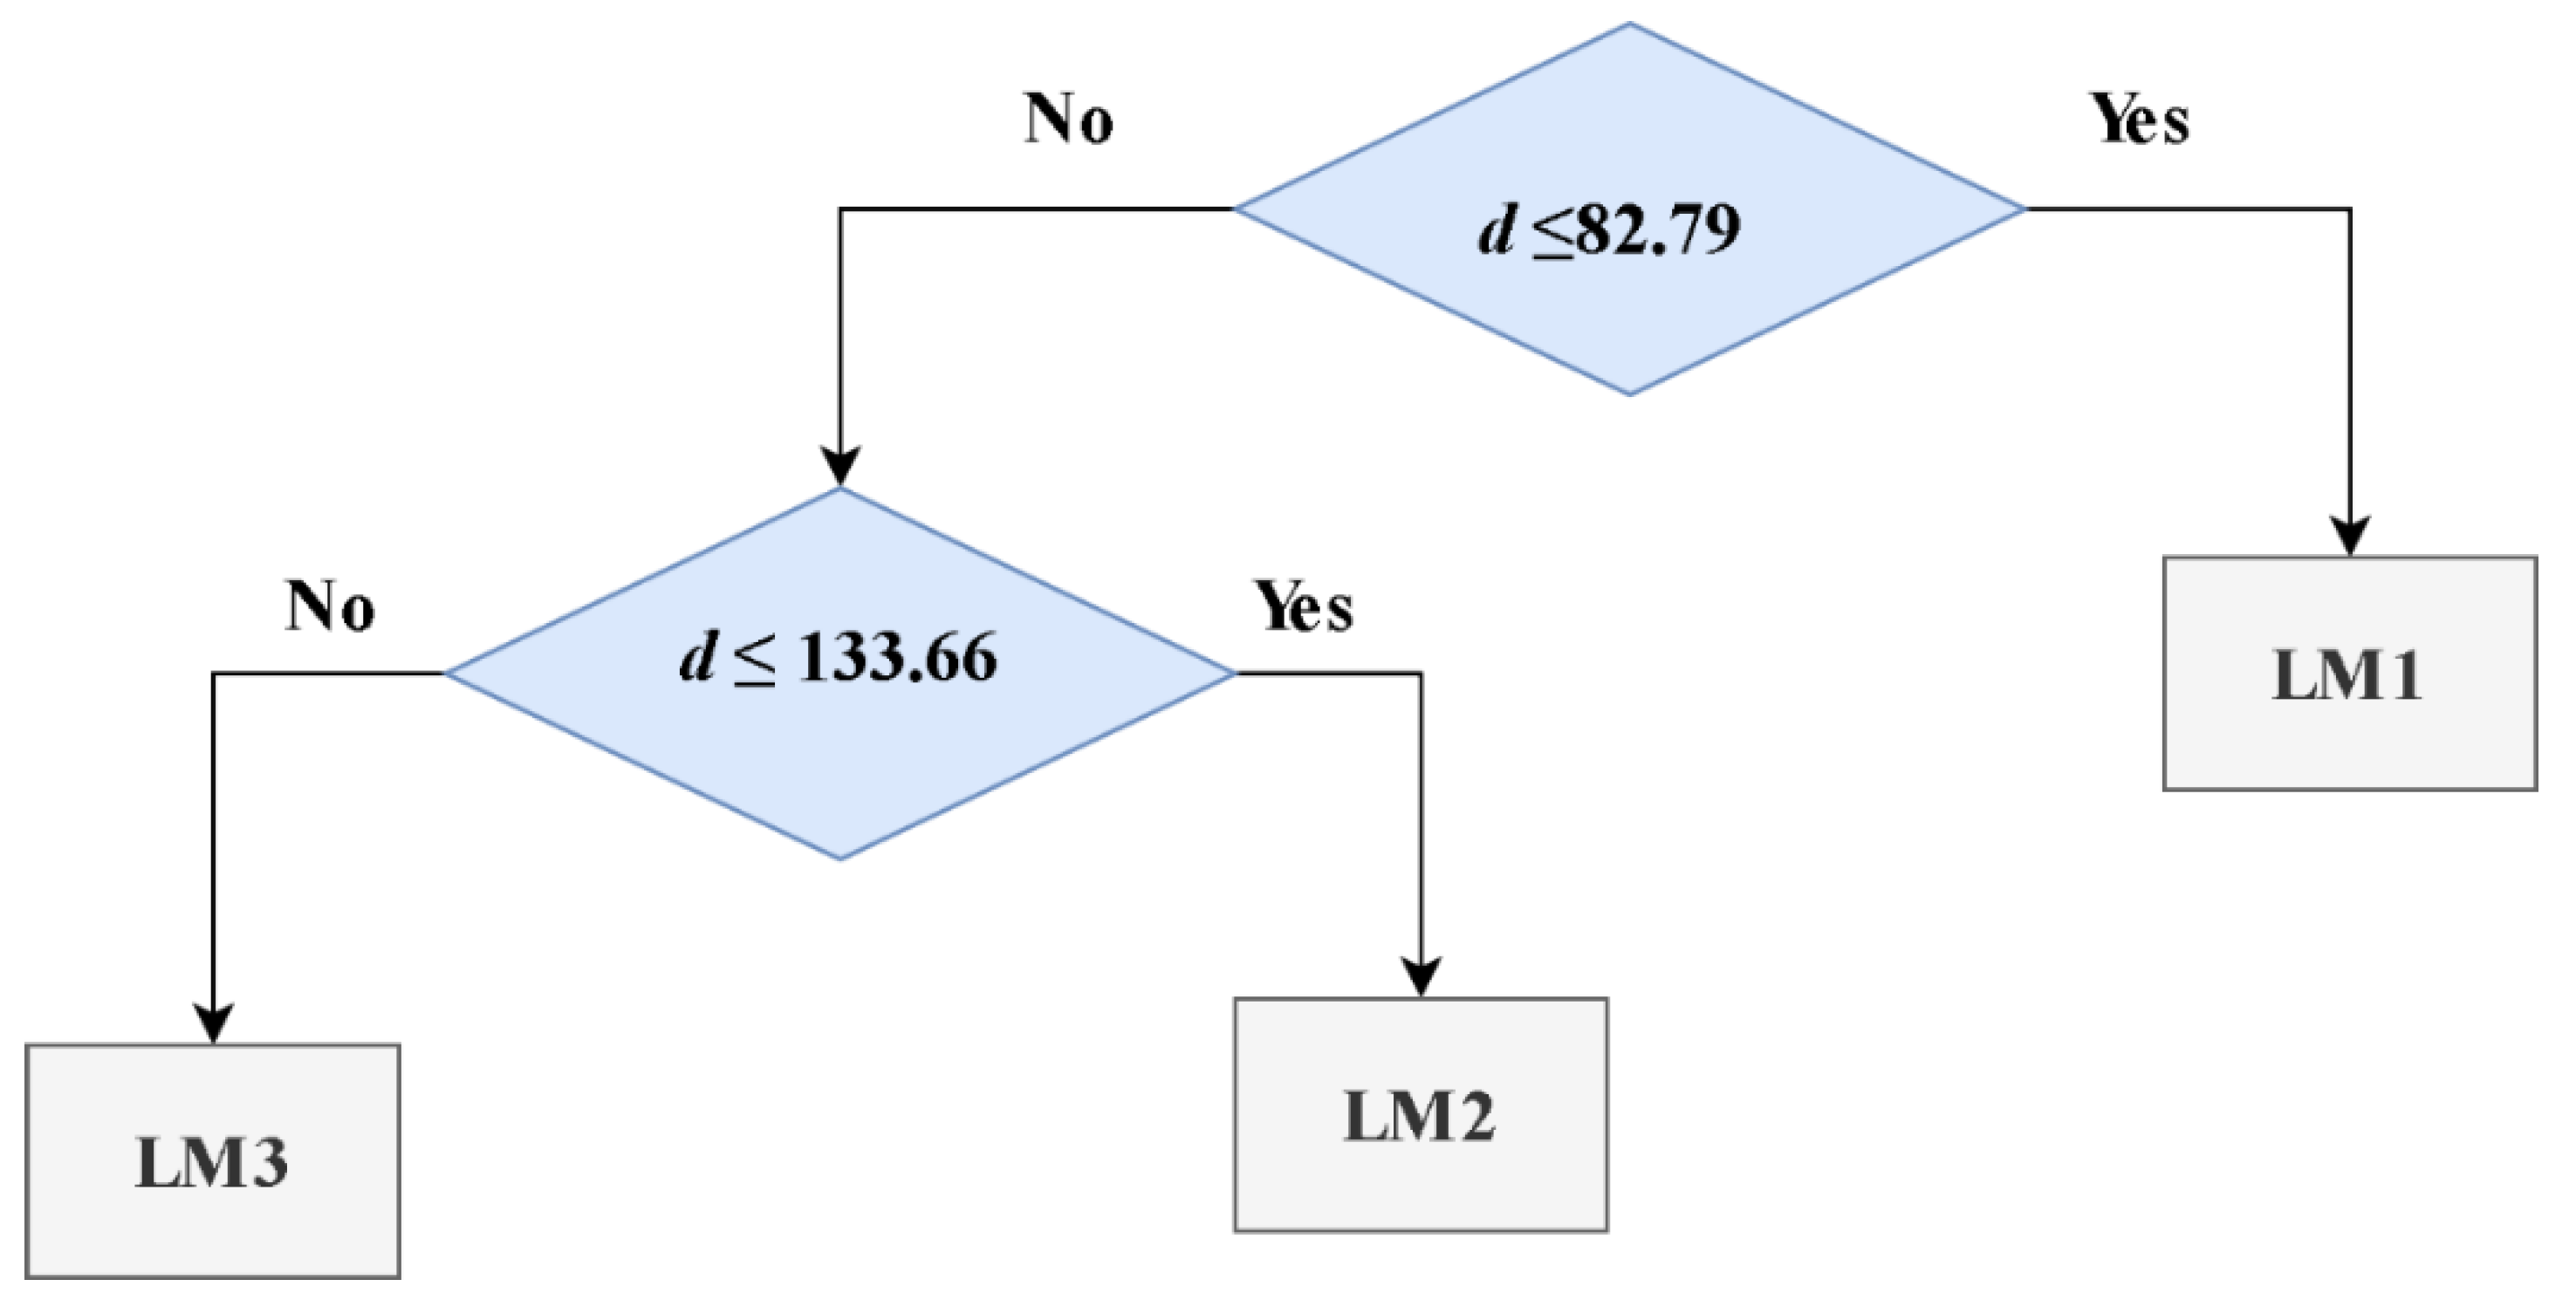
where a , b , c , e , f , and g are constants. The M5P algorithm is a tree-based model that generates regression rules for predicting the target variable. These rules are quite effective in capturing the underlying relationship between the input parameters and the structural strength. The M5P algorithm is illustrated in Figure 4. The developed rules are as follows:
L M 1 :   V u = 0.0127 b 0.5974   d 1.4115   f c 0.5007   ρ 0.1877 λ 0.1634  
L M 2 : V u = 1.4699 b 0.3491 d 0.8836   f c 0.3137 f y 0.009   ρ 0.314   λ 0.1889
L M 3 : V u = 0.0855 b 0.335   d 1.2632 f c 0.3025   f y 0.2581 ρ 0.3736 λ 0.1823
In the analysis of the results, it was observed that d (slab’s depth) was identified as the primary factor for classification purposes. The equations were differentiated based on the values of d =  82.79 mm and 133.66 mm. Given these selected splitting parameters, it is possible to deduce that the RC flat slab depth plays a crucial role in predicting the maximum punching shear strength. This observation aligns with previous subsection results, demonstrating that the correlation coefficient (R) between d and Vu stands out as significantly higher when compared to the majority of the other parameters evaluated, further validating the relationship as depicted in Figure 4. It is crucial to acknowledge that the chosen splitting value may not always possess a distinct physical interpretation, as it is determined with the objective of minimizing the prediction error, as per reference [25]. Nevertheless, the majority of the physical interpretations that are derived from these equations align with the principles of structural engineering.

4.2. Performance Analysis

The accuracy and reliability of a model developed using data mining approaches are highly dependent on the number of data points used. Frank and Todeschini [26] proposed a minimum data-to-variable ratio of 3, with 5 being a safer value. This indicates that a large dataset is necessary to develop a reliable model using data mining approaches. In the present study, the high data-to-variable ratio of 96.4 provided a solid foundation for the developed M5P algorithm and enabled it to make accurate predictions. The correlation coefficient (R) is a widely used measure of the correlation between observed and predicted values. However, it may not always be reliable, especially when the data range is wide, and data points are distributed around their mean. In such cases, the R2 parameter is a more suitable measure to evaluate the correlation between observed and predicted values. In the present study, the R2 parameter was used as an unbiased estimate to measure the degree of correlation between the observed and predicted values. The use of R2 provides a more accurate representation of the correlation between the observed and predicted values and helps to ensure the reliability of the model. In addition to R2, Root Mean Square Error (RMSE) and Mean Absolute Error (MAE) are both used as statistical error metrics to measure the absolute difference between predicted and actual (measured) values in a dataset. These error metrics are commonly used in machine learning and data mining to evaluate the performance of predictive models. The lower the values of RMSE and MAE, the closer the predicted values are to the actual values, indicating a better model performance. The use of these parameters ensures that the model predictions are as accurate as possible.
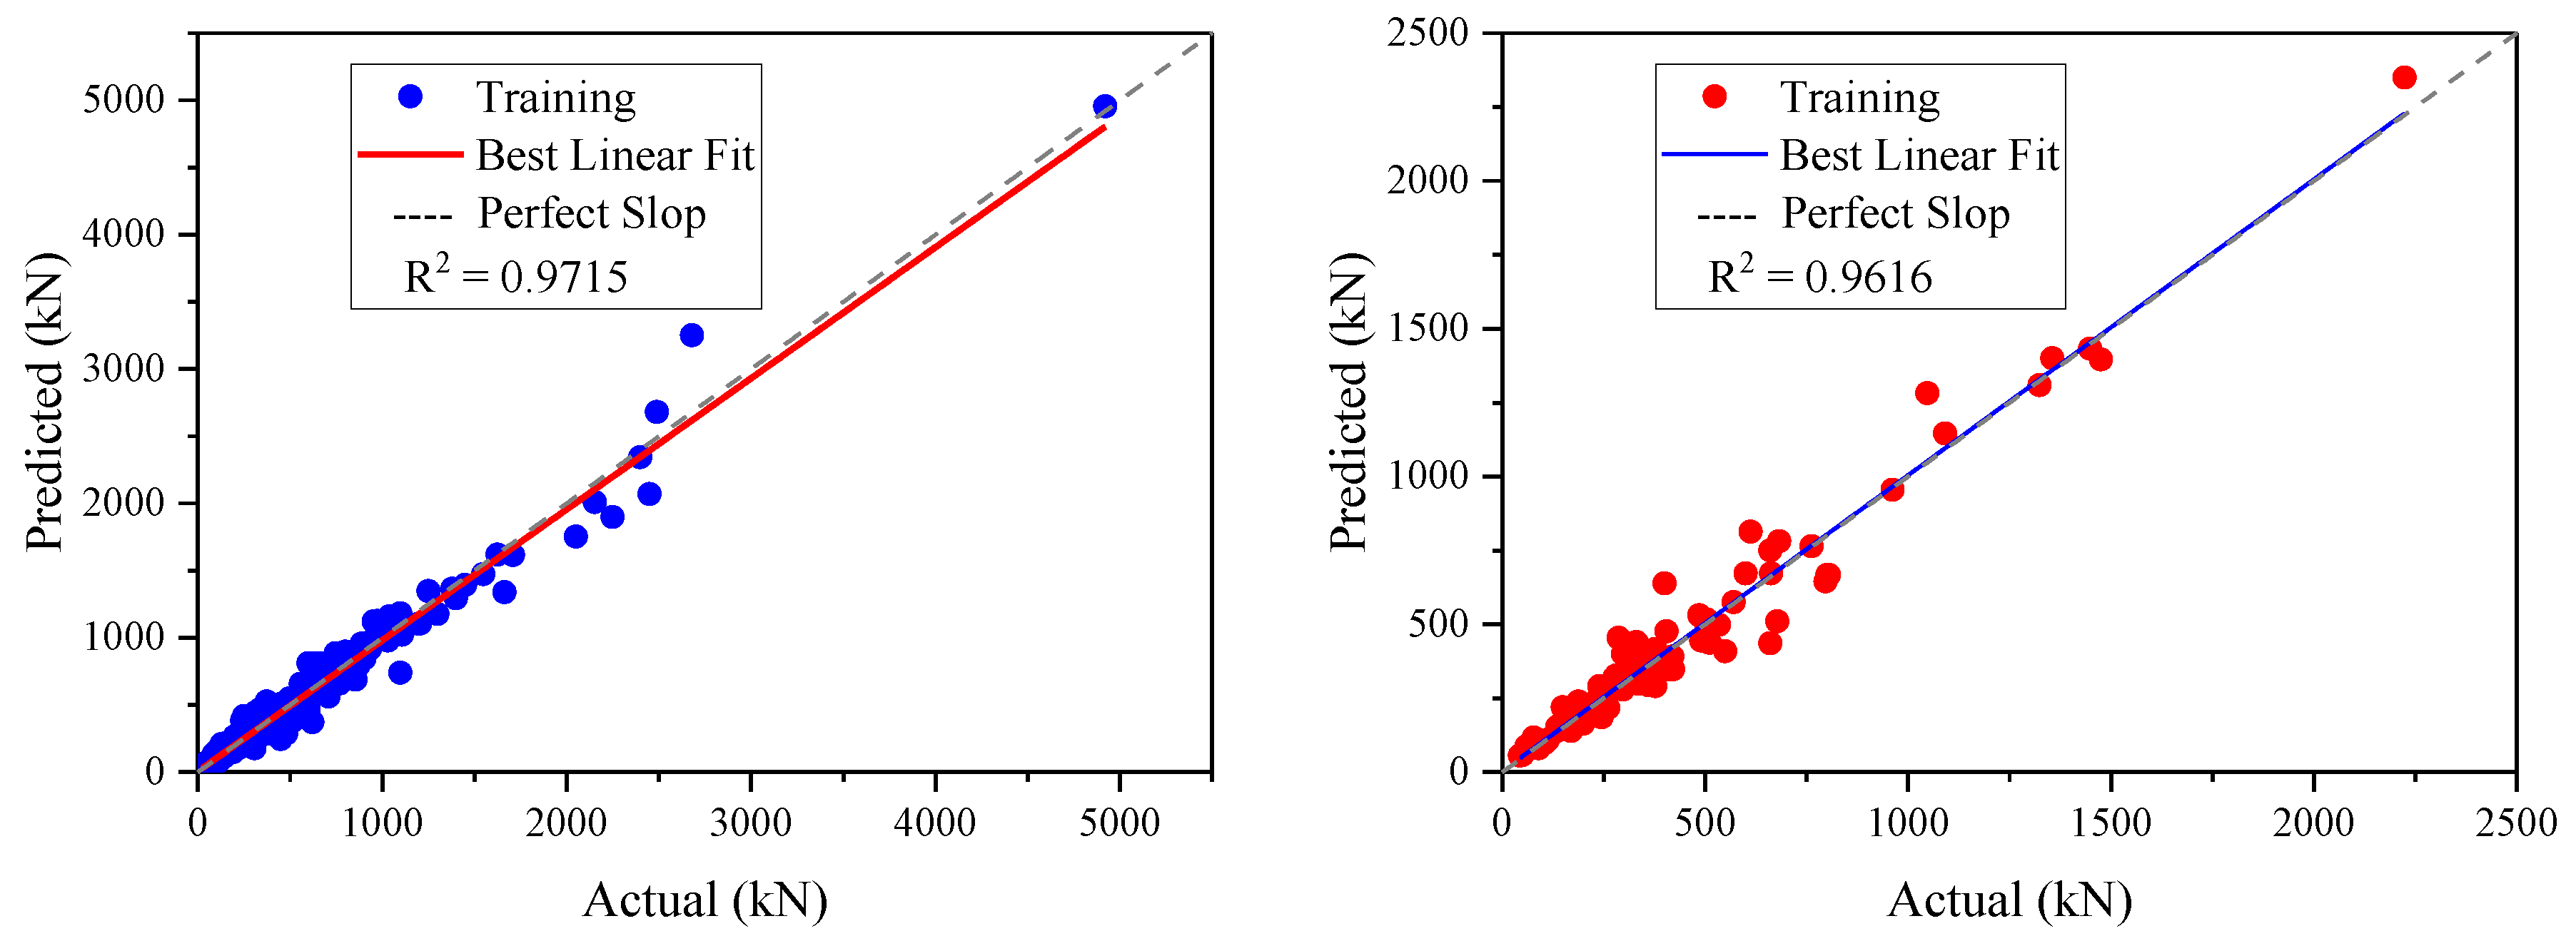
The performance of the developed M5P algorithm on both the training and testing datasets was evaluated in this study. The results are presented in Table 2, which provides statistical error parameters commonly used to evaluate ML algorithms, and Figure 5, which provides a graphical representation of the algorithm performance.
Figure 5, which is a scatter plot, depicts the predicted values of the M5P algorithm versus the actual values for both the training and testing datasets. The optimal line in the scatter plot represents perfect agreement between the predicted and actual values. Therefore, the closer the points are to the optimal line, the better the algorithm performance. The little scattering observed around the optimal line indicates that the M5P algorithm predicted values that align well with the actual values for both datasets.
In the scatter plot for the training dataset, the points are tightly clustered around the optimal line, indicating that the algorithm predicted values that are close to the actual values. Similarly, in the scatter plot for the testing dataset, the points are also clustered around the optimal line, albeit with slightly more scatter than the training dataset. The scatter observed around the optimal line in both datasets is relatively small, indicating that the algorithm can accurately predict the values of interest.
Table 2 provides statistical error parameters that further support the conclusion that the developed M5P algorithm performs well on both datasets. The MAE and RMSE values for the training and testing datasets are relatively low, indicating that the algorithm predicted values that are close to the actual values. Additionally, the R and R2 values for both datasets suggest that the algorithm ability to capture the variability of the data is good.
When considering the entire dataset, the M5P algorithm exhibited a total MAE of 48.0491, RMSE of 76.1038, R of 0.9849, and R2 of 0.9700. These values are within an acceptable range, indicating that the developed algorithm performs well in predicting the values of interest.
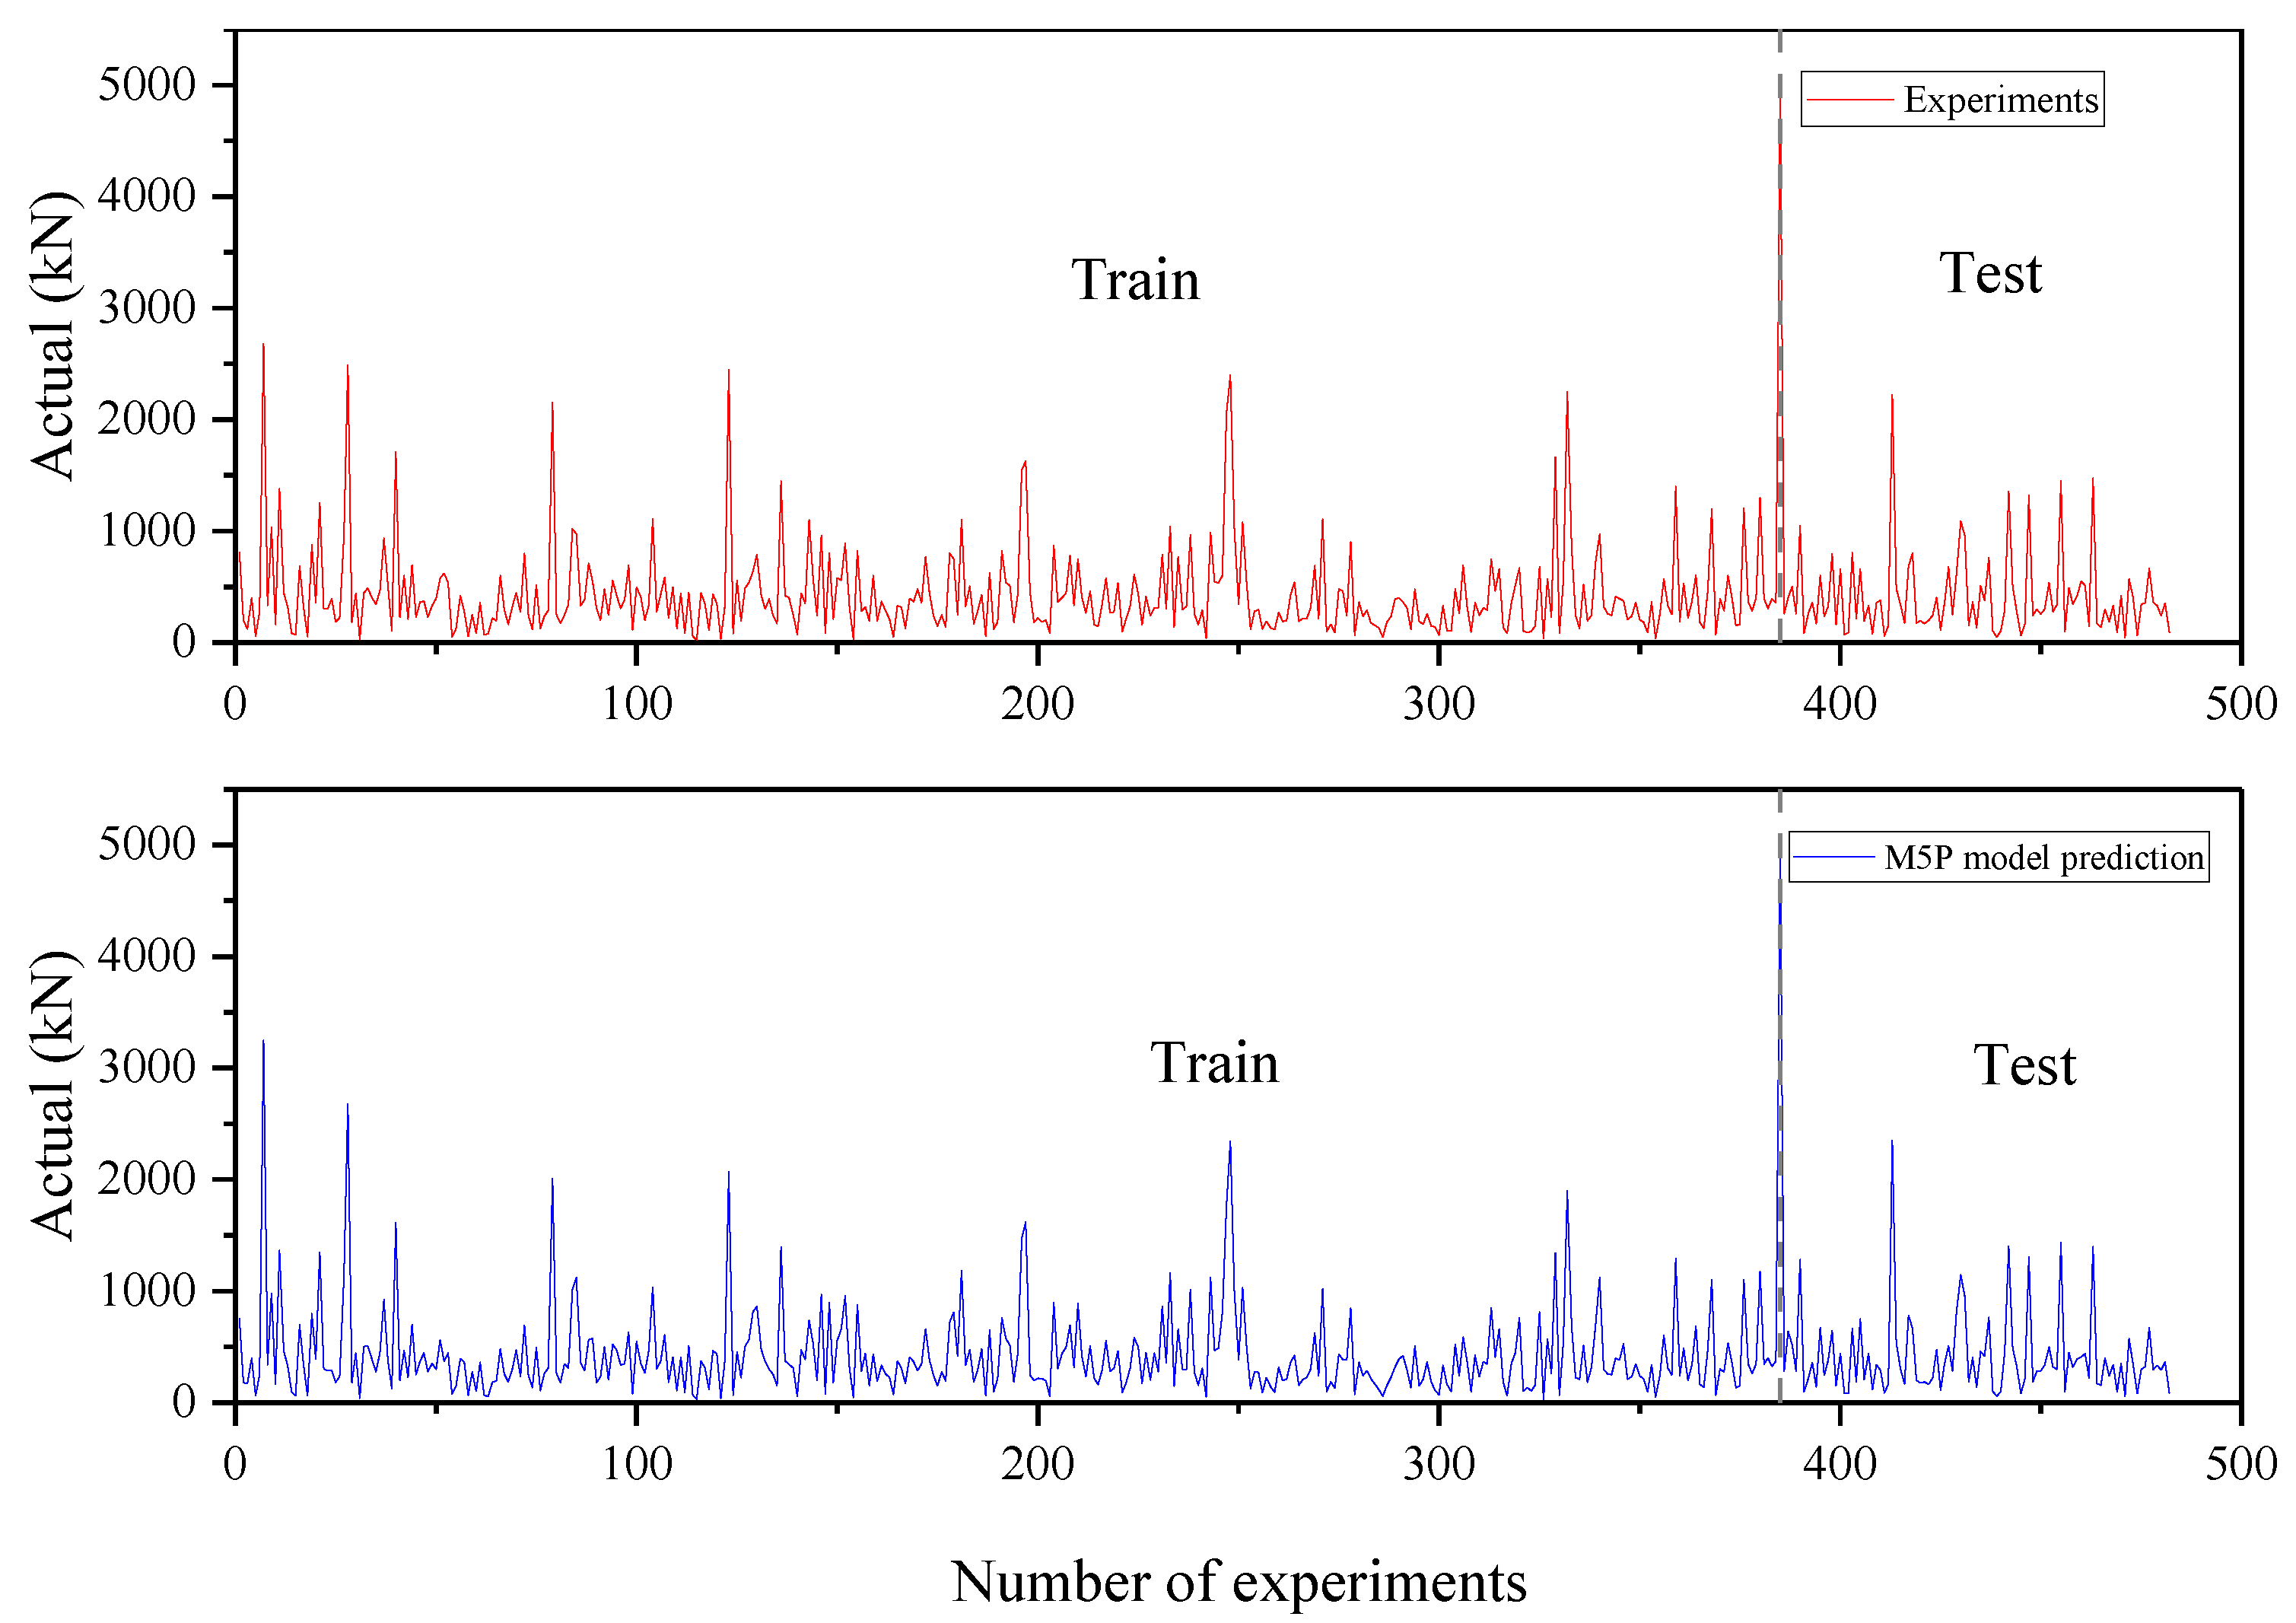
To gain a deeper understanding of the M5P model accuracy and effectiveness, Figure 6 provides a comparison between predicted and experimental punching shear strength values. This comprehensive visual representation includes data from both the training and testing datasets, allowing for a more thorough evaluation of the model performance from other alternative methods.
Also, the cross-validation method was applied on our model to evaluate its robustness across different subsets of the data. The data were divided into five folds, with each fold serving as a test set once while the remaining folds served as the training set. The performance was measured using three key metrics: R2, RMSE, and MAE. The results can be seen in Table 3.
Our model demonstrated consistent performance across all folds with average R2, RMSE, and MAE values of 0.9517, 90.85, and 55.32, respectively. The R2 values range from 0.9410 to 0.9697, indicating that our model explains between 94.1% and 96.97% of the variance in the dependent variable, which is a strong indication of the model’s predictive power. The average R2 of 0.9517 suggests that the model, on average, explains approximately 95.17% of the variance in the dependent variable across the folds.
RMSE and MAE are measures of prediction error. In our cross-validation, the RMSE varied between 56.00 and 125.16, with an average of 90.85. The MAE ranged between 38.75 and 66.28 with an average of 55.32. The standard deviations (SD) of R2, RMSE, and MAE across folds were 0.0121, 25.20, and 10.84, respectively, indicating a reasonable consistency in performance across folds.
In conclusion, regarding the consistency of performance metrics across cross-validation folds and the comparable results from the train, the test split indicates that our model is robust and generalizable across different data subsets.

4.3. Comparative Evaluation of the Newly Formulated M5P Model and Various Other Machine Learning Models

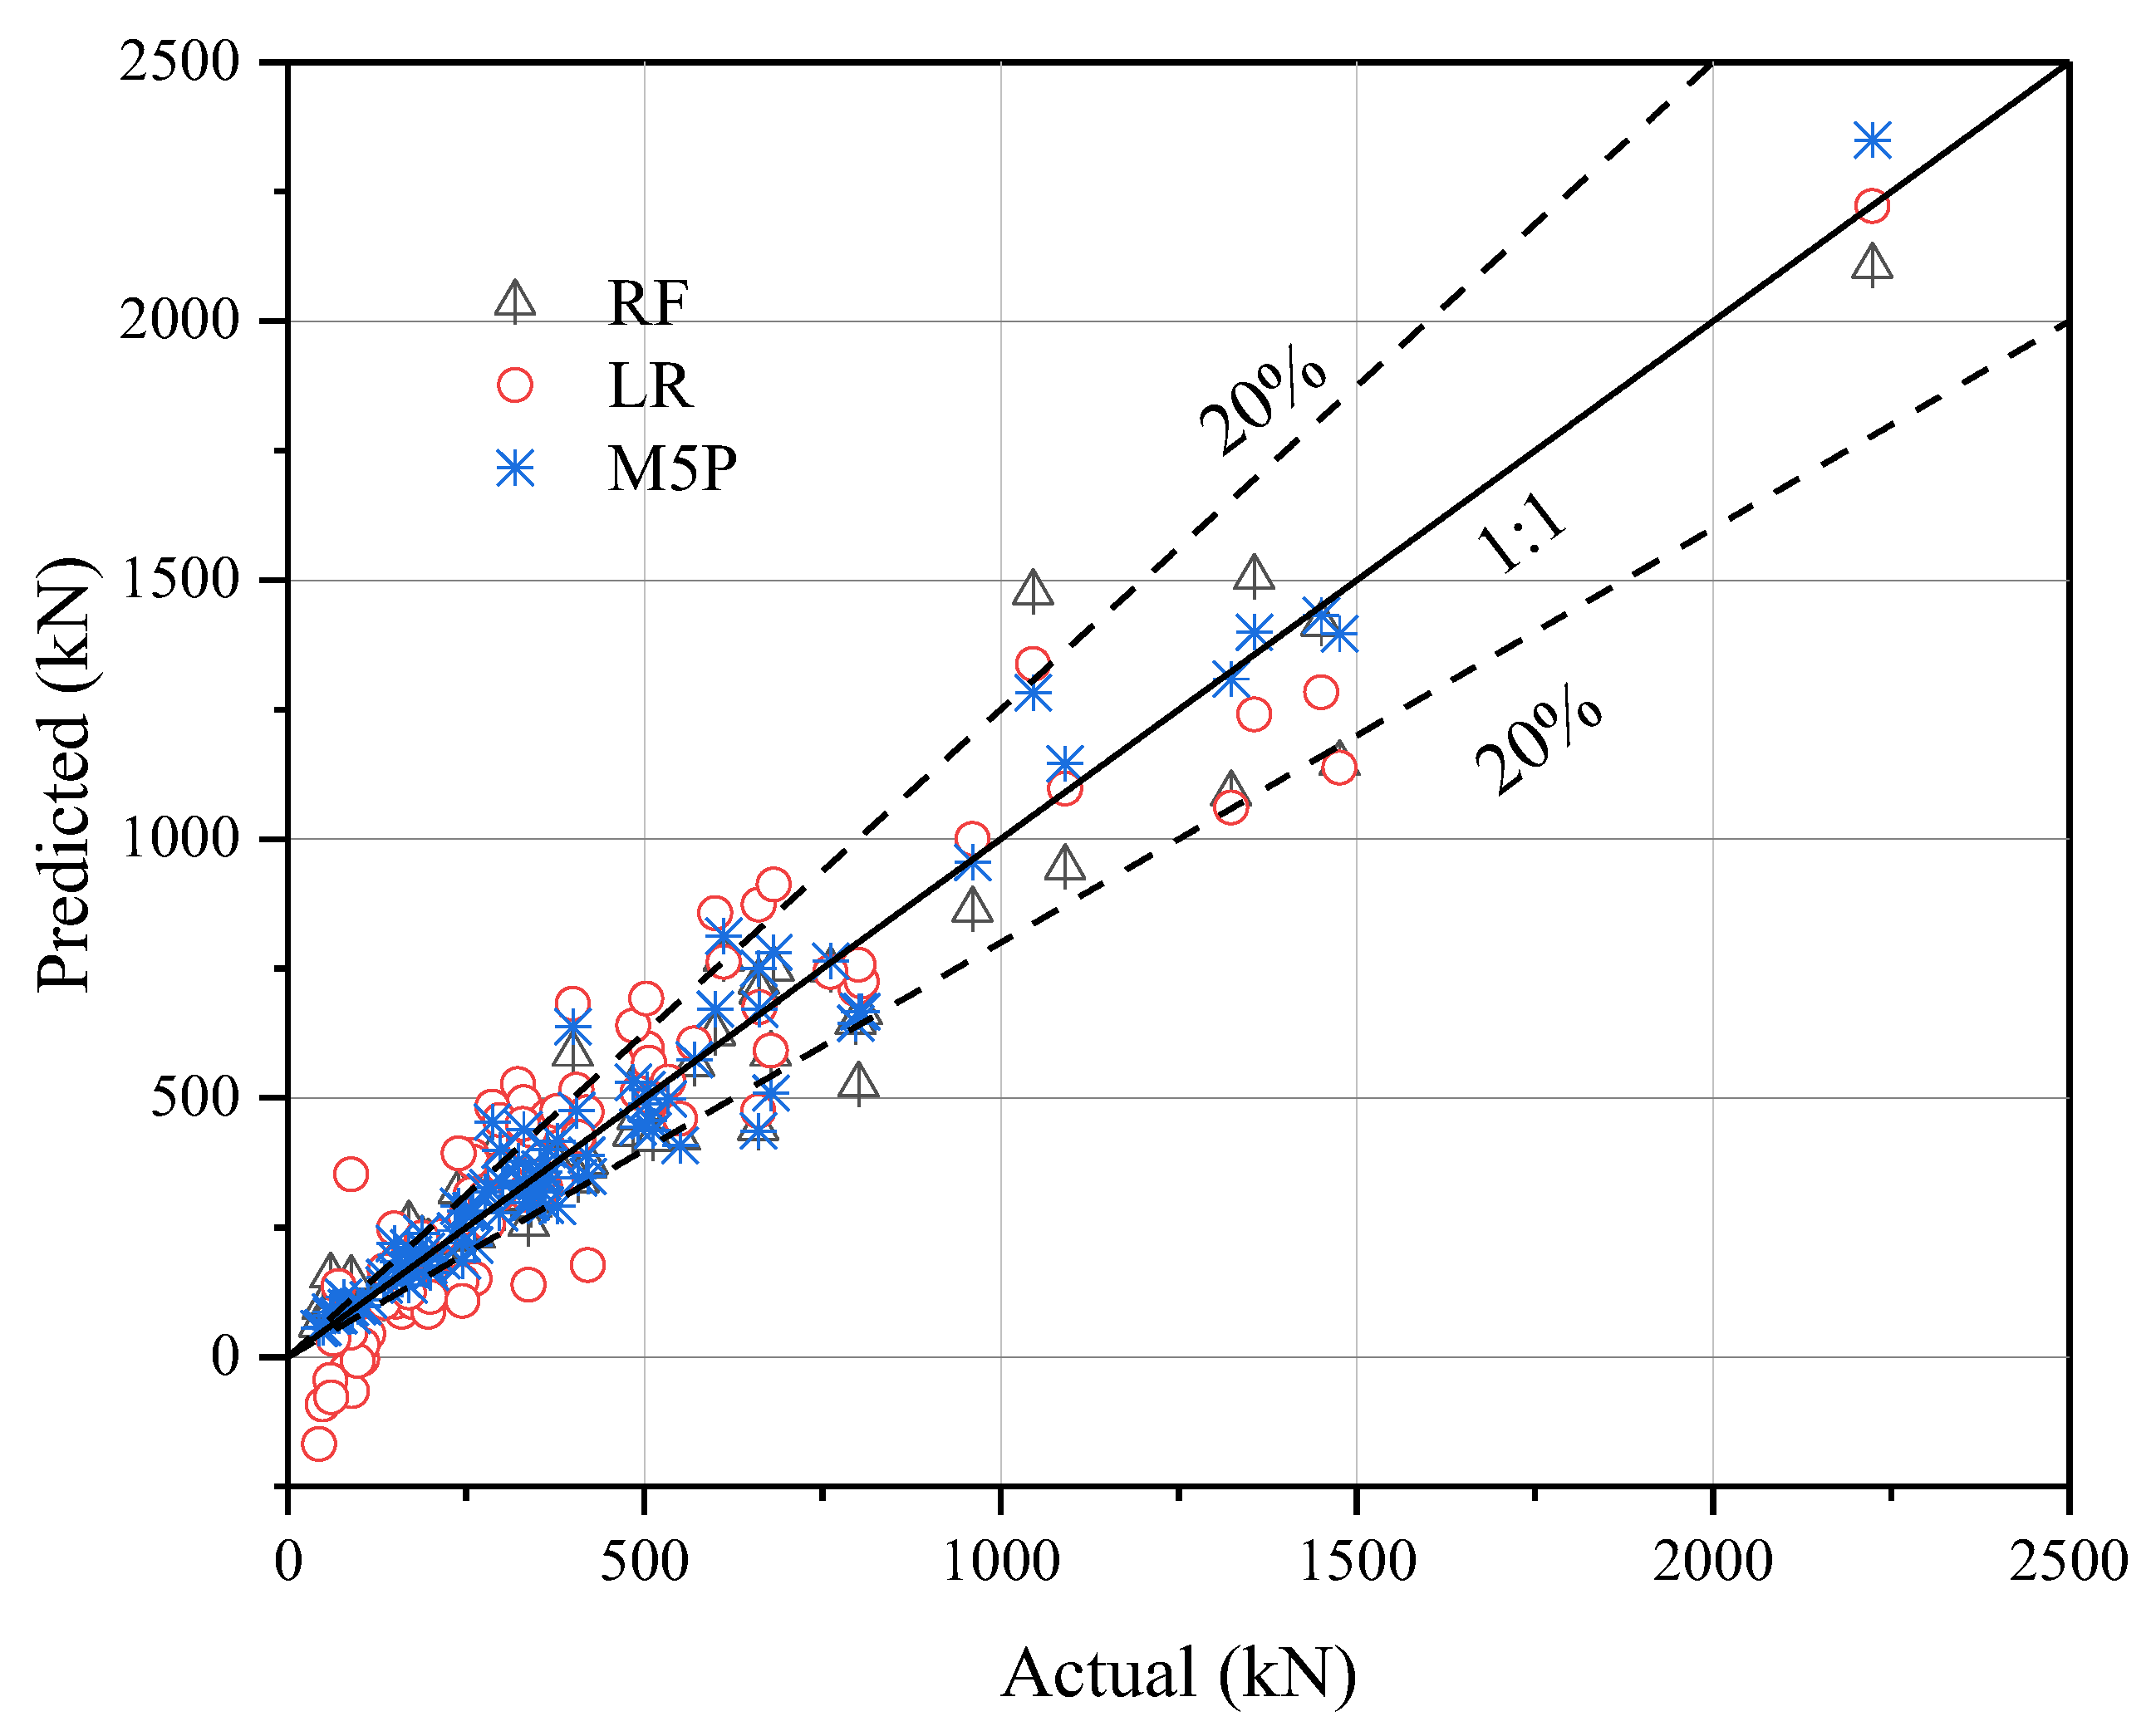
In an effort to assess the predictive power of the developed M5P model, it is systematically compared against two other prevalent machine learning models. The first one is a black-box model, specifically the Random Forest (RF) model, and the second is a white-box model, namely Linear Regression (LR). This comparative analysis is conducted within the context of predicting the punching shear resistance of flat slabs, using a comprehensive experimental database for a robust evaluation. Figure 7 illustrates a graphical representation showcasing the correlation between the observed experimental shear strength and the predicted shear strength. These correlations are derived from data present in the testing evaluation database. The graph incorporates a tolerance of ±20%. Generally, it can be observed that the capacity predicted with the different methods diverges from the ‘perfect line’. This ‘perfect line’ is conceptually defined as the line where the actual values align perfectly with the predicted values. The plot illustrates that the predictions generated with the M5P model are generally less scattered when compared to other machine learning models. A majority of these predictions comfortably fit within the ±20% boundaries of the line of equality, also known as the perfect line.
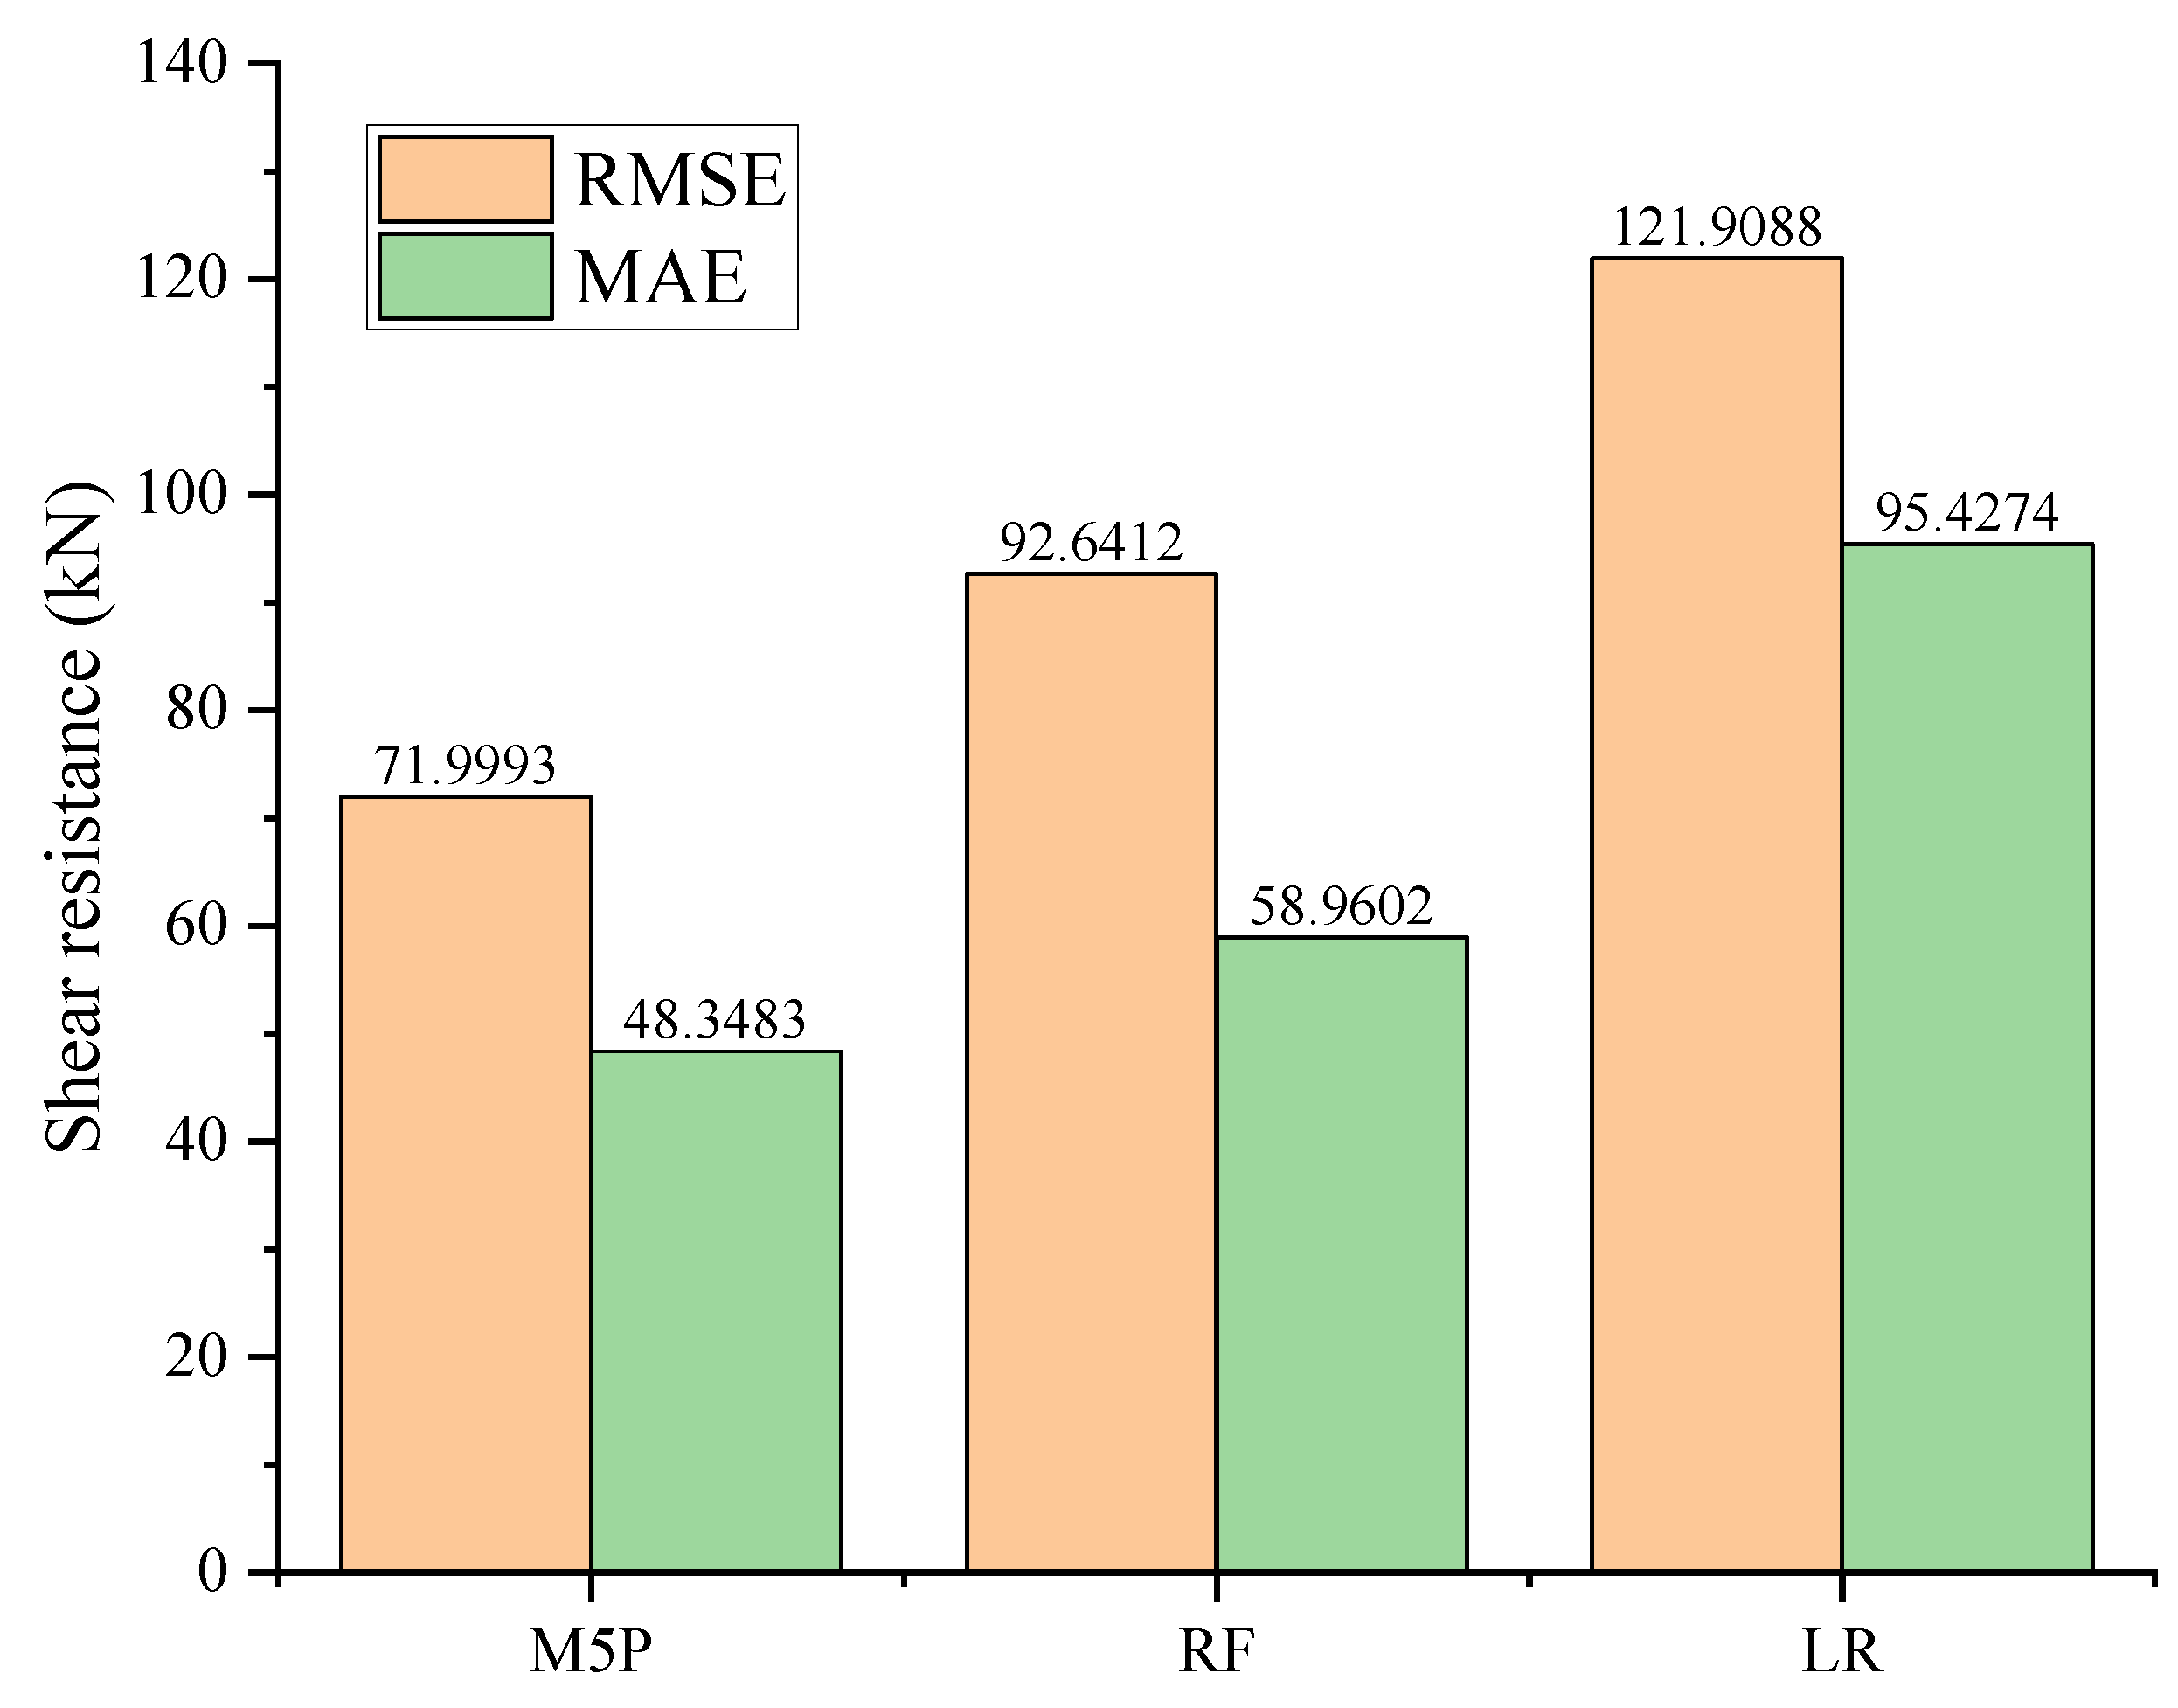
Table 4 and Figure 8 offer a comprehensive statistical analysis comparing the proposed machine-learning (ML)-based models for shear strength. This comparison is conducted using the testing database. Additionally, Figure 8 visually represents a comparison between the M5P model and other machine learning models, focusing on RMSE and MAE results. Upon reviewing the data from both Table 4 and Figure 8, it is clear that the M5P model outperforms the rest in terms of having the highest R2 values and the lowest values for both RMSE and MAE, amongst all models examined.

4.4. Design Code and Empirical Formulas

The equation for the punching shear resistance for RC flat slabs without shear reinforcement in ACI 318-19 [6] is as follows:
V n = m i n 1 3 , 1 6 1 + 2 β , 1 12 2 + α s d b o λ s f c b o d
The ACI 318-19 equation accounts for several crucial factors that affect the overall punching shear strength of the slab. These factors include the column-type-related factor ( α s ), ratio of the long to short sides of the column, concentrated load, or reaction area ( β ), and the size effect modification factor ( λ s ). The inclusion of these parameters in the equation represents a significant update from the previous version of the code, ACI 318-14.
The size effect modification factor ( λ s = 2 / ( 1 + 0.004 d ) 1 ) is particularly noteworthy as it acknowledges the impact of the slab depth (d) on the punching shear strength. This factor has a maximum value of 1, ensuring that the size effect does not overestimate the punching shear resistance. The column-type-related factor ( α s ) differentiates between interior, edge, and corner columns, assigning distinct values for each column type. In the given study, only interior columns are considered, resulting in an α s value of 40. This factor recognizes that the punching shear stress distribution around a column varies depending on its location within the slab. Finally, b o   represents the critical section perimeter (in mm) and is calculated as follows:
b o = 4 ( c + d )   for   square   columns π ( c + d )   for   circular   columns 2 c 1 + c 2 + 2 d   for   rectangular   columns
where c denotes the dimensions of the square column section or the diameter of a circular column.
The equations from Eurocode 2 [7] for the punching shear strength for RC flat slabs without shear reinforcement is calculated as follows:
V u = m a x 0.18 ξ 100 ρ f c k 1 / 3 b 0 d 0.035 ξ 3 / 2 f c k b 0 d
The above equation considers the size effect factor ( ξ ), the characteristic cylinder strength of concrete ( f c k ), and the reinforcement ratio ( ρ ) to determine the punching shear resistance (Vn). The size effect factor ( ξ = 1 + 200 d 2 ) accounts for the influence of the slab depth on the punching shear resistance, similar to the λ s factor in ACI 318-19, but with a different formulation. The reinforcement ratio ( ρ ) plays a crucial role in Eurocode 2, whereas it is not explicitly included in the ACI 318-19 equation. This equation is valid when ρ ≤ 0.02. Additionally, the perimeter of the critical section ( b o ) represented in Equation (9) is calculated differently in Eurocode 2 when compared to ACI 318-19:
b 0 = 4 ( c + π d )   for   square   columns π ( c + 4 d )   for   circular   coltmns
The equation for the punching shear resistance provided by BS 8110-97 [5] for RC flat slabs without shear reinforcement is calculated as the below:
V c = 0.79 k 100 ρ t f c u 25 1 3 b 0 d , ρ 3 %
This equation incorporates factors like the reinforcement ratio ( ρ t ), cubic compressive concrete strength ( f c u ), and effective depth of the slab (d) to determine the punching shear resistance (Vc). The critical perimeter ( b 0 ) is calculated differently in BS 8110-97 when compared to Eurocode 2 and ACI 318-19, as it assumes a rectangular shape at a distance of 1.5 d from each column face. The factor k = 400 d 1 / 4 , which accounts for the size effect, has a distinct formulation compared to the size effect factors in both Eurocode 2 and ACI 318-19.
Elshafey et al.’s [3] approach for determining the punching shear resistance of RC flat slabs without shear reinforcement offers an alternative method when compared to established design codes such as ACI 318-19, Eurocode 2, and BS 8110-97. Elshafey et al.’s approach shares the same critical perimeter ( b 0 ) as ACI 318-19. The key equations from these authors are as follows:
V c = v c A 0
v c = 0.51 f c 0.41 ρ t 0.38 k
k = 250 d 0.1
A o = 4 ( c + d ) d
Elsanadedy et al. [4] propose an alternative method for determining the punching shear resistance (Vc) in RC flat slabs without shear reinforcement, which stands apart from other established design codes such as ACI 318-19, Eurocode 2, and BS 8110-97. In this approach, the punching shear resistance is calculated using unique equations and factors that incorporate several common parameters.
The key equation in Elsanadedy et al.’s approach is
V c = 0.127 f c 3 ρ t f y 1 + 8 d b 0 1 + 125 d b o d
Chetchotisak et al. [27] presented a distinct approach for calculating the punching shear strength (Vc) in RC slab–column connections without shear reinforcement. They gathered data from 342 slab–column connections and used multiple linear regression to develop a model in logarithmic space. Their method provides an alternative to established design codes, such as the ones previously referred to.
The key equation in Chetchotisak et al.’s approach is
V n = 92.43 f c 1.21 1 % ρ 1.47 b o 0.42 ( d ) 1.35 ( k ) 4.66
In this method:
f c is the concrete compressive strength.
ρ t denotes the reinforcement ratio.
b 0 (mm) is the critical shear perimeter, as specified in ACI 318-14.
d is the effective depth of the slab.
k is an additional factor calculated as k = ( n ρ ) 2 + 2 ( n ρ ) n ρ , w i t h   n = E s / E c = 2 × 10 5 / 4700 f c .

4.5. Comparison with Previously Developed Models

Table 5 provides a comparison of statistical error parameters for the M5P model and other available punching shear design equations described in the previous section. The inclusion of the mean value (μΩ) and coefficient of variation (COVΩ) of the ratio of the actual punching shear strength to the model results (Ω = Vn,test/Vn,pred) in addition to RMSE and R2 values is important. These parameters help determine whether the model overestimates or underestimates the punching shear strength and provide an evaluation of the prediction model accuracy and precision, respectively. Accurate predictions must have μΩ values close to 1 and low COVΩ values.
The results in Table 5 indicate that the proposed M5P model outperforms all other models. While the performances of the Eurocode 2 [7] and Chetchotisak et al. models are reasonable, the M5P model shows significant improvements. Compared to the Chetchotisak et al. model, which is considered the most precise model among the design equations, the M5P model shows a significant reduction of 24.1% and 18.6% in terms of RMSE and MAE values, respectively. The μΩ and COVΩ values for the M5P model are also notably lower than those from the other models, indicating a better model performance.
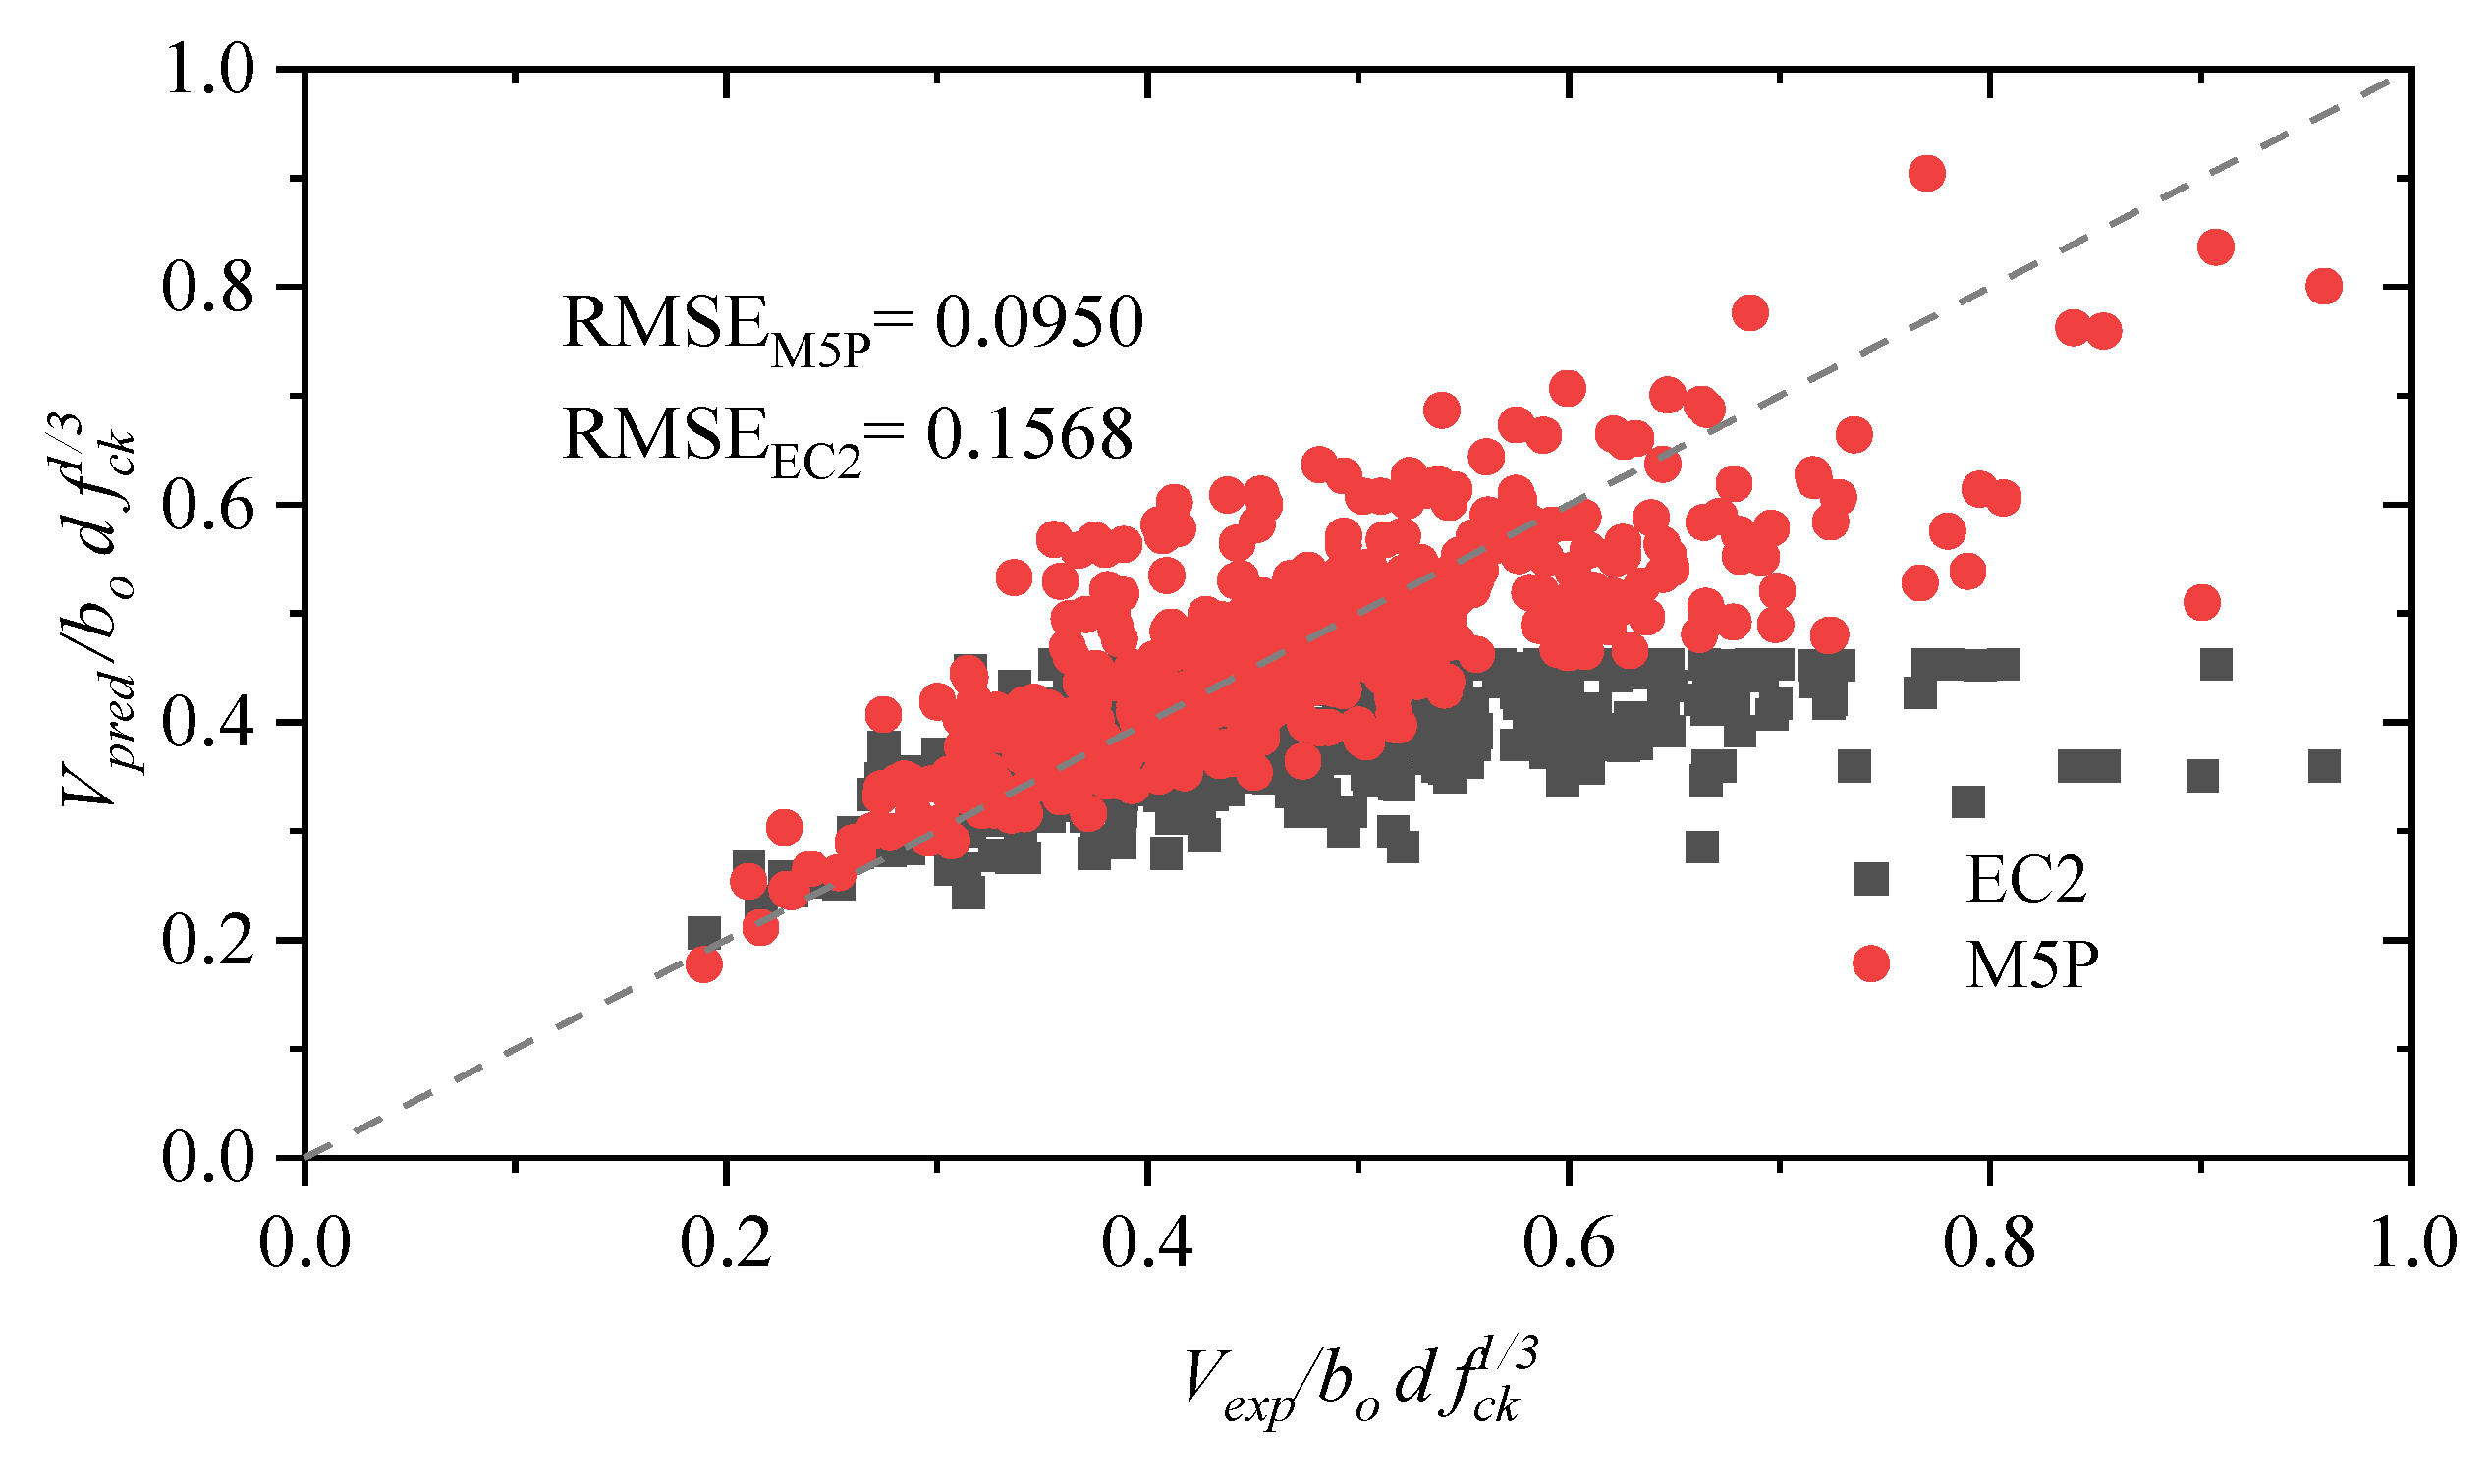
The experimental dataset under consideration encompasses a diverse range of material properties and member sizes. To account for this variety, the normalized punching shear resistance was calculated based on the concrete compressive strength (fc), effective depth (d), and critical section (bo) of Eurocode 2 (EC2) [13] since this code performs better than the other two building codes evaluated in this study.
For the M5P model and the experiments, the normalized punching shear resistance was determined using the method prescribed using Eurocode 2 (EC2) design code for identifying the critical section and concrete compressive strength. In order to evaluate the performance of the models, the Root Mean Squared Error (RMSE) value was employed as the assessment metric. Figure 9 presents the best-fit lines and their corresponding RMSE values for each model. Upon examining these values, it becomes apparent that the M5P model boasts a smaller RMSE compared to the Eurocode 2 (EC2) design code. This suggests that the M5P model demonstrates a superior accuracy in predicting the normalized punching shear resistance. The RMSE values for the M5P model and Eurocode 2 (EC2) stand at 0.0950 and 0.1568, respectively, indicating a significant difference in their predictive capabilities. This considerable gap in RMSE values highlights the improved performance of the M5P model in comparison to the Eurocode 2 (EC2) design code when it comes to predicting the normalized punching shear resistance. Furthermore, a closer look at the stress unit in Figure 9 reveals some considerable discrepancies between the experimental and predicted results. These differences suggest that the parameters utilized for normalization might not adequately represent the characteristics of punching shear strength. This observation underscores the need for the further investigation and refinement of the normalization parameters to improve their ability to capture the essential features of punching shear strength.

4.6. Model Error Susceptibility to Input Variables

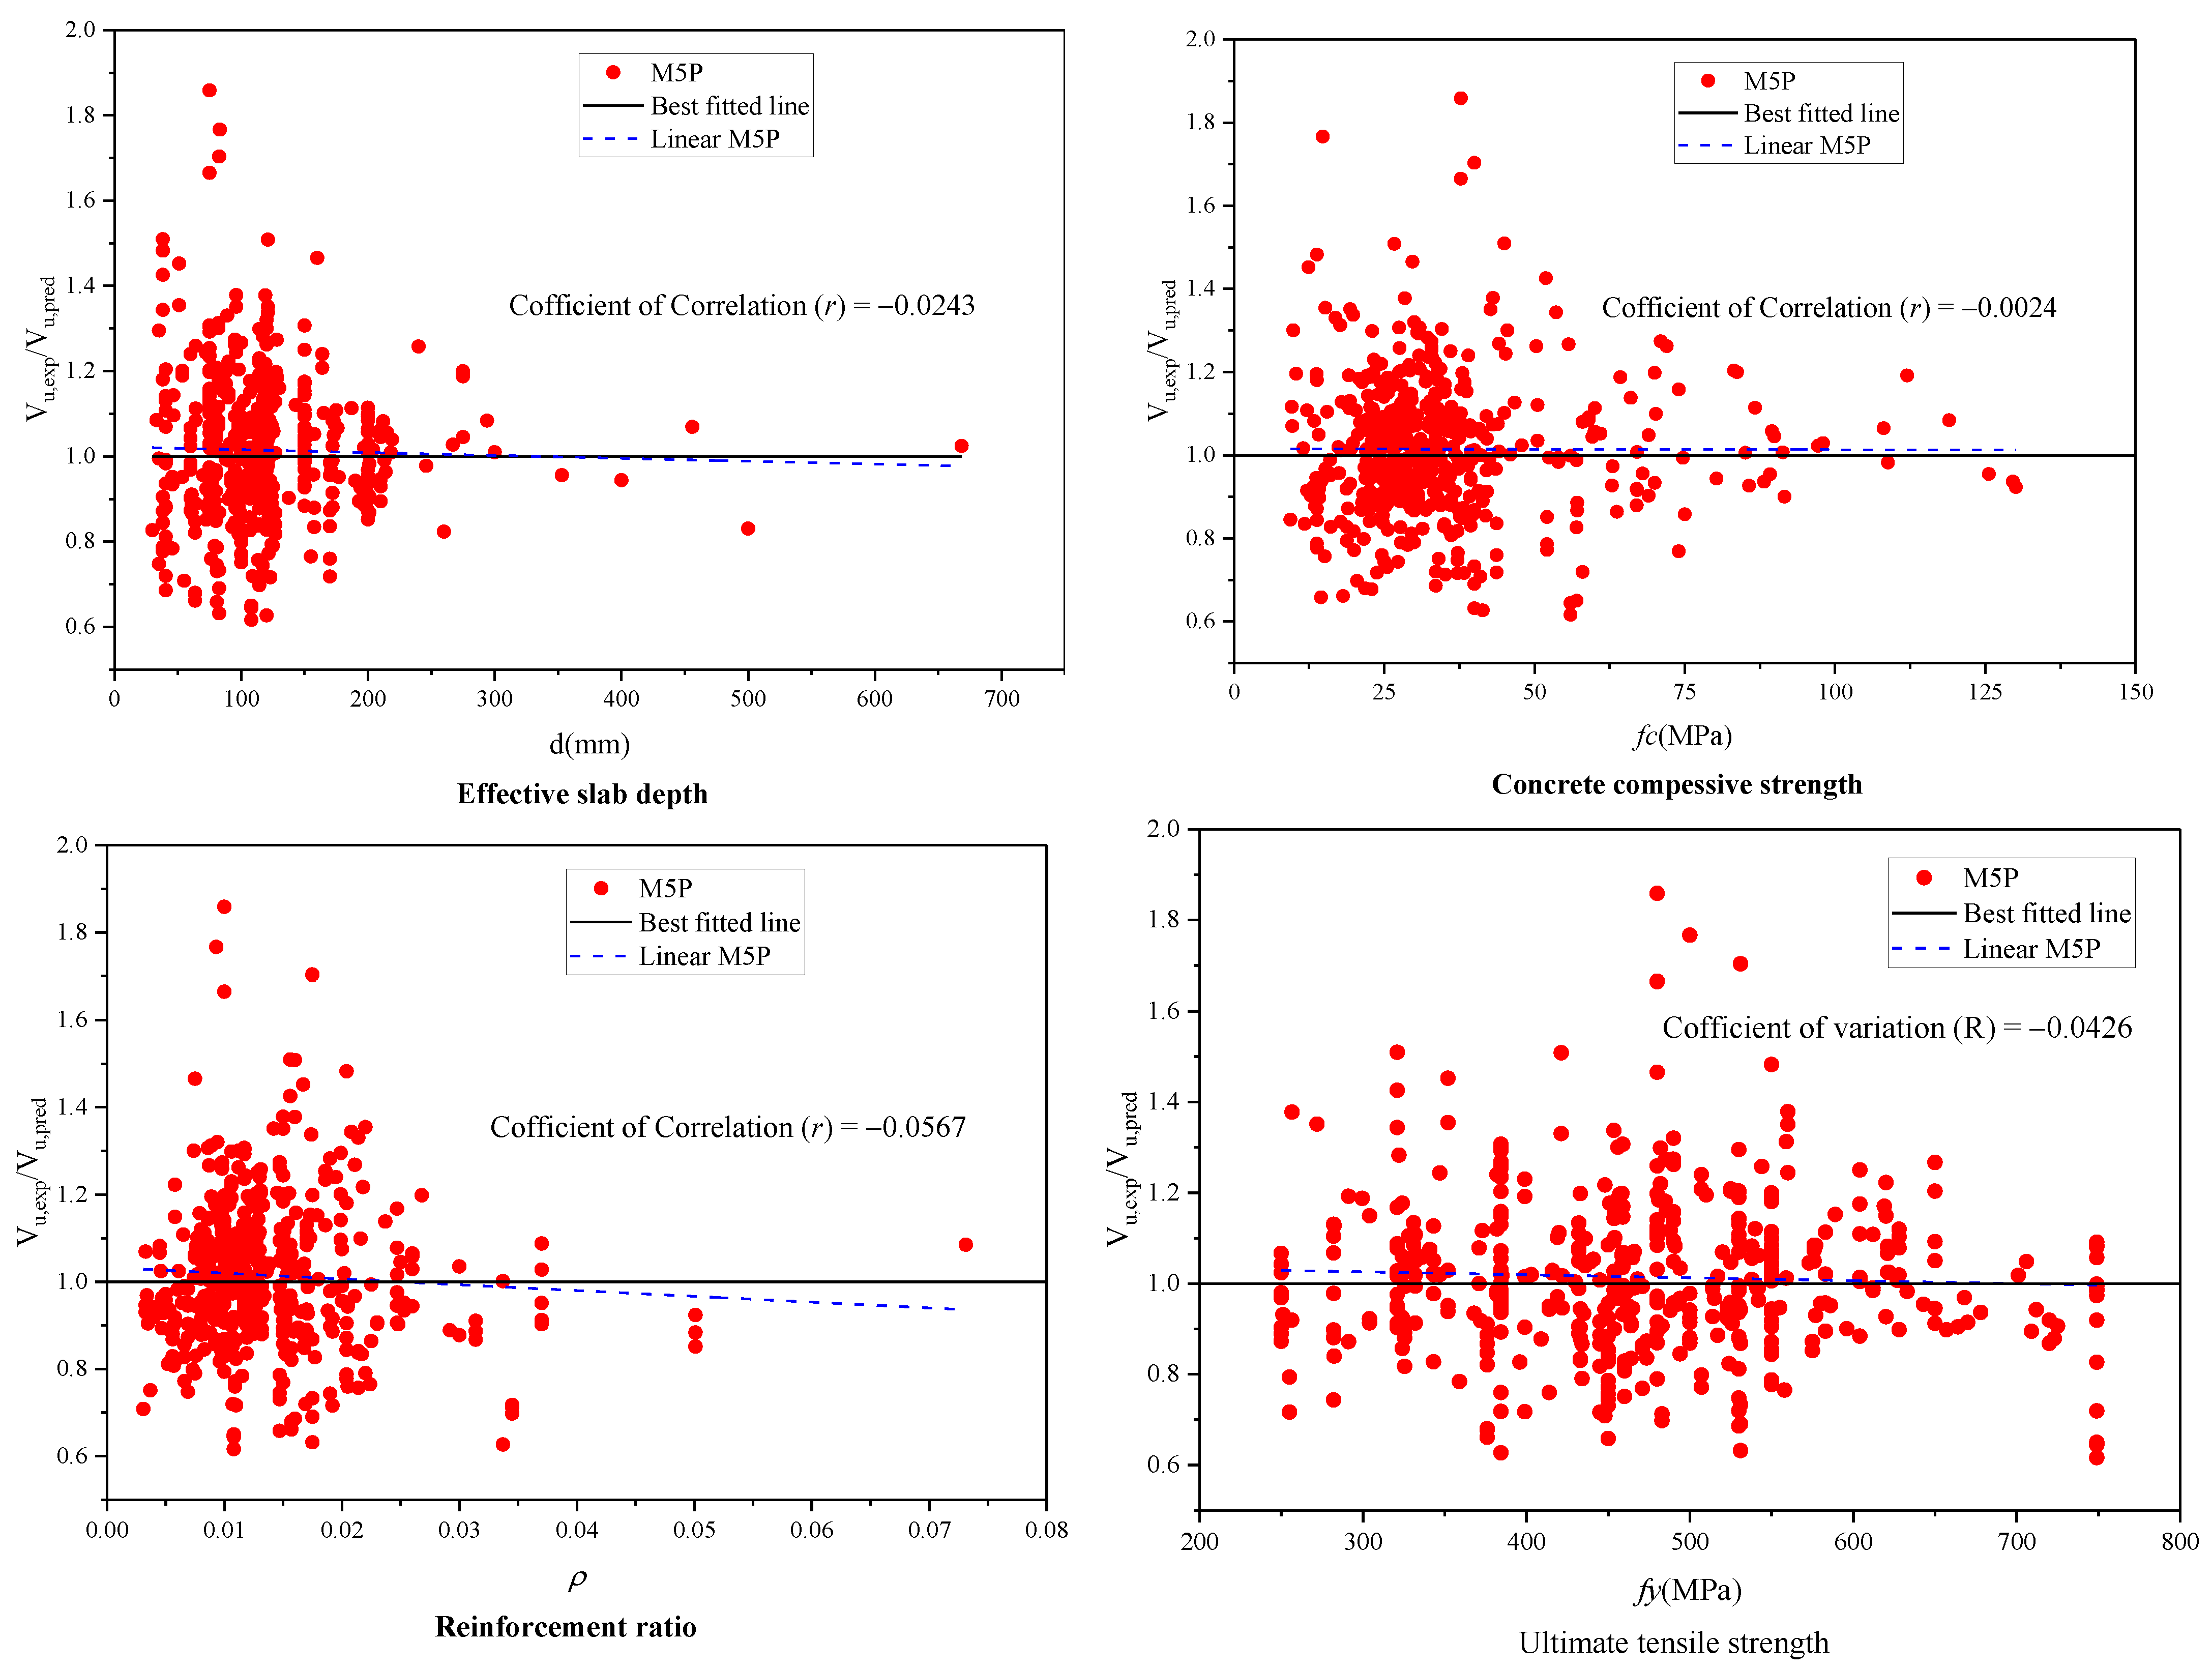
An ideal predictive model should exhibit no discernible correlation or pattern between its input design variables and the resulting model error, as indicated in reference [28]. As per reference [29], correlation coefficients can be interpreted as follows: coefficients from 0.4 to 0.6 demonstrate moderate correlations, those from 0.2 to 0.4 indicate weak correlations, and coefficients ranging from 0 to 0.2 signify very weak correlations. In order to delve deeper into the predictive capabilities of the proposed equation, it is crucial to evaluate the model error trend in relation to the primary design variable, as illustrated in Figure 10. Upon examining the figure referred to, it becomes evident that the M5P-based strength model boasts a high level of accuracy, with no significant trends observed in connection with the design parameters. This suggests that the model is effective in maintaining a low correlation between input design variables and model error, adhering to the principles of an ideal predictive model.

4.7. Parametric and Sensitivity Analyses

In the quest to understand the influence of each separate input variable on the prediction of the punching shear strength utilizing the M5P-based method, a thorough sensitivity analysis was carried out. The sensitivity analysis comprehensive approach proved instrumental in uncovering the most significant factors that influenced the punching shear strength predictions. By systematically excluding input variables and analyzing the model performance, researchers were able to identify areas for improvement and refine the model for more accurate results. The analysis involved methodically excluding individual input variables and using the remaining data for the development and evaluation of the predictive model. This approach enabled researchers to pinpoint the most significant factors that played a role in the prediction of the punching shear strength. Table 6 demonstrates the impact of individual input variables on the M5P model performance, considering the percentage changes in R2, RMSE, and MAE values for both the training and testing sets when specific input variables are excluded. As anticipated, the most consequential variable among the inputs affecting the punching shear strength proved to be the effective depth of the slab (d). Excluding the effective depth (d) led to the most significant reductions in performance across all measures: R2 decreased by 32.28% for the training set and 38.91% for the testing set, while RMSE increased by 252.7% and 218.0%, and MAE increased by 161.1% and 182.5% for the training and testing sets, respectively. These substantial reductions emphasize the crucial role of the effective depth of the slab (d) in the model. On the other hand, excluding the yield strength of reinforcement ( f y ) had the least impact on performance: R2 decreased by 1.87% for the training set and 2.18% for the testing set, while RMSE increased by 7.45% and 4.88%, and MAE increased by 0.77% and 2.12% for the training and testing sets, respectively. The relatively smaller changes in performance metrics indicate a lower influence of the yield strength of reinforcement ( f y ) on the model compared to other variables. This consistency provided further insights into the relationship between the input variables and their influence on the prediction of the punching shear strength, thereby allowing researchers to better understand the underlying mechanisms and optimize the model accordingly.

5. Conclusions

This study aimed to develop an accurate and reliable M5P-tree-based model to predict the punching shear capacity of RC flat slabs without shear reinforcement. The motivation behind the development of this model was to address the limitations of existing methods and provide a more comprehensive tool for structural engineers. The key findings of the study and the limitations of the research are summarized below.
  • The M5P algorithm outperformed existing models and design codes, providing more accurate predictions for the punching shear strength. This improved accuracy could lead to more efficient designs and increased safety in RC structures.
  • The effective depth of the slab (d) was identified as the most significant factor affecting the punching shear strength, which is consistent with previous studies and engineering experience.
  • The M5P model demonstrated a high level of accuracy, with a low correlation between input design variables and model error. This is an essential characteristic for an ideal predictive model, as it ensures that the predictions are not significantly influenced by irrelevant factors.
  • The sensitivity analysis indicated that the effective depth of the slab (d) had the most significant impact on the model performance, while the yield strength of reinforcement (fy) had the least impact. This information can be used to prioritize design considerations and improve the overall efficiency of the design process.
As limitations of this research, the following ones can be stated:
  • The dataset used for the development and validation of the M5P model was limited in size and scope, which may affect the generalizability of the results. Future research could benefit from larger and more diverse datasets, including slabs with different reinforcement configurations and materials.
  • This study focused on the prediction of punching shear capacity without considering other failure modes or serviceability requirements. This may limit the model applicability in certain scenarios, where additional factors need to be taken into account.
  • The M5P model does not directly account for the influence of construction quality, environmental conditions, or long-term deterioration on the punching shear capacity. These factors may have significant impacts on the performance of RC flat slabs and should be considered in future research.
Despite these limitations, the M5P model presented in this study holds significant potential for practical application in the field of structural engineering. By offering a robust and accurate tool for predicting the punching shear capacity of RC flat slabs without shear reinforcement, this model can help engineers in designing more efficient and safer structures. However, it is essential to recognize the limitations and scope of the model and to continue refining and expanding it through further research and collaboration among professionals in the field.

Author Contributions

Data collection and conceptualization, M.H.A.; methodology and software, Z.A.T.; writing—review and editing, S.N.H.; machine learning regression models, N.M.A.-A.; review and writing—original draft preparation, H.I.; review, writing, and funding acquisition, L.F.A.B.; editing and visualization, Z.A.-K. All authors have read and agreed to the published version of the manuscript.

Funding

This research received no external funding.

Institutional Review Board Statement

Not applicable.

Informed Consent Statement

Not applicable.

Data Availability Statement

Not applicable.

Conflicts of Interest

The authors declare no conflict of interest.

References

  1. Mangalathu, S.; Shin, H.; Choi, E.; Jeon, J.-S. Explainable machine learning models for punching shear strength estimation of flat slabs without transverse reinforcement. J. Build. Eng. 2021, 39, 102300. [Google Scholar] [CrossRef]
  2. Theodorakopoulos, D.; Swamy, R. Ultimate punching shear strength analysis of slab–column connections. Cem. Concr. Compos. 2002, 24, 509–521. [Google Scholar] [CrossRef]
  3. Elshafey, A.A.; Rizk, E.; Marzouk, H.; Haddara, M.R. Prediction of punching shear strength of two-way slabs. Eng. Struct. 2011, 33, 1742–1753. [Google Scholar] [CrossRef]
  4. Elsanadedy, H.M.; Al-Salloum, Y.A.; Alsayed, S.H. Prediction of punching shear strength of HSC interior slab-column connections. KSCE J. Civ. Eng. 2013, 17, 473–485. [Google Scholar] [CrossRef]
  5. Standards, B. Structural Use of Concrete: Part 1: Code of Practice for Design and Construction; British Standards Institution: London, UK, 2007. [Google Scholar]
  6. ACI Committee 318. Building Code Requirements for Structural Concrete (ACI 318-19) and Commentary (ACI 318R-19); American Concrete Institute: Detroit, MI, USA, 2019. [Google Scholar]
  7. En, B. 1-1. Eurocode 2: Design of Concrete Structures–Part 1-1: General Rules and Rules for Buildings; European Committee for Standardization (CEN): Brussels, Belgium, 2004. [Google Scholar]
  8. Elstner, R.C.; Hognestad, E. Shearing strength of reinforced concrete slabs. J. Proc. 1956, 53, 29–58. [Google Scholar]
  9. Bažant, Z.P.; Cao, Z. Size effect in punching shear failure of slabs. ACI Struct. J. 1987, 84, 44–53. [Google Scholar]
  10. Al-Abdaly, N.M.; Al-Taai, S.R.; Imran, H.; Ibrahim, M. Development of prediction model of steel fiber-reinforced concrete compressive strength using random forest algorithm combined with hyperparameter tuning and k-fold cross-validation. East. Eur. J. Enterp. Technol. 2021, 5, 113. [Google Scholar] [CrossRef]
  11. Alhakeem, Z.M.; Jebur, Y.M.; Henedy, S.N.; Imran, H.; Bernardo, L.F.; Hussein, H.M. Prediction of Ecofriendly Concrete Compressive Strength Using Gradient Boosting Regression Tree Combined with GridSearchCV Hyperparameter-Optimization Techniques. Materials 2022, 15, 7432. [Google Scholar] [CrossRef]
  12. Faridmehr, I.; Nehdi, M.; Baghban, M.H. Novel informational bat-ANN model for predicting punching shear of RC flat slabs without shear reinforcement. Eng. Struct. 2022, 256, 114030. [Google Scholar] [CrossRef]
  13. Henedy, S.N.; Naser, A.H.; Imran, H.; Bernardo, L.F.; Teixeira, M.M.; Al-Khafaji, Z. Development of Prediction Models for the Torsion Capacity of Reinforced Concrete Beams Using M5P and Nonlinear Regression Models. J. Compos. Sci. 2022, 6, 366. [Google Scholar] [CrossRef]
  14. Nguyen, H.D.; Truong, G.T.; Shin, M. Development of extreme gradient boosting model for prediction of punching shear resistance of r/c interior slabs. Eng. Struct. 2021, 235, 112067. [Google Scholar] [CrossRef]
  15. Shatnawi, A.; Alkassar, H.M.; Al-Abdaly, N.M.; Al-Hamdany, E.A.; Bernardo, L.F.A.; Imran, H. Shear Strength Prediction of Slender Steel Fiber Reinforced Concrete Beams Using a Gradient Boosting Regression Tree Method. Buildings 2022, 12, 550. [Google Scholar] [CrossRef]
  16. Shen, Y.; Wu, L.; Liang, S. Explainable machine learning-based model for failure mode identification of RC flat slabs without transverse reinforcement. Eng. Fail. Anal. 2022, 141, 106647. [Google Scholar] [CrossRef]
  17. Silva Júnior, F.E.S.d.; Gomes, W.J.d.S. Machine learning models to predict the punching shear strength of reinforced concrete flat slabs. Rev. IBRACON Estrut. Mater. 2023, 16, e16405. [Google Scholar]
  18. Fiore, A.; Marano, G.C.; Laucelli, D.; Monaco, P. Evolutionary modeling to evaluate the shear behavior of circular reinforced concrete columns. Adv. Civ. Eng. 2014, 2014, 684256. [Google Scholar] [CrossRef] [Green Version]
  19. Liang, S.; Shen, Y.; Gao, X.; Cai, Y.; Fei, Z. Symbolic machine learning improved MCFT model for punching shear resistance of FRP-reinforced concrete slabs. J. Build. Eng. 2023, 69, 106257. [Google Scholar] [CrossRef]
  20. Marasco, S.; Fiore, A.; Greco, R.; Cimellaro, G.P.; Marano, G.C. Evolutionary polynomial regression algorithm enhanced with a robust formulation: Application to shear strength prediction of RC beams without stirrups. J. Comput. Civ. Eng. 2021, 35, 04021017. [Google Scholar] [CrossRef]
  21. Wu, Y.; Zhou, Y. Prediction and feature analysis of punching shear strength of two-way reinforced concrete slabs using optimized machine learning algorithm and Shapley additive explanations. Mech. Adv. Mater. Struct. 2023, 30, 3086–3096. [Google Scholar] [CrossRef]
  22. Quinlan, J.R. Learning with continuous classes. In Proceedings of the 5th Australian Joint Conference on Artificial Intelligence, Tasmania, Australia, 16–18 November 1992; pp. 343–348. [Google Scholar]
  23. Weka. Weka 3: Data Mining Software in Java; University of Waikato: Hamilton, New Zealand, 2011; Volume 19, p. 52. Available online: https://www.cms.waikato.ac.nz/ml/weka/ (accessed on 20 June 2021).
  24. Wang, Y.; Witten, I.H. Induction of Model Trees for Predicting Continuous Classes; University of Waikato: Hamilton, New Zealand, 1996. [Google Scholar]
  25. Bhattacharya, B.; Price, R.; Solomatine, D. Machine learning approach to modeling sediment transport. J. Hydraul. Eng. 2007, 133, 440–450. [Google Scholar] [CrossRef]
  26. Frank, I.E.; Todeschini, R. The Data Analysis Handbook; Elsevier: Amsterdam, The Netherlands, 1994. [Google Scholar]
  27. Chetchotisak, P.; Ruengpim, P.; Chetchotsak, D.; Yindeesuk, S. Punching shear strengths of RC slab-column connections: Prediction and reliability. KSCE J. Civ. Eng. 2018, 22, 3066–3076. [Google Scholar] [CrossRef]
  28. Olalusi, O.B.; Spyridis, P. Uncertainty modelling and analysis of the concrete edge breakout resistance of single anchors in shear. Eng. Struct. 2020, 222, 111112. [Google Scholar] [CrossRef]
  29. Franzblau, A.N. A Primer of Statistics for Non-Statisticians; American Psychological Association: Washington, DC, USA, 1958. [Google Scholar]
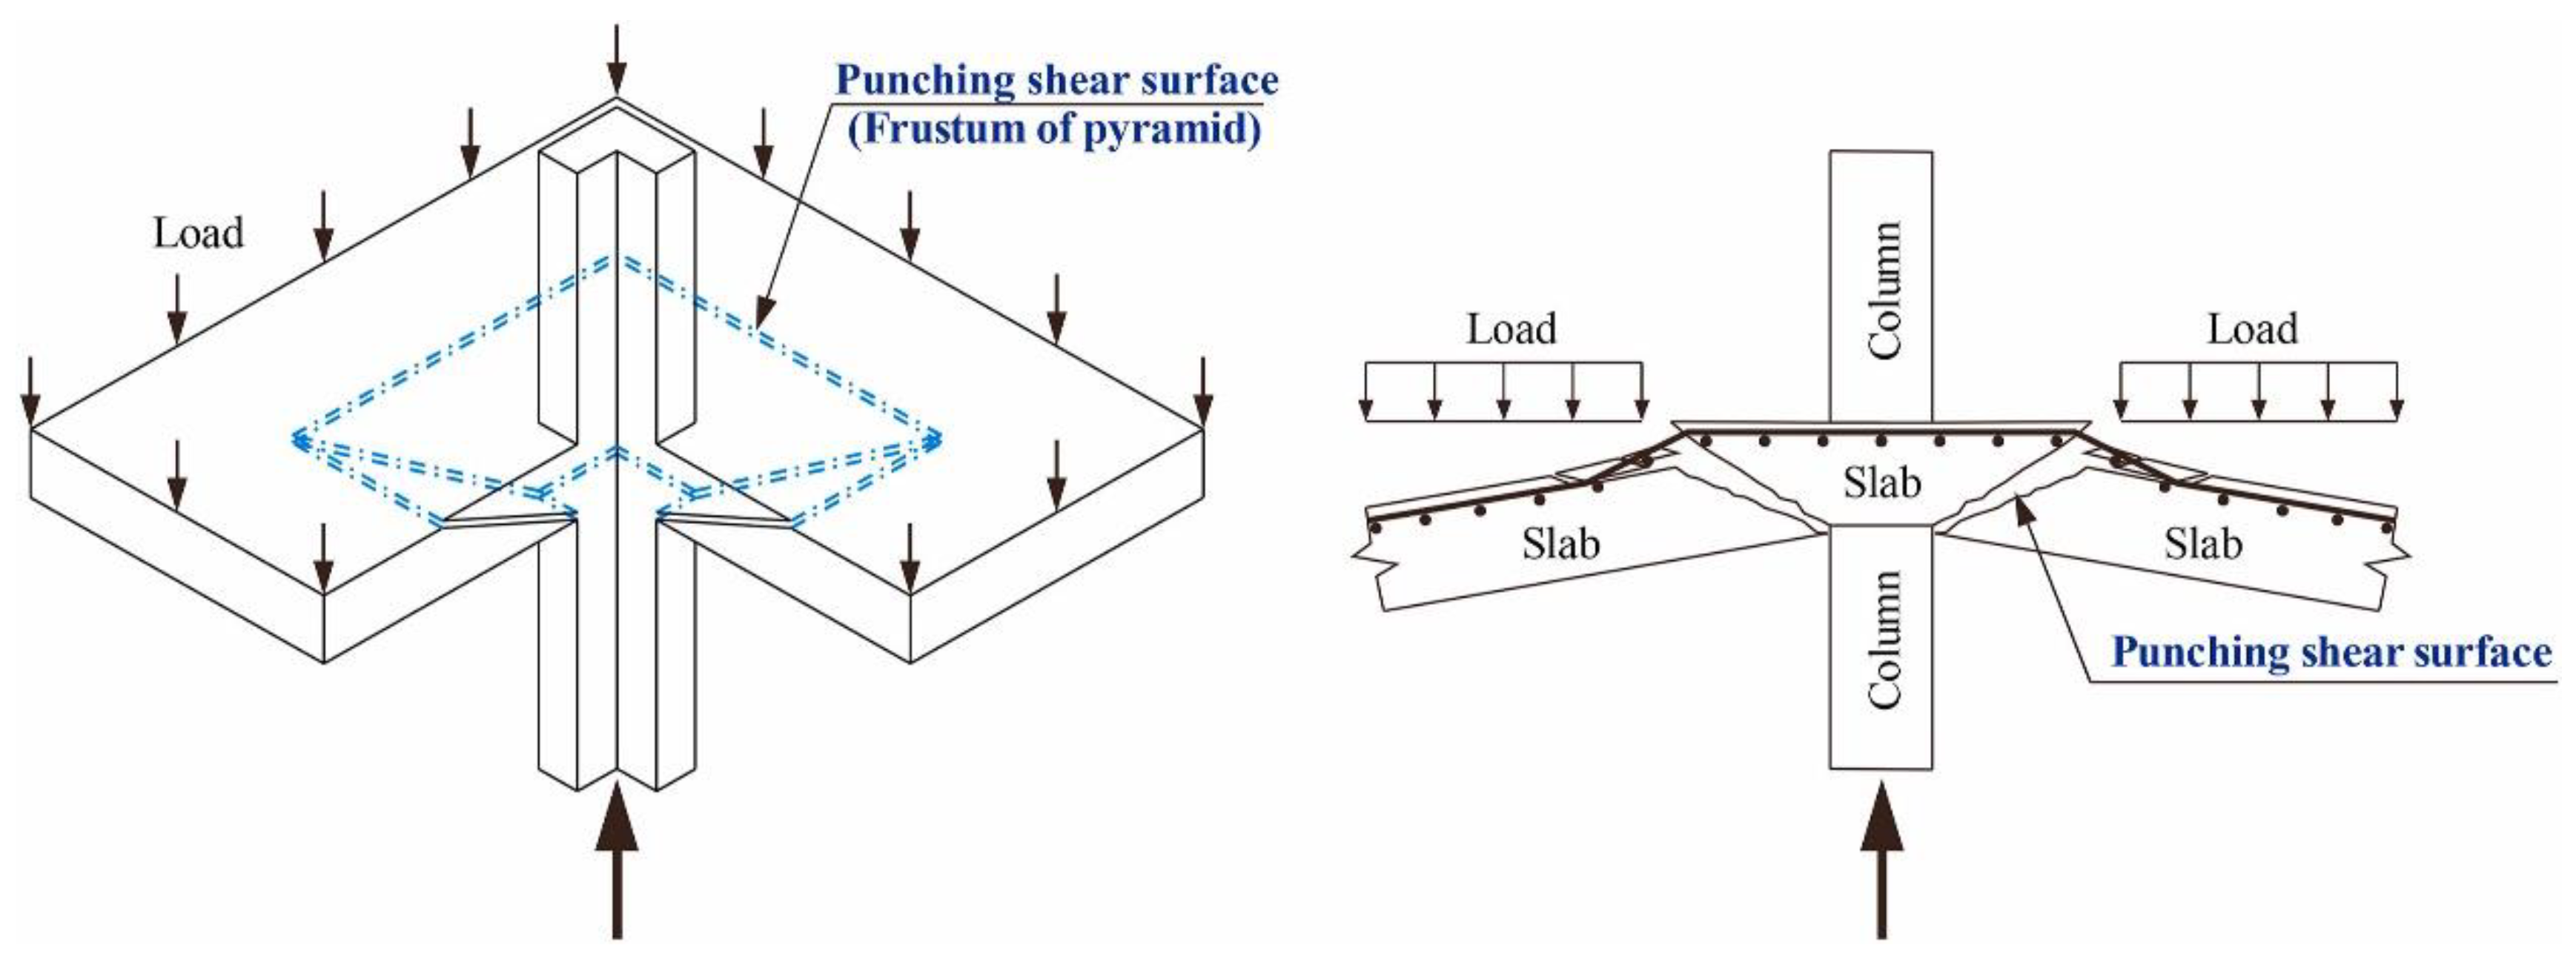
Figure 1. Punching shear failure in RC flat slabs without shear reinforcement.
Applsci 13 08325 g001
Figure 2. (a) The M5P model tree illustrating the partitioning of the data space X1 × X2 into 4 subsets; (b) final linear regression models generated with the M5P algorithm for each subset.
Applsci 13 08325 g002
Figure 3. Scatter plots and histograms of input and output parameters.
Applsci 13 08325 g003
Figure 4. Data splitting diagrams for the M5P model.
Applsci 13 08325 g004
Figure 5. Cross plots of the proposed M5P correlations for both the training and testing set.
Applsci 13 08325 g005
Figure 6. Comparison of the predictions generated using the M5P-tree-based model with the experimental measurements of punching shear strength for both training and testing data.
Applsci 13 08325 g006
Figure 7. Predicted versus experimental shear capacities for the newly developed M5P model and other machine learning models.
Applsci 13 08325 g007
Figure 8. Comparison of the developed machine learning models in terms of RMSE and MAE.
Applsci 13 08325 g008
Figure 9. Comparison of the normalized punching shear resistance results between M5P and EC2.
Applsci 13 08325 g009
Figure 10. Scatter plot of punching shear parameters vs. model inaccuracies.
Applsci 13 08325 g010
Table 1. Summary of the key input parameters utilized in the model development and based on the experimental datasets.
Data CategoryStatisticsb (mm) *d (mm) *fc (MPa) *fy (MPa) *ρ *λ *Vu (kN) *
Training dataMedian196.350112.50031.900468.0000.0125.952324.000
Mean192.689117.98935.696475.0820.0135.972441.046
Minimum40.05529.9709.401250.0000.0030.61224.000
Maximum707.644668.500130.100749.0000.05032.5074915.000
Standard deviation 99.13362.84219.641112.7990.0073.170456.952
Testing dataMedian200.000100.00029.546453.6000.0135.685330.000
Mean193.885111.89533.209453.6800.0155.910406.104
Minimum51.00033.16611.771250.0000.0031.00044.000
Maximum520.000400.00098.000749.0000.07313.5512224.000
Standard deviation 90.32155.40914.841109.7730.0092.144361.110
* b = equivalent column width; d = slab effective depth; fc = concrete strength; fy = yield strength of reinforcement, ρ = longitudinal reinforcement ratio; λ = span–depth ratio; Vu = punching shear capacity.
Table 2. M5P model performance in predicting the punching shear capacity of RC flat slab.
StatisticsRMSERR2MAE
Training77.10340.98570.971647.9516
Testing71.99930.98060.961648.3483
Total76.10380.98490.970048.0491
Table 3. Results derived from a five-fold cross validation.
FoldsPerformance Measures
MAE (MPa)R2RMSE (MPa)
66.28960.9430100.1055Fold 1
51.22540.958183.0453Fold 2
38.75230.946556.0006Fold 3
57.76990.941089.9521Fold 4
62.57970.9697125.1674Fold 5
55.32340.951790.8542Average
10.84310.012125.1970SD
Table 4. Statistical characteristics of both M5P and other machine learning models (analyzed using the testing dataset).
Parameters M5PRFLR
RMSE71.999392.6412121.9088
R20.96160.93390.8930
MAE48.348358.960295.4274
Table 5. Accuracy of earlier models for predicting the punching shear strength in comparison with M5P.
Predicted ModelRMSEMAER2Statistical Properties of Vactual/VM5P
μΩSDCOVΩ %MinMax
ACI 318-19 [6]181.7370118.62160.88031.44860.422529.16780.56414.2303
BS 8110-97 [5]169.9748112.90980.95951.35710.331924.45720.74724.1163
Eurocode 2 (EC2) [7]105.819271.49150.95711.24590.336827.03210.70573.9481
Elshafey et al. [3]122.125672.74150.93921.05260.281126.70700.49513.3695
Elsanadedy et al. [4]108.323668.27910.95031.08940.293526.94560.45873.2054
Chetchotisak et al. [27]100.765059.11470.95790.98740.241624.46470.54313.0663
M5P in this study76.381548.11630.97001.01470.170516.80600.61611.8585
Table 6. Effect of input variables on the performance of the proposed M5P model.
Excluded VariablesInput VariablesTraining SetTesting Set
R2RMSEMAER2RMSEMAE
None(b)(d)(fc)(fy)(ρ)(λ)0.985777.103447.95160.980671.999348.3483
(b)(d)(fc)(fy)(ρ)(λ)0.9404
(−4.59%)
116.3163
(+50.9%)
64.0720
(+33.6%)
0.9222
(−5.95%)
108.6096
(+50.85%)
68.4123
(+41.6%)
(d)(b)(fc)(fy)(ρ)(λ)0.6676
(−32.28%)
271.8977
(+252.7%)
125.1944
(+161.1%)
0.5988
(−38.91%)
228.9639
(+218.0%)
136.6226
(+182.5%)
(fc)(b)(d)(fy)(ρ)(λ)0.9171
(−6.96%)
140.4382
(+82.2%)
72.2165
(+50.6%)
0.9383
(+4.31%)
93.0885
(+29.3%)
60.4217
(+25.0%)
(fy)(b)(d)(fc)(ρ)(λ)0.9673
(−1.87%)
82.8514
(+7.45%)
48.3227 (+0.77%)0.9592
(−2.18%)
75.5153
(+4.88%)
49.3749
(+2.12%)
(ρ)(b)(d)(fc)(fy)(λ)0.9017
(−8.52%)
152.1536
(+97.4%)
78.1118 (+62.9%)0.9052
(−7.69%)
113.9448
(+58.3%)
70.9103
(+46.7%)
(λ)(b)(d)(fc)(fy)(ρ)0.9698
(−1.61%)
79.5789
(+3.22%)
48.8820 (+1.94%)0.9456
(−3.57%)
84.1065
(+16.8%)
55.4452
(+14.7%)
Disclaimer/Publisher’s Note: The statements, opinions and data contained in all publications are solely those of the individual author(s) and contributor(s) and not of MDPI and/or the editor(s). MDPI and/or the editor(s) disclaim responsibility for any injury to people or property resulting from any ideas, methods, instructions or products referred to in the content.