Article

Effects of Wind Barrier Porosity and Inclination on Wind Speed Reduction

1
Department of Forest Environmental Science, Jeonbuk National University, Jeonju 54896, Republic of Korea
2
Division of Environmental and Forest Science, Gyeongsang National University, Jinju 52725, Republic of Korea
3
Department of Forest Environmental Resources, Gyeongsang National University, Jinju 52828, Republic of Korea
4
Institute of Agriculture and Life Science, Gyeongsang National University, Jinju 52828, Republic of Korea
5
Division of Warm Temperate and Subtropical Forest Research Center, National Institute of Forest Science, Jeju 63582, Republic of Korea
*
Author to whom correspondence should be addressed.
Appl. Sci. 2023, 13(14), 8310; https://doi.org/10.3390/app13148310
Submission received: 23 June 2023 / Revised: 15 July 2023 / Accepted: 17 July 2023 / Published: 18 July 2023
(This article belongs to the Topic Sustainable Environmental Technologies)

Abstract

:
Wind barriers play a vital role in protecting saplings until maturity when planted as vegetative windbreak forests. Most previous studies have focused on the porosity of wind barriers, but no studies have simultaneously examined the effects of the porosity and inclination, despite the potential of the inclination to decrease wind speed. We tested three wind barrier cases in wind tunnel experiments: (1) Case A (porosity of 0% with inclinations (90°, 80°, and 70°)), (2) Case B (porosity of 25% with inclinations (90°, 80°, and 70°)), and (3) Case C (porosity of 50% with inclinations (90°, 80°, and 70°)). The vertical and horizontal wind velocities were measured at three vertical and seven horizontal points behind the barriers. The results demonstrated a statistically significant decrease in the correlation between the distance and mean wind velocity for all cases, with up to a six-fold wind protection effect. The wind barrier with 0% porosity and a 90° inclination provided the highest degree of wind protection. However, the wind protection range was limited downwind, and recirculation of wind flow could occur in the leeward direction, potentially damaging saplings. A wind barrier with 50% porosity and 70° inclination sufficiently decreased the wind velocity and prevented recirculation of wind flow, demonstrating that both porosity and inclination considerably impacted the wind protection effect by reducing wind velocity. Our findings offer novel insights into the influence of wind barriers with varying porosities and inclinations and can provide valuable guidance for constructing efficient windbreak forests.

1. Introduction

Wind can have a considerable influence on vegetation growth or death, depending on its strength and other environmental conditions [1,2,3,4,5]. Artificial wind barriers play an important role in the protection of vegetation, such as crops in paddy fields [6,7], fruit trees in orchards [7], shrubs in sandy deserts in semi-arid and arid regions [8], and vegetative windbreak forests in coastal areas [9,10]. The main approach to protecting vegetation is to reduce wind velocity, and accordingly, two types of wind fences, vegetative windbreaks and artificial wind barriers, are commonly constructed [8,9,10,11]. The growth of saplings in vegetative windbreak forests (vegetative windbreaks in coastal areas) is hindered by various negative environmental factors, such as stronger sea breezes with more salinity than land breezes, rapid wind shifts, higher humidity, and sand and dust on vegetation (e.g., [10,12,13,14]). These factors can cause growth inhibition, mortality, and electrolyte imbalances [2,9,15,16,17]. Thus, wind barriers control wind velocity and reduce negative environmental factors in coastal areas. Wind barriers alter airflow [18,19]. The altered airflow reduces negative environmental factors like intense sea breezes [14], potentially decreasing salinity levels. They also modify microclimates [9,20], prevent sand and dust deposition on vegetation [8,12], promote soil productivity [21], and contribute to species-rich ecosystems [22]. Thus, wind barriers should be prioritized to support the growth of vegetation and construct vegetative windbreak forests in harsh conditions [8,9,13].
Numerous studies on the effectiveness of wind fences have been conducted. Heisler and Dewalle [18] conducted a comprehensive review of previous studies on the effect of wind fence structures and reported that the most effective wind fences depend on porosity, among other factors, such as type, shape, and height. Many studies have concluded that wind fences with lower porosity produce a greater reduction in wind velocity [23,24,25,26,27,28,29,30,31,32]. For instance, Perera [27] tested solid porous fences (porous range: 0% to 50%). The author also reported that the key factor was the porosity rather than the form of fence construction, and a porosity of 10% provided better sheltering efficiency among the porosities. Further, the reattachment could no longer be detected when the porosity was above 30%. Range Raine and Stevenson [29] reported that a porosity of 20% among porous fences of 0–50% was the best for shelter efficiency. Chen et al. [24] conducted a CFD numerical simulation to examine the shelter efficacy of a deflector-porous fence. They reported that a 30% porosity sand fence was the most effective at controlling dust emissions and concluded that the optimal porosity range could be between 30% and 50%. Yu et al. [32] reported that the lowest porosity of 36% among porous fences of 36%, 56%, 63%, and 75% had the strongest sheltering efficiency with the longest wind protection. In contrast, Wu et al. [8] reviewed recent studies that examined the shelter effect of porosity using field measurements, wind tunnel experiments, and numerical simulations and reported that the highest shelter effect was achieved at a porosity within the range of 20% to 40%. Consequently, the optimal design of wind barriers with varying porosities has been reported in different environmental conditions to date.
However, an inclination (i.e., the inclined angle of wind barriers), in addition to porosity, can change the wind velocity and affect the wind protection range of barriers. Kang [33] tested the wind flow angles (90°, 75°, 60°, and 45°) for vertical wind barriers using porous meshes (0%, 25%, 50%, and 75%) when the upstream wind direction toward the wind barriers changed. The author reported that the wind velocity distribution downstream generally differed among the wind flow angles. Naaim-Bouvet et al. [34] tested snow fences of different gradient slopes using a cold wind tunnel. The authors reported that the slope angle could substantially affect snowdrifts, but much depended on the porosity of the snow fence. These findings suggest that the effectiveness of wind barriers in providing wind protection may vary based on both porosity and inclination. However, to the best of our knowledge, no information is currently available on the simultaneous impact of wind barrier porosity and inclination on wind protection. Thus, quantitative research on this topic is required for the optimal design of windbreak systems.
Our study aimed to evaluate the effectiveness of wind barriers by examining both porosity and inclination using a wind barrier made of wood. To achieve this, we conducted wind tunnel experiments with three wind barrier cases: (1) Case A (porosity of 0% with three different inclinations (90°, 80°, and 70°)), (2) Case B (porosity of 25% with the same inclinations), and (3) Case C (porosity of 50% with the same inclinations). To analyze the reduction in wind speed, we measured the wind velocity on the windward and leeward sides of the wind barriers in relation to their distance. Our findings provide valuable insights for the design of windbreak systems, which can help protect saplings and improve windbreak forest management strategies.

2. Materials and Methods

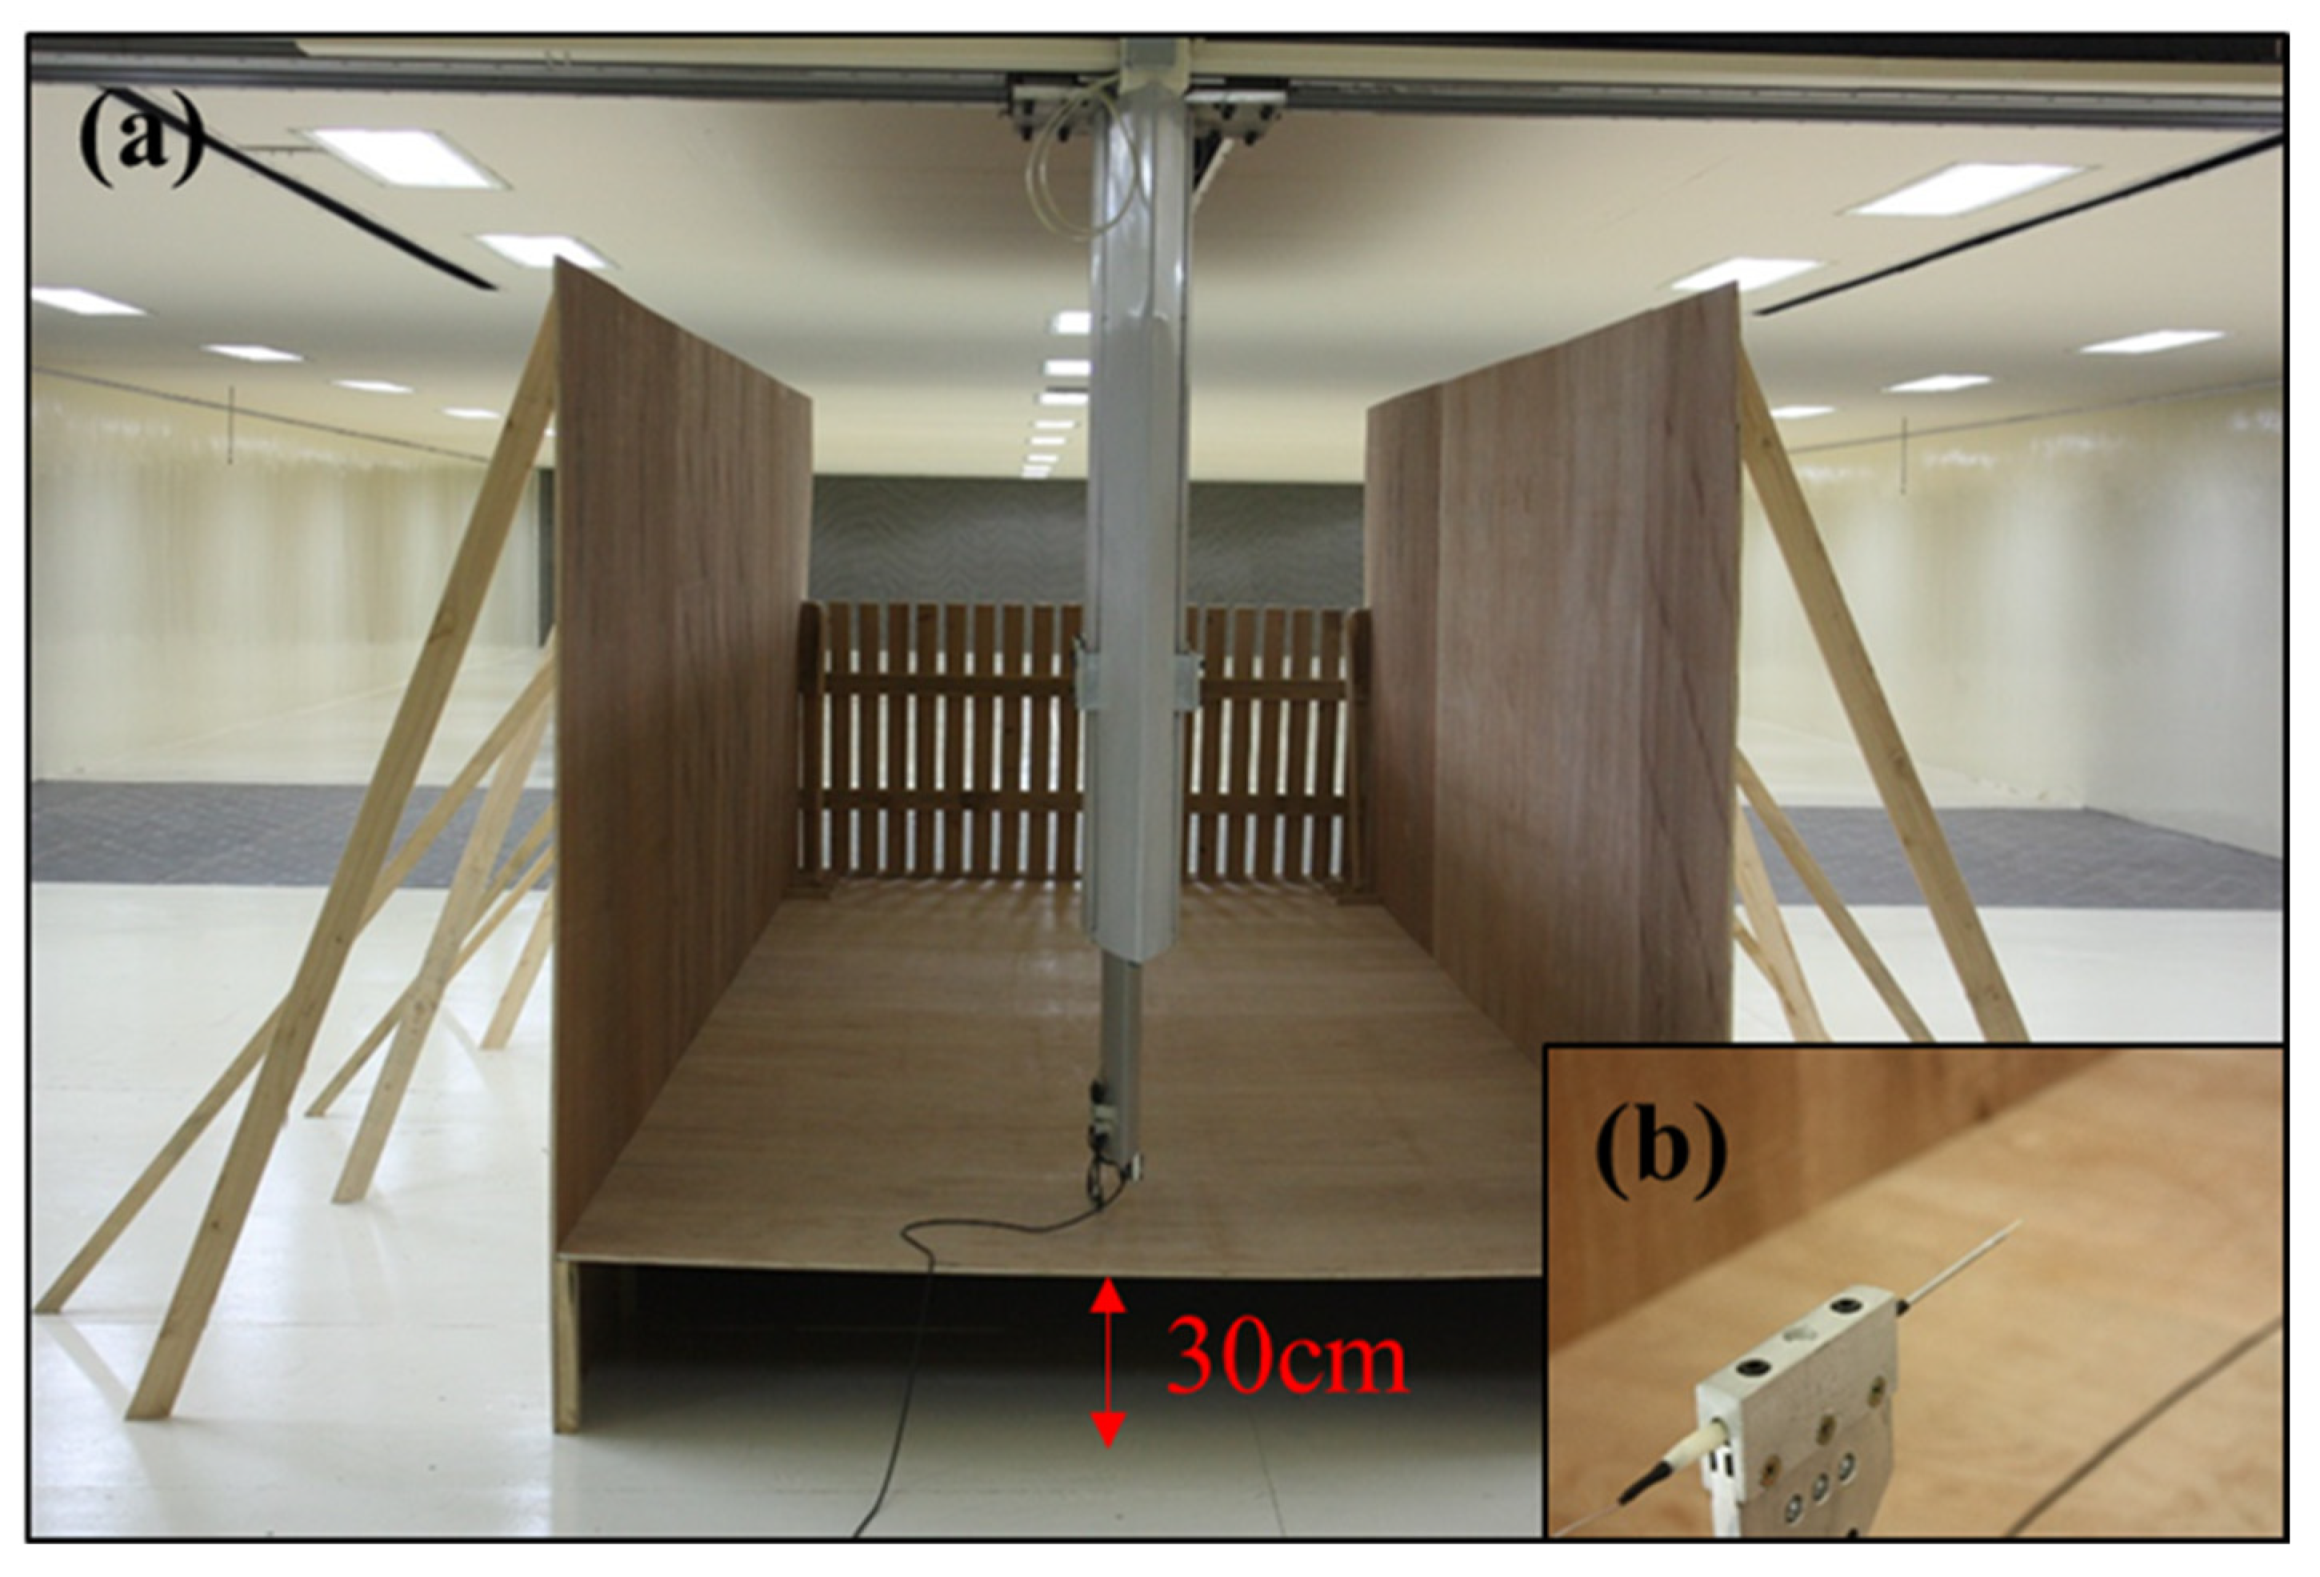
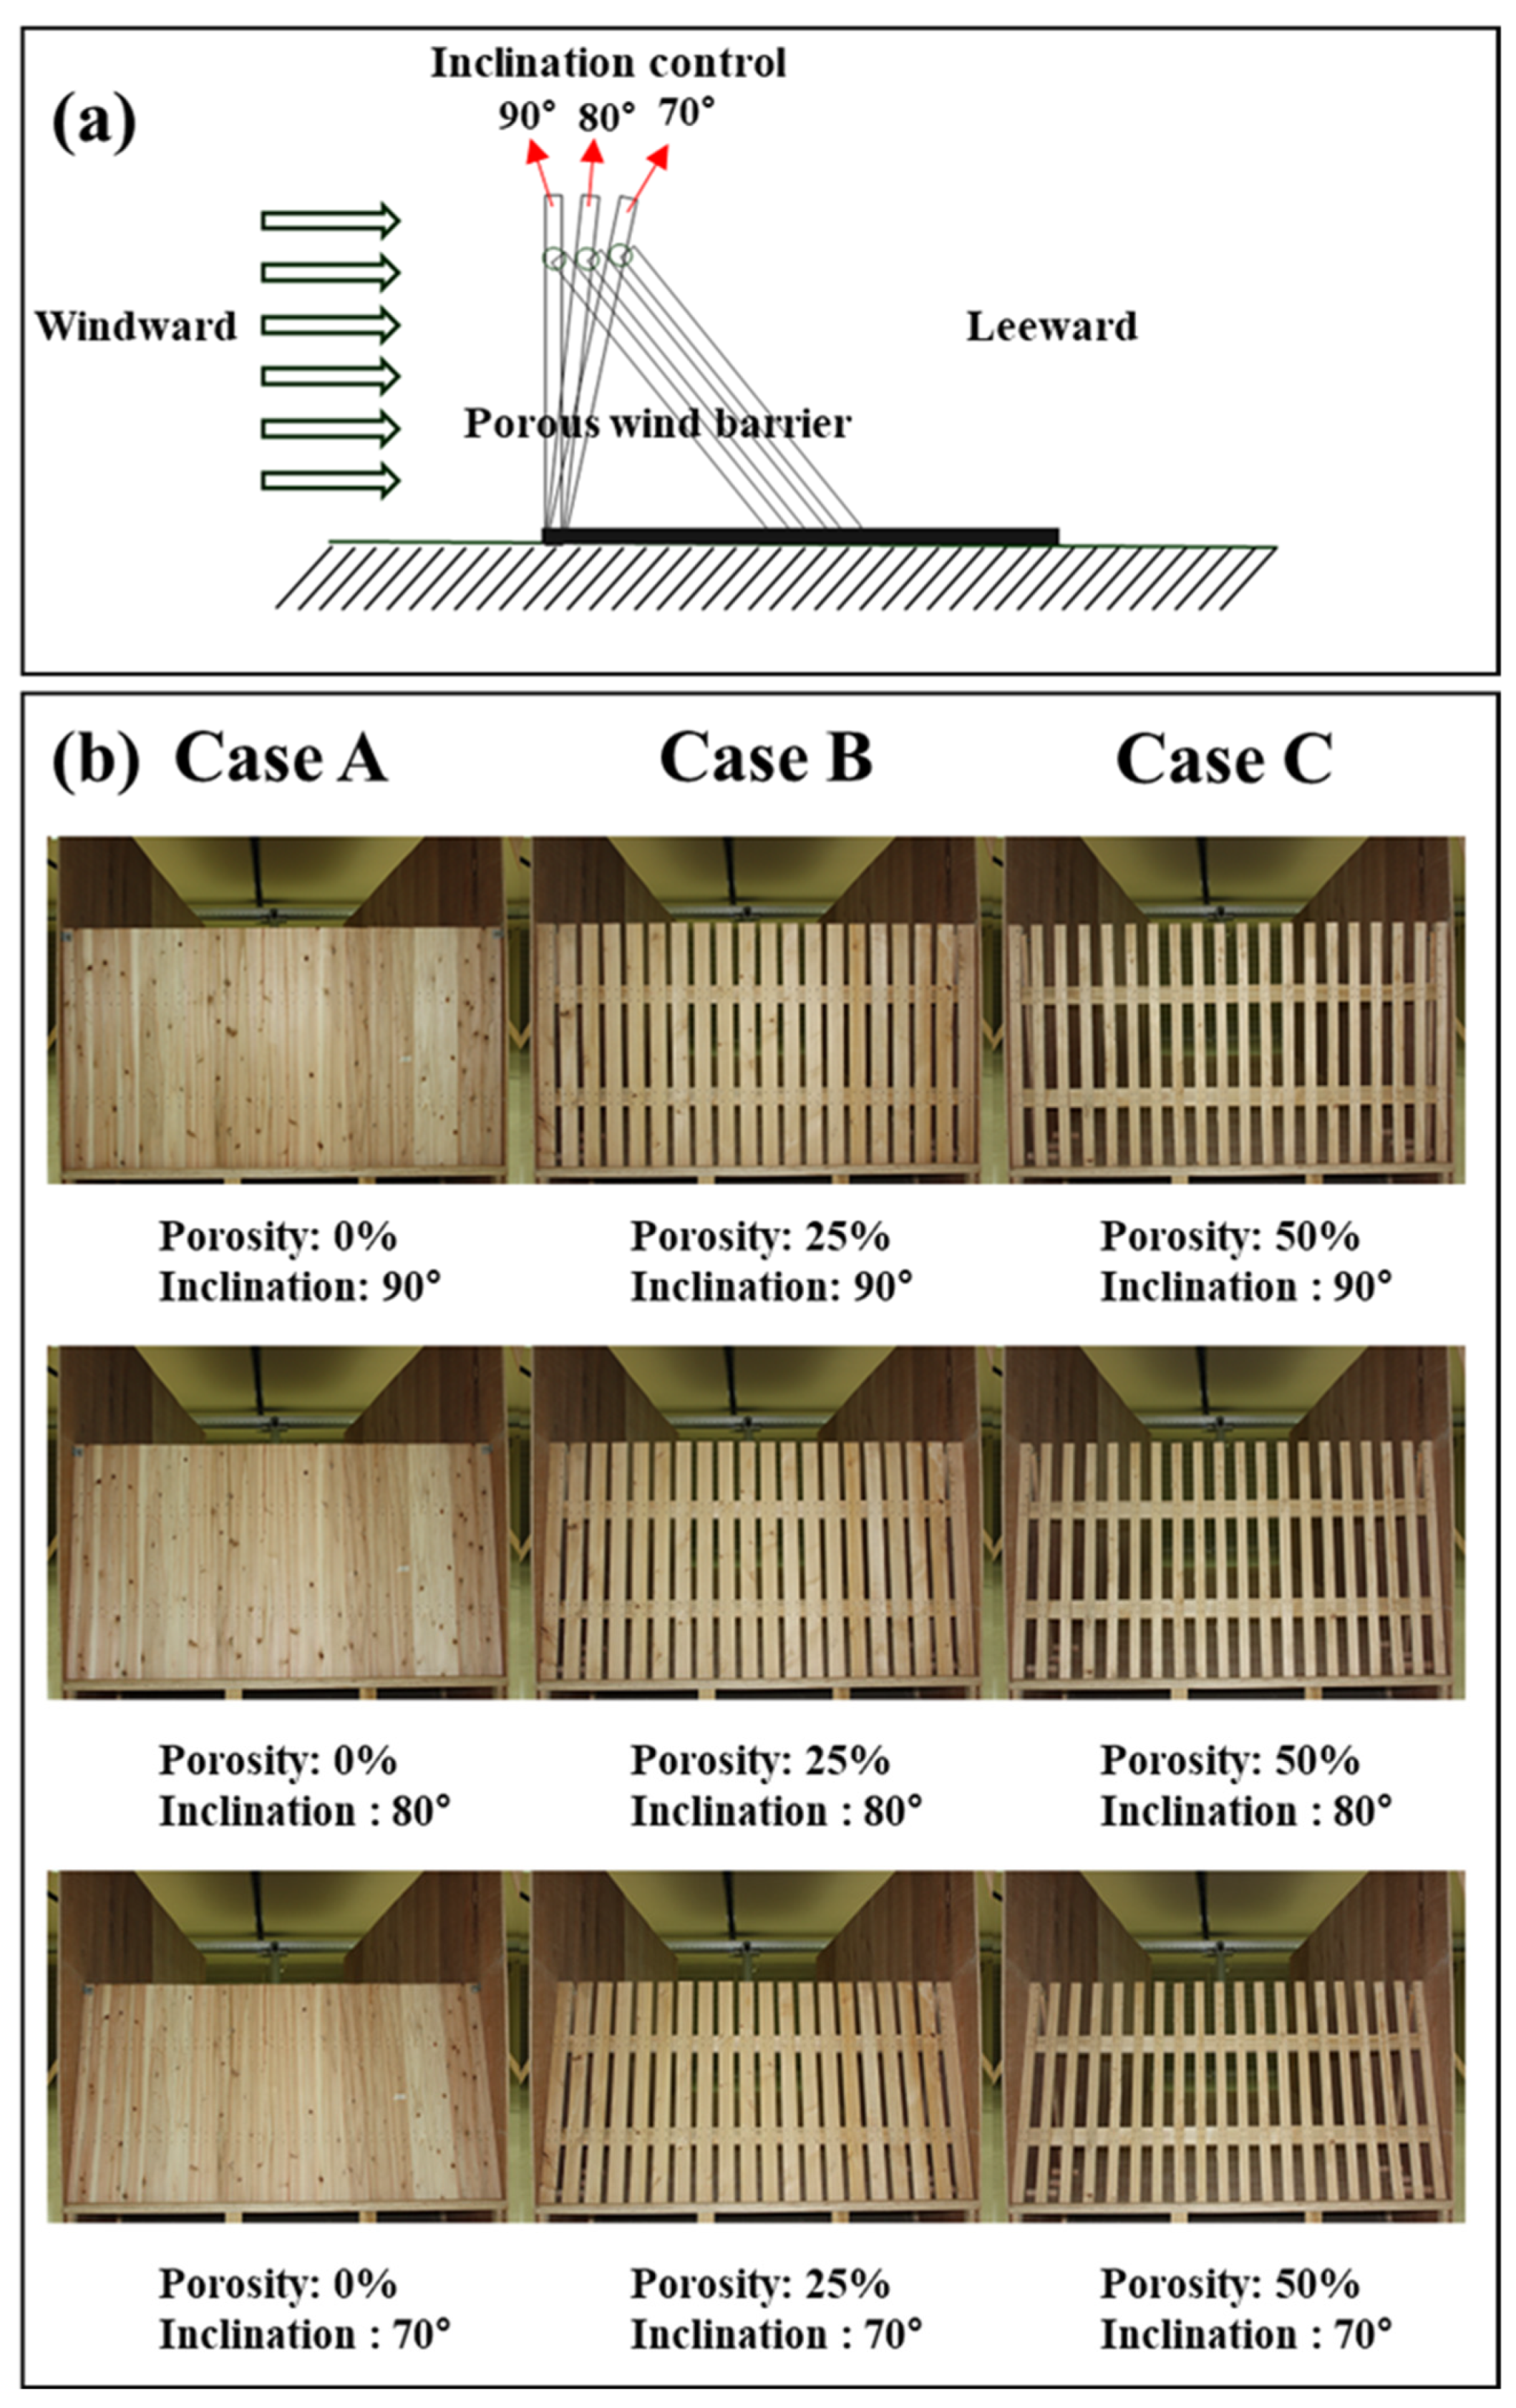
2.1. Wind Experimental Design

A wind tunnel experiment was conducted at the Korea Construction Engineering and Transport Development Collaboratory Management Institute (KOCED) Wind Tunnel Center, Jeonbuk National University, Republic of Korea. The wind tunnel was a closed-circuit type. Of the dual test sections with low-speed and high-speed sections in the KOCED Wind Tunnel Center, our test was conducted in the low-speed section (test section size: 12 m wide, 2.5 m high, and 40 m long; wind velocity: 0.3 m s–1~12.0 m s–1). The turbulence intensity was less than 1.5%.
We designed a small-scale simulation model considering the blockage ratio (the ratio of the projected specimen area to the cross-sectional area of the wind tunnel) (Figure 1a) [35,36,37,38]. In general, the blockage ratio is corrected if >10% [35,36]. In this study, the blockage ratio was 6.7%, implying a negligible correction from the blockage ratio.
Uniform wind flow was obtained above 30 cm from the ground (Figure 1a), which avoided the natural atmospheric boundary layer in the wind tunnel section. Owing to the insufficient width of the wind tunnel section, walls 2 m high and 7 m long were installed, which were sufficient to prevent the distortion of wind generated from each side of the two-dimensional test specimen (Figure 1a).

2.2. Wind Experimental Materials
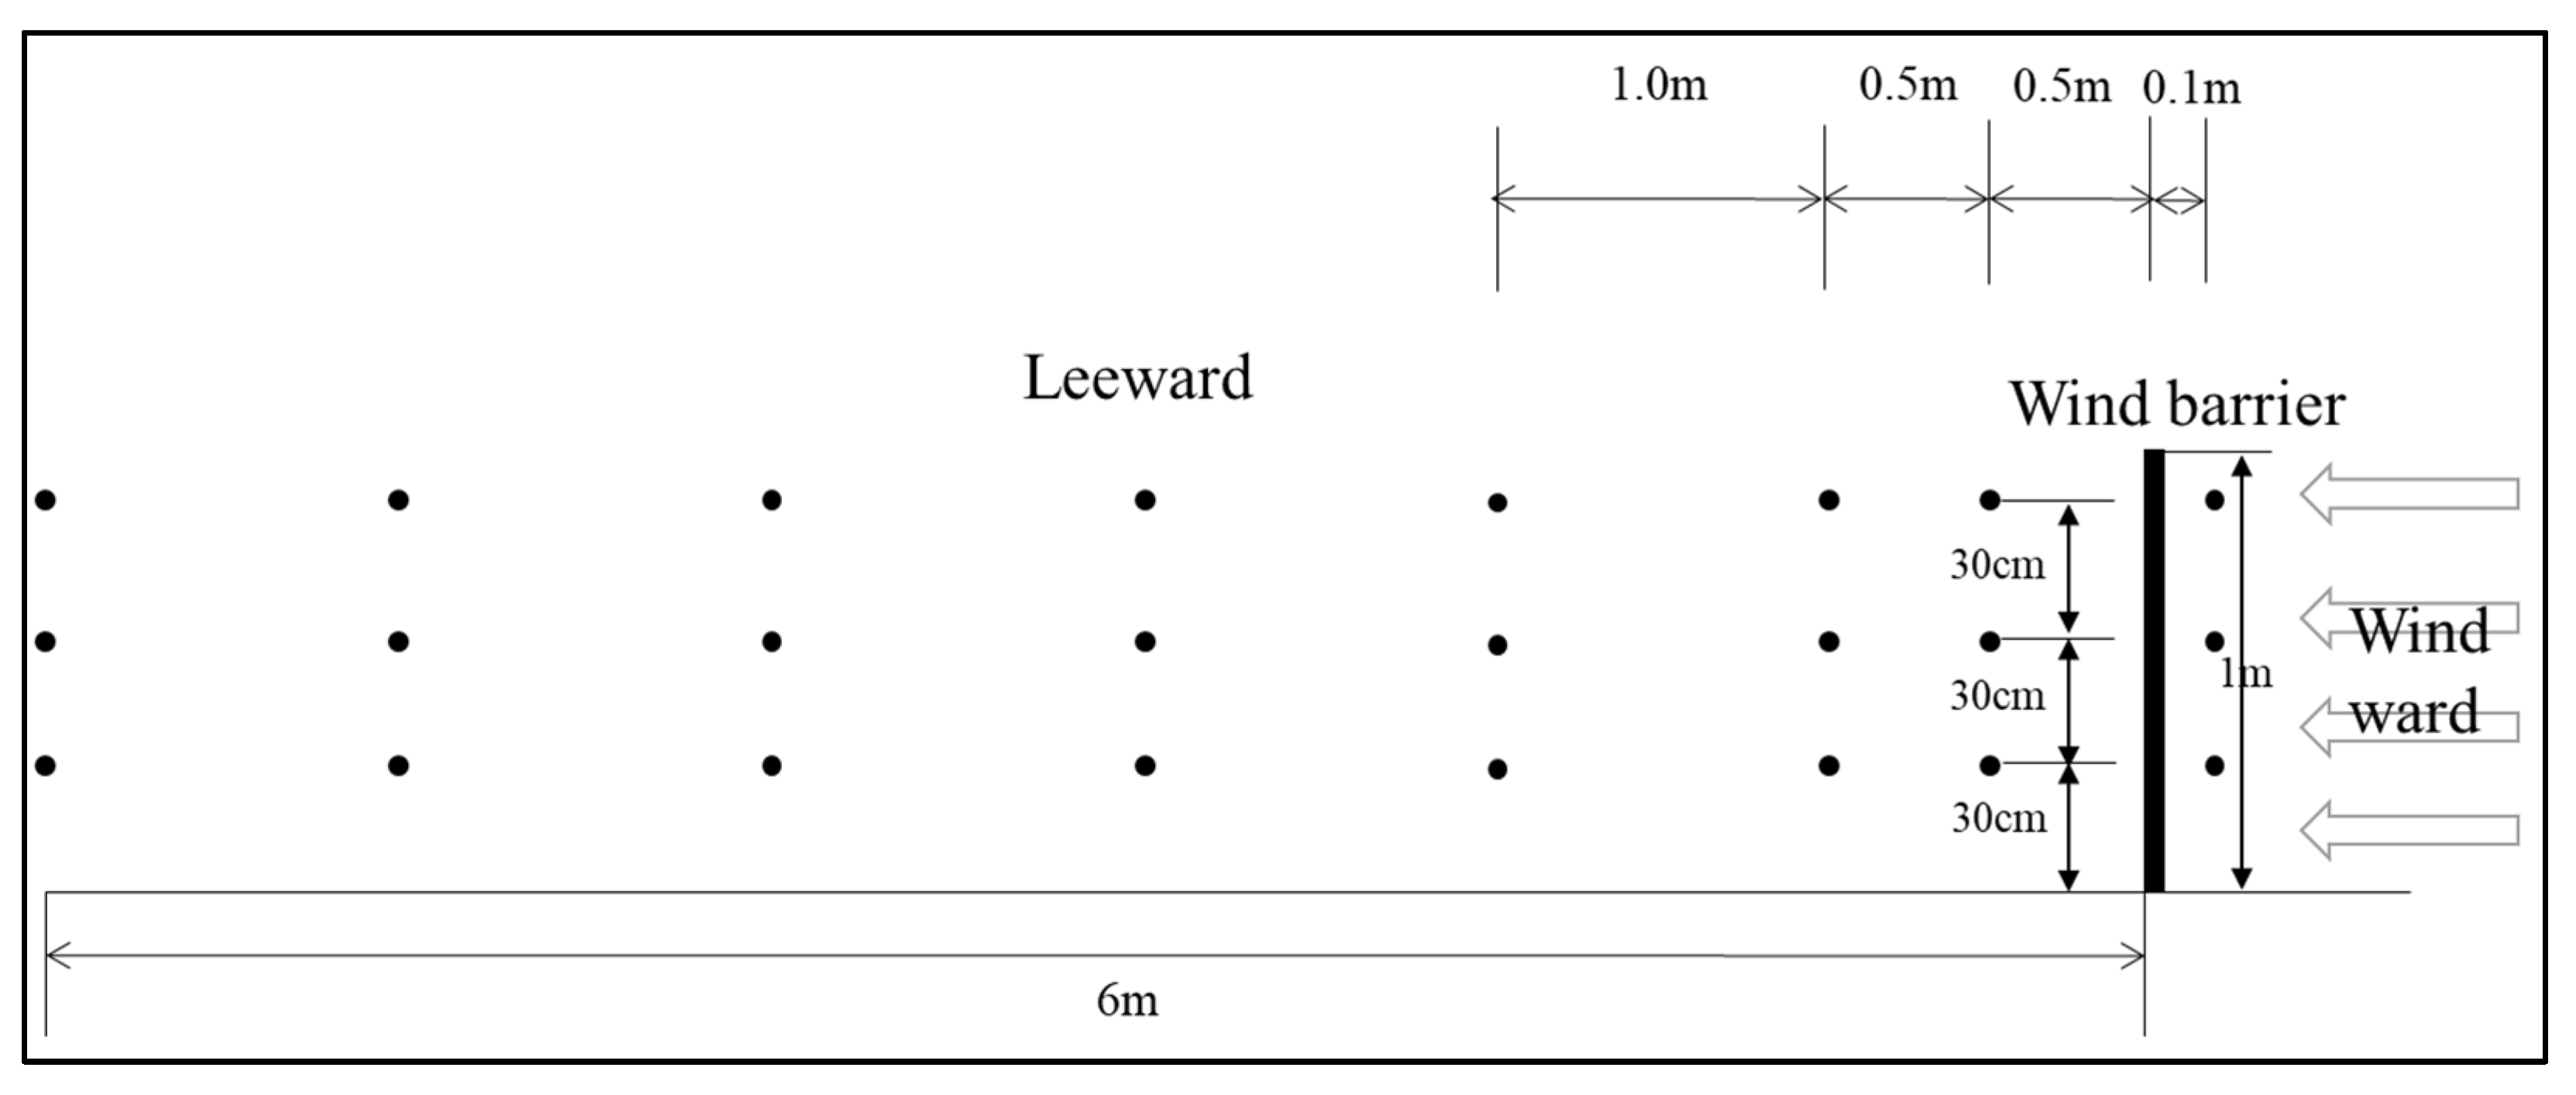
Previous studies have reported that a decrease in wind velocity can be indicated in the wind protection porosity function (e.g., [23,28,30]). This suggests that the influence of porosity on decreasing wind velocity could be much larger than that of the shape and material of the wind fence. The porosity (%) at this point was computed as follows:
Φ ( % ) = A e A a × 100
where Φ is the porosity, A e is the projected area of the pores of the wind barrier, and A a is the area of the perimeter of the wind barrier (i.e., height × width).
Different materials, such as metal, plastic, and wood, have been employed as wind barriers [36]. Among these windbreak materials, a wind barrier using a wood-based material is preferable because it is environment-friendly, light, simple, and inexpensive to build. In this study, we tested both the porosity and inclinations to examine their potential for decreasing wind velocity using wood-based materials (Figure 2a). In previous studies, wind barrier porosity was typically designed within a range of 0% to 50%, taking material costs into account [8,18,27,29,32]. Lower porosity tends to be more expensive in practical applications [18], whereas higher porosity permits increased air penetration, resulting in less wind speed reduction [9]. Regarding wind barrier inclination, preliminary tests were conducted on inclinations ranging from 90° to 70° prior to the wind tunnel experiment owing to the challenges of field construction. Thus, using these wood-based materials, our study was designed for three cases: (1) Case A: porosity of 0% with three inclinations (90°, 80°, and 70°), (2) Case B: porosity of 25% with three inclinations (90°, 80°, and 70°), and (3) Case C: porosity of 50% with three inclinations (90°, 80°, and 70°) (Figure 2b).

2.3. Measurements

The wind velocities at the windward and leeward sides of the wind barriers were measured using an I-type hot wire anemometer (Dantec Ⅰ-type Probe 55P11, sampling rate: 16.67 data s−1) and three-dimensional traverse equipment (Figure 1b). Wind velocity was measured at 3 points along the vertical (30, 60, and 90 cm) and 7 points along the horizontal (50 to 600 cm) points (i.e., 21 points in total leeward behind the wind barriers) (Figure 3). The wind velocity threshold required to move sand and dust in the coastal Saemangeum land of the Republic of Korea is assumed to be approximately 4.0 m s−1 at 0.5 elevation [9]. Thus, we used a wind velocity of 5.0 m s−1 at the windward side, which was approximately two-fold the 10-year monthly average wind speed for Gunsan city (approximately 2.2 m s−1) of the land [39]. After operating the wind turbine for several minutes, the wind velocities on the windward and leeward sides stabilized.
The wind velocity of the wind tunnel was initially set to 5.0 m s−1. The wind velocities at each single measuring point on the windward (n = 3) and leeward (n = 21) sides were measured for 60 s (i.e., 1 min mean wind speed), and the average wind velocity of each measuring point was determined (Figure 3). We analyzed the change in the average wind velocity at the measured distances. Wind speed reduction is determined by the ratio of windward and leeward wind speeds.
U R = U U 0 × 100   ( % )
where U R is the ratio of windward and leeward wind speeds, U is the average leeward wind speed (m s−1), and U 0 is the average windward wind speed (m s−1).
Wind flow visualization was conducted to quantitatively determine the movement of the wind velocity provided in Section 3.

2.4. Statistical Analyses

The software SPSS ver. 21.0 (IBM SPSS, Armonk, NY, USA) was used for statistical analyses. One-way analysis of variance (ANOVA), which is a statistical method to compare the means of three or more groups to determine if there are significant differences between them [40], was used to identify the range of the reduction in wind velocity for Cases A, B, and C. Following the ANOVA test, Duncan analysis, employed to determine which specific groups or means are significantly different from each other [40], was performed to classify identical groups of the average wind velocity for each inclination of Cases A, B, and C. The significance level was established at a 0.05 probability level for all statistical analyses.

3. Results

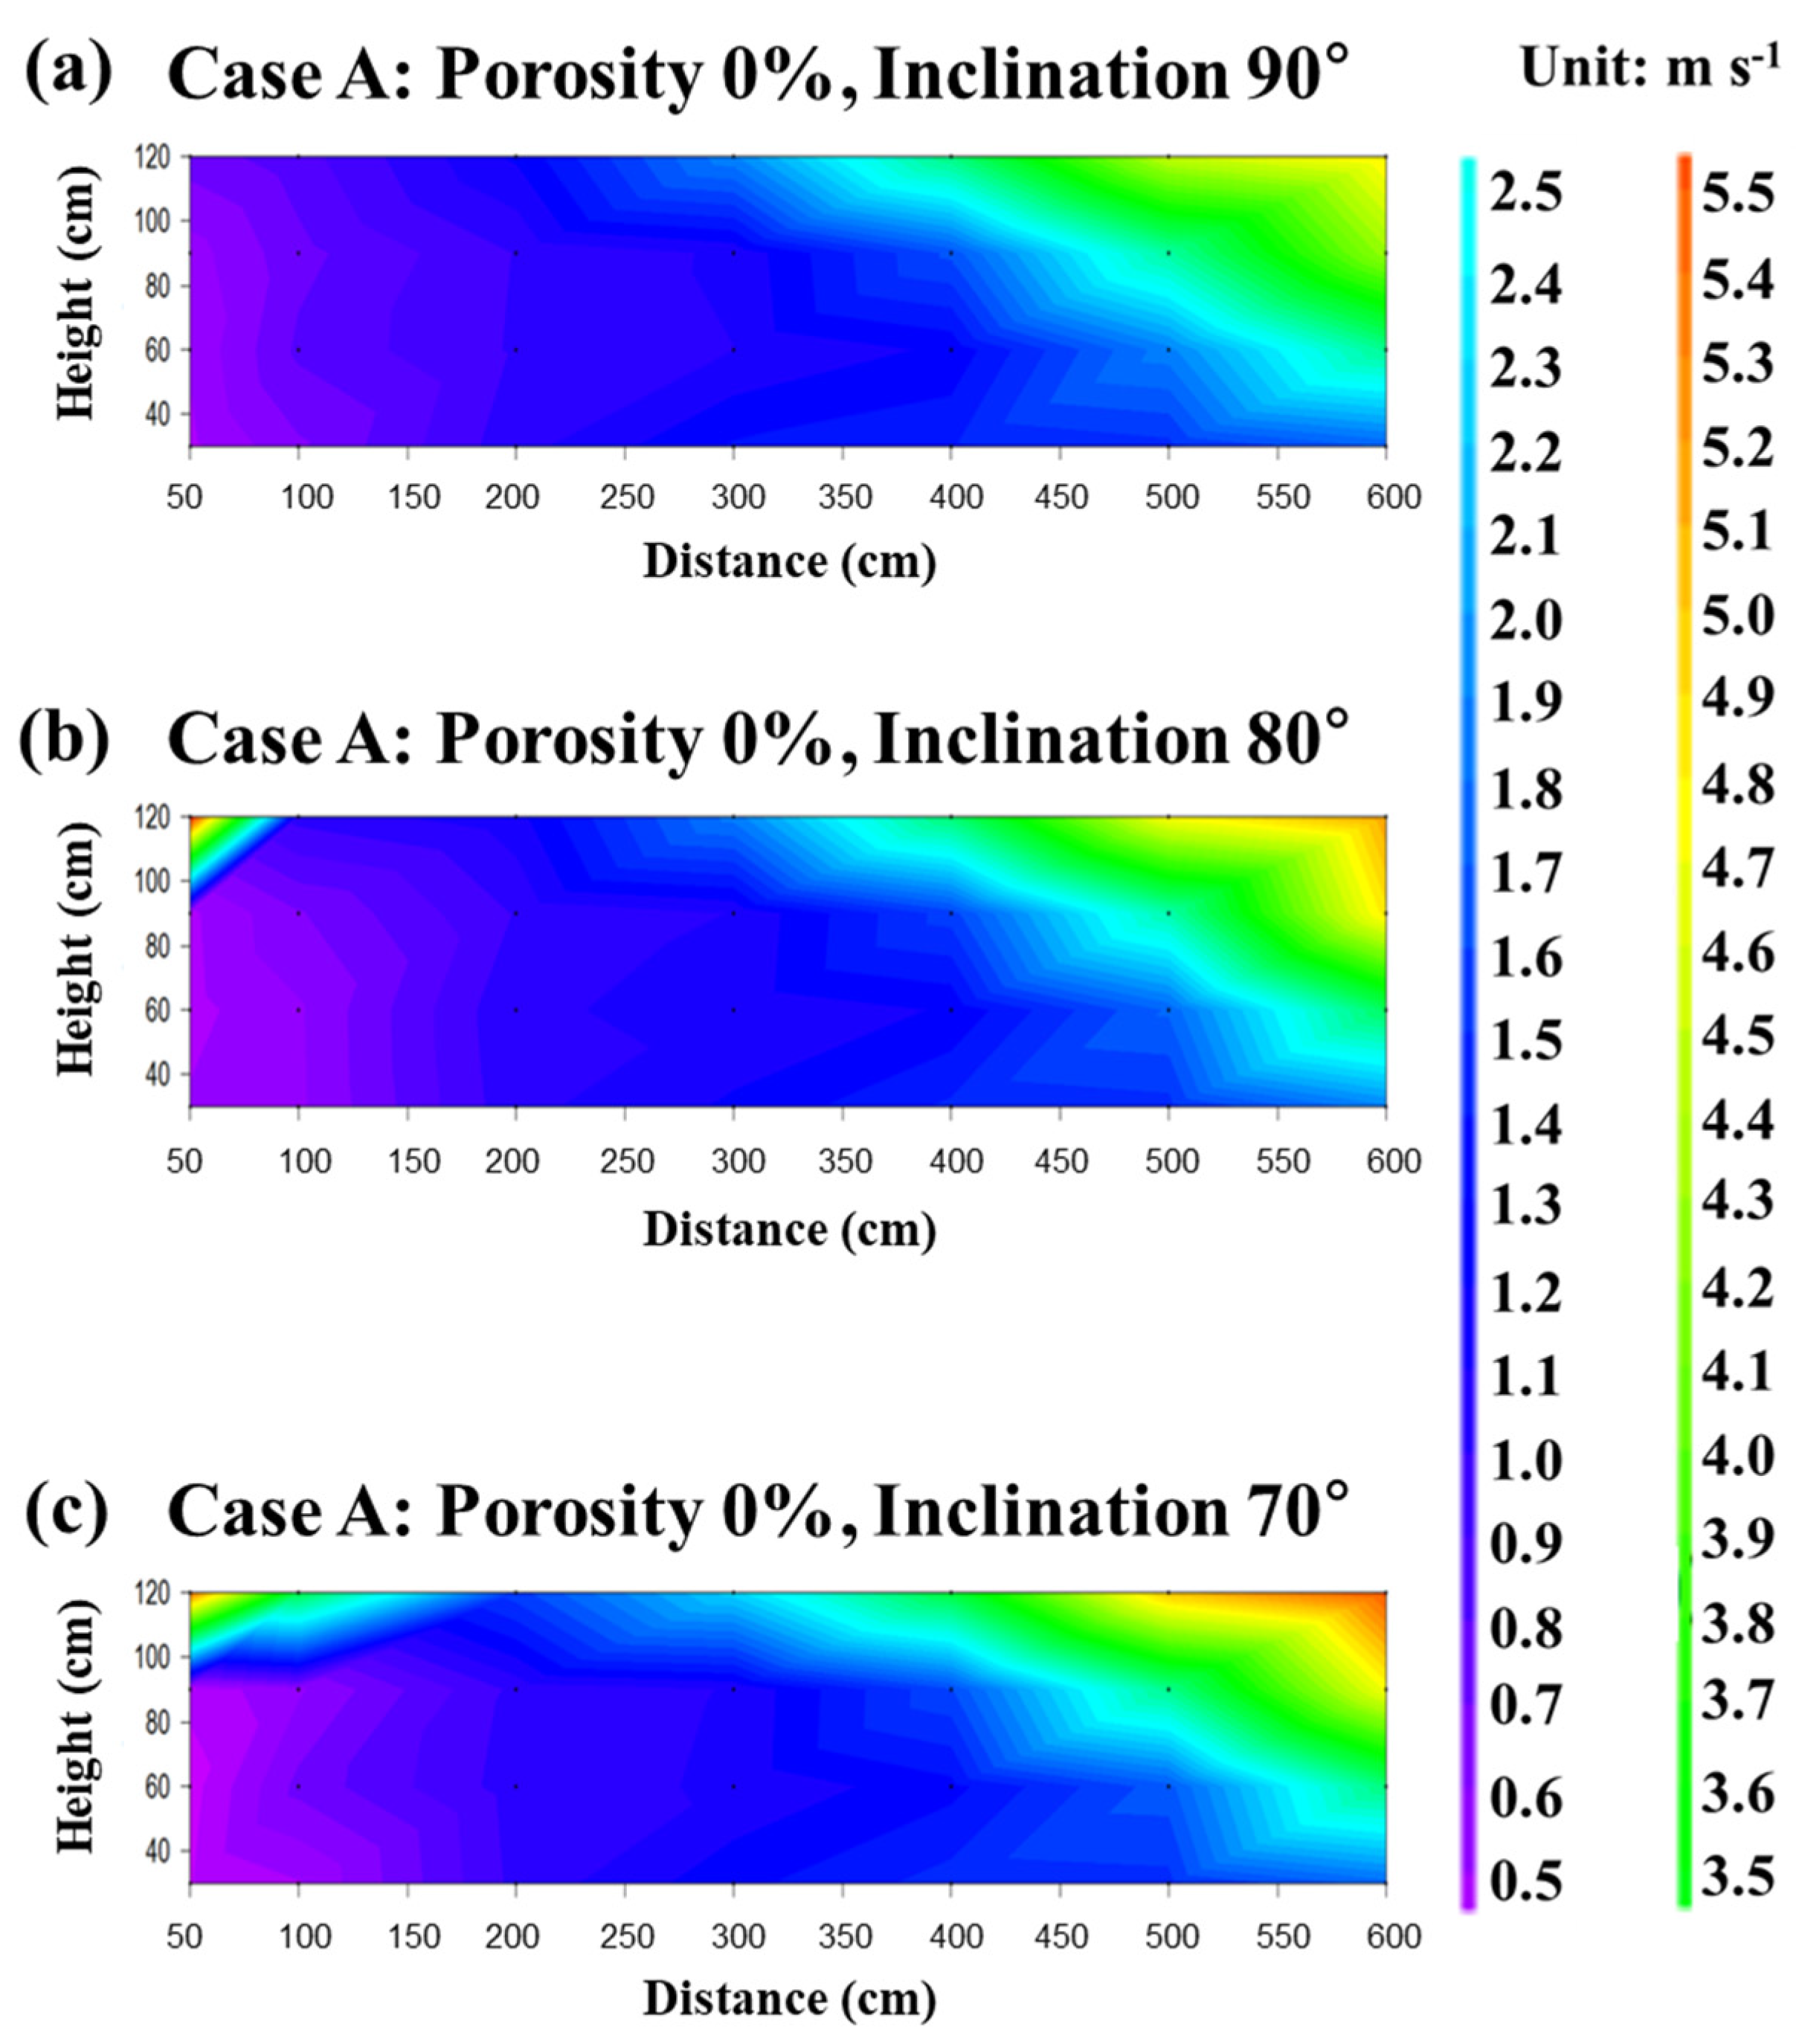
3.1. Case A (Porosity of 0% with Inclinations of 90°, 80°, and 70°)

Table 1 shows variations in the decrease in average wind velocity at different distances for a wind barrier of 0% porosity at three different inclinations (90°, 80°, and 70°), and Figure 4 shows the visualization of the spatial distribution of the average wind velocity according to distance. For each inclination, the correlation between the distance and average wind speed decrease was statistically significant at α = 0.05 (90°: F-value = 24.618, p < 0.001; 80°: F-value = 23.185, p < 0.001; 70°: F-value = 22.232, p < 0.001). The decrease in wind velocity for all inclinations was statistically significant up to six times (Table 1). The decrease in wind velocity differed slightly at each sample point according to the inclinations. The reduction ratio of the wind velocity for each inclination decreased as the distance increased, indicating a difference in the wind protection range (Table 1, Figure 4). The range of the reduction ratio also varied: 41–90% for 90°, 34–90% for 80°, and 37–90% for 70°. Among these different inclinations, the 90° vertical had a large decreasing effect for the greatest distance of 600 cm (Table 1).

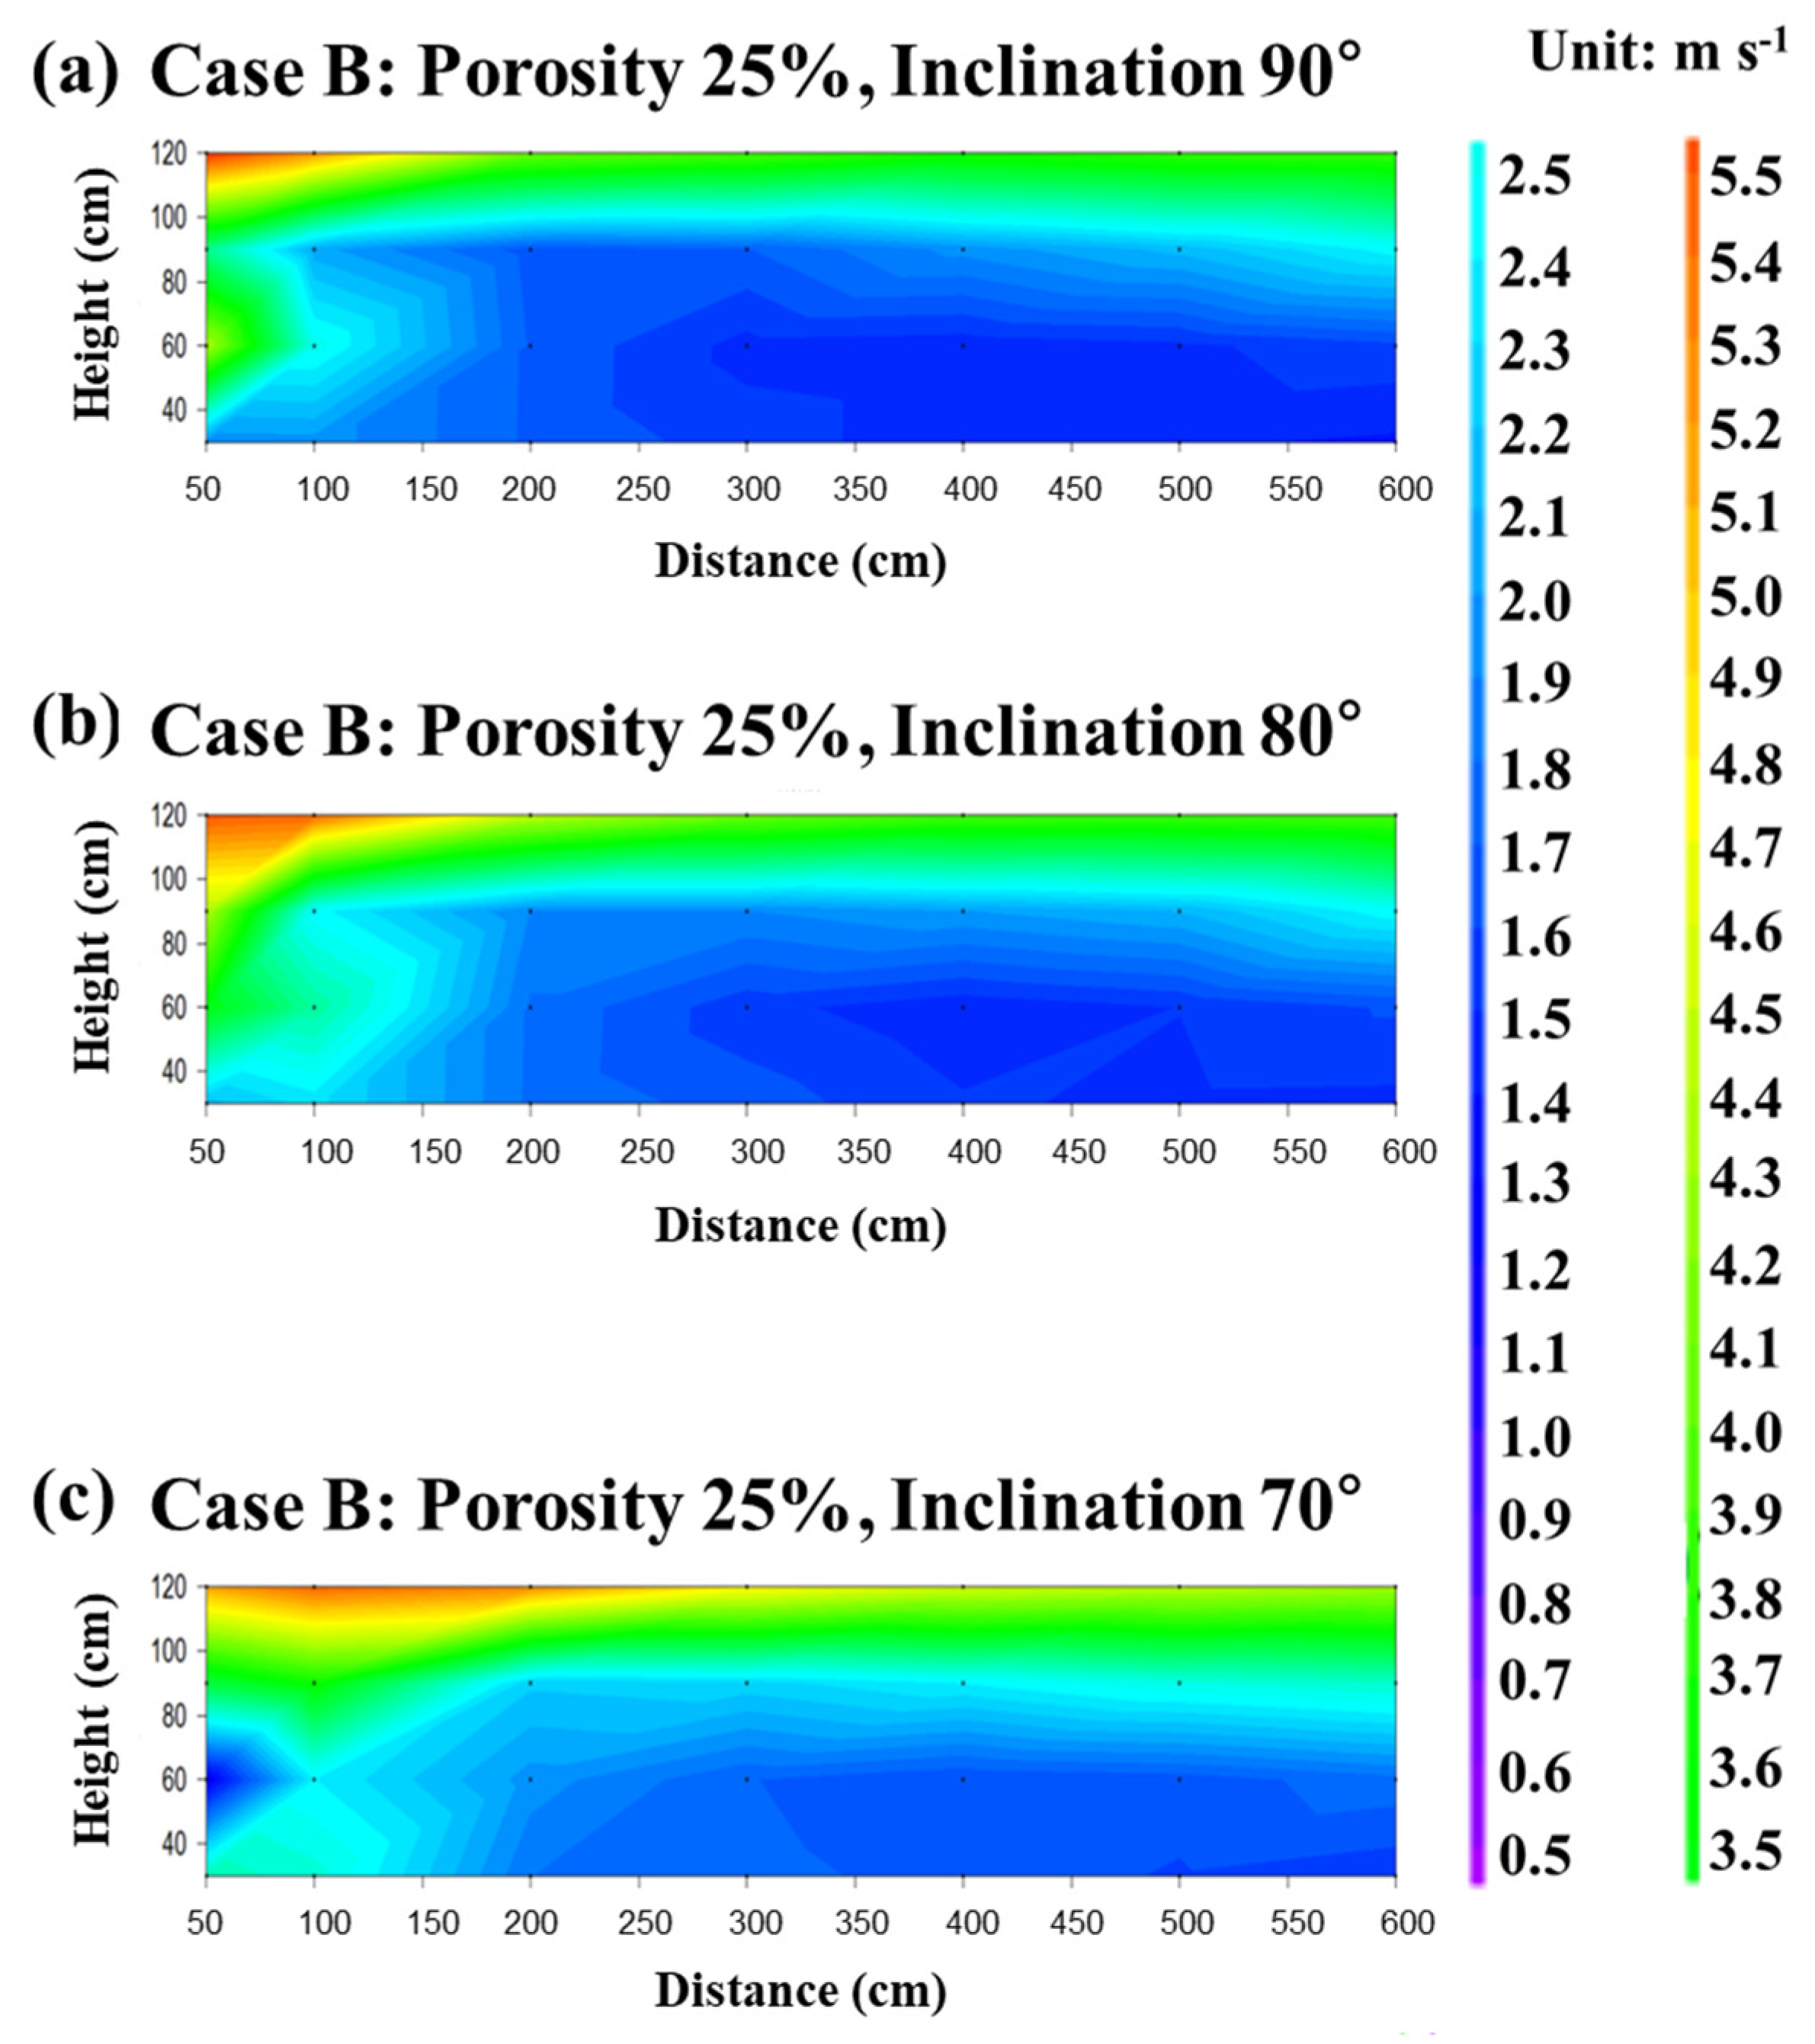
3.2. Case B (Porosity of 25% with Inclinations of 90°, 80°, and 70°)

Table 2 shows the change in the average decrease in wind velocity according to distance for a porosity of 25% of a wind barrier with different inclinations (90°, 80°, and 70°), and Figure 5 shows the visualization of the spatial distribution of the average wind velocity according to distance. For each inclination, the correlation between the distance and decrease in average wind speed was statistically significant at α = 0.05 (90°: F-value = 17.851, p < 0.001; 80°: F-value = 25.882, p < 0.001; 70°: F-value = 22.817, p < 0.001). Similar to the wind barrier with a porosity of 0%, the decreasing wind velocity effect for all inclinations was found to be up to six times greater. The reduction ratio of the wind velocity for each inclination of the wind barrier with a porosity of 0% decreased with increasing distance. In contrast, the reduction ratio for each inclination of the wind barrier with a porosity of 25% increased with increasing distance and then gradually decreased (Table 2, Figure 5). This indicates that the wind velocity differs with porosity. The wind velocity differed slightly from each measured point, according to the inclinations. The range of the reduction ratio varied with the inclination of the wind barrier, 38–69% for 90°, 33–67% for 80°, and 42–62% for 70°, indicating that inclinations played a considerable role in affecting wind velocity. The highest protection against wind was found to be provided by the inclination of 90°.

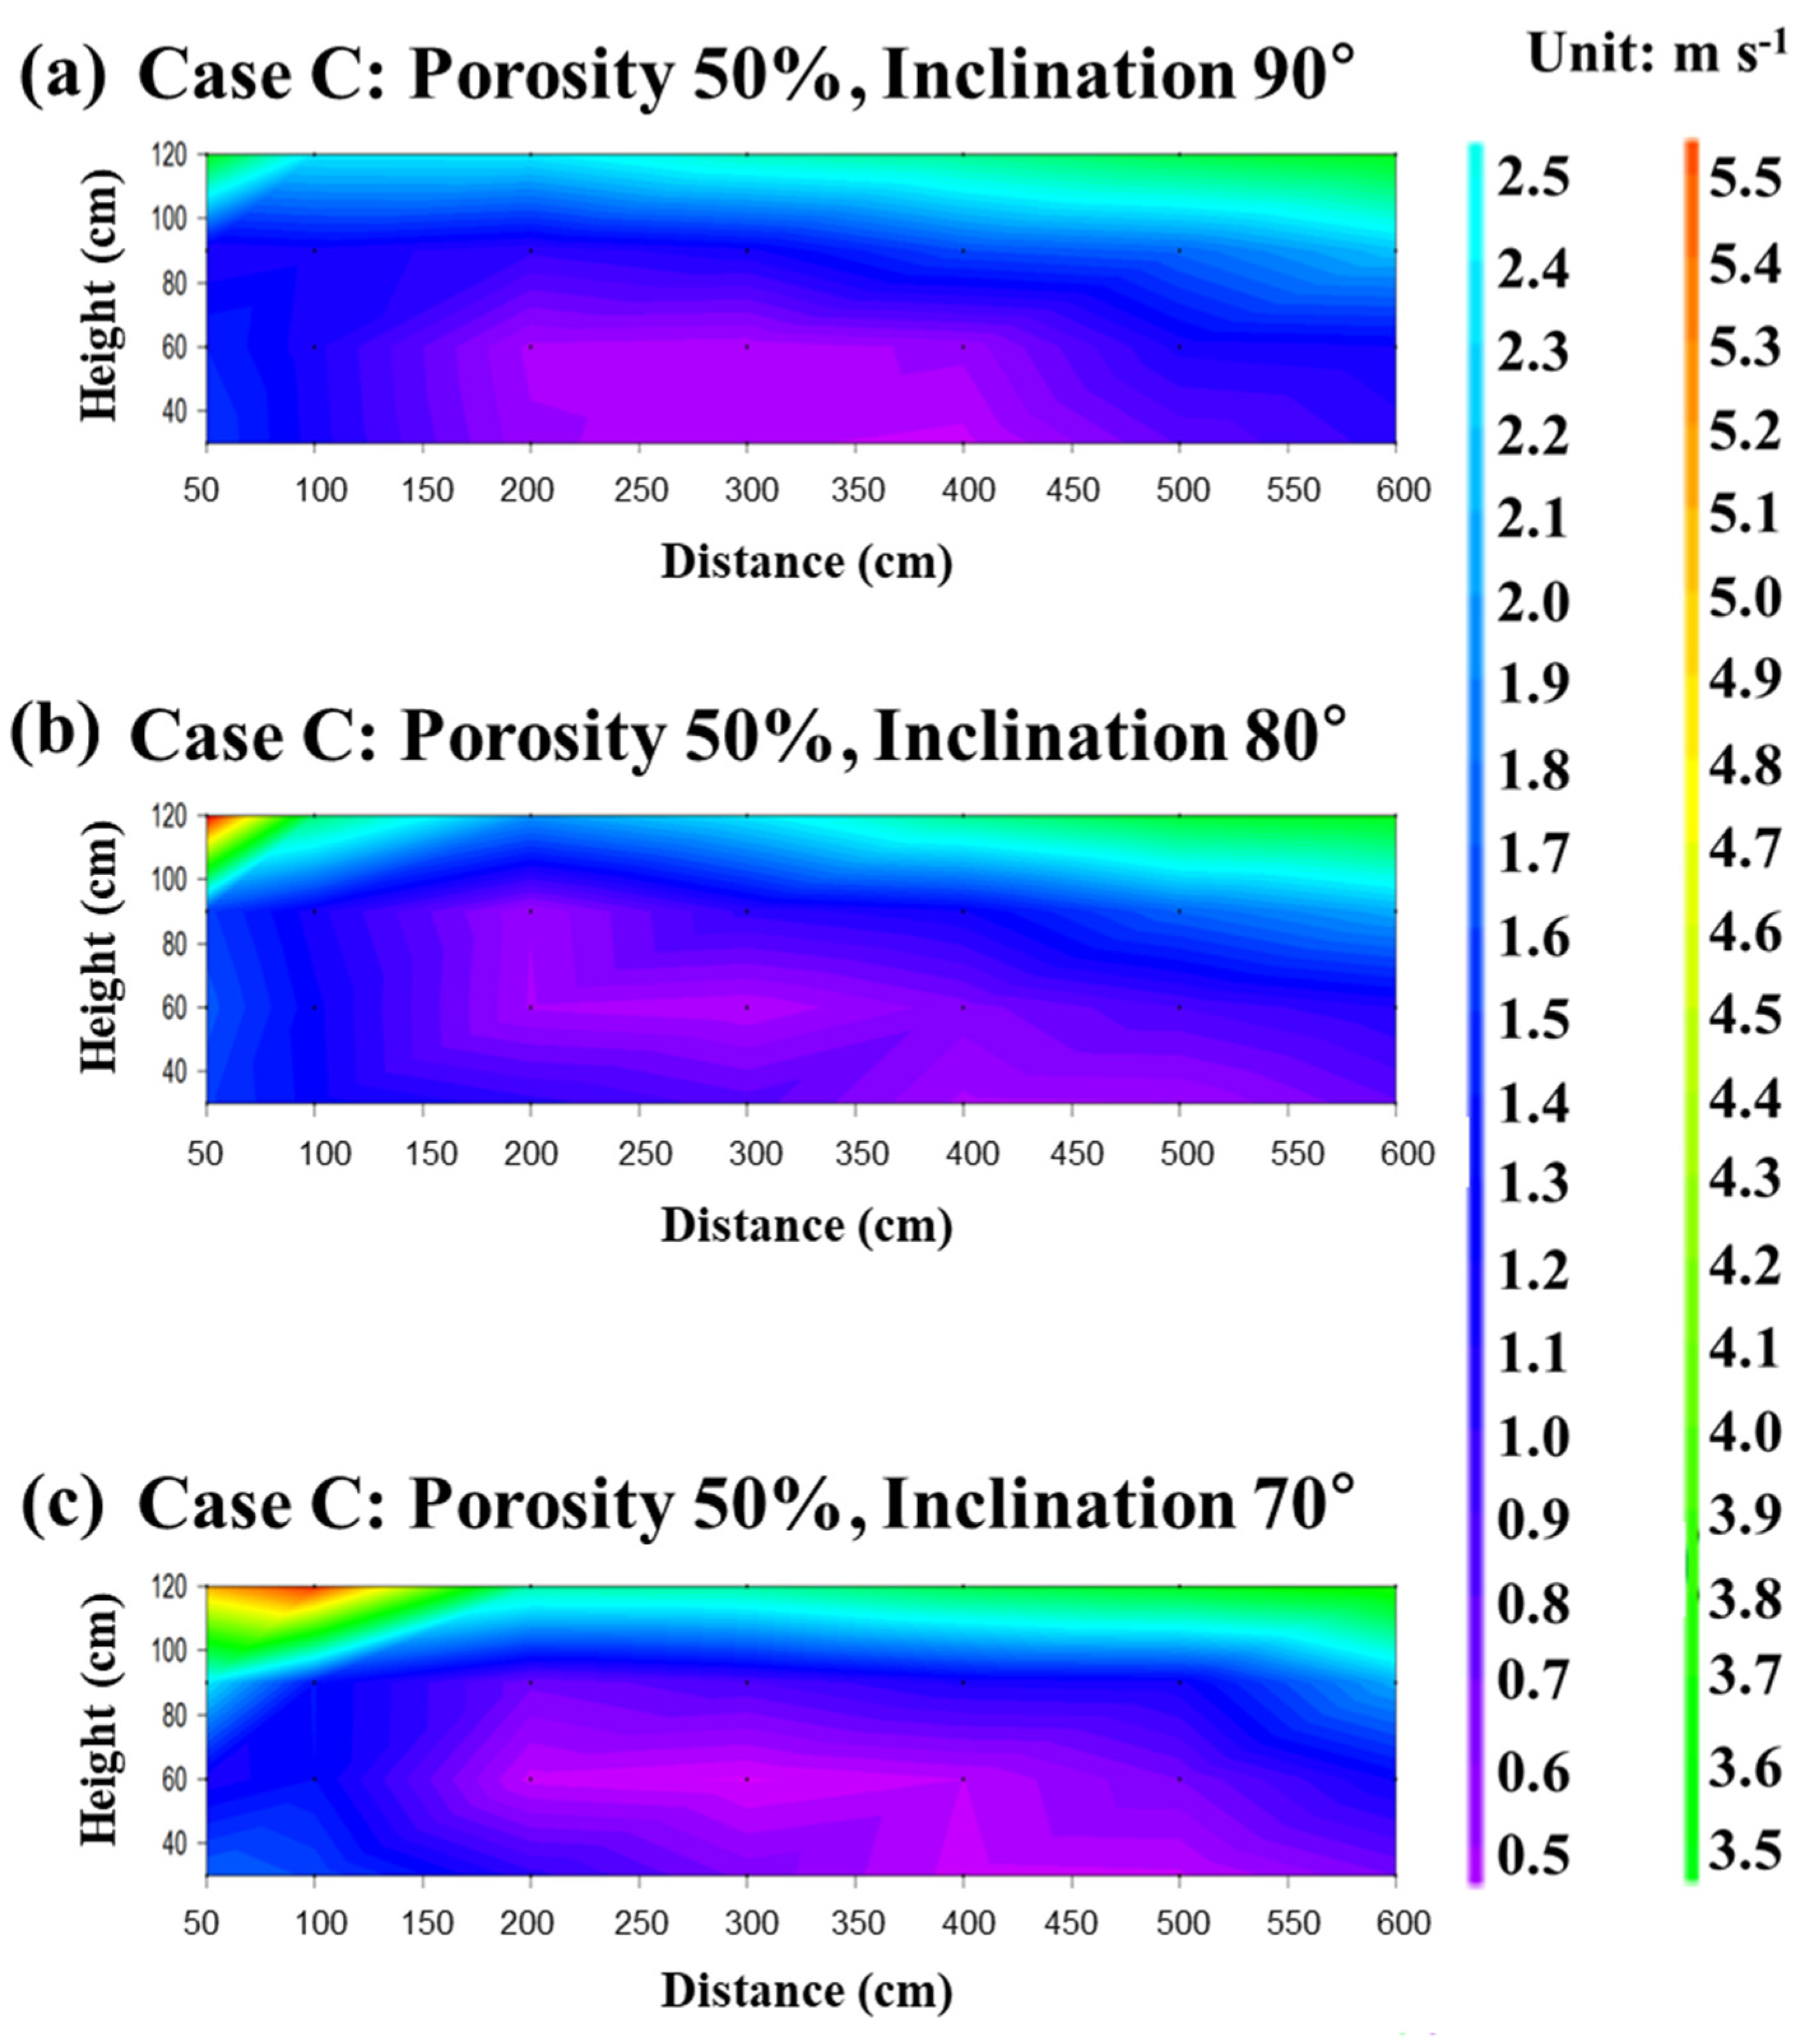
3.3. Case C (Porosity of 50% with Inclinations of 90°, 80°, and 70°)

Table 3 presents the change in the average decrease in wind velocity according to distance for a porosity of 50% with different inclinations (90°, 80°, and 70°), and Figure 6 shows the visualization of the spatial distribution of the average wind velocity according to distance. For each inclination, the correlation between the distance and decrease in average wind speed was statistically significant at α = 0.05 (90°: F-value = 59.605, p < 0.001; 80°: F-value = 50.356, p < 0.001; 70°: F-value = 55.659, p < 0.001). The effect of reducing wind velocity with a 50% porosity increased six-fold as the inclination decreased. The reduction ratio for each inclination increased and then gradually decreased as the distance increased (Table 3, Figure 6). The reduction ratios ranged from 71% to 87% at 90°, 69% to 86% at 80°, and 65% to 88% at 70°. Among the different inclinations, the reducing effect was greatest at 90° within 300 cm and greatest at 70° from 400 to 600 cm. This suggests that the wind velocity is affected by the inclination of the wind barrier.

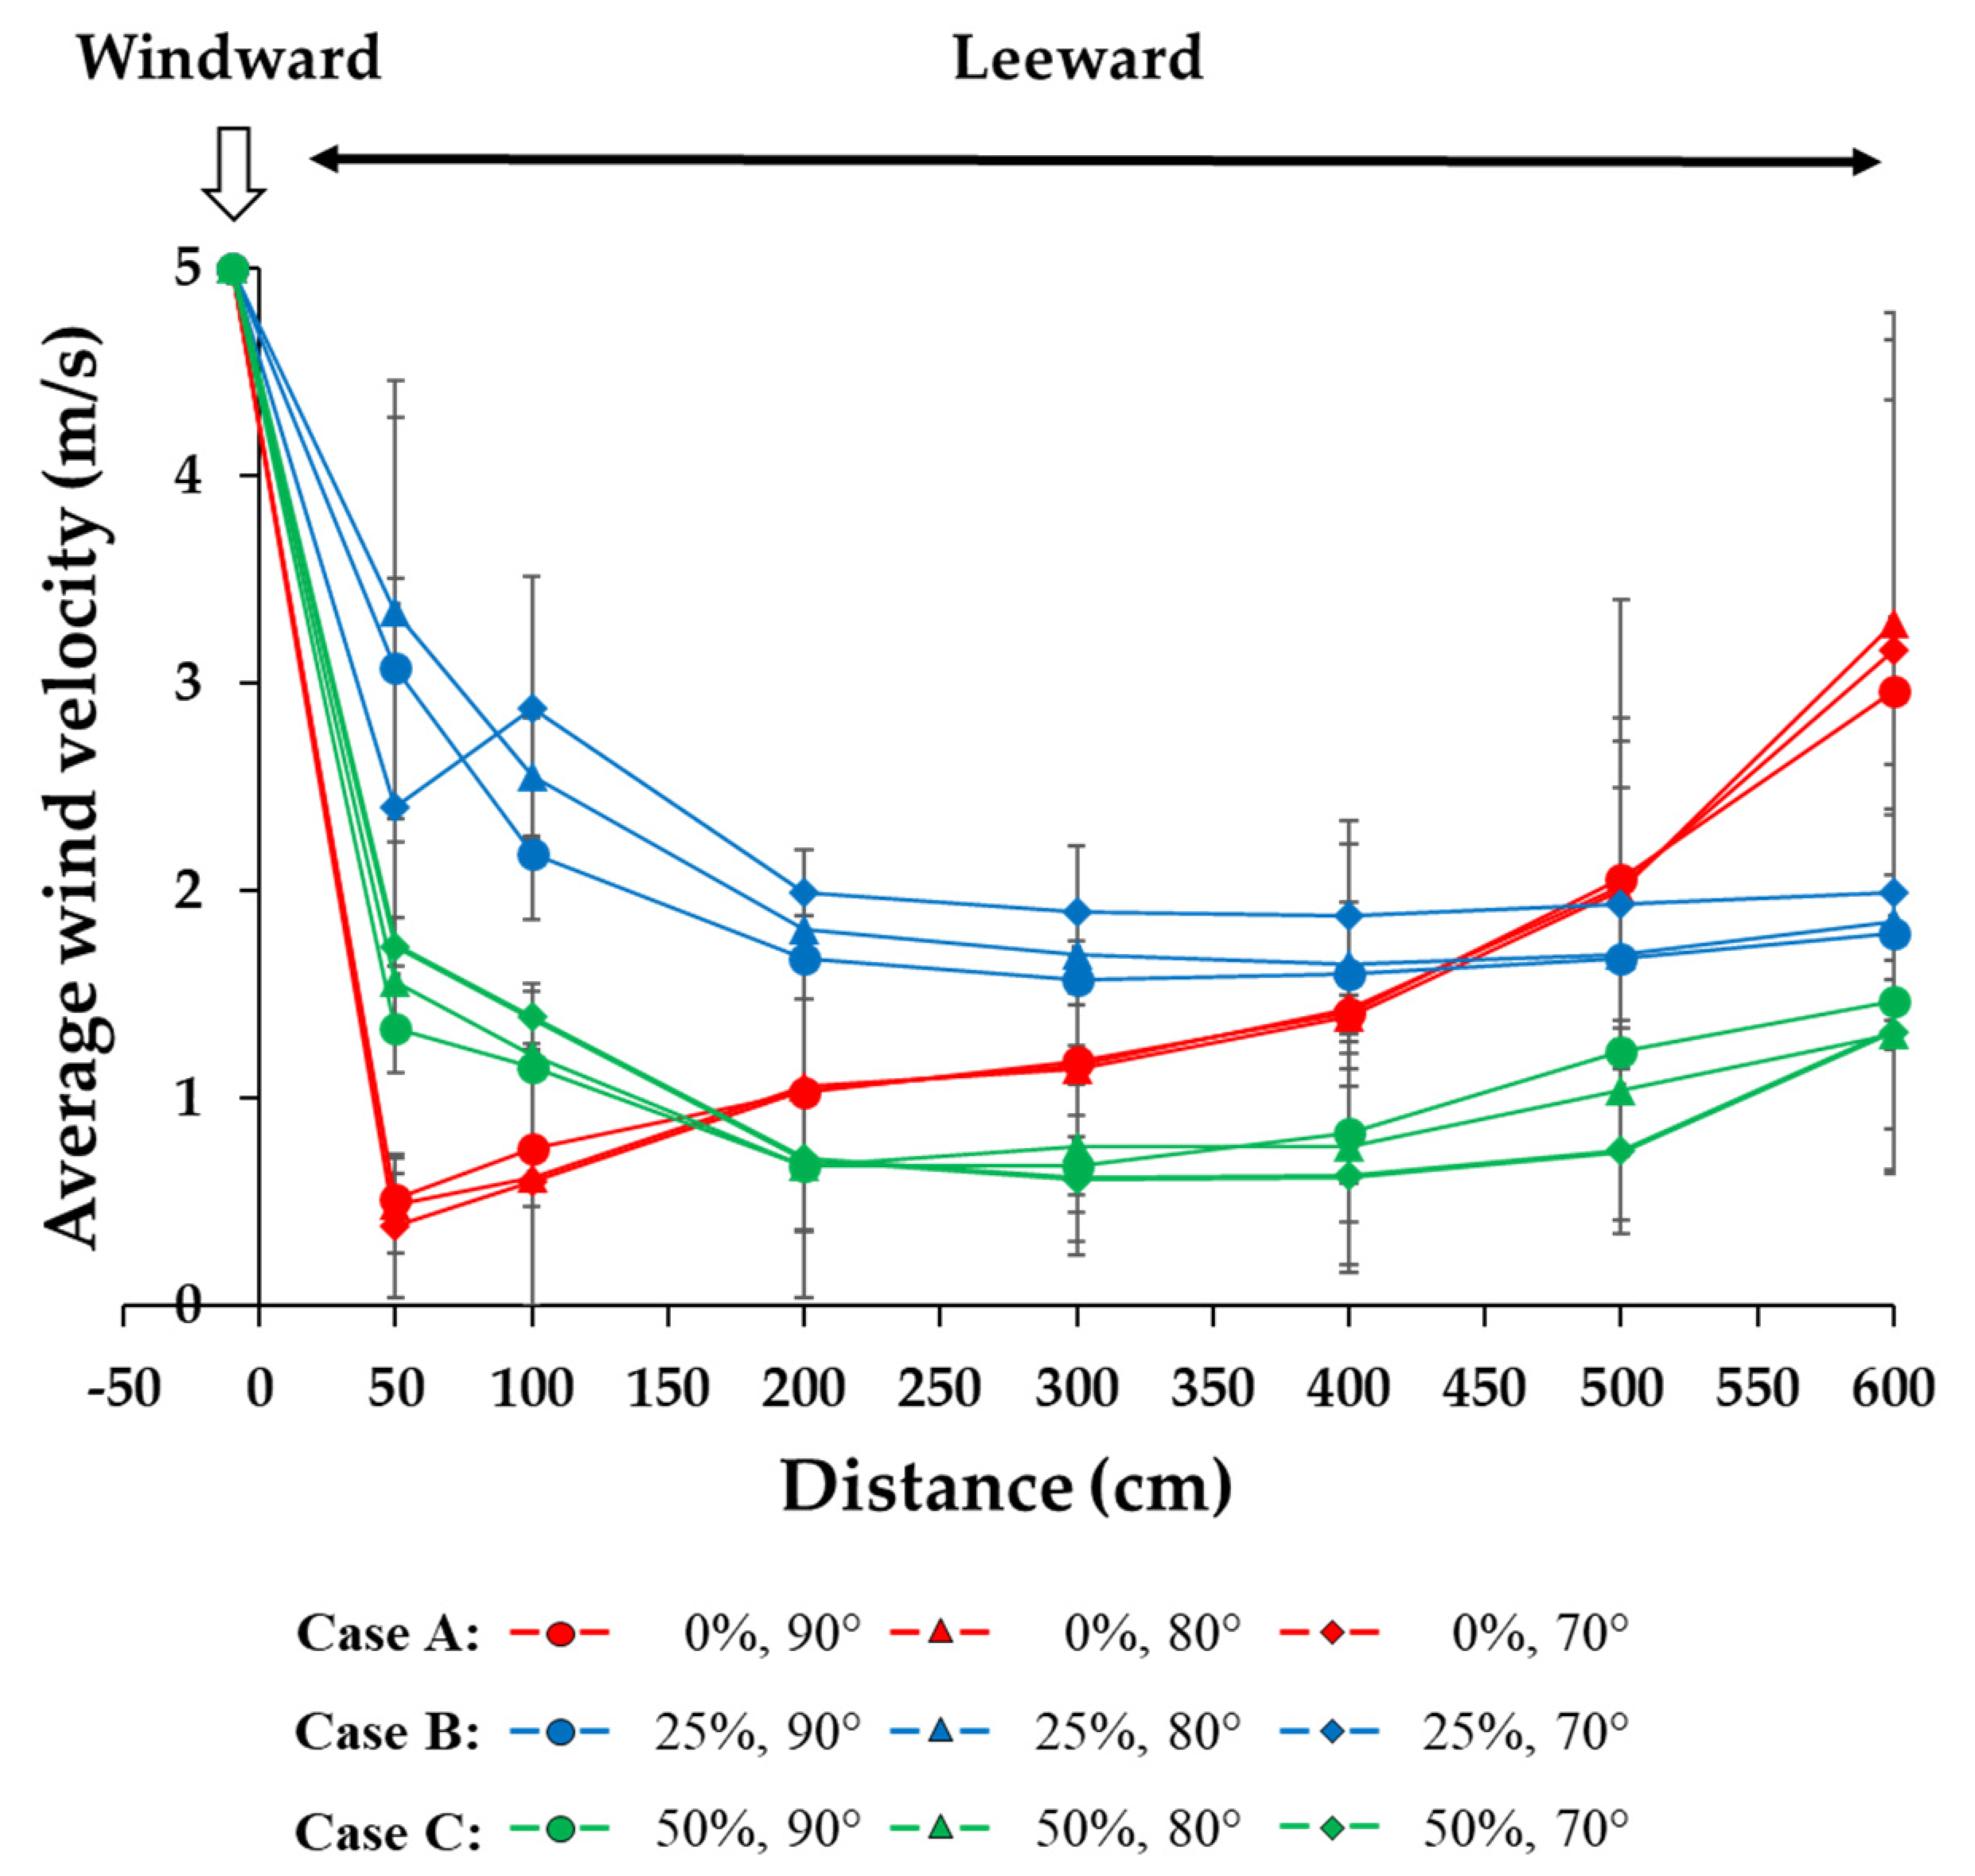
3.4. Effects of Porosity and Inclination on Wind Speed

Figure 7 shows the variations in average wind velocity (m/s) with respect to distance (cm) at the windward and leeward sides of the wind barriers for three different cases: Case A (porosity of 0% with inclinations (90°, 80°, and 70°)), Case B (porosity of 25% with inclinations (90°, 80°, and 70°)), and Case C (porosity of 50% with inclinations (90°, 80°, and 70°)). In Case A, the average wind velocity (m/s) decreased significantly at a distance of 50 cm behind the wind barriers and gradually increased as the distance from the wind barrier increased. In contrast, Cases B and C exhibited a gradual decrease up to a distance of 300 cm, followed by a slight increase. These results suggest that changes in wind flow behind wind barriers are influenced by both porosity and inclination. Notably, Case C outperformed Cases A and B, demonstrating a significantly higher wind speed reduction. Specifically, a wind barrier with a porosity of 50% and an inclination of 70° exhibited better performance, providing an ample wind protection range.

4. Discussion

Previously, the porosity of the wind barrier was regarded as the key factor influencing its effectiveness in protecting against wind (reviewed by [8,18]). To further advance the understanding of the wind flow characteristics and determine the effectiveness of wind barriers, this study examined the effects of inclinations and porosity on the effectiveness of the following wind barriers based on a wind tunnel experiment.
The reduction in wind speed varied among the three cases. For Case A, although all inclinations showed a six-fold decrease in wind velocity at the last measuring distance (Table 1), wind flow could reattach and recirculate at the leeward side of the wind barrier. Kang [33] reported that a reattachment point occurred at a distance of approximately 10–15 times the height of a wind barrier. The reattachment point and recirculation of wind flow may damage tree saplings as sea breezes with salinity, sand, and dust in coastal areas are particularly harmful to vegetation [2,9,16,17], resulting in lower growth rates [15]. Thus, when establishing a windbreak forest within a distance equal to or less than 10 times the height of the wind barriers, it is advisable to use a non-porous wind barrier in an embanked area rather than on flat land.
For Case B, the reduction ratio of wind velocity for each inclination increased with increasing distance (Table 2, Figure 5), whereas the opposite trend was observed for Case A (Table 1, Figure 4 and Figure 7). This could be explained by the increase in porosity from 0% to 25% [18,32]. Although the change in the reduction ratio of wind velocity was similar between 90° and 80°, there was an abrupt decrease between 50 cm and 100 cm at 70°, probably (Table 2, Figure 7) due to the recirculation of wind flow [26]. Overall, the effect of wind protection was weak within 200 cm. Thus, to attain protection of over 60% with wind barriers of 25% porosity, it is recommended to utilize vertical 90° wind fences. Further saplings should not be planted immediately behind the wind barriers.
Following a previous review that reported porosity as one of the influential factors on wind speed reduction alongside other factors such as the type, shape, and height of wind barriers [18], numerous earlier studies primarily focused on porosity [8,9,24,26,28]. Previous studies generally concluded that windbreaks with lower porosity had a higher reducing effect on wind velocity. However, the construction of wind barriers with lower porosities is expensive in practical applications [28]; therefore, the optimal porosity range is from 30% to 50% [24,25]. Wu et al. [8] reviewed recent studies that examined wind barrier porosity for wind protection effectiveness and reported that the highest sheltering efficiency of wind fences was achieved at a porosity within the range of 20% to 40%. In contrast, in this study, the wind barrier of Case C, with the highest porosity of 50%, substantially decreased the wind velocity and showed relatively stable reduction ratios for each inclination at varying distances relative to Cases A and B (Table 3, Figure 6 and Figure 7). In addition, the effectiveness of Case C was higher than that of Case B in this study. This implies that a lower porosity does not always result in a greater wind velocity reduction. The different results of this study from the previous studies reviewed by Wu et al. [8] may be attributed to the inclinations that were not examined in the previous studies. Among the different inclinations, the decreasing effect was the greatest at 90° within 300 cm; however, the counterpart was largest at 70° from 400 to 600 cm (Table 3, Figure 6 and Figure 7). This implies that the inclination may have a considerable effect on the range of wind protection, resulting in greater wind barrier efficacy. Therefore, the effectiveness of wind barriers may depend not only on their porosity but also on their inclination.
Our results suggest that a wind barrier with a porosity of 50% and an inclination of 70° may provide the most effective protection for pre-maturity saplings against wind in vegetative windbreak forests, although, overall, all wind barriers with varying porosities and inclinations performed well. Despite our findings, several avenues of this study remained unexplored, which should be considered in future research. As the wind tunnel section in this study was relatively small, the height of the wind barriers was not tested, although past studies have reported that height significantly affects shelter efficiency (e.g., [9,19,41]). Wind barriers with lower porosity are laborious, time-consuming, and costly, although they exhibit a higher reducing effect on wind velocity [28]. To achieve an optimal and cost-effective wind barrier, it is recommended to explore a wider range of porosities and inclinations beyond those tested in this study while keeping the material cost similar. An array of wind barriers can facilitate the reduction in wind velocity for vegetative windbreak forest construction [9]. Single and multiple rows of vegetation can also considerably reduce wind velocity, depending on the vegetation species used, such as shrubs, coniferous species, and broad-leaved species [9,10], or when combined with wind barriers [8,42]. Thus, combining an array of wind barriers with structurally varying windbreak trees with different porosities and inclinations could further advance our understanding of the change in wind flow caused by different porosities and inclinations, and optimize vegetative windbreak forest management strategies for various environmental conditions.

5. Conclusions

In a wind tunnel experiment, we examined the simultaneous effect of wind barrier porosity and inclination on wind speed reduction. The key findings of this study were as follows:
  • The wind barriers tested in this study, which varied in porosity and inclination, exhibited different effects on wind speed reduction at various distances. This suggests that both the porosity and inclination of wind barriers play important roles in providing wind protection.
  • All wind barriers provided up to six times more wind protection on the leeward side than on the windward side. However, the wind velocity reduction ratio varied at each distance for all wind barriers, indicating different levels of wind protection.
  • Among the evaluated wind barriers, a wind barrier with a porosity of 0% and an inclination of 90° demonstrated the highest reduction in wind velocity. However, this wind barrier had a very limited wind protection range and could potentially cause wind flow recirculation on the leeward side, posing a risk of sapling damage.
  • In contrast, a wind barrier with a porosity of 50% and an inclination of 70° sufficiently decreased wind velocity and prevented the recirculation of wind flow, thereby improving sapling protection and reducing material costs.
Our findings offer novel insights into the influence of wind barriers in terms of not only their porosity, which has been primarily examined as a key factor affecting wind speed reduction, but also their inclination. However, there are additional aspects that warrant further exploration beyond the scope of this study. Specifically, future investigations should explore the impact of wind barrier height, which was not evaluated in this study because of the limited size of the wind tunnel section. The height of wind barriers also plays a crucial role in determining shelter efficiency. Additionally, it is essential to investigate the integration of wind barriers with windbreak vegetative species (e.g., shrubs and trees), which exhibit diverse structural characteristics, porosities, and inclinations. Such comprehensive studies will facilitate the optimization of management strategies for vegetative windbreak forests under a range of environmental conditions.

Author Contributions

S.-H.L.: conceptualization, formal analysis, writing—original draft preparation, writing—review and editing, supervision, project administration, and funding acquisitions. H.K.: formal analysis, data duration, and writing—review and editing. H.M.: writing—review and editing. H.-S.K.: methodology, investigation, and writing—review and editing. S.-S.H.: writing—review and editing. S.J.: conceptualization, methodology, investigation, formal analysis, data curation, writing—original draft preparation, writing—review and editing, and visualization. All authors have read and agreed to the published version of the manuscript.

Funding

This work was supported by the Forest Science & Technology Development Project funded by Korea Forest Service (grant number S111111L050130), and the research grant of the Gyeongsang National University in 2022.

Institutional Review Board Statement

Not applicable.

Informed Consent Statement

Not applicable.

Data Availability Statement

The data in this study are available on reasonable request from the corresponding author.

Acknowledgments

The authors acknowledge the staff of the Korea Engineering Development Collaboratory Management Institute (KOCED) for their help in the set-up of wind barriers. We thank the editor and five anonymous reviewers for their constructive comments on the manuscript.

Conflicts of Interest

The authors declare no conflict of interest.

References

  1. Wang, H.; Hua, J.; Kang, M.; Wang, X.; Fan, X.-R.; Fourcaud, T.; de Reffye, P. Stronger wind, smaller tree: Testing tree growth plasticity through a modling approach. Front. Plan Sci. 2022, 13, 971690. [Google Scholar] [CrossRef] [PubMed]
  2. Ancelin, P.; Courbaud, B.I.T.; Fourcaud, T. Development of an individual tree-based mechanical model to predict wind damage within forest stands. For. Ecol. Manag. 2004, 203, 101–121. [Google Scholar] [CrossRef]
  3. de Langre, E. Effects of wind on plants. Annu. Rev. Fluid Mech. 2008, 40, 141–168. [Google Scholar] [CrossRef] [Green Version]
  4. Gardiner, B.; Peltola, H.; Kellomäki, S. Comparison of two models for predicting the critical wind speeds required to damage coniferous trees. Ecol. Model. 2000, 129, 1–23. [Google Scholar] [CrossRef]
  5. Niklas, K.J.; Spatz, H.-C. Wind-induced stresses in cherry trees: Evidence against the hypothesis of constant stress level. Trees-Struct. Funct. 2000, 14, 230–237. [Google Scholar] [CrossRef]
  6. Gardiner, B.; Berry, P.; Moulia, B. Review: Wind impacts on plant growth, mechanics and damage. Plant Sci. 2016, 245, 94–118. [Google Scholar] [CrossRef]
  7. Jo, H.K.; Park, H.M. Effects of windbreak planting on crop productivity for agroforestry practices in a semi-arid region. J. For. Environ. Sci. 2017, 33, 348–354. [Google Scholar] [CrossRef]
  8. Wu, X.; Guo, Z.; Wang, R.; Fan, P.; Xiang, H.; Zuo, X.; Yin, J.; Fang, H. Optimal design for wind fence based on 3D numerical simulation. Agric. For. Meteorol. 2022, 323, 109072. [Google Scholar] [CrossRef]
  9. Bitog, J.P.; Lee, I.-B.; Shin, M.-H.; Hong, S.-W.; Hwang, S.-H.; Seo, I.-H.; Yoo, J.-I.; Kwon, K.-S.; Kim, Y.-H.; Han, J.-W. Numerical simulation of an array of fences in Saemangeum reclaimed land. Atmos. Environ. 2009, 43, 4612–4621. [Google Scholar] [CrossRef]
  10. Jeong, S.; Lee, S.-H. Effects of windbreak forest according to tree species and planting methods based on wind tunnel experiments. For. Sci. Technol. 2020, 16, 188–194. [Google Scholar] [CrossRef]
  11. Lyu, J.; Wang, C.M.; Mason, M.S. Review of models for predicting wind characteristics behind windbreaks. J. Wind Eng. Ind. Aerodyn. 2020, 199, 104117. [Google Scholar] [CrossRef]
  12. Bitog, J.P.; Lee, I.-B.; Hwang, H.-S.; Shin, M.-H.; Hong, S.-W.; Seo, I.-H.; Mostafa, E.; Pang, Z. A wind tunnel study on aerodynamic porosity and windbreak drag. For. Sci. Technol. 2011, 7, 8–16. [Google Scholar] [CrossRef]
  13. Bitog, J.P.; Lee, I.-B.; Hwang, H.-S.; Shin, M.-H.; Hong, S.-W.; Seo, I.-H.; Kwon, K.-S.; Mostafa, E.; Pang, Z. Numerical simulation study of a tree windbreak. Biosyst. Eng. 2012, 111, 40–48. [Google Scholar] [CrossRef]
  14. Wu, T.; Yu, M.; Wang, G.; Wang, Z.; Duan, X.; Dong, Y.; Cheng, X. Effects of stand structure on wind speed reduction in a Metasequoia Glyptostroboides shelterbelt. Agrofor. Syst. 2013, 87, 51–257. [Google Scholar] [CrossRef]
  15. Kim, J.H.; Lim, J.H.; Seo, K.W.; Jeong, Y.H. Effect of wind break on the early growth of Pinus thunbergii at Saemangeum sea-wall. Korean J. Agric. For. Meteorol. 2013, 15, 210–218. [Google Scholar] [CrossRef] [Green Version]
  16. Munns, R. Comparative physiology of salt and water stress. Plant Cell Environ. 2002, 25, 239–250. [Google Scholar] [CrossRef] [PubMed] [Green Version]
  17. Zhu, J.K. Plant salt tolerance. Trends Plant Sci. 2001, 6, 66–71. [Google Scholar] [CrossRef]
  18. Heisler, G.M.; Dewalle, D.R. 2. Effects of windbreak structure on wind flow. Agric. Ecosyst. Environ. 1988, 22–23, 41–69. [Google Scholar] [CrossRef]
  19. Li, B.; Sherman, D.J. Aerodynamics and morphodynamics of sand fences: A review. Aeolian Res. 2015, 17, 33–48. [Google Scholar] [CrossRef]
  20. Manickathan, L.; Defraeye, T.; Allegrini, J.; Derome, D.; Carmeliet, J. Comparative study of flow field and drag coefficient of model and small natural trees in a wind tunnel. Urban For. Urban Green. 2018, 35, 230–239. [Google Scholar] [CrossRef]
  21. Duniway, M.C.; Pfennigwerth, A.A.; Fick, S.E.; Nauman, T.W.; Belnap, J.; Barger, N.N. Wind erosion and dust from US drylands: A review of causes, consequences, and solutions in a changing world. Ecosphere 2019, 10, e02650. [Google Scholar] [CrossRef] [Green Version]
  22. Yang, H.; Lu, Q.; Wu, B.; Yang, H.; Zhang, J.; Lin, Y. Vegetation diversity and its application in sandy desert revegetation on Tibetan Plateau. J. Arid Environ. 2006, 65, 619–631. [Google Scholar] [CrossRef]
  23. Wu, T.; Zhang, P.; Zhang, L.; Wang, J.; Yu, M.; Zhou, X.; Wang, G.G. Relationship between shelter effects of optical porosity: A meta-analysis for tree windbreaks. Agric. For. Meteorol. 2018, 259, 75–81. [Google Scholar] [CrossRef]
  24. Chen, G.; Wang, W.; Sun, C.; Li, J. 3D numerical simulation of wind flow behind a new porous fence. Powder Technol. 2012, 230, 118–126. [Google Scholar] [CrossRef]
  25. Lee, S.J.; Lim, H.C. A numerical study on flow around a triangular prism located behind a porous fence. Fluid Dyn. Res. 2001, 28, 209–221. [Google Scholar] [CrossRef]
  26. Lee, S.J.; Park, K.C.; Park, C.W. Wind tunnel observations about the shelter effect of porous fences on the sand particle movements. Atmos. Environ. 2002, 36, 1453–1463. [Google Scholar] [CrossRef]
  27. Perera, M.D.A.E.S. Shelter behind two-dimensional solid and porous fences. J. Wind Eng. Ind. Aerodyn. 1981, 8, 93–104. [Google Scholar] [CrossRef]
  28. Raine, J.K.; Stevenson, D.C. Wind protection by model fences in a simulated atmospheric boundary layer. J. Wind Eng. Ind. Aerodyn. 1977, 2, 159–180. [Google Scholar] [CrossRef]
  29. Ranga Raju, K.G.; Garde, R.J.; Singh, S.K.; Singh, N. Experimental study on characteristics of flow past porous fences. J. Wind Eng. Ind. Aerodyn. 1988, 29, 155–163. [Google Scholar] [CrossRef]
  30. Wang, T.; Qu, J.; Ling, Y.; Xie, S.; Xiao, J. Wind tunnel test on the effect of metal net fences on sand flux in a Gobi Desert, China. J. Arid Land. 2017, 9, 888–899. [Google Scholar] [CrossRef] [Green Version]
  31. Zhou, X.; Zhang, T.; Ma, W.; Quan, Y.; Gu, M.; Kang, L.; Yang, Y. CFD simulation of snow redistribution on a bridge deck: Effect of barriers with different porosities. Cold Reg. Sci. Technol. 2021, 181, 103174. [Google Scholar] [CrossRef]
  32. Yu, Y.P.; Zhang, K.C.; An, Z.S.; Wang, T.; Hu, F. The blocking effect of the sand fences quantified using wind tunnel simulations. J. Mt. Sci. 2020, 17, 2485–2496. [Google Scholar] [CrossRef]
  33. Kang, K. Wind-tunnel simulation on the wind fence effect. J. Korean Environ. Sci. Soc. 1998, 7, 20–26, (In Korean with English Abstract). [Google Scholar]
  34. Naaim-Bouvet, F.; Naaim, M.; Michaux, J.L. Snow fences on slopes at high wind speed: Physical modelling in the CSTB cold wind tunnel. Nat. Hazards Earth Syst. Sci. 2002, 2, 137–145. [Google Scholar] [CrossRef]
  35. Chen, T.Y.; Liou, L.R. Blockage corrections in wind tunnel tests of small horizontal-axis wind turbines. Exp. Therm. Fluid Sci. 2011, 35, 565–569. [Google Scholar] [CrossRef]
  36. He, R.; Sun, H.; Gao, X.; Yang, H. Wind tunnel tests for wind turbines: A state-of-the-art review. Renew. Sust. Energy Rev. 2022, 166, 112675. [Google Scholar] [CrossRef]
  37. Jeong, U.Y.; Park, T.K. Experimental Investigation of the Shelter Effect of Porous Wind Fences. KSCE 2002, 22, 1481–1490, (In Korea with English Abstract). [Google Scholar]
  38. Jeong, H.; Lee, S.; Kwon, S.D. Blockage corrections for wind tunnel tests conducted on a Darrieus wind turbine. J. Wind Eng. Ind. Aerodyn. 2018, 179, 229–239. [Google Scholar] [CrossRef]
  39. Korea Meteorological Administration. Open MET Data Portal. Available online: https://data.kma.go.kr/resources/html/en/aowdp.html (accessed on 4 January 2023). (In Korean).
  40. Duncan, D.B. Multiple range and multiple F tests. Biometrics 1955, 11, 1–42. [Google Scholar] [CrossRef]
  41. Dong, Z.; Luo, W.; Qian, G.; Wang, H. A wind tunnel simulation of the mean velocity fields behind upright porous fences. Agric. For. Meteorol. 2007, 146, 82–93. [Google Scholar] [CrossRef]
  42. Wang, T.; Qu, J.; Ling, Y.; Liu, B.; Xiao, J. Shelter effect efficacy of sand fences: A comparison of systems in a wind tunnel. Aeolian Res. 2018, 30, 32–40. [Google Scholar] [CrossRef]
Figure 1. (a) Structure of a small-scale simulation model installed at a 30 cm height from the ground with a wind barrier and (b) a sensor for wind velocity.
Applsci 13 08310 g001
Figure 2. (a) Schematic diagram of porous and non-porous wind barriers at different inclinations and (b) three case studies (A, B, and C) with different porosities (0%, 25%, and 50%) and inclinations (90°, 80°, and 70°).
Applsci 13 08310 g002
Figure 3. The 3 vertical measuring points in front of wind barriers and 3 vertical measuring points and 7 horizontal measuring points (i.e., 21 measuring points in total) behind wind barriers.
Applsci 13 08310 g003
Figure 4. Visualization of the spatial distribution of the average wind velocity according to distance for Case A with a wind barrier porosity of 0% and an inclination of (a) 90°, (b) 80°, and (c) 70°.
Applsci 13 08310 g004
Figure 5. Visualization of the spatial distribution of the average wind velocity according to distance for Case B with a wind barrier porosity of 25% and an inclination of (a) 90°, (b) 80°, and (c) 70°.
Applsci 13 08310 g005
Figure 6. Visualization of the spatial distribution of the average wind velocity according to distance for Case C with a wind barrier porosity of 50% and an inclination of (a) 90°, (b) 80°, and (c) 70°.
Applsci 13 08310 g006
Figure 7. The relationship between average wind velocity (m/s) and distance (cm) on the windward and leeward sides of the wind barriers. The percentages (%) and degrees (°) in the legend represent the porosity and inclination of the wind barriers, respectively. The bars represent the standard deviation.
Applsci 13 08310 g007
Table 1. Case A—average wind velocity at 0% porosity and three different inclinations of wind barriers (90°, 80°, and 70°) for every measuring point.
Porosity (%)Inclination (°)Distance (cm)Height (cm)Velocity (m/s)Wind Reduction Ratio (%)
0%90°−10 (C)30, 60, 905.000 ± 0.000 d0
5030, 60, 900.516 ± 0.120 a90
10030, 60, 900.757 ± 0.756 a85
20030, 60, 901.027 ± 0.989 a79
30030, 60, 901.178 ± 0.365 ab76
40030, 60, 901.412 ± 0.818 ab72
50030, 60, 902.064 ± 1.340 b59
60030, 60, 902.969 ± 1.400 c41
80°−10 (C)30, 60, 905.000 ± 0.000 d0
5030, 60, 900.486 ± 0.230 a90
10030, 60, 900.618 ± 0.614 a88
20030, 60, 901.057 ± 0.426 ab79
30030, 60, 901.147 ± 0.614 ab77
40030, 60, 901.393 ± 0.171 ab72
50030, 60, 902.000 ± 0.720 b60
60030, 60, 903.289 ± 1.498 c34
70°−10 (C)30, 60, 905.000 ± 0.000 d0
5030, 60, 900.390 ± 0.345 a90
10030, 60, 900.602 ± 0.121 a88
20030, 60, 901.036 ± 0.013 ab79
30030, 60, 901.164 ± 0.091 ab77
40030, 60, 901.434 ± 0.162 ab71
50030, 60, 902.025 ± 0.807 b60
60030, 60, 903.163 ± 1.495 c37
(C) represents the windward control point of wind speed. Wind velocity (m/s) is given with corresponding standard deviation values. Superscripts with different letters for wind velocity denote identical groups of the average wind velocity for each inclination of the wind barrier (90°, 80°, and 70°) classified using Duncan analysis (significant at p < 0.05).
Table 2. Case B—average wind velocity at 25% porosity and three different inclinations of wind barriers (90°, 80°, and 70°) for every measuring point.
Porosity (%)Inclination (°)Distance (cm)Height (cm)Velocity (m/s)Wind Reduction Ratio (%)
25%90°−10 (C)30, 60, 905.000 ± 0.000 c0
5030, 60, 903.077 ± 1.207 b38
10030, 60, 902.180 ± 0.319 a56
20030, 60, 901.673 ± 0.020 a67
30030, 60, 901.570 ± 0.117 a69
40030, 60, 901.603 ± 0.289 a68
50030, 60, 901.675 ± 0.398 a66
60030, 60, 901.801 ± 0.568 a64
80°−10 (C)30, 60, 905.000 ± 0.000 d0
5030, 60, 903.350 ± 1.114 c33
10030, 60, 902.553 ± 0.284 b49
20030, 60, 901.818 ± 0.065 ab64
30030, 60, 901.695 ± 0.185 a66
40030, 60, 901.644 ± 0.306 a67
50030, 60, 901.695 ± 0.354 a66
60030, 60, 901.852 ± 0.540 ab63
70°−10 (C)30, 60, 905.000 ± 0.000 c0
5030, 60, 902.409 ± 1.101 ab52
10030, 60, 902.883 ± 0.635 b42
20030, 60, 901.992 ± 0.211 a60
30030, 60, 901.902 ± 0.312 a62
40030, 60, 901.886 ± 0.450 a62
50030, 60, 901.939 ± 0.560 a61
60030, 60, 901.997 ± 0.618 a60
(C) represents the windward control point of wind speed. Wind velocity (m/s) is given with corresponding standard deviation values. Superscripts with different letters for wind velocity denote identical groups of the average wind velocity for each inclination of the wind barrier (90°, 80°, and 70°) classified using Duncan analysis (significant at p < 0.05).
Table 3. Case C—average wind velocity at 50% porosity and three different inclinations of wind barriers (90°, 80°, and 70°) for every measuring point.
Porosity (%)Inclination (°)Distance (cm)Height (m)Velocity (m/s)Wind Reduction Ratio (%)
50%90°−10 (C)30, 60, 905.000 ± 0.000 d0
5030, 60, 901.336 ± 0.209 bc73
10030, 60, 901.151 ± 0.015 abc77
20030, 60, 900.673 ± 0.306 a87
30030, 60, 900.675 ± 0.429 a87
40030, 60, 900.831 ± 0.666 ab83
50030, 60, 901.224 ± 0.466 abc76
60030, 60, 901.469 ± 0.611 c71
80°−10 (C)30, 60, 905.000 ± 0.000 c0
5030, 60, 901.568 ± 0.070 b69
10030, 60, 901.208 ± 0.059 ab76
20030, 60, 900.678 ± 0.316 a86
30030, 60, 900.768 ± 0.316 a85
40030, 60, 900.773 ± 0.372 a85
50030, 60, 901.036 ± 0.618 ab79
60030, 60, 901.315 ± 0.661 ab74
70°−10 (C)30, 60, 905.000 ± 0.000 d0
5030, 60, 901.735 ± 0.614 c65
10030, 60, 901.395 ± 0.160 c72
20030, 60, 900.710 ± 0.339 ab86
30030, 60, 900.613 ± 0.306 a88
40030, 60, 900.628 ± 0.432 a87
50030, 60, 900.749 ± 0.397 ab85
60030, 60, 901.325 ± 0.682 bc74
(C) represents the windward control point of wind speed. Wind velocity (m/s) is given with corresponding standard deviation values. Superscripts with different letters for wind velocity denote identical groups of the average wind velocity for each inclination of the wind barrier (90°, 80°, and 70°) classified using Duncan analysis (significant at p < 0.05).
Disclaimer/Publisher’s Note: The statements, opinions and data contained in all publications are solely those of the individual author(s) and contributor(s) and not of MDPI and/or the editor(s). MDPI and/or the editor(s) disclaim responsibility for any injury to people or property resulting from any ideas, methods, instructions or products referred to in the content.

