Abstract
Screw assemblies of radar are characterized by numerous densely distributed small screws of various types, rendering their manual assembly difficult and inefficient. To improve the assembly quality and efficiency, an automatic assembly system was developed. First, the position and attitude relationships among the workpiece, camera, and base coordinate systems of the manipulator were obtained using three-point location and nine-point calibration methods. Second, a visual servoing strategy is designed for guiding the manipulator such that its position can be adjusted adaptively to achieve the high-precision positioning of threaded holes. Third, a method for evaluating assembly quality is developed. The templates of angle–torque curves of various screws were produced by fitting experimental data. Furthermore, the assembly quality was determined by calculating the similarity between the angle–torque curves and templates based on the Fréchet distance. Finally, the feasibility was verified using a flat plate component with five threaded holes.
1. Introduction
The performance of complex electronic devices such as radar is affected by many factors, such as the material ratio of components and assembly accuracy [1], of which assembly accuracy is a very important aspect. Radar requires many screws to fix high-precision structural parts. The screws are small, densely distributed, and of various types [2]. As a result, the manual assembly of screws is inefficient. For automatic assembly equipment, a small screw assembly requires high positioning accuracy. Otherwise, screw assembly failure can easily result in damaged surface parts and missing screws, negatively affecting product quality. In view of the foregoing, the automatic assembly of small screws is not currently popular [3]. Accordingly, the investigation of automatic assembly equipment for dense small screws is necessary.
Currently, the key steps in automatic screw assembly are screw hole positioning and screw tightening [4]. Most factories rely only on drawings to obtain the position information of threaded holes and control mechanisms to identify the corresponding positions for screw assembly. For example, Matsuno et al. [5] designed a six-revolute (6R) manipulator screw operation system that relied on the self-positioning capability of a manipulator to locate a threaded hole. The manipulator is controlled by an additional force sensor such that it is flexible in the workpiece plane and can be used to adjust the screw position. However, owing to the inherent structural errors of the manipulator, its absolute positioning accuracy may be as high as several millimeters [6]. Moreover, the actual workpiece coordinate system typically has errors; hence, it is not an ideal workpiece coordinate system. Therefore, the sole reliance on the self-alignment of the manipulator does not ensure that the screw is correctly placed in the threaded hole, causing the screw to destroy the surface of the assembled part.
To improve the positioning accuracy of threaded holes, visual measurement technology has been introduced to modify their position information. After moving the industrial camera over the threaded holes according to the drawing information, a more accurate position can be obtained by visually measuring the screw assembly [7,8]. He et al. developed a threaded hole recognition and positioning technology based on machine vision technology. It located the holes based on edge detection and Hough transformation as well as measured the coordinates of thread holes for guiding the manipulator to complete the assembly [9]. Pitipong et al. designed an automatic locking system for a manipulator with four degrees of freedom. The position and attitude errors of the screws were monitored in real time based on fuzzy control and visual servo feedback strategy [10]. Albert et al. used machine vision for guiding SCARA robots to locate threaded holes such that these machines could be applied to the automated production line of microscrews [11].
In actual assembly processes, the screw assembly may fail or be disqualified because of the measurement and motion errors of the manipulator; accordingly, determining the assembly quality of screws is critical. Currently, teaching methods are commonly used in the industry. This method assumes that each screw has a unique angle–torque curve during assembly and that the fault is typically a deviation from the correct curve [12]. This method compares the real-time torque curve with the characteristic torque curve during assembly. If the screw assembly characteristic curve follows the set track and stops within the final threshold area, then the screw assembly is considered successful [13]. Although this method is easy to implement and typically reliable, it has insufficient flexibility and setting the corresponding characteristic torque is time consuming. Moreover, because only the threshold for important nodes is set, the trend of curve changes between two nodes is ignored, easily leading to misjudgment [14]. Neural network models are frequently used for screw assembly quality prediction. Li et al. determined the key parameters related to screw assembly using an analytic hierarchy process. They also analyzed the pre-tension model of the screw using support vector regression. Accordingly, the prediction of assembly quality and determination of key parameters have been realized [15]. Meiners applied machine learning to bolt assembly angle–torque curve analysis as well as detected the classified errors during assembly [14]. Chen et al. collected the muscle and torque signals during screw assembly and processed the collected data using a multi-segment parallel convolution neural network to realize screw assembly quality prediction [16].
Nevertheless, several problems in assembling dense small screws persist and have not yet been resolved by research.
(1) The existing visual-based threaded hole positioning methods pose certain risks in the assembly of dense small screws. The main reason is that due to the complex structure of the manipulator, absolute positioning accuracy is difficult to ensure. On the other hand, high-precision manipulators are costly, making them unsuitable for widespread use in ordinary factories. When the manipulator moves over the threaded holes in the longitudinal direction, it is affected by the accumulation of absolute positioning errors. In particular, this is because the distance between two threaded holes is extremely small. Moreover, the target threaded holes may not be in the center view of the camera, leading to positioning errors; consequently, some screws may not be installed. As shown in Figure 1, when locating threaded hole 1 in Step 1, the camera center is closer to threaded hole 2 because of the motion error of the manipulator. Thus, threaded hole 2 is misjudged as the target threaded hole. As the assembly task progresses, in Step 3, a screw is installed in hole 6. However, because threaded hole 1 is outside the camera view, a screw is not threaded into this hole.
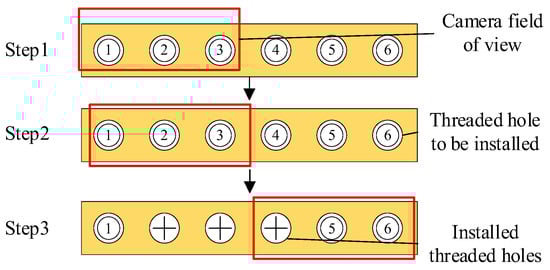
Figure 1.
Missing installation of threaded holes due to motion error of manipulator.
(2) Angle–torque curves are typically used to determine the screw assembly quality. Teaching methods considerably rely on human experience in artificially setting thresholds. Moreover, the range of torque fluctuations of the screw varies and can easily lead to misjudgment owing to different work scenarios and screw types. In addition, if a method based on neural networks is adopted, a large number of experiments need to be conducted to gather sufficient data to support the training of the neural network [17,18], which will delay the time to deployment.
To complete the assembly of dense small screws on flat panel parts, an automatic assembly system for small screws was developed in this study. The system uses industrial cameras, a laser distance measurer, a torque sensor, and a motor encoder to fabricate a 6R series manipulator. The fabricated equipment has multi-source status sensing capabilities, such as detecting image, distance, torque, and angle, to improve the screw assembly quality. The main contributions of this study are as follows.
- (1)
- The position and attitude relationship between the workpiece and basic coordinate systems of the manipulator is obtained using a three-point positioning method with a laser distance measurer. The affine transformation relationship between the pixel and workpiece coordinate system is obtained using a nine-point calibration method, laying a foundation for automatic screw assembly.
- (2)
- A visual servo-positioning method has been designed. Firstly, the workpiece is divided into several sub-areas according to the size of the camera’s field of view. When the manipulator moves to the center of a sub-area, a photo is taken, and the threaded holes in each sub-area are identified. Secondly, the industrial camera roughly measures the pixel distance between each threaded hole and the center of the area. By calculating the physical distance, it guides the manipulator to move the camera over the threaded hole to be installed, where further precise positioning is carried out through the industrial camera.
- (3)
- A screw assembly quality assessment system was developed. Experiments show that the angle–torque curves of the same type of assembly errors exhibit similar trends. Therefore, the corresponding template curve was fitted using a polynomial, and the screw assembly quality was determined by comparing the screw tightening curve with various assembly template curves based on the Fréchet distance.
In the scheme presented in this paper, existing issues can be specifically addressed. Firstly, the visual servo method can resolve the problem of poor absolute positioning accuracy of the manipulator. Traditional methods require the target threaded hole to be in the center of the camera’s field of view after the manipulator’s long-distance movement, a requirement hard to achieve due to the manipulator’s absolute positioning accuracy. However, servo-positioning only needs to ensure that the camera’s field of view covers the workpiece area. Then, through multiple short-distance movements, the target threaded hole can be approached gradually, allowing the manipulator to complete the task with ease. Secondly, taking advantage of the similarity in the shape of the angle–torque curves of the same type, we designed an assembly quality assessment method based on the Fréchet distance. This approach no longer depends on manually setting thresholds or training with large amounts of experimental data. Its principle is easy to understand, making it more suitable for widespread adoption in factories.
The structure of this paper is as follows. The introduction describes the research background, current situation, and purpose. Section 2 introduces the automatic screw assembly method in detail, including the main process, definition of the key coordinate system, the servo-positioning strategy, and the screw assembly quality assessment method. Section 3 discusses the prototype experiments and presents the analysis of experimental results to verify the validity of the method. Finally, Section 4 summarizes the conclusions. It also reviews the research content and findings as well as proposes future research directions.
2. Methods
2.1. Main Process of Automatic Screw Assembly
To realize the automatic assembly of screws, a 6R manipulator is used to conduct the research. A screw-locking device with an industrial camera, a laser distance measurer, a torque sensor, and a motor encoder is mounted, as shown in Figure 2.
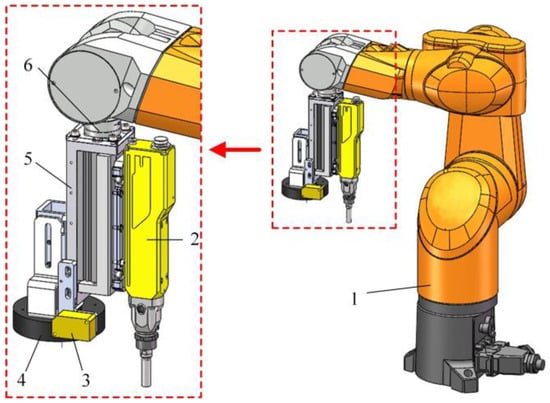
Figure 2.
Mechanism design of screw assembly equipment. (1, 6-DOF industrial manipulator; 2, screw-locking device; 3, laser distance measurer; 4, industrial cameras and light sources; 5, sliding track; 6, flange plate.)
Industrial cameras were placed on the fixture using the eye-in-hand method. The cameras together with the manipulator approached the target during the positioning of the threaded holes. The laser distance measurer determines the distance between the end of the manipulator and the surface of the workpiece in the same direction as the axis of the flange at the end of the manipulator. The screw-locking device was mounted on a sliding platform and driven up and down by a cylinder. When tightening is performed, the manipulator is in a stationary state, and its distance to the working plane remains fixed. The screw-locking device moves back and forth with high precision along the sliding platform and holds the screw for tightening.
The automatic assembly process for screws is shown in Figure 3. First, the workpiece coordinate system is determined using the three-point positioning method with the support of a laser distance measurer. Second, the workpiece is divided into several sub-areas to ensure that all threaded holes can be captured when the camera moves to the center of the sub-area. Then, a servo-positioning strategy is implemented to achieve the accurate positioning of each threaded hole. Subsequently, the screw-locking device installs the screw. Finally, the screw assembly quality is assessed.
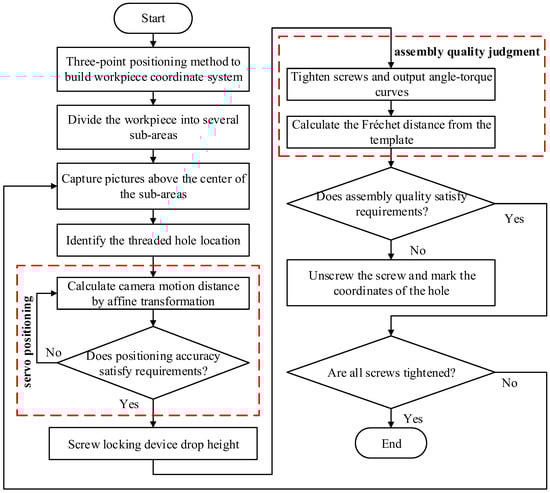
Figure 3.
Automatic assembly process of screws.
2.2. Definition of Coordinate System
In this section, the key coordinate systems necessary for the automatic assembly of screws are defined. These systems include the basic coordinate system, {B}, of the manipulator, flange coordinate system, {f}, camera coordinate system, {C}, pixel coordinate system, {p}, and workpiece coordinate system, {F}. The three-point positioning method and nine-point calibration method were employed to determine the relationships between {F} and {B} and between {F} and {p}.
2.2.1. The Three-Point Positioning Method to Determine the Relationship between {F} and {B}
The three-point positioning method was used to establish {F} [19]. First, the industrial manipulator carries the laser distance measurer to position points a, b, and c on the workpiece. As shown in Figure 4, points a and b are two points on one side of the working plane; generally, two points on one side of the workpiece are considered. Point c is a point on the working plane located as far as possible from points a and b. By adjusting the manipulator, the reading of the laser distance measurer at the three positions becomes consistent.
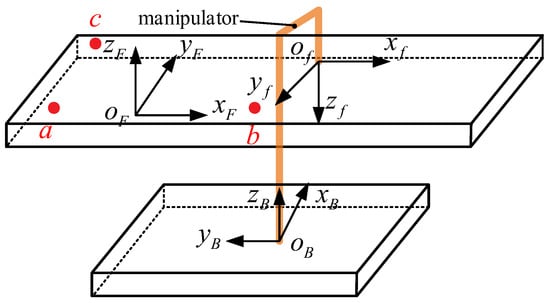
Figure 4.
Establishment of {F} based on the three-point positioning method.
Point a is the origin of {F}, and is the direction vector of the X axis of {F}. The coordinates of points a, b, and c are set as ,, and , respectively. Starting from point a, direction vectors and are established and obtained by Equation (1):
The direction vector, , is obtained by cross-multiplying direction vectors and , as shown in Equation (2):
The direction vector, , is obtained by cross-multiplying direction vectors and , as given in Equation (3):
The attitude relationship, , of {F} relative to the base coordinate system, {B}, can be obtained by converting direction vectors , , and into unit vectors, as given by Equation (4):
2.2.2. Calibration of Vision Systems Based on Nine-Point Calibration
An industrial camera collects the image information of the workpiece, and the pixel coordinates of the key points can be obtained through image processing. However, the pixel coordinates cannot be directly used to guide the movement of the manipulator. Thus, they must be calibrated and transformed into {F} coordinates to guide the camera’s movement. Therefore, the nine-point calibration method is used to solve the position and attitude relationship between {p} and {F}.
The solution process mainly involves the basic ({B}), flange ({f}), camera ({C}), pixel ({p}), and workpiece ({F}) coordinate systems, as shown in Figure 5. The pose of the camera center in {B} is described by {C}; the optical axis of the camera is the Z axis. Moreover, {p} is a two-dimensional coordinate system that describes the projection of three-dimensional space objects onto the image plane.
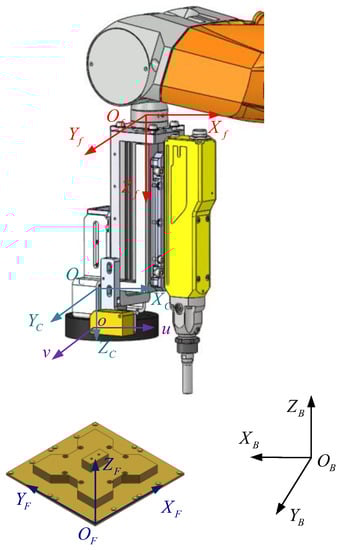
Figure 5.
Coordinate system of manipulator.
The Zf axis of {f} is perpendicular to the {F} plane. The optical axis of the camera is set parallel to the Zf axis of the flange (i.e., the camera optical axis is perpendicular to the workpiece surface) through fixture design. This means that the pixel coordinate system is parallel to the workpiece surface.
Because the manipulator carries the camera and screw-locking device to perform movement at the same height relative to {F} at a fixed attitude, considering the axis is unnecessary for {F}. Thus, the problem is simplified to solving the corresponding relationship between the target pixel set of the plane image and coordinate point set of the manipulator in {F}. The pixel points, , in the image can be transformed into points in {F} through two-dimensional affine transformation.
In two-dimensional affine transformation, when a figure on one plane is translated to another, the parallel lines remain parallel before and after the translation. Each affine transformation can be represented by a combination of translation, rotation, shearing, and scaling [20]. The composition of the two-dimensional homogeneous affine matrix is given by Equation (5):
where
- is the scaling of the X axis of the original coordinate during the conversion;
- is the scaling of the Y axis of the original coordinate during the conversion;
- is the shear coefficient of the transformed coordinate system;
- is the rotation angle around the origin of the coordinate system;
- is the translation distance in the X axis direction of two coordinate systems;
- is the translation distance in the Y axis direction of two coordinate systems.
The affine transformation between the pixel and workpiece coordinate systems is represented by a two-dimensional homogeneous transformation matrix obtained from Equation (6):
where
- u is the abscissa of {p};
- v is the vertical coordinate of {p};
- x is the abscissa of {F}; and
- y is the vertical coordinate of {F}.
Calculating the affine matrix requires at least three sets of corresponding image pixels and camera coordinates in {F}. To improve the calibration accuracy, nine datasets are generally used. This operation is overdetermined, the resulting affine matrix minimizes the distance between the input and transformed point sets, as given by Equation (7):
where is the affine matrix. As shown in Figure 6, the manipulator reaches nine positions to capture pictures and record the position where the origin of {f} is in {F}.
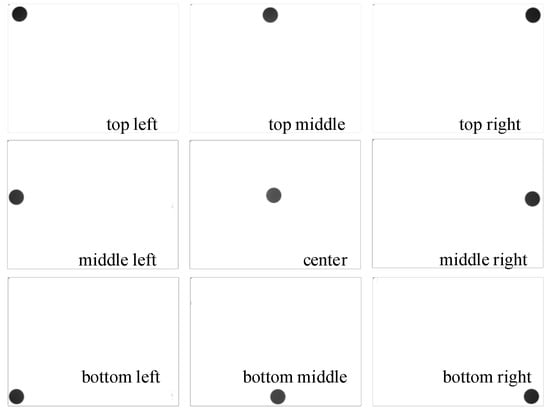
Figure 6.
Data acquisition position of nine-point calibration.
Subsequently, the nine collected images were processed, and the edge-detection method was used to extract the center coordinates of the marked points. This process is shown in Figure 7.
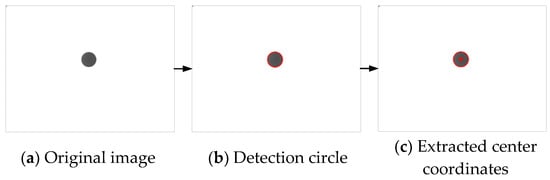
Figure 7.
Image processing for extracting center coordinates.

Table 1.
Coordinates of nine points in {p} and {B}.
The affine transformation matrix of the pixel and workpiece coordinate systems is obtained from Table 1 and Equation (7); it is given by Equation (8):
2.3. The Visual Servo-Positioning Strategy
In the screw assembly process, the precise measurement of the central coordinates is necessary to ensure that the screw can be accurately assembled to avoid damage to the threaded hole. However, for some countersunk threaded holes, imaging may be irregular owing to the shielding of the upper cover plate and the lighting effect of the light source equipment. This can considerably affect the diameter and center coordinate measurement accuracies of the threaded holes. The threaded holes in the center of the image are not affected, as shown in Figure 8 and Figure 9. Accordingly, a visual servo-positioning strategy was developed. By repeatedly moving the camera until the threaded hole becomes the image center, the accuracy of feature extraction can be improved.
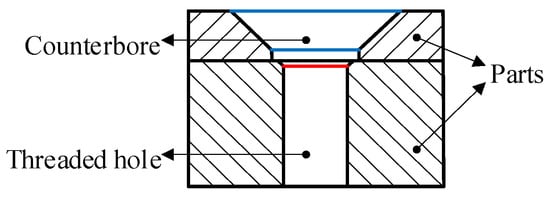
Figure 8.
Schematic of countersunk screw connection.
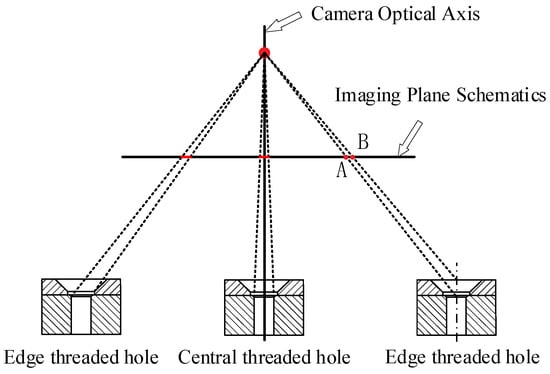
Figure 9.
Schematic of threaded hole imaging.
In this section, the displacement of the camera in {p} is first converted into displacement in {F}. Second, the specific process of the visual servo-positioning strategy is introduced.
2.3.1. Camera Displacement in {F}
In Equation (6), is the coordinate of the origin of {p} in {F} when finding the optimal solution of the nine-point calibration. If the camera is fixed here, its coordinate information in {F} can be calibrated by solving the pixel coordinate of the center of the threaded hole in the image. However, in practical applications, the camera is not fixed in this position; instead, it moves with the robot. Accordingly, also changes. Therefore, a reference coordinate system, , shown in Figure 10 is established on the plane of {F}. The coordinate of the origin in {F} is , and the coordinate system moves with the camera.
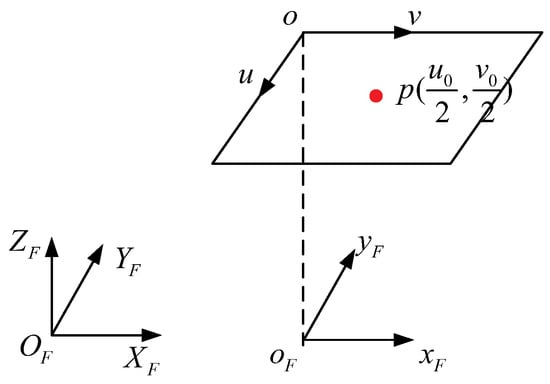
Figure 10.
Establishment of reference coordinate system.
At this time, the relationship between the reference coordinate system and {p} is given by Equation (9):
After image processing, if the distance moved by the camera in {p} is , then that in {F} is , which is obtained by Equation (10):
2.3.2. The Servo-Positioning Strategy
First, the photograph of the sub-area is divided according to the camera’s field of vision and workpiece size. Then, the manipulator is guided to capture pictures above the center of each area alternately. To ensure that all the threaded holes in each sub-area are within the camera’s field of vision, each sub-area is allowed to overlap to some extent, as shown in Figure 11, A–D are examples of sub-areas.
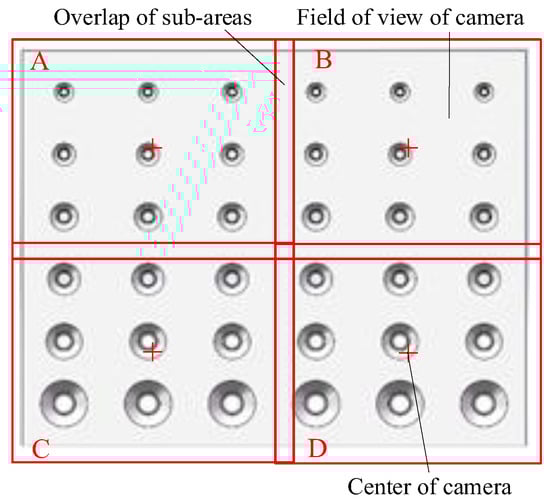
Figure 11.
Schematic of photographed sub-areas of workpiece.
After obtaining the threaded hole information from the image, a rectangular frame was used to approximate the hole’s position. Moreover, the assembly sequence was given. As shown in Figure 12, “+” is the image center, and “×” is at the center of the red rectangle. Approximate positioning is performed according to the rectangular central coordinate information, and the distance between the image center and target threaded hole is calculated. This process is called the approximate positioning of threaded holes. The purpose is to move the screws that must be assembled near the center of the camera’s field of view (i.e., move the camera from “+” to “×” to prepare for precise positioning).
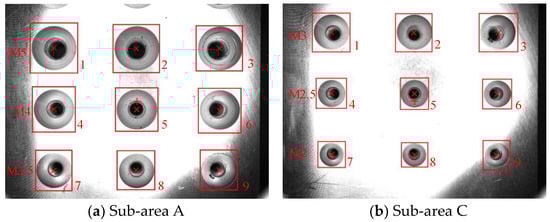
Figure 12.
Approximate positioning of threaded holes.
After approximate positioning, the center of the threaded hole appears near the image center. The sources of positioning errors are due to the (1) influence of the filming angle (a small gap exists between the actual and measuring positions of the center of the threaded hole) and the (2) absolute positioning error of the manipulator. However, owing to the small measurement error and short-range motion of the manipulator, the positioning error is negligible. The use of a suitable industrial camera and manipulator ensures that the positioning error is less than the screw radius. When the threaded hole closest to the image center is used as the hole for screw assembly, the correct threaded hole can be found.
At this point, the center of the threaded hole is precisely positioned, as shown in Figure 13. The distance between the center pixel coordinate of the threaded hole and that of the image is gradually reduced by several iterations until the error becomes less than visual positioning accuracy. This ensures that the screw can be precisely installed to prevent damage to the threaded hole. The number of specific iterations is related to the absolute positioning accuracy of the manipulator. The higher the absolute positioning accuracy, the fewer the iterations.
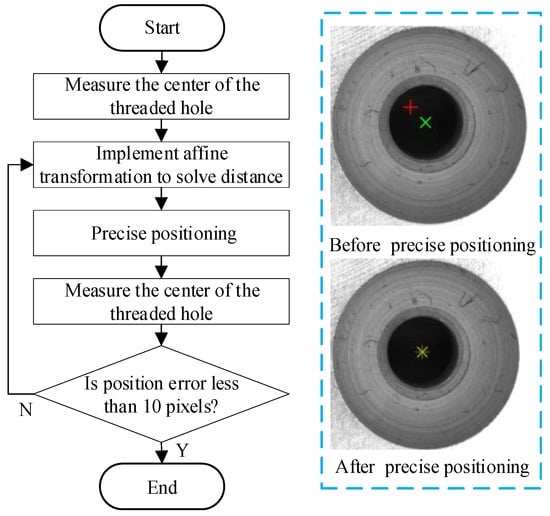
Figure 13.
Precise positioning process using visual servo.
2.4. Screw Assembly Quality Assessment
To ensure the reliability of the automatic screw assembly system, a screw-locking device with a torque sensor and motor encoder was used to determine the angle–torque curve of each screw type. After assembly, the screw assembly quality was analyzed and assessed using the angle–torque curve. This section first presents the analysis of the possible angle–torque curves that may exist. Then, a screw assembly quality assessment algorithm is presented. The angle–torque curve template was fitted according to the experimental data under various screw assembly conditions. Moreover, the similarity between the actual angle–torque curve and the template was calculated using the Fréchet distance to determine the quality of the screw assembly.
2.4.1. Screw Assembly Analysis
A common assembly defect of this system is that the large location error of the threaded holes causes cross-threading, which occurs in the initial thread-matching stage, as shown in Figure 14. When the positioning error is large, the screw can still be placed in the threaded hole because its diameter is slightly larger than that of the screw. However, the axis of the screw-locking device is at position A, and the screw is limited by the threaded hole such that the axis is deflected, causing the thread to cross. During the tightening process, the screw is subjected to considerable friction, resulting in a high friction torque at the beginning of tightening. The torque reaches a specified value in advance, whereas the preload does not satisfy the requirements, resulting in “false tightening”. The angle–torque curve during assembly is shown in Figure 15.
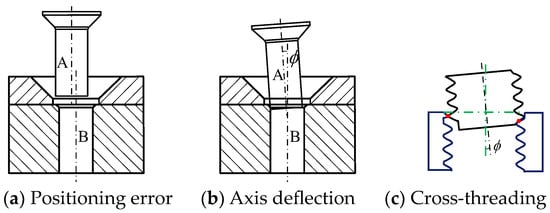
Figure 14.
Cross-threading due to positioning error.
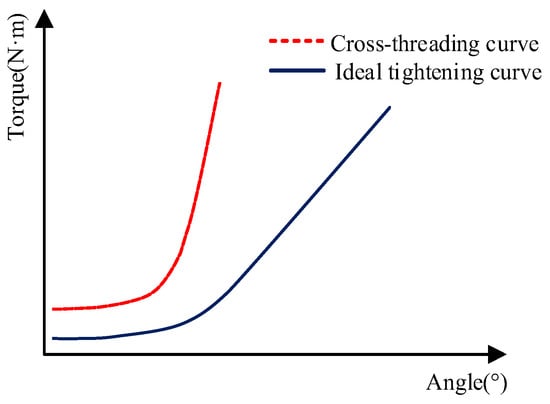
Figure 15.
Typical angle–torque curve.
As shown in Figure 15, the cross-threaded screws have distinct characteristics at the initial stage of tightening with large and fluctuating torques. The overall torque is greater than the ideal tightening torque and reaches the predetermined torque in advance. For ideally tightened screws, when the head of the screw does not come into contact with the connecting piece, the torque overcomes the friction moment between the threaded pair. At this stage, the torque curve small with no evident changing trend. When the screw head comes into contact with the connected piece, the torque sharply increases, and the screw is successfully locked.
2.4.2. Screw Assembly Quality Assessment
The process of the screw assembly assessment method is shown in Figure 16. First, the actual angle–torque curve is obtained by the torque sensor and motor encoder. The Fréchet distance between the curve and each template is then calculated to determine similarity. Subsequently, the assembly quality of the screw is assessed.
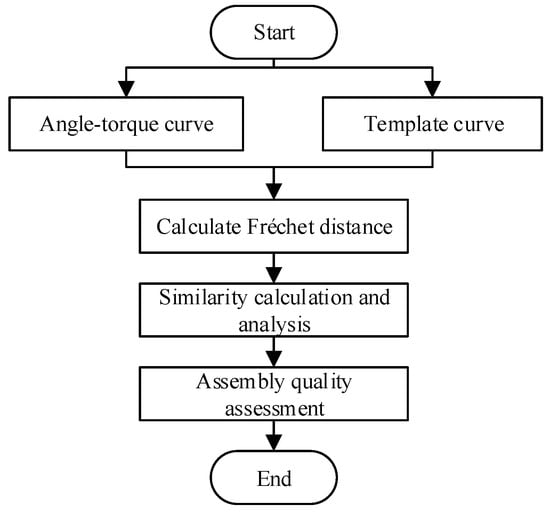
Figure 16.
Assessment process of screw assembly quality.
Through experiments, several angle–torque curves can be obtained during screw assembly. The curve representing a satisfactory screw assembly is selected as the reference curve, and point (xi, yi) on multiple reference curves is fitted by a polynomial given by Equation (11):
Solving the n + 1 best-fit coefficients, a0–an, in the polynomial of degree n is necessary. The square sum of the residuals was used as the error function to determine the fitting effect. The smaller the square sum of the residuals, the better the fitting effect. The abscissa, xi, of the sample is inserted into the fitted polynomial, , to obtain the new ordinate, . The sum of the squares of residuals is obtained by Equation (12):
The least squares method is applied to solve the group and minimize the sum of the squares of residuals (i.e., the polynomial). After the calculation, the fitting curve shown in Figure 17 is obtained; the curve is the template for the successful assembly of screws.
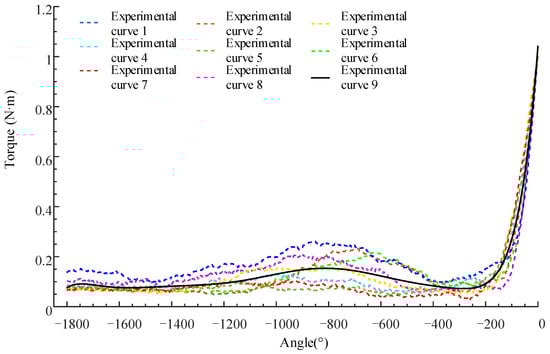
Figure 17.
Angle–torque curve of successfully assembled screws.
Definition 1.
where
Let a curve be a continuous mapping of :[, ] → V, among , where (V,) is a metric space. Then, two curves can be formed: :[,] → V and :[,] → V. The Fréchet distance between the two curves is defined by Equation (13) [21]:
- is any continuous non-decreasing function from [0, 1] to [, ],
- is any continuous non-decreasing function from [0, 1] to [, ].
If the angle–torque curve to be identified is L1 and the curve template for successful screw assembly is L2, then the calculation process of the Fréchet distance between L1 and L2 is as follows.
- (1)
- Discretize L1 into m points, as follows:
- (2)
- Similarly, discretize L2 into n points as follows:
- (3)
- Calculate the Euclidean distance from each point on curve P to each point on curve Q (expressed by distance matrix D):
- (4)
- Create a matrix, F, whose element values are given by Equation (17):
The element value in the lower right corner of matrix is the Fréchet distance between curves L1 and L2. The Fréchet distance is inversely proportional to similarity. The smaller the Fréchet distance, the greater the similarity.
2.4.3. The Feasibility of the Assessment Algorithm
After numerous tests, the angle–torque curve of failure in the process of thread assembly was obtained. Consider the angle–torque curve of an assembly failure as an example (Figure 18). The feasibility of applying the Fréchet distance to assess the assembly quality of screws is expounded.
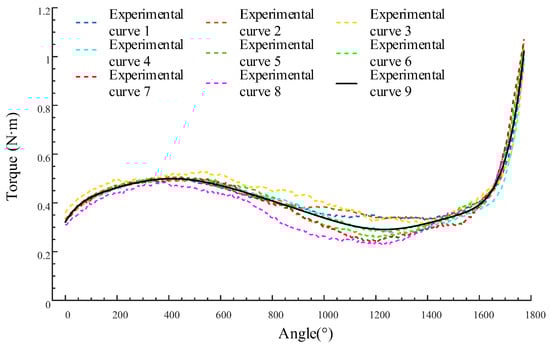
Figure 18.
Angle–torque curve of failure of assembled screw.
As shown in Figure 19, the black solid line represents the Fréchet distance between the eight experimental curves in Figure 18 and the successful assembly template curve, while the red dashed line represents the Fréchet distance between the experimental curves and the failed assembly template curve. It can be seen that there is a significant difference between the Fréchet distances of successful and failed assemblies, which prevents confusion. Therefore, the Fréchet distance can be used for judgment.
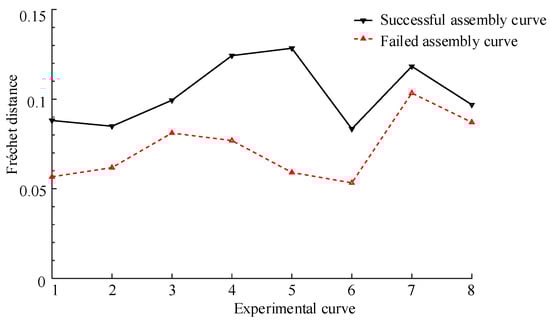
Figure 19.
Fréchet distance between experimental and template curves.
3. Experiment
In this study, a specialized experimental platform was constructed to carry out the necessary investigations, as illustrated in Figure 20. The essential equipment procured and their respective characteristics are detailed as follows:
- Robotic Arm: Repeated positioning accuracy of 0.02 mm and maximum payload capacity of 9 kg.
- CMOS Camera: 10 million pixels, resolution of 3664 × 2748, pixel size of 1.67 μm, and frame rate of 8 FPS.
- Laser Displacement Sensor: Accuracy of 0.07 mm.
- Aluminum Experimental Board: Dimensions of 500 × 200 mm, with threaded holes ranging from M2–M5 sizes uniformly distributed.
The practicality and applicability of the proposed methodology were substantiated via a successful assembly of screws on the aforementioned experimental board, as demonstrated in Figure 21.
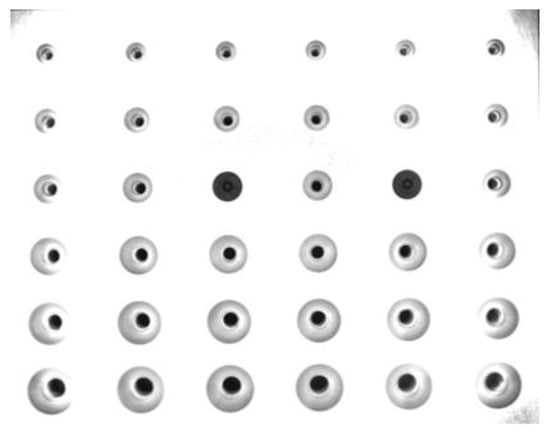
Figure 21.
Test plate assembly.
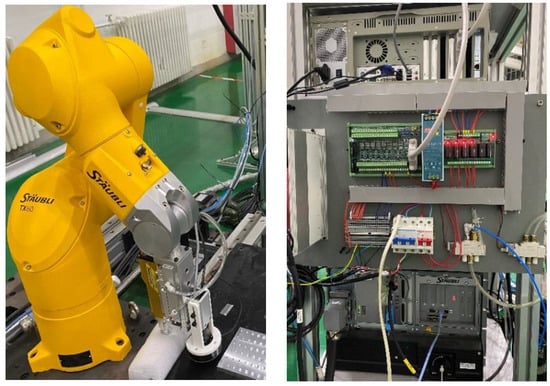
Figure 20.
Automatic screw assembly experimental platform.
First, the camera is positioned above the parts to be assembled and it captures images and identifies the threaded holes. Subsequently, the affine transformation matrix is applied to calculate the displacement (unit: mm) of the camera in the workpiece coordinate system, as shown in Figure 22.
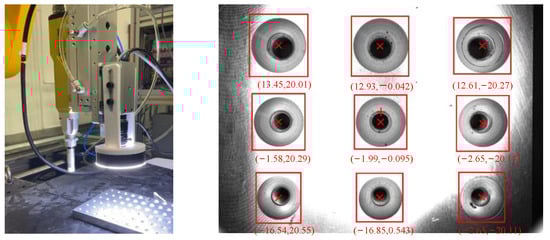
Figure 22.
Identification and positioning of threaded holes.
Approximate positioning is implemented according to the solution distance. After completing the movement of the manipulator, photographs are captured to measure the diameter of the threaded hole. According to the measurement results, the screws are suctioned by the screw-arranging machine. Then, the screws are set for precise positioning, as shown in Figure 23.
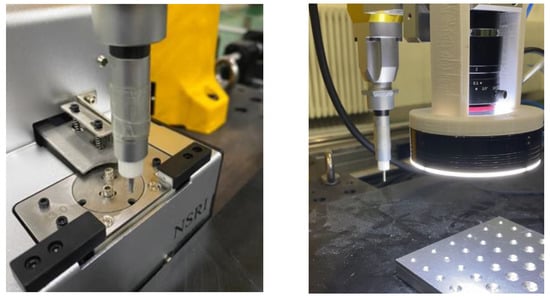
Figure 23.
Precise positioning after screw suction.
When precise positioning is achieved, the control system sends a signal to guide the offset movement of the manipulator. After the movement is completed, the sliding table cylinder is extended, the screw is aligned with the threaded hole, and the screw-locking device performs the assembly action, as shown in Figure 24.
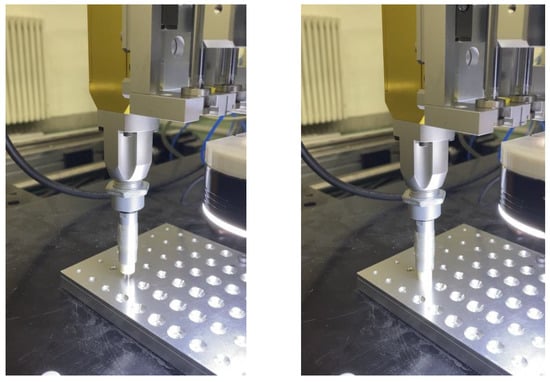
Figure 24.
Screw assembly.
After installing a screw, the assembly quality assessment method is implemented to determine whether the screw was successfully locked. If locking is successful, the assembly of the next screw is initiated; otherwise, the screw-locking device reverses the installation of the screw to mark the coordinates of the threaded hole.
The experimental results are shown in Figure 25. The system can achieve high-precision positioning and assembly for the M2, M3, M3.5, M4, and M5 screws.
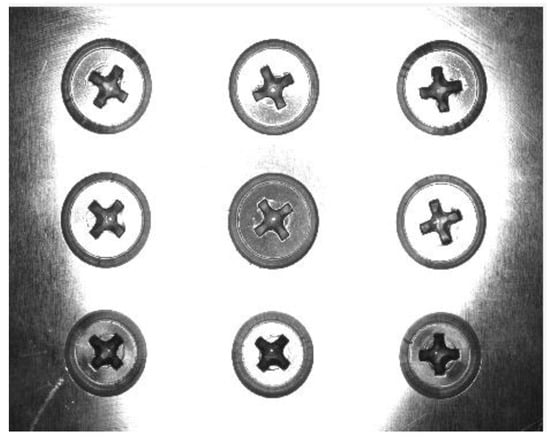
Figure 25.
Assembly effect of countersunk screws.
The accuracy of visual positioning is shown in Figure 26. Generally, a visual positioning accuracy of less than 0.05 mm can be achieved after two precise positioning maneuvers, thus satisfying the requirements.
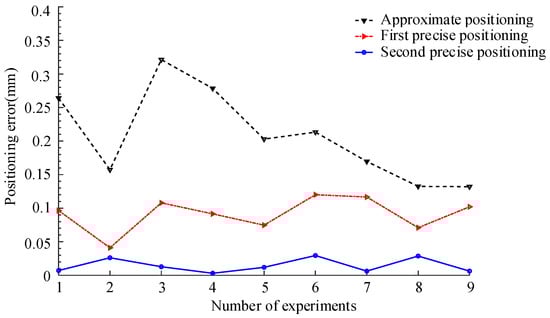
Figure 26.
Visual positioning accuracy.
4. Conclusions
The mounting plates of electronic equipment, such as radar, require numerous screws to fix various sensors. The screw assembly is characterized by various types of densely distributed small screws. A small screw automatic assembly system was developed to improve the assembly quality and efficiency. The mechanical system adopts a 6R series manipulator equipped with an industrial camera, a laser distance measurer, a torque sensor, and a motor encoder. The system can sense multi-source states, such as image, distance, torque, and angle. First, the position and orientation relationships of the workpiece, pixel, and base coordinate systems are obtained using the three-point positioning method and nine-point calibration method, establishing the foundation for automatic screw assembly. Second, a servo-positioning strategy is designed to locate the threaded hole accurately, and a method for assessing the assembly quality of screws is developed. The angle–torque curves of various small screws are obtained through experiments, and a template is constructed by polynomial fitting. The similarity between the angle–torque curve and template is calculated based on the Fréchet distance to determine the assembly quality of the screws. The feasibility of the method is verified by considering a flat plate part with five sizes of threaded holes as an example. Results show that the system can achieve high-precision positioning and assembly for the M2, M3, M3.5, M4, and M5 screws.
The system developed in this paper realizes automatic screw assembly and can be applied to most industrial scenarios, especially performing excellently in the assembly of dense small screws for electronic devices such as radar installation boards. However, it should be noted that during screw installation, despite successful assembly, minor errors may slightly shift the installation board from its original position. When the error accumulates to a certain extent, it may prevent hole alignment and thus assembly. Therefore, the installation board requires fixture fixation.
In future work, we will design optimization strategies for screw assembly sequences, enabling the installation board to undergo automated assembly without the need for fixture fixation.
Author Contributions
Conceptualization, R.W.; methodology, R.W. and X.G.; software, X.G.; validation, X.G. and S.L.; formal analysis, R.W.; investigation, R.W.; resources, R.W.; data curation, S.L.; writing—original draft preparation, X.G.; writing—review and editing, R.W.; visualization, X.G. and S.L.; supervision, R.W.; project administration, R.W.; funding acquisition, R.W. All authors have read and agreed to the published version of the manuscript.
Funding
This work was supported by the National Natural Science Foundation of China (51975157).
Institutional Review Board Statement
Not applicable.
Informed Consent Statement
Not applicable.
Data Availability Statement
All necessary data relevant to the study are included within the manuscript.
Conflicts of Interest
The authors declare no conflict of interest.
References
- Kiarasi, F.; Babaei, M.; Omidi Bidgoli, M.; Reza Kashyzadeh, K.; Asemi, K. Mechanical characterization and creep strengthening of AZ91 magnesium alloy by addition of yttrium oxide nanoparticles. Proc. Inst. Mech. Eng. Part L J. Mater. Des. Appl. 2022, 236, 1489–1500. [Google Scholar] [CrossRef]
- Tian, C.; Jia, P.; Yuan, J.; Teng, B. Application of integrated manufacturing system of flexible production line in spacecraft manufacturing line. J. Phys. Conf. Ser. 2020, 1549, 032103. [Google Scholar] [CrossRef]
- Xu, J.; Zhang, C.; Liu, Z.; Pei, Y. A review on significant technologies related to the robot-guided intelligent bolt assembly under complex or uncertain working conditions. IEEE Access 2019, 7, 136752–136776. [Google Scholar] [CrossRef]
- Rusli, L.; Luscher, A. Fastener identification and assembly verification via machine vision. Assem. Autom. 2017, 38, 1–9. [Google Scholar] [CrossRef]
- Matsuno, T.; Huang, J.; Fukuda, T. Fault detection algorithm for external thread fastening by robotic manipulator using linear support vector machine classifier. In Proceedings of the IEEE International Conference on Robotics and Automation, Karlsruhe, Germany, 6–10 May 2013; Volume 10, pp. 3443–3450. [Google Scholar] [CrossRef]
- Wang, R.; Wu, A.; Chen, X.; Wang, J. A point and distance constraint based 6R robot calibration method through machine vision. Robot. Comput. Integr. Manuf. 2020, 65, 101959. [Google Scholar] [CrossRef]
- Jia, Z.; Bhatia, A.; Aronson, R.M.; Bourne, D.; Mason, T.M. A survey of automated threaded fastening. IEEE Trans. Autom. Sci. Eng. 2018, 16, 298–310. [Google Scholar] [CrossRef]
- Xu, J.; Liu, K.; Pei, Y.; Yang, C.; Cheng, Y.; Liu, Z. A Noncontact Control Strategy for Circular Peg-in-Hole Assembly Guided by the 6-DOF Robot Based on Hybrid Vision. IEEE Trans. Instrum. Meas. 2022, 71, 3509815. [Google Scholar] [CrossRef]
- He, H. Automatic Assembly of Bolts and Nuts Based on Machine Vision Recognition. J. Phys. Conf. Ser. 2021, 2113, 012033. [Google Scholar] [CrossRef]
- Pitipong, S.; Pornjit, P.; Watcharin, P. An automated four-DOF robot screw fastening using visual servo. In Proceedings of the 2010 IEEE/SICE International Symposium on System Integration, Sendai, Japan, 21–22 December 2010; Volume 4, pp. 379–383. [Google Scholar] [CrossRef]
- Hsue, A.W.J.; Tsai, C.F. Torque Controlled Mini-Screwdriver Station with A SCARA Robot and A Machine-Vision Guidance. In Proceedings of the 2020 International Symposium on Computer, Consumer and Control (IS3C), Taichung City, Taiwan, 13–16 November 2020; pp. 465–468. [Google Scholar] [CrossRef]
- Klingajay, M.; Seneviratne, L.D.; Althoefer, K. Identification of threaded fastening parameters using the newton raphson method. In Proceedings of the 2003 IEEE/RSJ International Conference on Intelligent Robots and Systems, Las Vegas, NV, USA, 27–31 October 2003; Volume 2, pp. 2055–2060. [Google Scholar] [CrossRef]
- Moreira, G.R.; Lahr, G.J.; Boaventura, T.; Savazzi, J.O.; Caurin, G.A. Online prediction of threading task failure using convolutional neural networks. In Proceedings of the 2018 IEEE/RSJ International Conference on Intelligent Robots and Systems (IROS), Madrid, Spain, 1–5 October 2018; pp. 2056–2061. [Google Scholar] [CrossRef]
- Meiners, M.; Mayr, A.; Franke, J. Process curve analysis with machine learning on the example of screw fastening and press-in processes. Procedia Cirp 2021, 97, 166–171. [Google Scholar] [CrossRef]
- Li, Y.; Zhang, F.P.; Yan, Y.; Zhou, J.; Li, Y. Multi-source uncertainty considered assembly process quality control based on surrogate model and information entropy. Struct. Multidiscip. Optim. 2019, 59, 1685–1701. [Google Scholar] [CrossRef]
- Chen, C.; Huang, K.; Li, D.; Zhao, Z.; Jun, H. Multi-segmentation parallel CNN model for estimating assembly torque using surface electromyography signals. Sensors 2020, 20, 4213. [Google Scholar] [CrossRef] [PubMed]
- Garg, A.; Aggarwal, P.; Aggarwal, Y.; Belarbi, M.O.; Chalak, H.D.; Tounsi, A.; Gulia, R. Machine learning models for predicting the compressive strength of concrete containing nano silica. Comput. Concr. 2022, 30, 33. [Google Scholar] [CrossRef]
- Garg, A.; Belarbi, M.O.; Tounsi, A.; Li, L.; Singh, A.; Mukhopadhyay, T. Predicting elemental stiffness matrix of FG nanoplates using Gaussian Process Regression based surrogate model in framework of layerwise model. Eng. Anal. Bound. Elem. 2022, 143, 779–795. [Google Scholar] [CrossRef]
- Chen, T.; Lin, J.; Wu, D.; Wu, H. Research of Calibration Method for Industrial Robot Based on Error Model of Position. Appl. Sci. 2021, 11, 1287. [Google Scholar] [CrossRef]
- Umble, R.N.; Han, Z. Transformational Plane Geometry; CRC Press: Boca Raton, FL, USA, 2014. [Google Scholar]
- Eiter, T.; Mannila, H. Computing Discrete Fréchet Distance; Technical Report CD-TR 94/64; CD-Laboratory for Expert Systems: Vienna, Austria, 1994. [Google Scholar]
Disclaimer/Publisher’s Note: The statements, opinions and data contained in all publications are solely those of the individual author(s) and contributor(s) and not of MDPI and/or the editor(s). MDPI and/or the editor(s) disclaim responsibility for any injury to people or property resulting from any ideas, methods, instructions or products referred to in the content. |
© 2023 by the authors. Licensee MDPI, Basel, Switzerland. This article is an open access article distributed under the terms and conditions of the Creative Commons Attribution (CC BY) license (https://creativecommons.org/licenses/by/4.0/).