Article

Application of Drone LiDAR Survey for Evaluation of a Long-Term Consolidation Settlement of Large Land Reclamation

1
Construction Department HL D&I Halla, Busan 51611, Republic of Korea
2
Interdisciplinary Major of Ocean Renewable Energy Engineering, Korea Maritime and Ocean University, Busan 49112, Republic of Korea
3
Department of Civil Engineering, Korea Maritime and Ocean University, Busan 49112, Republic of Korea
*
Author to whom correspondence should be addressed.
Appl. Sci. 2023, 13(14), 8277; https://doi.org/10.3390/app13148277
Submission received: 5 July 2023 / Revised: 17 July 2023 / Accepted: 17 July 2023 / Published: 17 July 2023
(This article belongs to the Section Civil Engineering)

Abstract

:
Drone surveys are gaining popularity for many construction applications, including in the fields of civil engineering, such as road construction, earthwork, structure monitoring, and coastal topography analysis. Drone surveying has a high potential for periodical long-term ground settlement measurement in the field of geotechnical engineering. Traditionally, manual measurement has been performed for limited points with controlled surface measurement points, but drone surveying may enable automated and periodical measurement for a wide and remote site. However, the accuracy of the elevation measurement and the surface settlement prediction has not been investigated, and the use of drone surveying has thus been limited. Therefore, an experiment was carried out to apply drone LiDAR (Light Detection and Ranging) surveying for soft ground settlement measurement at a large land reclamation site showing a very large settlement up to 10 m. Periodic drone LiDAR surveying was conducted, and the data were processed with direct georeferencing and with outlier removals (such as trees and construction vehicles) in order to generate a clean surface point cloud. We then compared the processed elevation data with ground control data to check the vertical accuracy and to predict the settlement as well as for consolidation. The drone LiDAR survey showed 13 cm, 42.9 cm, and 6.23% differences in RMSE (Root Mean Square Error) in terms of vertical accuracy, predicted long-term settlement, and consolidation, respectively. The drone LiDAR accuracy seems very useful for monitoring settlement over a large and remote land reclamation site of soft ground, showing settlement up to several meters where, without a surface measurement, installment is limited.

1. Introduction

The Korean government established a long-term roadmap in 2022 called S-construction 2030 for digital construction and automation in order to increase productivity and safety. The roadmap consists of 46 topics in 10 categories, including the expansion of BIM (Building Information Modeling), autonomous construction machines, OSC (Off-Site Construction), and smart devices. The goal is to transition the construction industry from traditional paper drawings and labor-intensive work to advanced technology-centered work that is digitalized and automated. The plan aims to increase the productivity and the quality of construction while also enhancing safety on site. To achieve this goal, the Korean government has set up 3 major tasks under 10 basic tasks and 46 detailed tasks. The plan includes the introduction of BIM for the digitalization of the construction industry.
The smart device includes drones for measurement and monitoring over the life cycle of construction and management. As drones gain popularity for construction management, many studies have been carried out to assess their accuracy and applicability over the last decade. Some of this literature is presented below. UAV (Unmanned Aerial Vehicle) data acquisition and processing has shown its value in the earthwork of large infrastructure projects [1]. Drones were used to improve workplace safety in construction [2,3]. Drones were proposed for cable monitoring, such as power lines, showing a few centimeters of accuracy [4]. A drone was used for construction progress monitoring by visualizing the created 3D model via color-coding the building elements [5]. The effect of distribution and the number of control points was studied on the achievable accuracy for the drone mapping of corridors, such as roads and pipelines [6]. The volume change of a landfill stock was calculated using drone photogrammetry in Malaysia, and its potential was confirmed [7]. UAV was tested for waste landfill settlement monitoring, and 10 cm accuracy was reported [8]. A model for construction error analysis of RC (Reinforced Concrete) pile foundation using a drone was proposed [9]. In the study, RC piles were detected using image processing, and the distance between the pile centers was computed. A thermal camera was used to monitor an urban landfill and its potential for detection of hazardous gas emissions [10]. A roughness analysis of paved roads was carried out using drone LiDAR and photogrammetry [11], reporting 6 and 7.2 cm vertical accuracy in RMSE, respectively. A study used UAV-LiDAR and MPS to obtain geometric parameters (such as road longitudinal profile and cross-slope) by using digital terrain model surfaces derived from the point cloud data [12]. A study was conducted on earthwork volume calculation, and vertical accuracy of 5.4 and 2.5 cm were reported for photogrammetry and LiDAR, respectively [13]. A standard work type was developed in Korea to utilize drones at expressway construction sites [14]. UAV was used for damage inspection of bridge infrastructures and the benefits of safety, cost sustainability, and repeatability, as well as the limitations of battery issues and the presence of obstacles were all discussed [15]. In the field of ground settlement measurement, drones have recently gained more interest for their ability to access remote and dangerous areas with accurate measurement sensors [8,16,17,18]. It is anticipated that multiple drones and fixed wing type drones should increase the applicability [19,20].
As listed above, drones are widely tested in many fields, such as road, landfill, and construction progress monitoring, but few studies have been carried out for long-term ground settlement measurement at soft ground near harbor facilities. Conventionally, the task was performed using manual surface settlements using engineering levels only for limited points. The drone surveying may offer an automated and more frequent measurement for the wide soft ground area, but the measurement accuracy has not been studied, and the use of drone surveying has thus been limited. Therefore, drone LiDAR surveying was tested for soft ground settlement monitoring at a land reclamation area near the harbor, and its accuracy and reliability were assessed. In particular, the experiment was carried out for a very wide land reclamation area with large settlements, showing up to 10 m that was not carried out before.
The paper is structured as follows: in Section 2, the methodology is described; the experimental results are presented in Section 3; and the discussion and conclusion are presented in Section 4 and Section 5.

2. Methodology

The flow of the study is described in Figure 1. The LiDAR system was used in the study because it can cover a large area in a short time to produce consistent results. With a drone, it is able to capture data in remote, unsafe, or difficult-to-access areas with lower safety risks, though the accuracy is highly dependent on the quality and calibration of the system’s scanner, INS (Inertial Navigation System), and GNSS (Global Navigation Satellite System) components, and it also requires skill to process the data and recognize inaccuracies.
The periodically acquired drone LiDAR data are preprocessed with direct georeferencing and outlier filtering for the surface point cloud. The processed point cloud is used for the elevation change measurement, and the accuracy was assessed with the surface settlement data. Then, the two data went through a regression for long-term settlement and consolidation prediction. Finally, the drone data were used for the settlement and consolidation prediction for points without surface settlement.

2.1. LiDAR Measurement

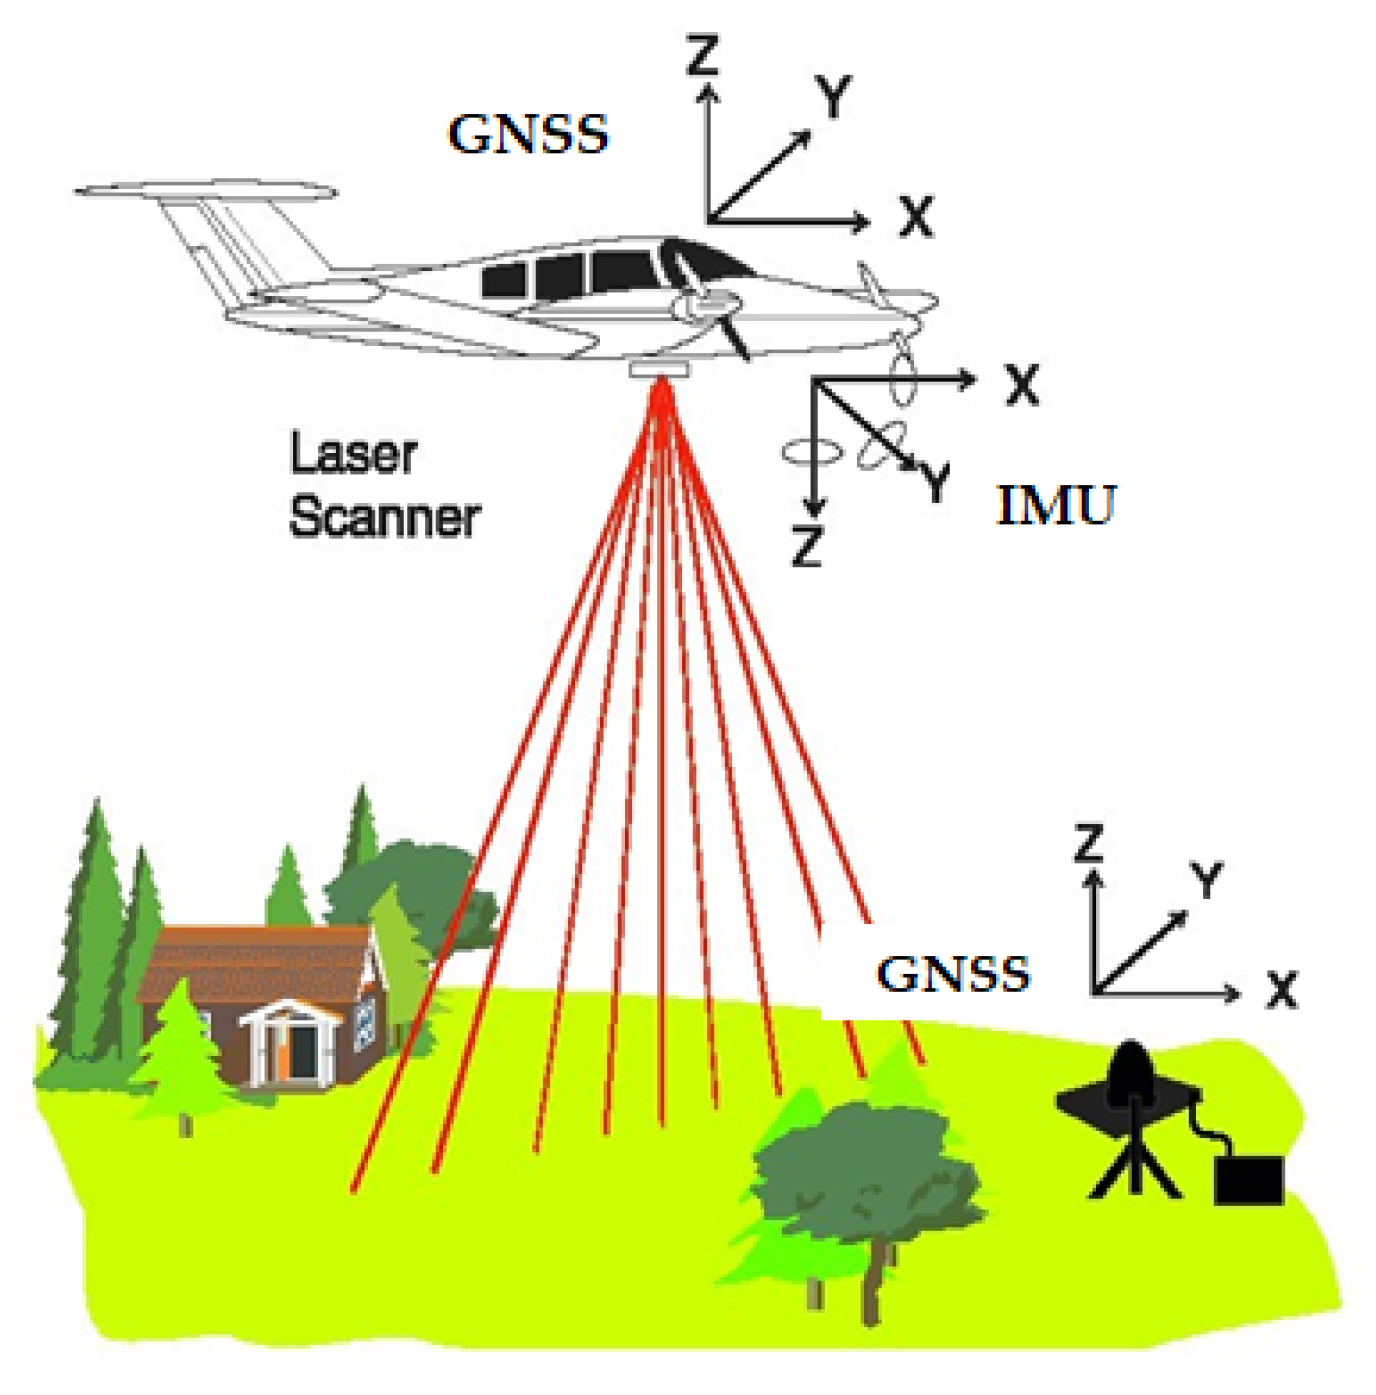
LiDAR determines angles and ranges to a target with a laser by measuring the time for the reflected light to return to the receiver, as shown in Figure 2. The spectral band for LiDAR ranges from 500~1500 nm. The position and the attitude of the sensor are determined using a GNSS receiver and INS or IMU (Inertial Measurement Unit). The onboard GNSS information is processed with ground control GNSS station information for high accuracy. The two pieces of GNSS information are processed with the DGPS (Differential GPS) method—more specifically, double differencing. This was possible because Korea has a dense CORS (Continuously Operating Reference Station) in order to support accurate positioning.
Finally, the 3D coordinates of every target point are computed using the distance and the angle measurement with the help of the GNSS and IMU, as shown in Equation (1). The resulting original data consists of the GNSS time, 3D coordinates of a target, and the intensity of the reflection, stored in a standard LAS (LASer) format.
X Y Z = X 0 Y 0 Z 0 + X G Y G Z G + R I M U R I M U L S I X I Y I Z
where  X , Y , Z  are the ground coordinates;  X G , Y G , Z G  are the GNSS coordinates;  X 0 , Y 0 , Z 0  are relative LiDAR position from the GNSS receiver;  R I M U  is the rotation matrix between the coordinates’ system and the IMU;  R I M U L S  is the rotation matrix between the IMU and the LiDAR; and  I X , I Y , I Z  are the LiDAR vector.

2.2. Point Cloud Preprocessing

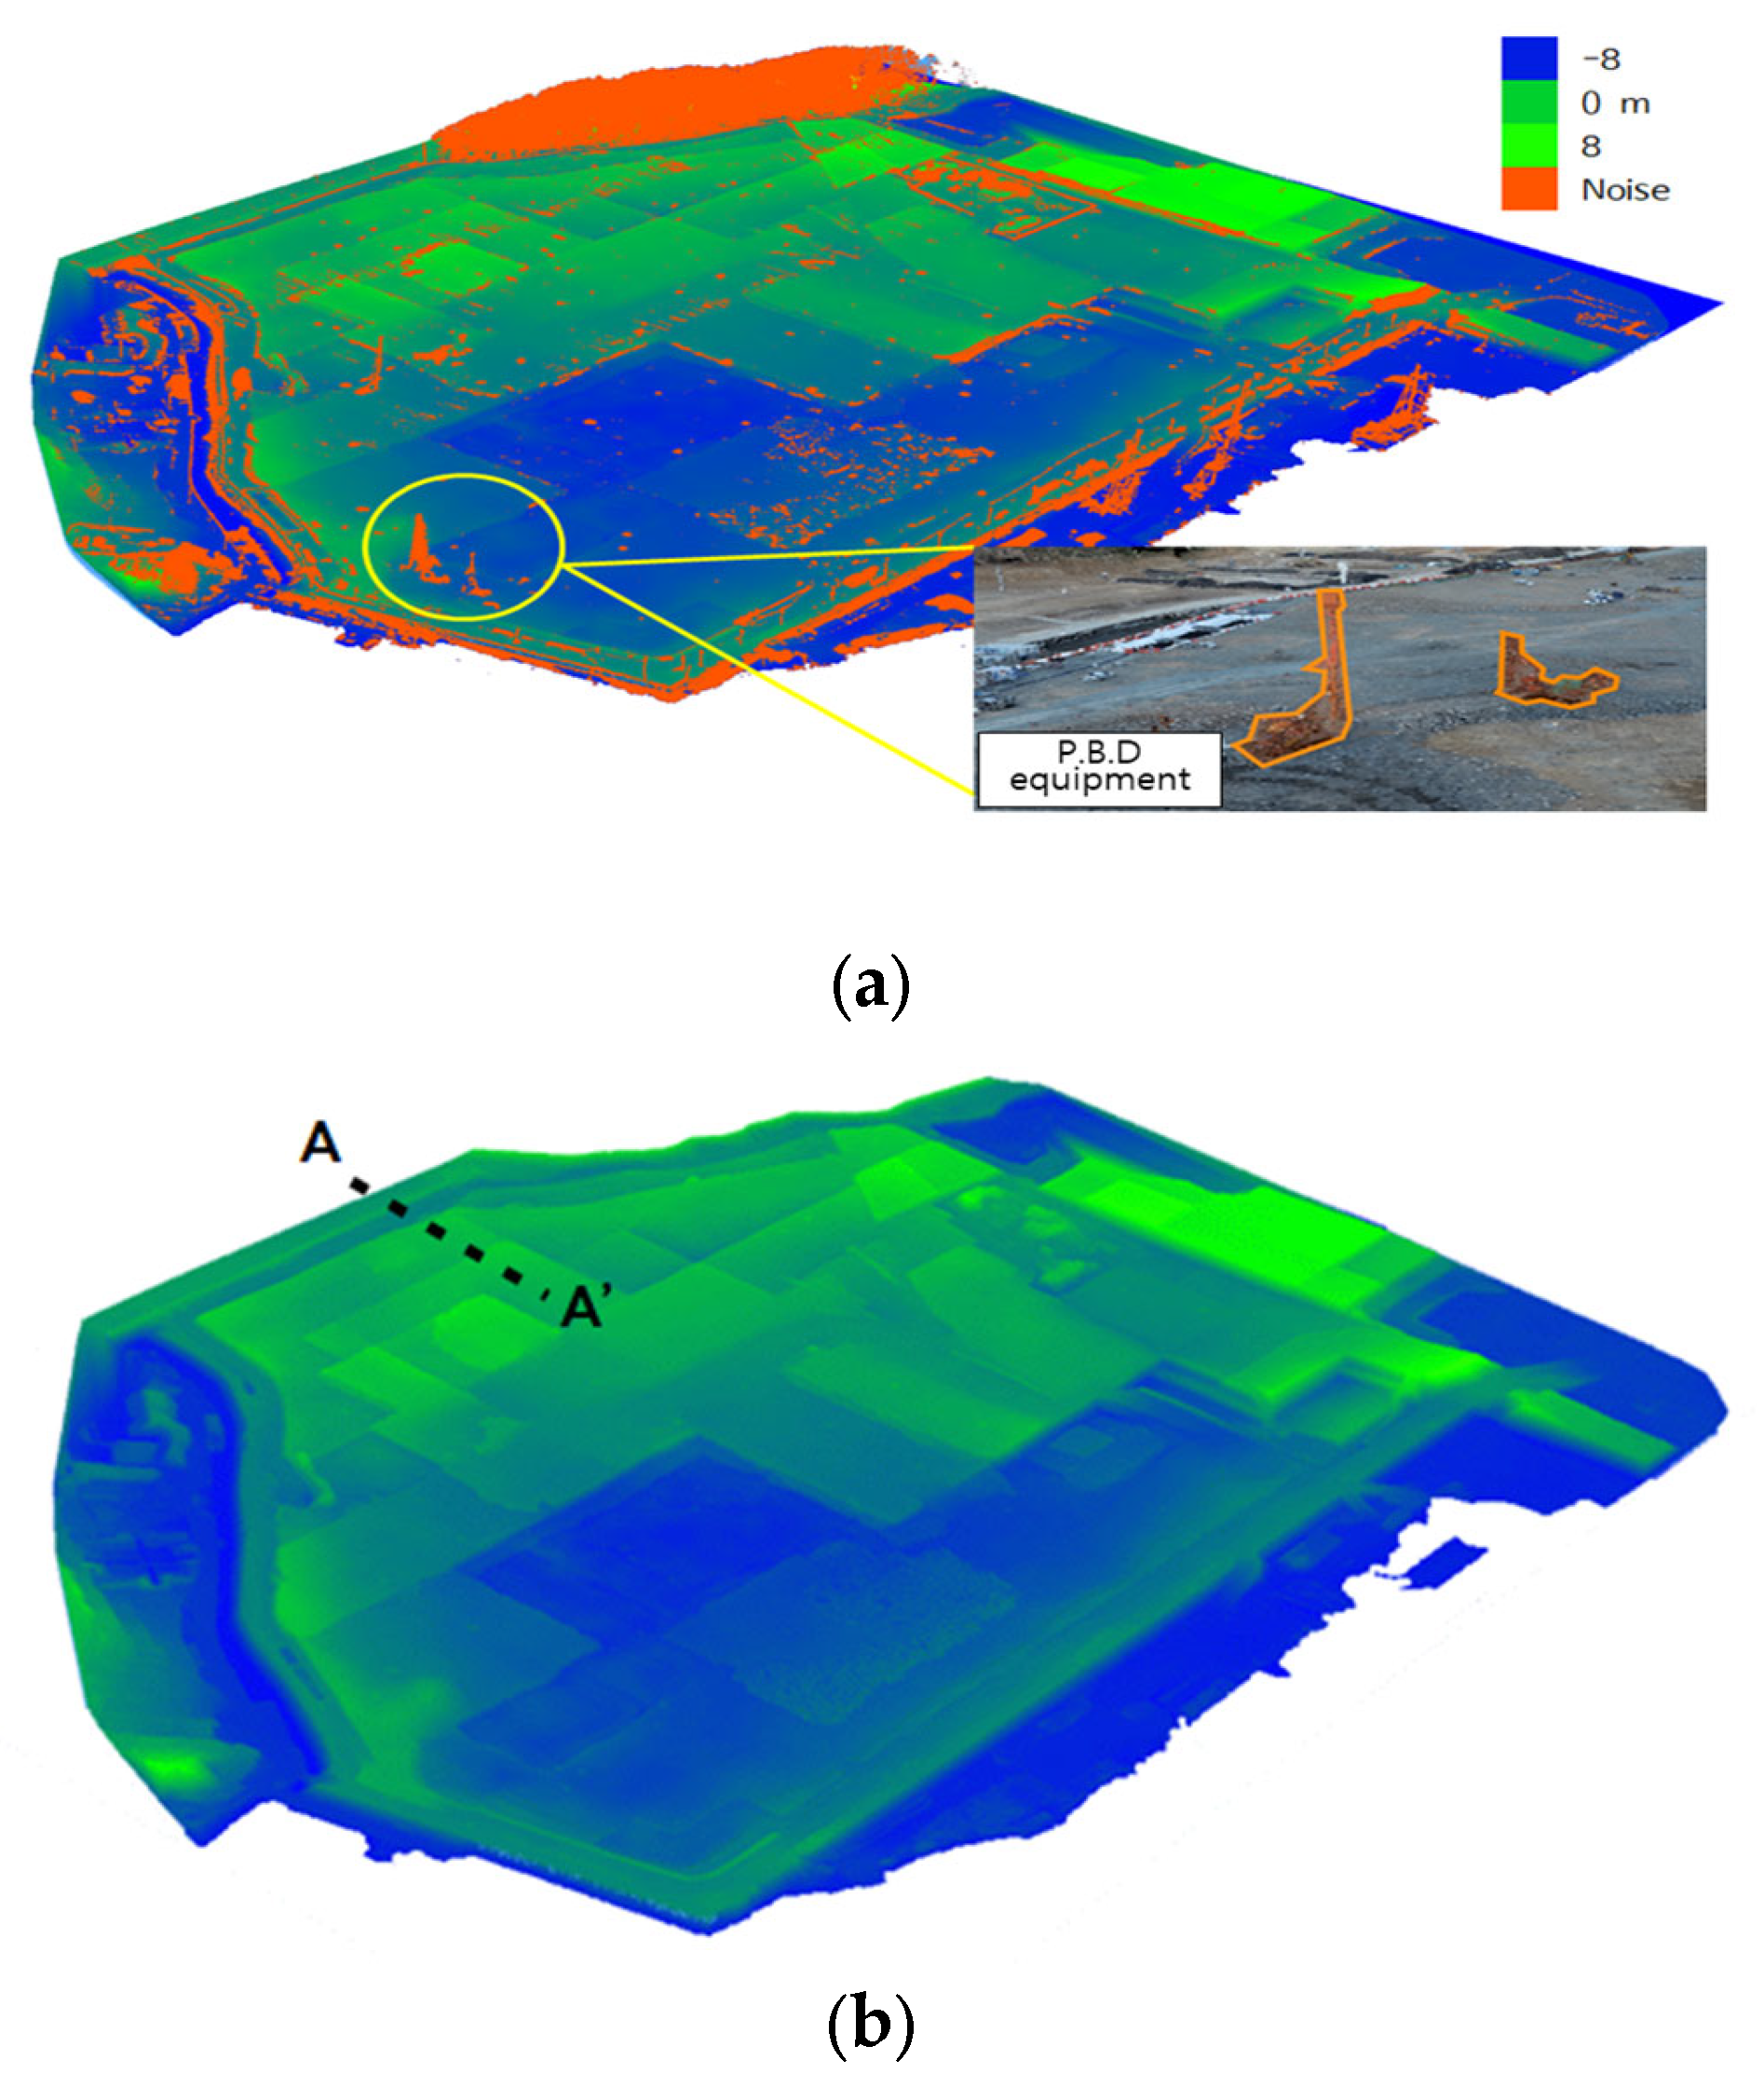
The original point cloud from a LiDAR sensor includes measurement noises. The resulting elevation information in the form of DSM (Digital Surface Model) includes all surface information, such as trees and construction vehicles. These on-surface information should be removed with DTM (Digital Terrain Model) filtering. A manual operation is required to clean the data for the final surface point cloud information, as shown in Figure 3.

2.3. Surface Settlement Measure

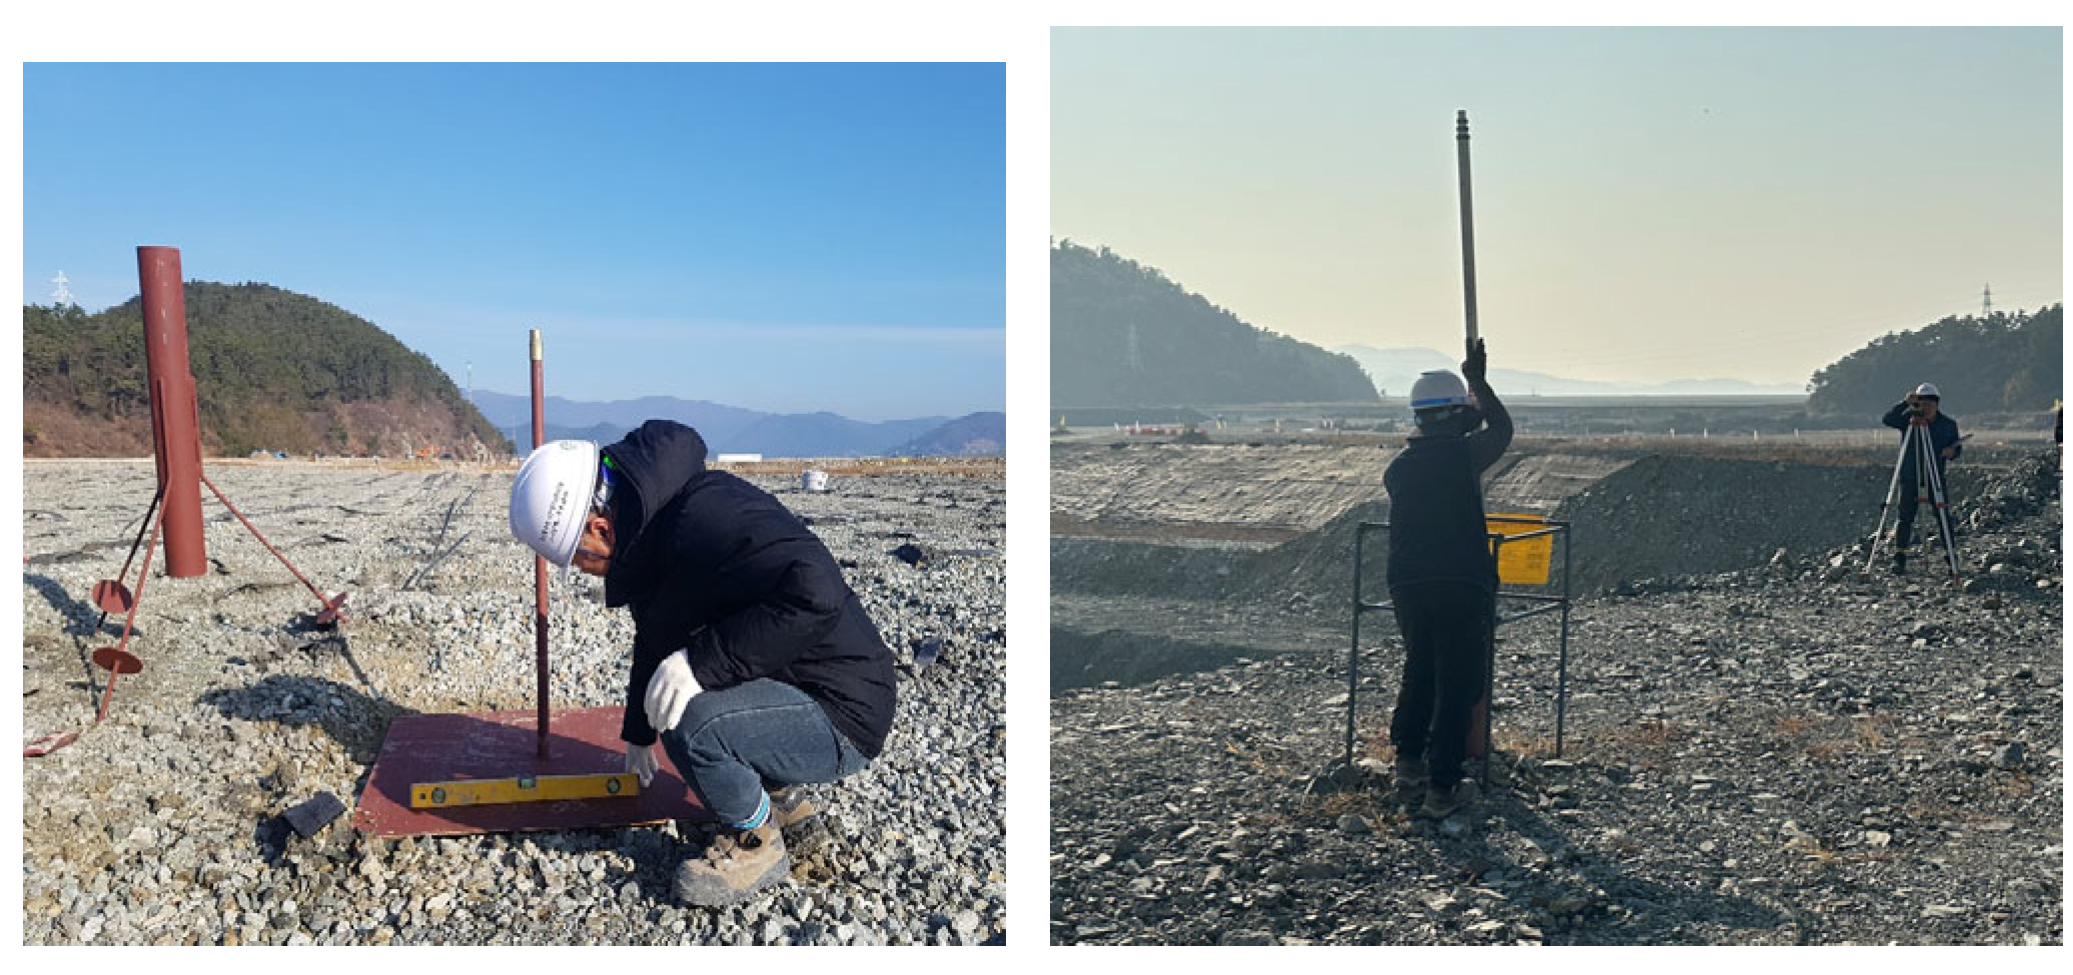
Conventional surface settlement measurement was carried out manually using an engineering level with the stick on a ground target, as shown in Figure 4. In contrast, it is difficult to pinpoint the stick position in the LiDAR point cloud. Therefore, the average elevation around the target should be taken, though the surface around the stick is uneven. In addition, the drone-surveyed measurement should consider the undergoing banking that causes the elevation change while the drone surveying takes measurements of the surface of a target. Therefore, the experiment was carried out for the area where the banking process was completed.

2.4. Long-Term Settlement Prediction

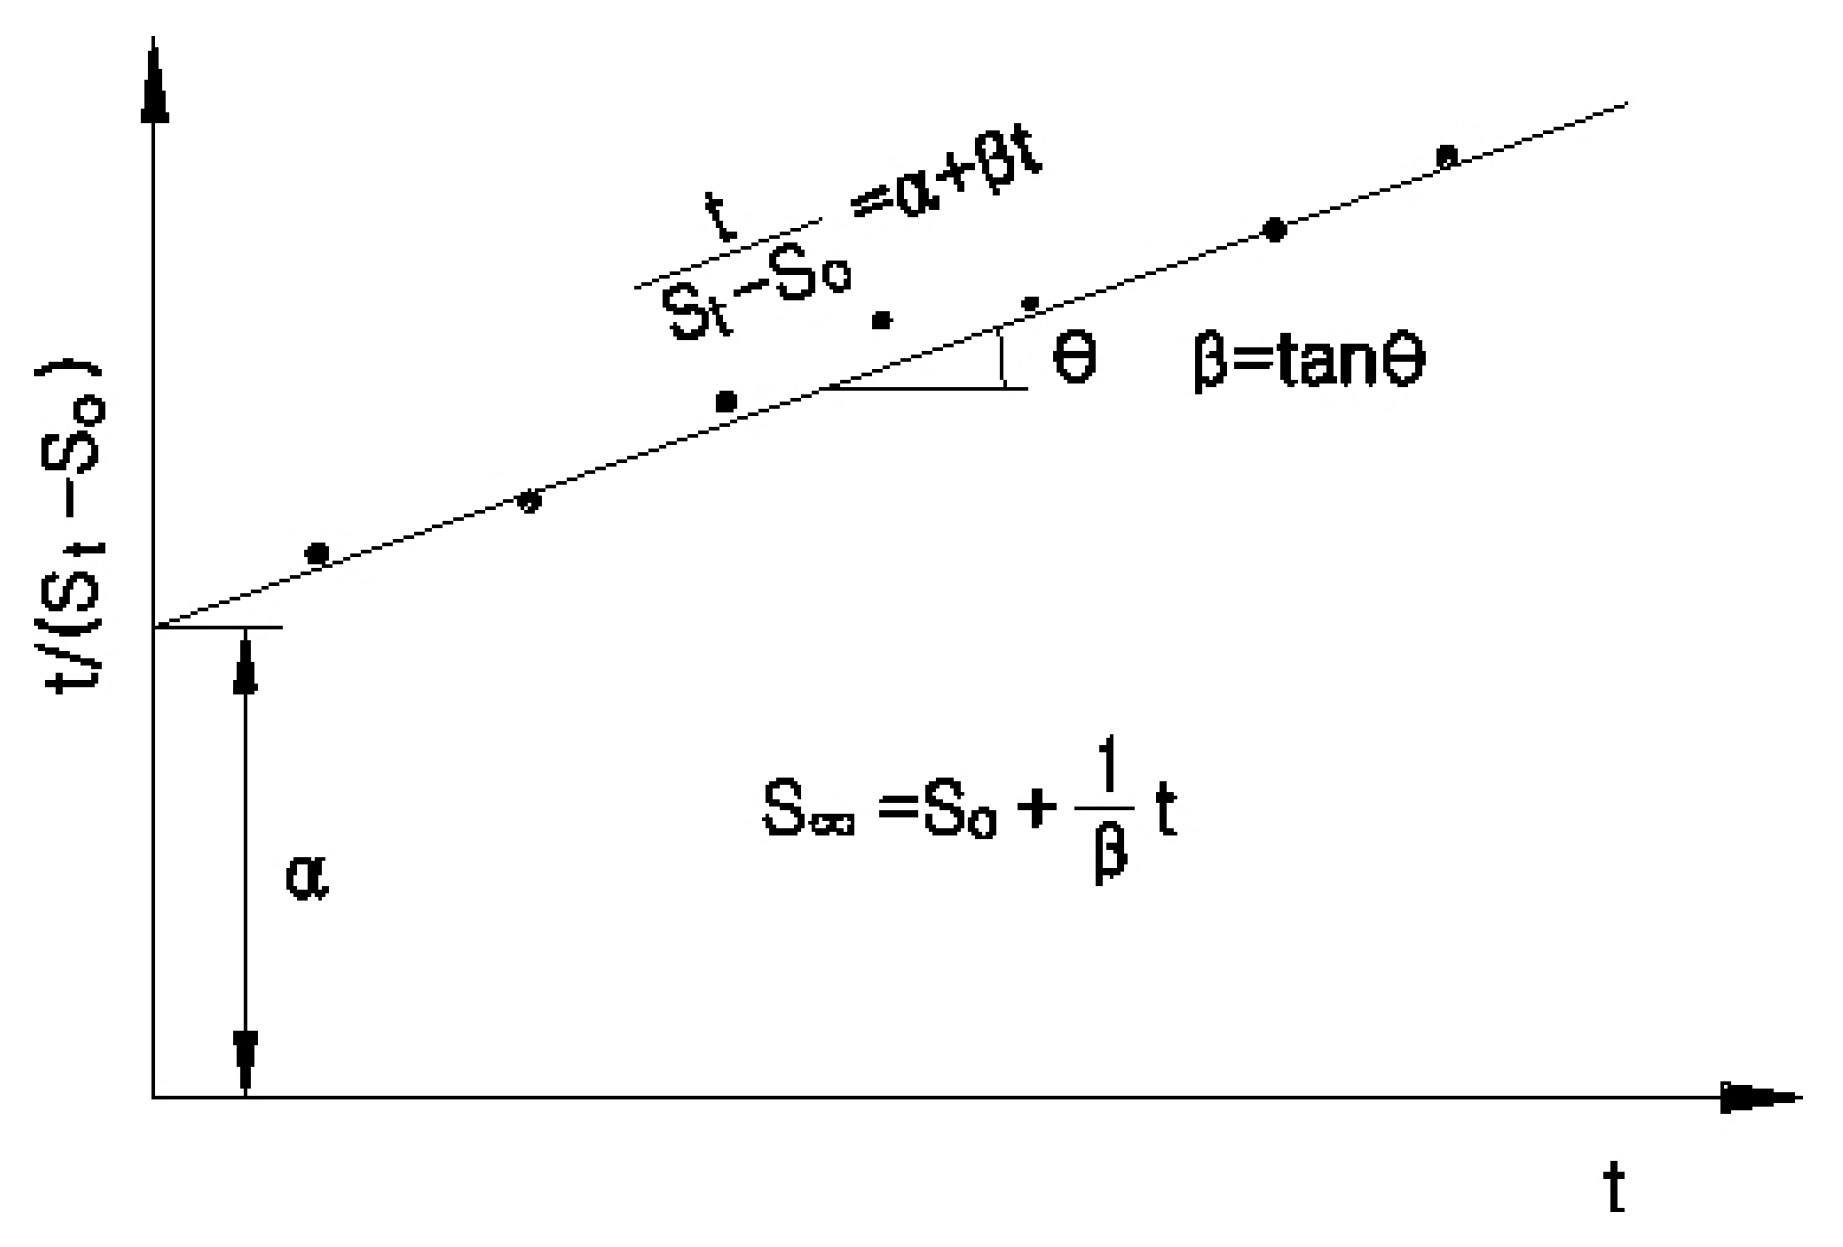
A long-term settlement prediction enables the consolidation progress and the ground improvement to be checked by comparing the design and the actual settlements. Two prediction methods exist, which are the hyperbolic method [21] and Asaoka [22], and they can both be considered, but the hyperbolic method was used in the study. The method assumes that the settlement decreases in a hyperbolic curve, as shown in Figure 5 and Equations (2) and (3).
t S t S 0 = α + β t
S = S 0 + 1 β
where  S 0  is the settlement at the beginning,  S t  is the settlement at time  t , α is the intersect of the regression at y-axis, and β is the slope of the regression.

3. Experimental Results

3.1. Drone

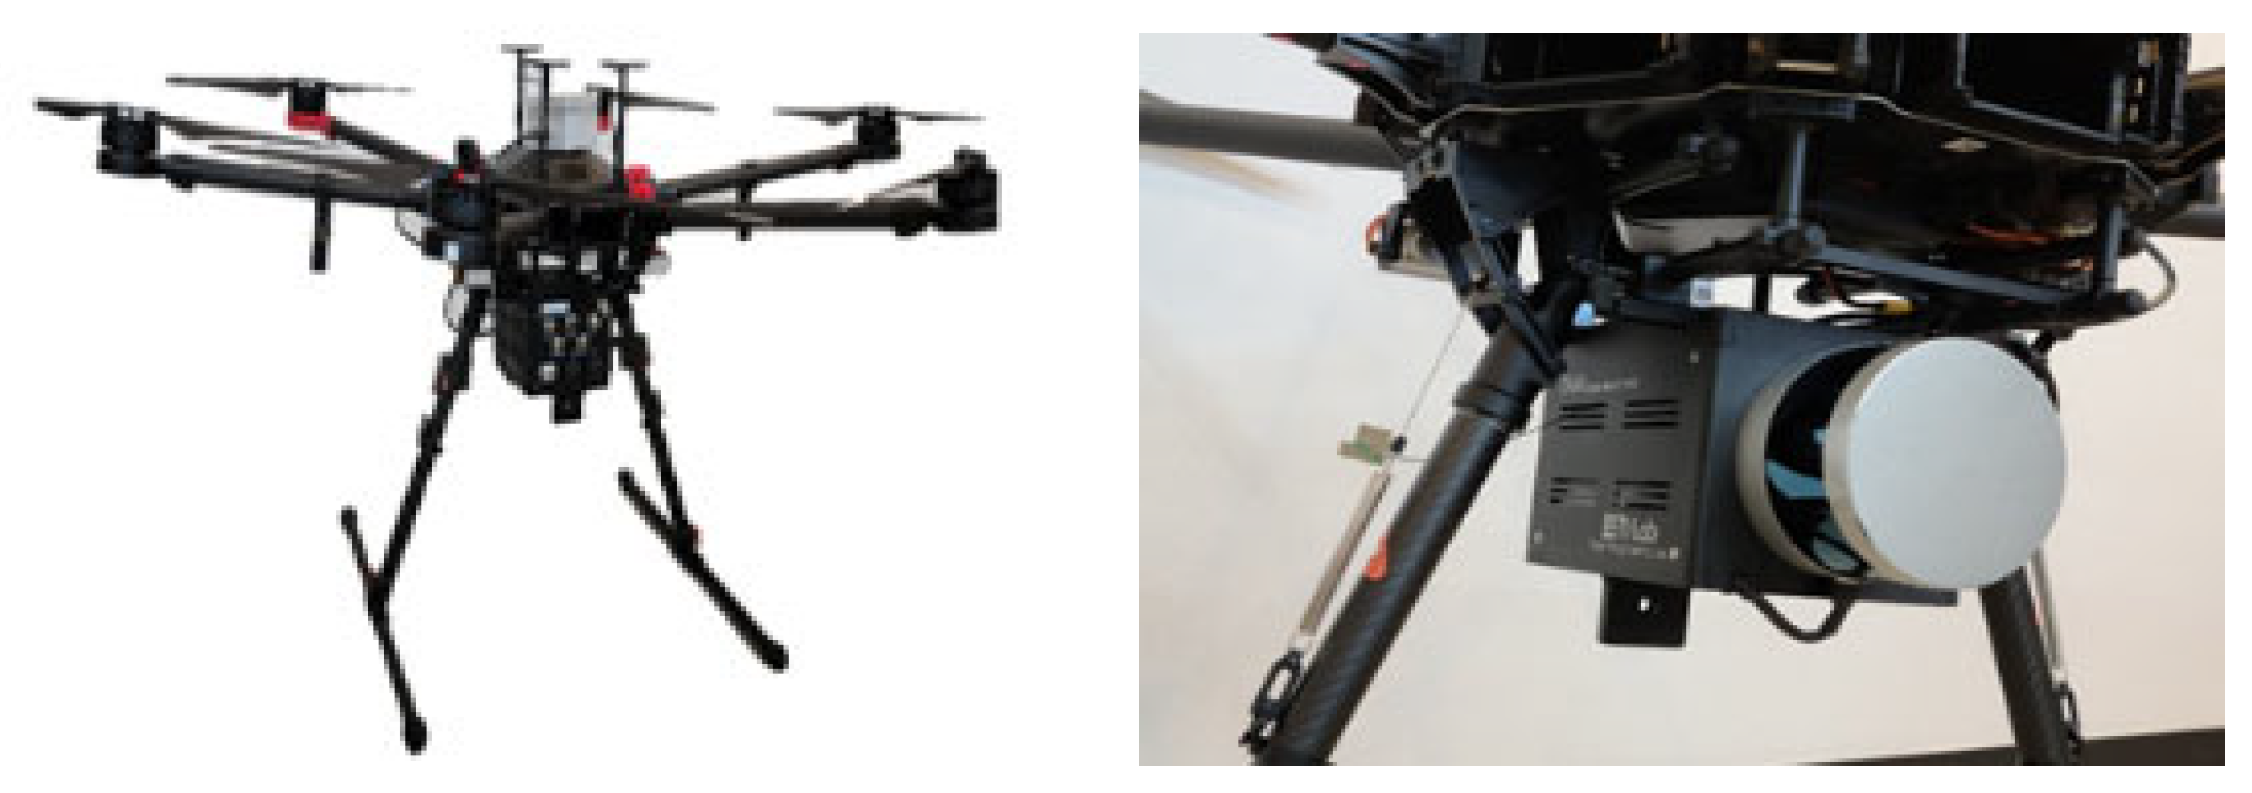
The tested LiDAR sensor is VLP-16 (Velodyne) (Figure 6), with specifications shown in Table 1. The sensor computes the distance and the scan angle from the sensor using the travel time measurement. The measuring distance is about 100 m with 10 rotations per second for 360 deg. The sensor has a scan rate up to 0.3 million points per second, and the specified accuracy of the sensor is below 3 cm.

3.2. Data Acquisition

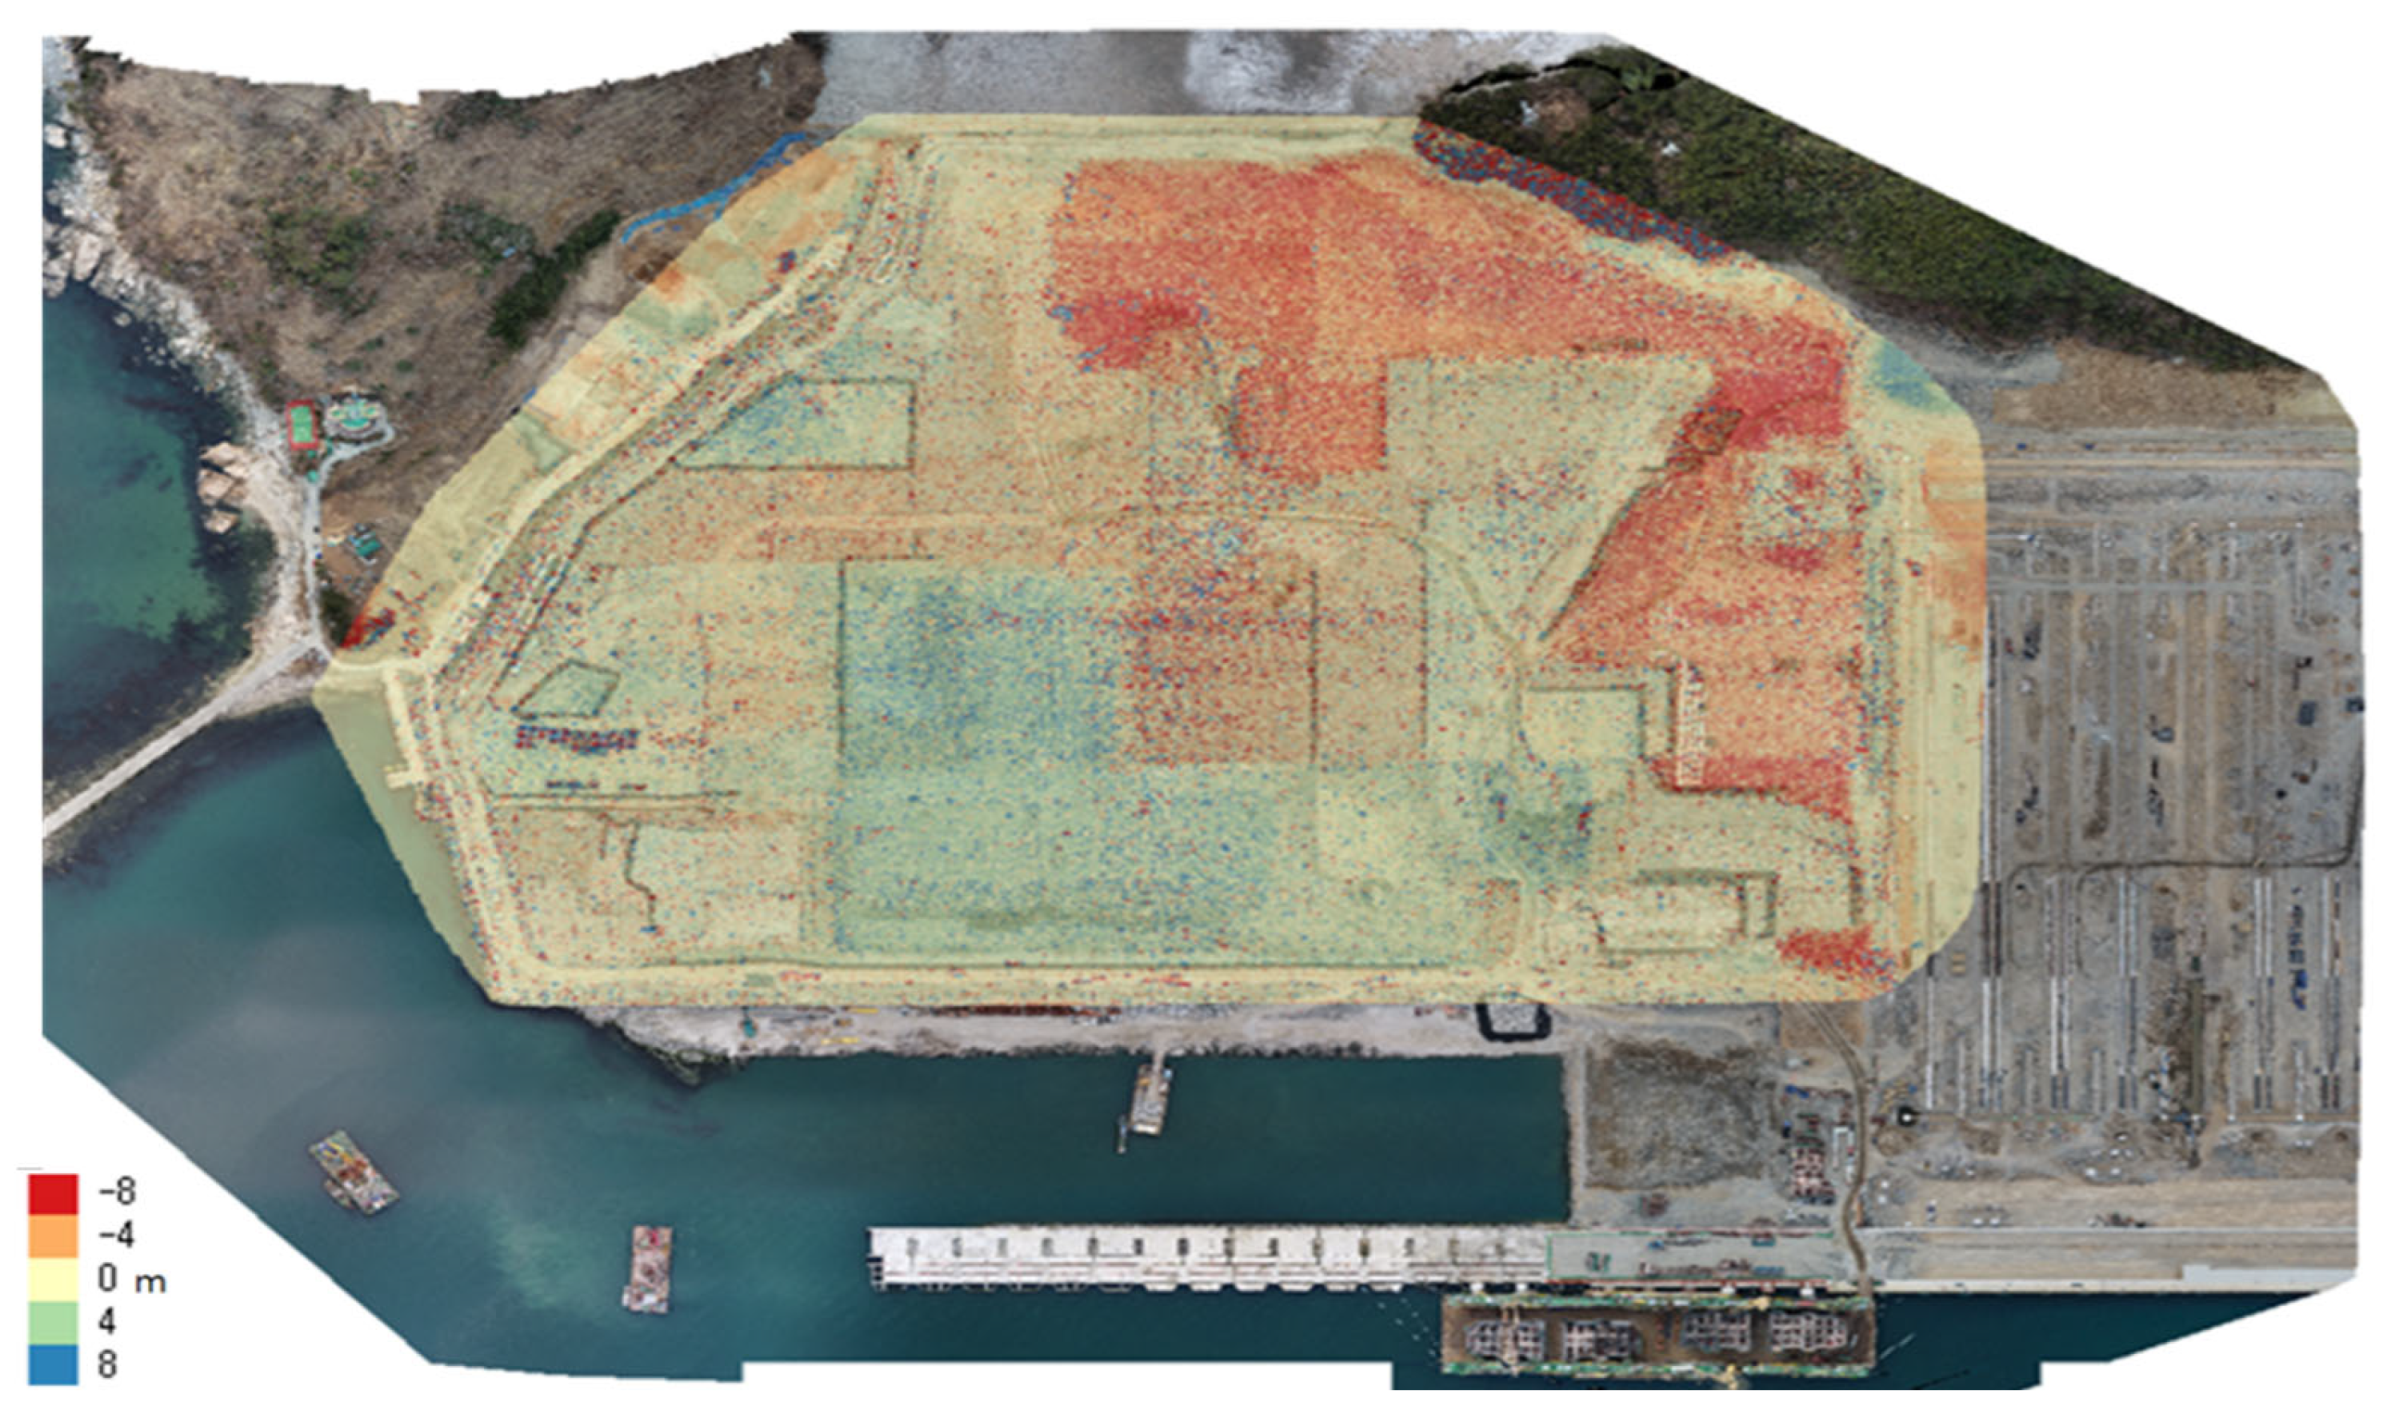
The test site is a land reclamation area where mostly soft ground characteristics appear. The area is 391,535 m2 and the soft ground depth ranges 9.7~49.2 m. The drone flight was designed considering the weather, wind speed, and construction interference, such as PBD (Plastic Board Drain) and DCM (Deep Cement Mixing) operations. The drone was operated at an 80 m flying height and 2.5 m/s. We divided the target area into three sub-targets, as shown in Figure 7, because of the limited battery capacity, but the data were acquired considering the overlapping between the sub-targets. The original point cloud went through noise removal and filtering that removes trees and construction equipment. Figure 8 depicts a cross-section profile from June 2020 (Red) to January 2021 (Green). With the banking process, the elevation change was observable. In addition, Figure 9 shows the differential DTM from February 2021 to February 2022. The blue color shows the banking part while the red color depicts the removal of the banked soil.

3.3. Data Comparison

The drone LiDAR measures a surface that changes according to the banking process. Therefore, a time zone was established where no banking is carried out, and was then compared between the two measurements from the drone and the conventional method. A total of 89~137 manual measurements were obtained from 18 January 2021 to 16 June 2022, as shown in Table 2. The measurements were carried out daily or once every three days. A total of 14~22 drone measurements were obtained for the same time range, as shown in Table 3. The survey was carried out once or twice per month. The surface settlements were sampled for data comparison with the drone survey.
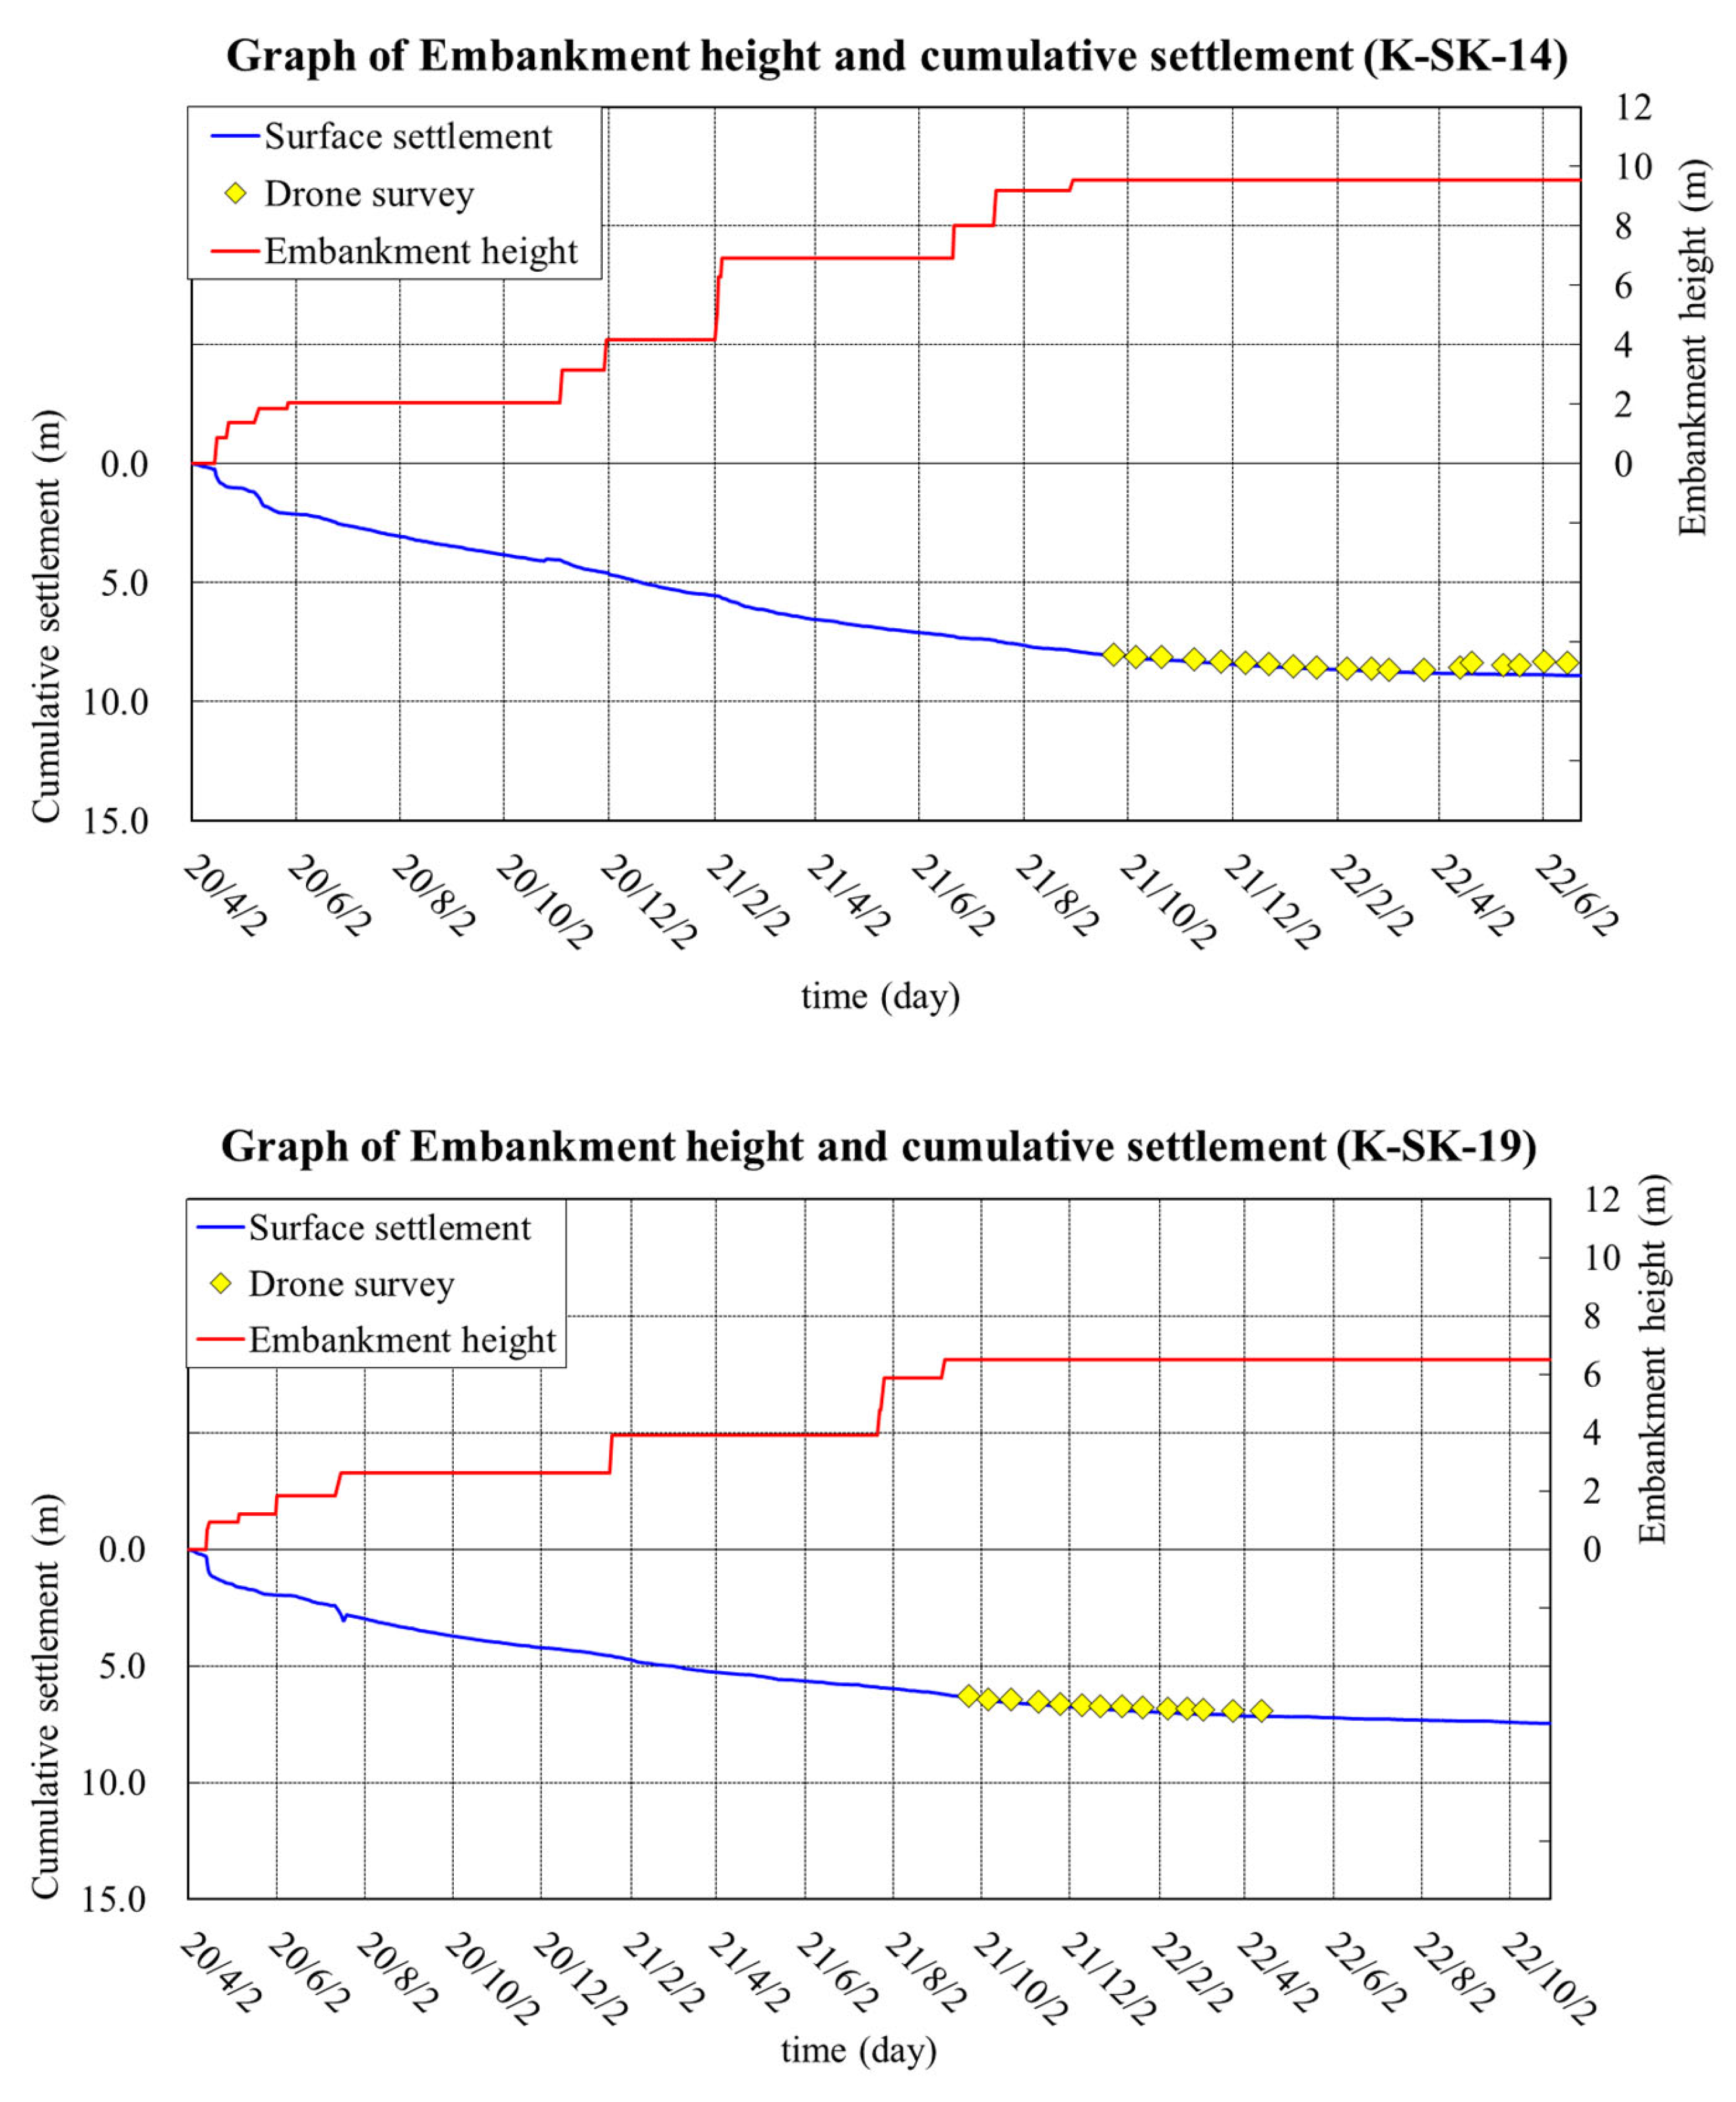
Figure 10 shows the embankment height in red and the ground-measured cumulative settlement in blue, with drone-surveyed data in yellow dots for the target spots. The drone survey data well describe the settlement pattern. Note that the comparison was conducted for the period when no more banking was carried out.
Table 4 presents the difference between the two measurements, showing 56~254 mm in RMSE. Overall, a 13 cm vertical accuracy was observed in the study. Considering that the settlement is up to 10 m, the accuracy was decent to measure the elevation change.

3.4. Long-Term Settlement Prediction and Consolidation Rate

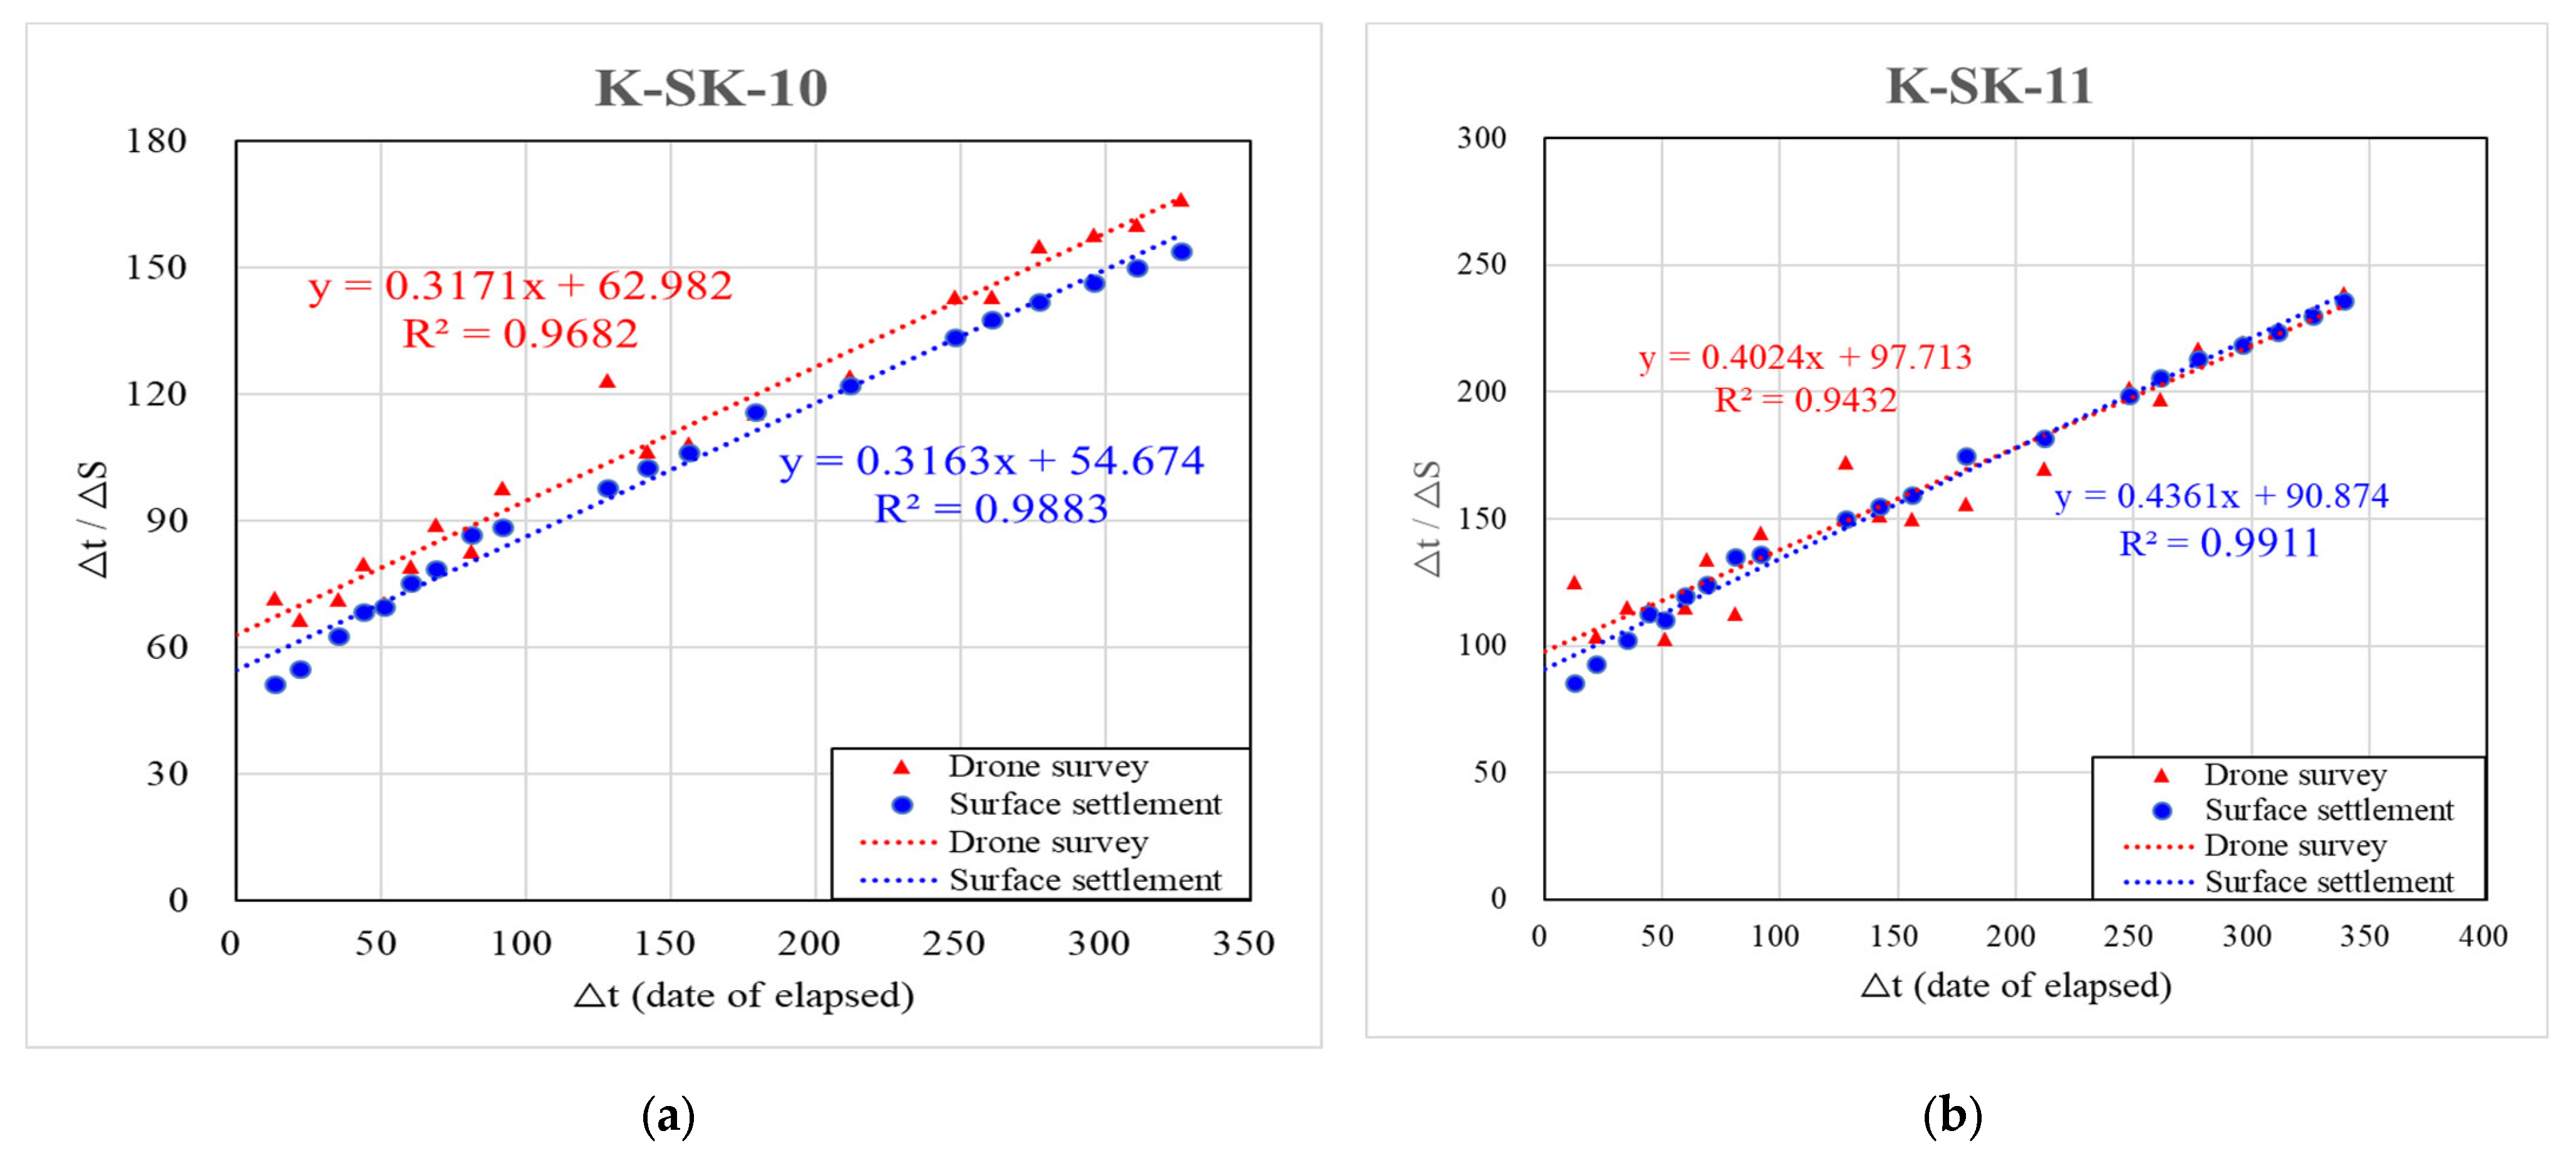
The regression of settlement measurements was carried out from the drone-based surveying and the surface settlement, as shown in Figure 11. The cumulative settlement ΔS was computed with Δt (date of elapsed) to determine the straight regression line in order to predict a long-term settlement and consolidation.
Table 5 shows the two predictions from the drone survey data and the surface settlements. The predicted settlement from the surface settlement was 3.162 m, 2.293 m, 1.382 m, and 1.420 m for K-SK-10, K-SK-11, K-SK-14, and K-SK-19, respectively. The consolidation rate was 67.06%, 62.71%, 63.33%, and 53.29% for K-SK-10, K-SK-11, K-SK-14, and K-SK-19, respectively. The difference in the predicted settlements ranged from –906 mm to 192 mm, and the consolidation rate difference was −5.56% to 8.44%.

3.5. Use of Drone Survey for Areas without Ground Targets

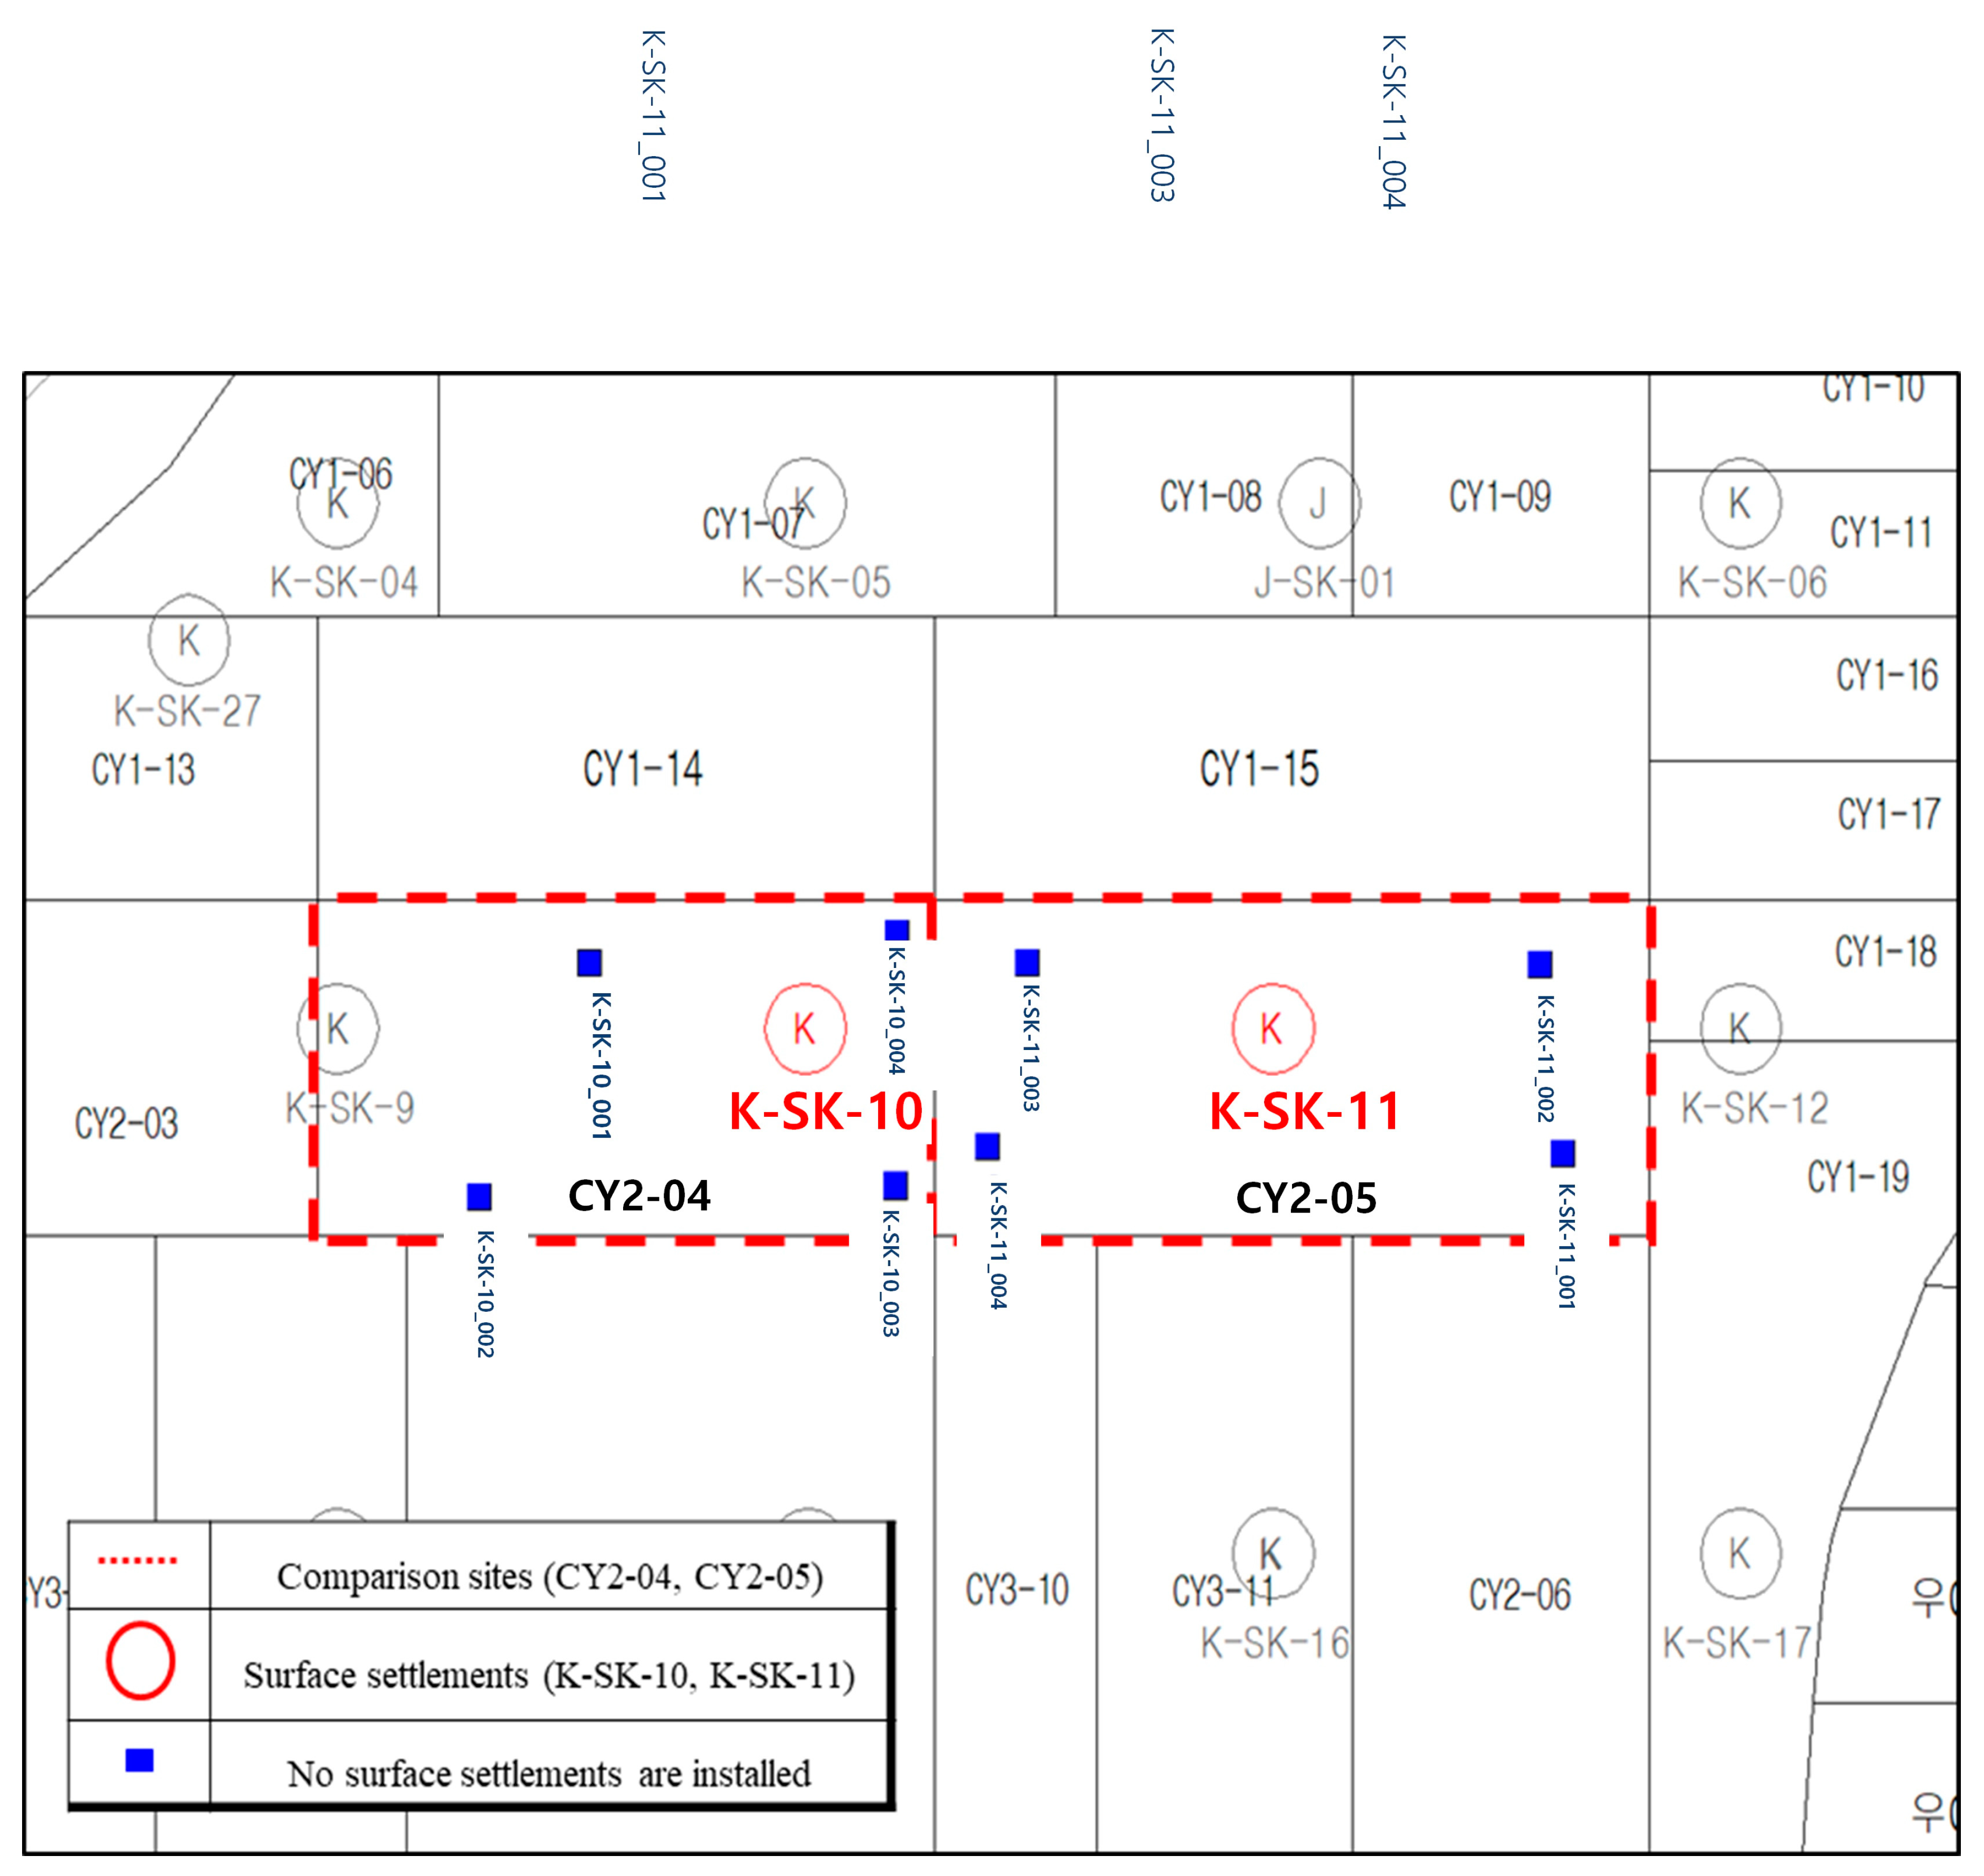
Eight points were selected where no surface settlements are installed near K-SK-10 and K-SK-11, and the sites are marked as blue squares in Figure 12. The settlement analysis was then carried out using the drone-surveyed data.
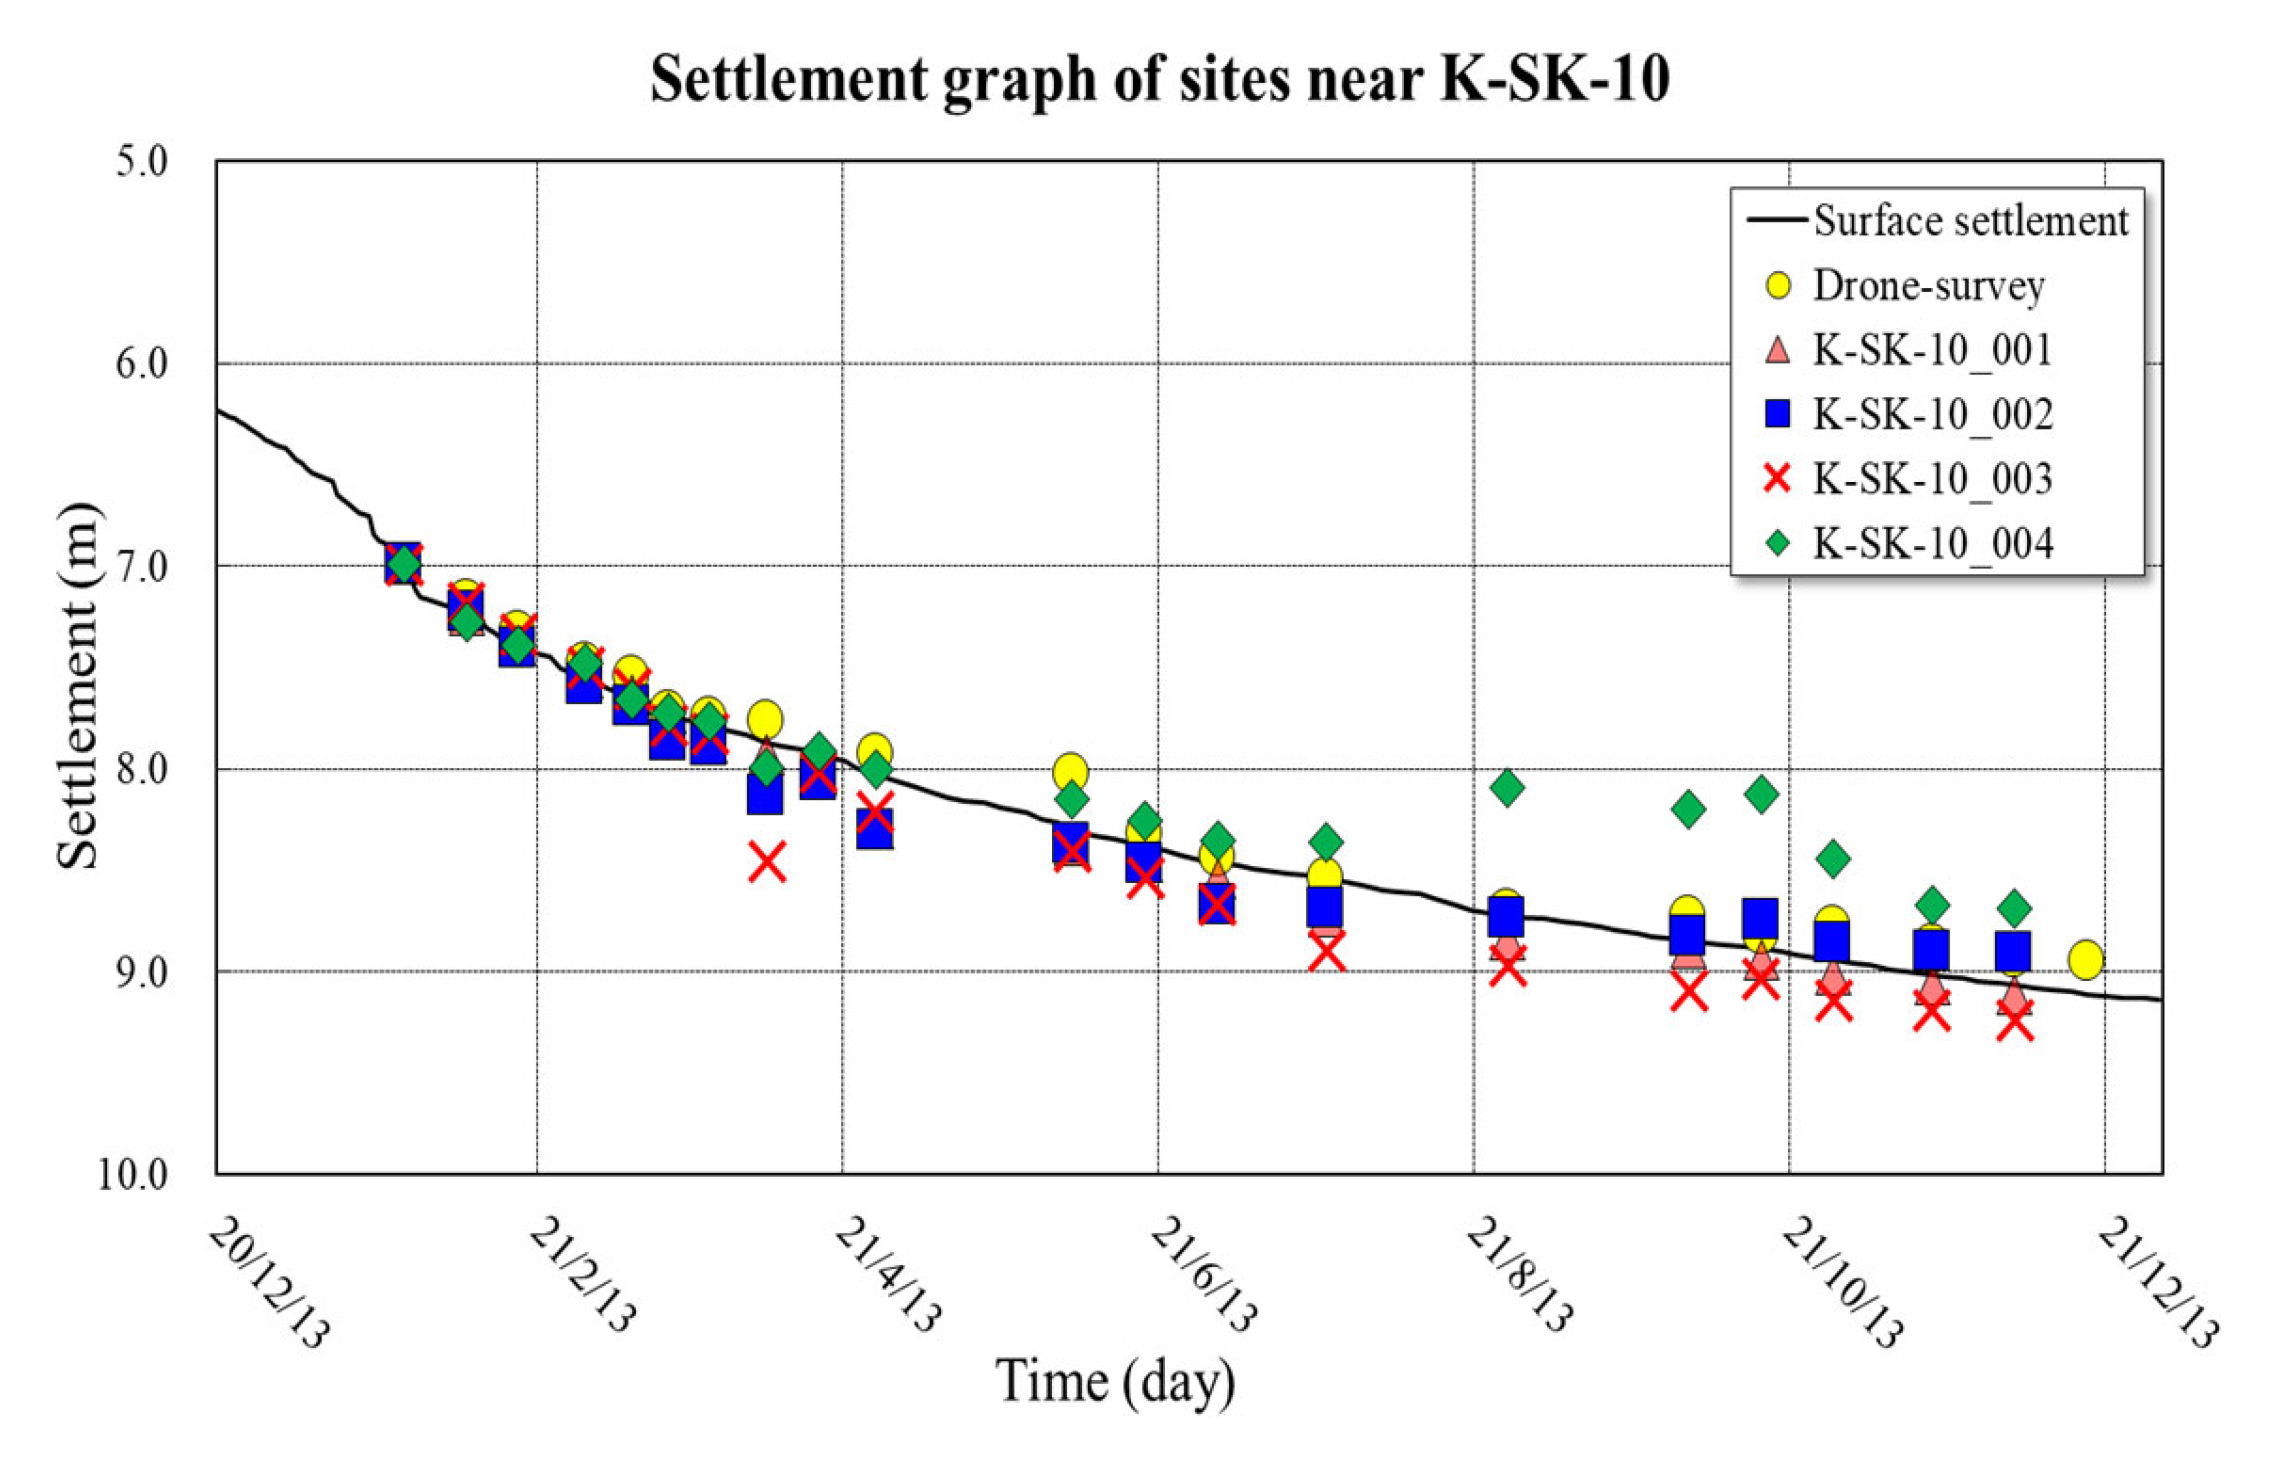
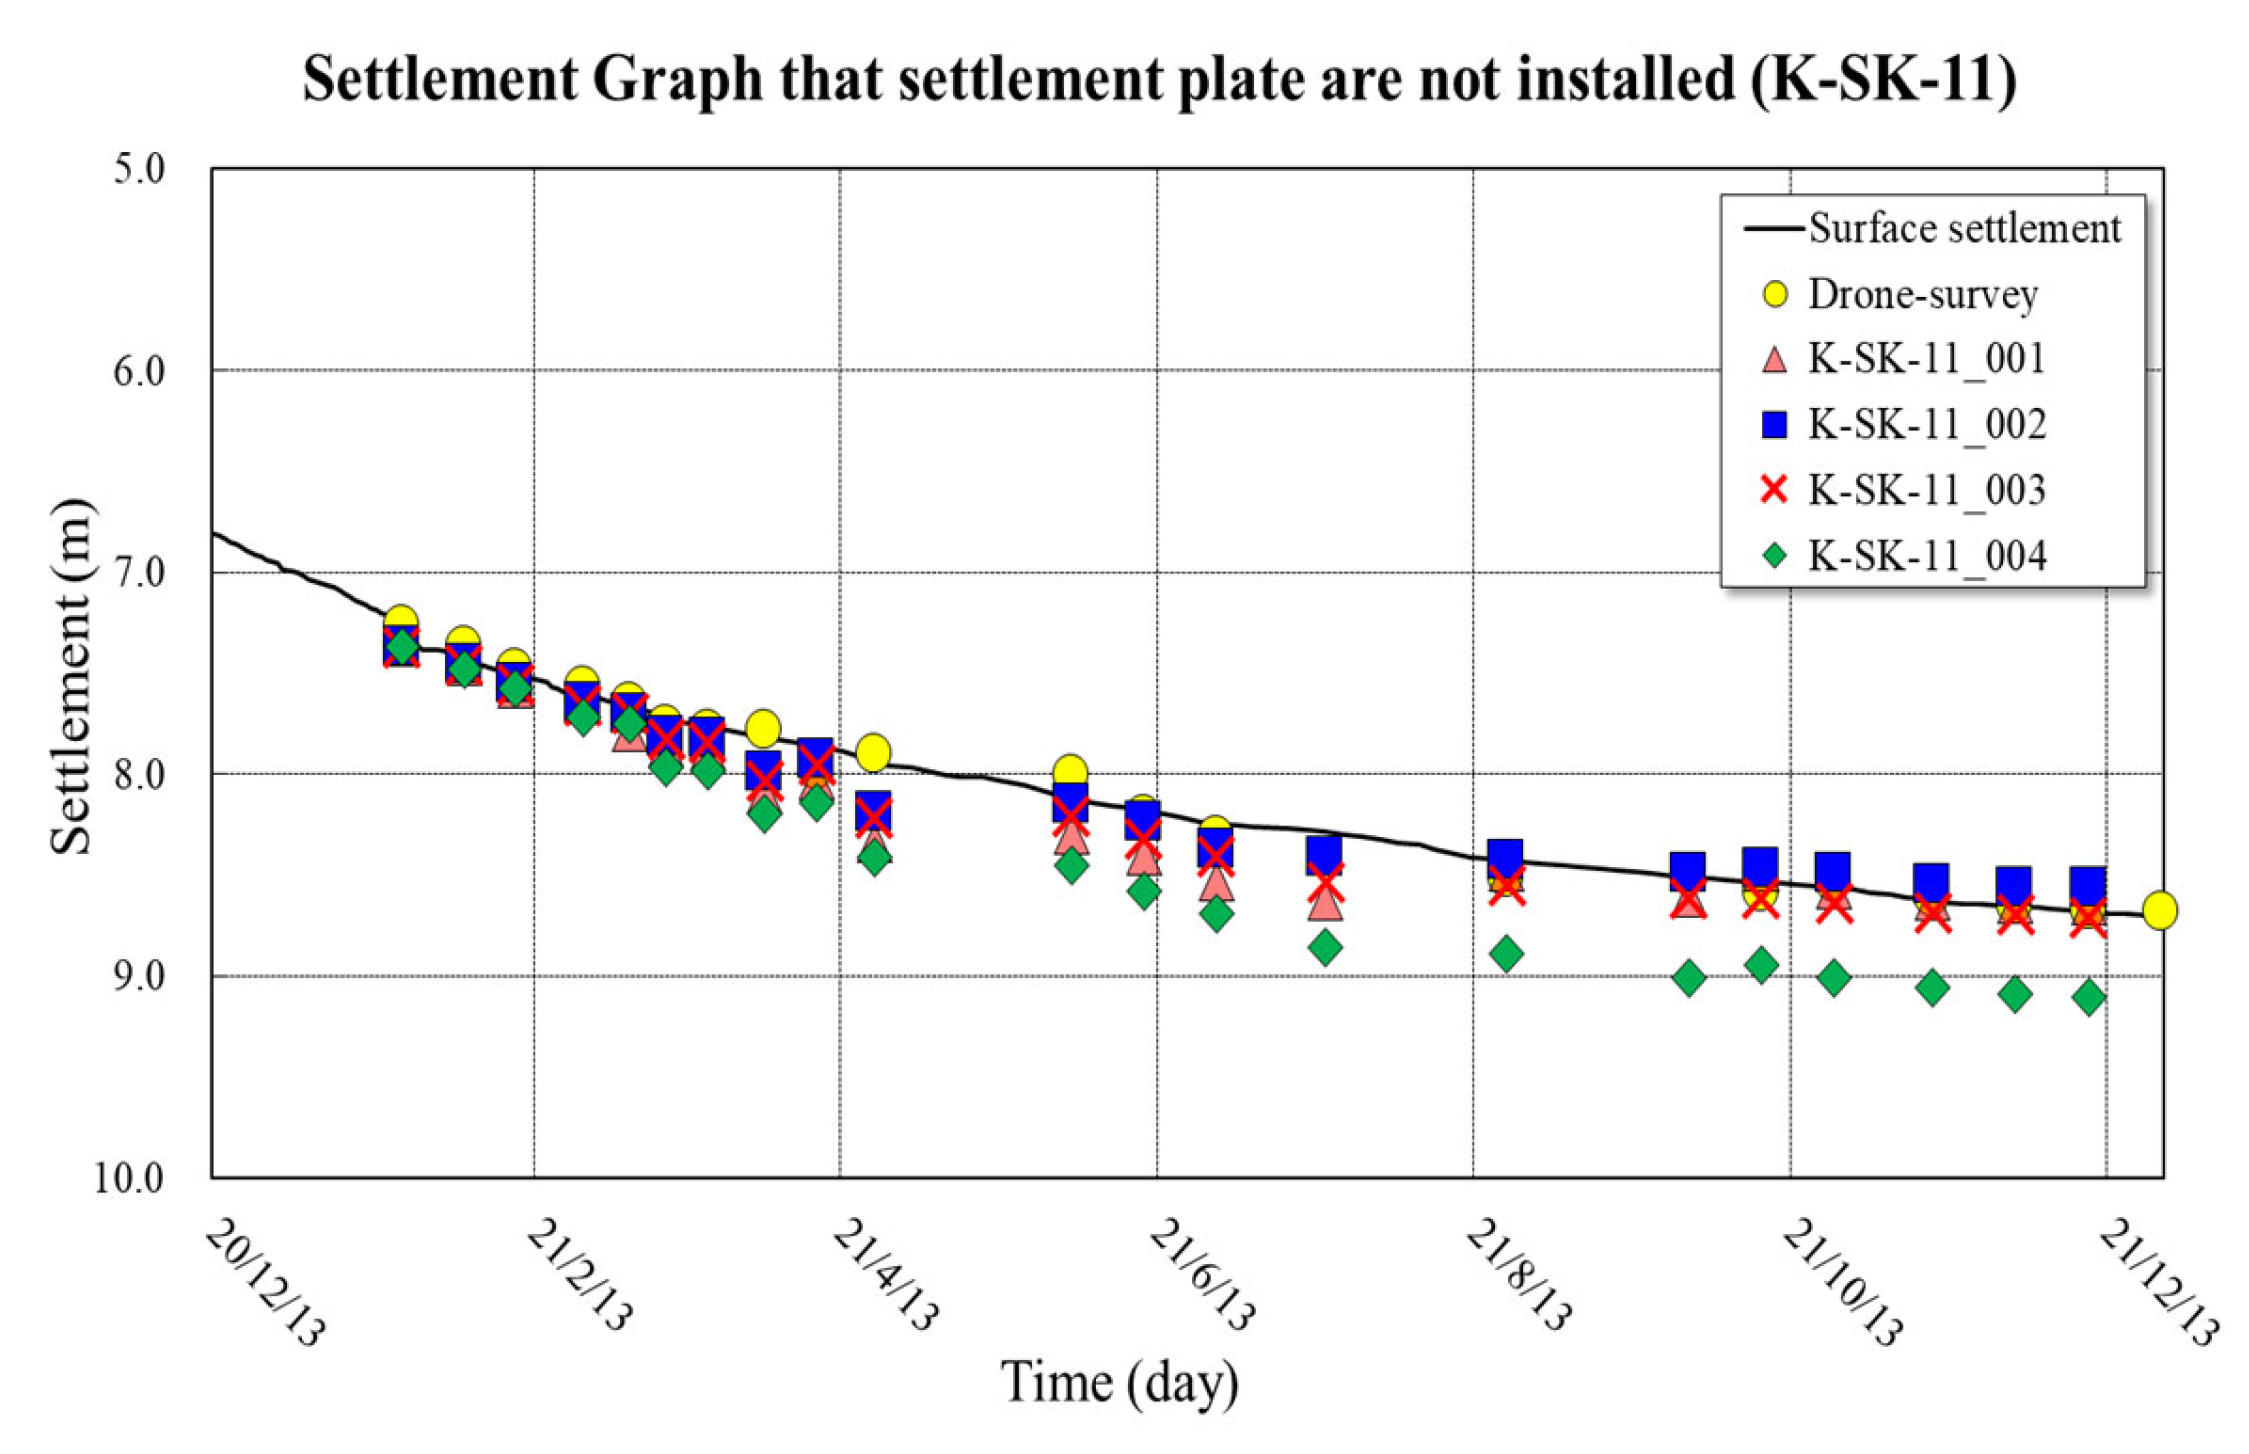
The measured settlements from the drone survey were plotted with the surface settlements at K-SK-10 and K-SK-11 in Figure 13. The drone-derived settlement of these points shows a similar pattern to the near-surface settlement, though the settlement was slightly different point-by-point.
The long-term settlement and consolidation for these points were then predicted using the drone survey, as shown in Table 6. The regression was carried out with a high R-square. We should note that the reliability of the predicted settlement and the consolidation are within 492 mm and 6.23% from the analysis in Table 5.

4. Discussion

The drone surveying has been limited for long-term ground settlement measurement because few studies have been carried out. Therefore, this study applied drone LiDAR surveying for long-term ground settlement measurement at a very large land reclamation area with soft ground near harbor facilities to check its applicability and accuracy. To this end, periodic drone surveying was carried out for about one and a half years to measure the ground settlement.
The vertical accuracy of the surface from the LiDAR surveying was compared to settlement ground truth points acquired using engineering levels. The results from the graph of embankment heights and cumulative settlements showed differences of −185 mm to +6 mm, resulting in 13 cm RMSE errors. Compared to recent drone LiDAR vertical accuracy results of Liu et al. [17], Muller [23], and Kucharczyk et al. [24], the error range seems reasonable. The accuracy may be improved, but the uneven surface around the points of embankment soil was an obstacle. Note that the embankment soil specification is less than 0.03 m3/EA, with each rock showing about less than 30 cm in width. The reduction of the vertical error may be achievable with large, stable surface drone survey targets. However, this was not carried out and is a major limitation of the study. Installing large and flat surfaces to isolate the uneven soil effects should be considered for future studies.
The periodic drone LiDAR surveying enabled long-term settlement and consolidation prediction based on the hyperbolic method. The settlement prediction showed −906 mm to +192 mm with 49.2 cm RMSE errors. As Shibata et al. [25] reported, long-term settlement prediction based on conventional surface measurements showed errors in the range of dozens of centimeters compared to ground truth settlement. Therefore, the prediction results from the drone LiDAR surveying, showing less than 50 cm, seem reasonable. In addition, the predicted consolidation rate ranged from −5.56% to +8.44%, resulting in 6.23% RMSE errors. This error seems within the controlled value, as typical consolidation predictions show large differences, such as up to more than 10% for each prediction method, as reported in Park and Kim [26]. Therefore, the long-term settlement and consolidation predictions, less than 50 cm and 10%, respectively, can serve as valuable reference information to control embankment progress and stability of the soft ground with large settlement.
The study continued to carry out the settlement and consolidation prediction for 8 more points where no settlement was installed (see Figure 12). The points K-SK-10_004 showed relatively smaller settlement than those near K-SK-10 in Figure 13. K-SK-10_004 seems to be affected by the nearby CY1-15 embankment, which was completed in Dec 2020 before CY2-04 (Jan 2021). K-SK-11_004 showed relatively larger settlement than the area near K-SK-11 in Figure 13. This is because the embankments of CY3-10 and CY3-11 were completed in Feb 2021, which had a more significant impact on the settlement of K-SK-11_004 than on K-SK-11. The results show that each point exhibits a different settlement pattern, highlighting the high potential of drone LiDAR surveying as reference data due to its ability to provide seamless elevation data compensating for conventional spatially-discrete surface settlement measurement.
Some drone-surveyed data show a relatively low coefficient of determination (R-square) in regression due to large construction vehicle operations near the targets. Therefore, more frequent data acquisition is recommended to ensure high data redundancy for outlier removal and increased reliability. Additionally, stable ground controls around the target areas that are not affected by large construction vehicles should be used for point cloud processing to enhance vertical accuracy.
As shown in Figure 12, the large target area consists of sub-areas where embankment is carried out with different schedules. Therefore, the settlement should be separated from the embankment for drone surveying.
The result of this study can serve as a reference for those who want to use drone LiDAR surveying for soft ground settlement measurement at a large land reclamation site, which may show very large settlements up to several meters.

5. Conclusions

The drone surveying was carried out for long-term soft ground settlement measurement at a wide land reclamation area, and it was assessed for its accuracy and reliability. The following conclusions can be derived from the long-term experiments. The drone surveying showed 13 cm, 42.9 cm, and 6.23% differences in RMSE for vertical accuracy, long-term settlement prediction, and consolidation, respectively. The drone LiDAR accuracy thus seemed very useful for monitoring the settlement over the large and remote land reclamation site of soft ground, showing the settlement up to several meters where, without a surface measurement, installment is limited. Moreover, frequent drone data acquisition can produce redundant settlement data for the reliable prediction of settlement and consolidation through outlier removal. Drone survey data enabled settlement measurement and prediction for any point where no surface settlement is installed. Reliable settlement measurement using a drone survey requires consideration of undergoing embankment as, otherwise, it is not challenging to separate the settlement from the embankment as well as PBD and DCM operations. For future study, the use of a stable surface target with ground control data is recommended in order to achieve better vertical accuracy, such as 5~10 cm.

Author Contributions

Conceptualization, J.L. and J.O.; methodology, J.L. and J.O.; software, J.L. and J.O.; validation, J.L. and J.O.; formal analysis, J.L. and J.O.; investigation, J.L. and J.O.; resources, J.L.; data curation, J.L.; writing—original draft preparation, J.L. and J.O.; writing—review and editing, J.O. and H.J.; visualization, J.L. and J.O.; supervision, J.O..; project administration, J.L. and J.O.; funding acquisition, J.L. and J.O. All authors have read and agreed to the published version of the manuscript.

Funding

This study was supported by the National Research Foundation of Korea, grant number 2019R1I1A3A01062109 and the Ministry of Oceans and Fisheries of Republic of Korea for its the research on Advanced Port Construction technology.

Institutional Review Board Statement

Not applicable.

Informed Consent Statement

Not applicable.

Data Availability Statement

Not applicable.

Conflicts of Interest

The authors declare no conflict of interest. The funders had no role in the design of the study; in the collection, analyses, or interpretation of data; in the writing of the manuscript; or in the decision to publish the results.

References

  1. Siebert, S.; Teizer, J. Mobile 3D mapping for surveying earthwork projects using an Unmanned Aerial Vehicle (UAV) system. Autom. Constr. 2014, 41, 1–14. [Google Scholar] [CrossRef]
  2. Howard, J.; Murashov, V.; Branche, C.M. Unmanned aerial vehicles in construction and worker safety. Am. J. Ind. Med. 2017, 61, 3–10. [Google Scholar] [CrossRef]
  3. Mukhamediev, R.I.; Symagulov, A.; Kuchin, Y.; Zaitseva, E.; Bekbotayeva, A.; Yakunin, K.; Assanov, I.; Levashenko, V.; Popova, Y.; Akzhalova, A.; et al. Review of some applications of unmanned aerial vehicles technology in the resource-rich country. Appl. Sci. 2021, 11, 10171. [Google Scholar] [CrossRef]
  4. Oh, J.H.; Lee, C.N. 3D power line extraction from multiple aerial images. Sensors 2017, 17, 2244. [Google Scholar] [CrossRef] [PubMed] [Green Version]
  5. Bognot, J.; Candido, C.G.; Blanco, A.C.; Montelibano, J.R.Y. Building construction progress monitoring using unmanned aerial system (UAS), low-cost photogrammetry, and geographic information system (GIS). ISPRS Ann. Photogramm. Remote Sens. Spat. Inf. Sci. 2018, 4, 41–47. [Google Scholar] [CrossRef] [Green Version]
  6. Oh, J.H.; Jang, Y.J.; Lee, C.N. Accuracy analysis of low-cost UAV photogrammetry for corridor mapping. J. Korean Soc. Surv. Geod. Photogramm. Cartogr. 2018, 36, 565–572. [Google Scholar]
  7. Kaamin, M.; Asrul, N.; Daud, M.E.; Suwandi, A.K.; Sahat, S.; Mokhtar, M.; Ngadiman, N. Volumetric change calculation for a landfill stockpile using UAV photogrammetry. Int. J. Integr. Eng. 2019, 11, 53–62. [Google Scholar]
  8. Baiocchi, V.; Napoleoni, Q.; Tesei, M.; Servodio, G.; Alicandro, M.; Costantino, D. UAV for monitoring the settlement of a landfill. Eur. J. Remote Sens. 2019, 52, 41–52. [Google Scholar] [CrossRef] [Green Version]
  9. Seong, H.W. Proposal of a Model for Construction Error Analysis of RC Pile Foundation Using a Drone and Validation through a Case Study. Master’s Thesis, Chung-ang University, Seoul, Republic of Korea, 2020. [Google Scholar]
  10. Tanda, G.; Balsi, M.; Fallavollita, P.; Chiarabini, V. A UAV-based thermal-imaging approach for the monitoring of urban landfills. Inventions 2020, 5, 55. [Google Scholar] [CrossRef]
  11. Jung, K.Y.; Park, J.K. Roughness analysis of paved road using drone LiDAR and images. J. Korean Soc. Surv. Geod. Photogramm. Cartogr. 2021, 39, 55–63. [Google Scholar]
  12. Suleymanoglu, B.; Gurturk, M.; Yilmaz, Y.; Soycan, A.; Soycan, M. Comparison of unmanned aerial vehicle-LiDAR and image-based mobile mapping system for assessing road geometry parameters via digital terrain models. Transp. Res. Rec. 2023, 2023, 1–10. [Google Scholar] [CrossRef]
  13. Park, J.K.; Jung, K.Y. Accuracy evaluation of earthwork volume calculation according to terrain model generation method. J. Korean Soc. Surv. Geod. Photogramm. Cartogr. 2021, 39, 47–54. [Google Scholar]
  14. Lee, S.B.; Jeong, M.; Auh, S.C.; Kim, J.J. Development of standard work type to utilize drone at expressway construction sites. KSCE J. Civ. Environ. Eng. Res. 2021, 41, 461–478. [Google Scholar]
  15. Mandirola, M.; Casarotti, C.; Peloso, S.; Lanese, I.; Brunesi, E.; Senaldi, I. Use of UAS for damage inspection and assessment of bridge infrastructures. Int. J. Disaster Risk Reduct. 2022, 72, 102824. [Google Scholar] [CrossRef]
  16. Cienciał, A.; Sobura, S.; Sobolewska-Mikulska, K. Optimising land consolidation by implementing UAV technology. Sustainability 2022, 14, 4412. [Google Scholar] [CrossRef]
  17. Liu, X.; Zhu, W.; Lian, X.; Xu, X. Monitoring mining surface settlement with multi-temporal three-dimensional unmanned aerial vehicle point cloud. Remote Sens. 2023, 15, 374. [Google Scholar] [CrossRef]
  18. Zheng, J.; Yao, W.; Lin, X.; Ma, B.; Bai, L. An accurate digital settlement model for deformation detection of coal mining areas using a UAV-based LiDAR. Remote Sens. 2022, 14, 421. [Google Scholar] [CrossRef]
  19. Ganesan, R.; Raajini, X.M.; Nayyar, A.; Sanjeevikumar, P.; Hossain, E.; Ertas, A.H. BOLD: Bio-Inspired Optimized Leader Election for Multiple Drones. Sensors 2020, 20, 3134. [Google Scholar] [CrossRef]
  20. Yayli, U.C.; Kimet, C.; Duru, A.; Cetir, O.; Torun, U.; Aydogan, A.; Padmanaban, S.; Ertas, A. Design optimization of a fixed wing aircraft. Adv. Aircr. Spacecr. Sci. 2017, 4, 65–80. [Google Scholar] [CrossRef]
  21. Choo, Y.S.; Kim, J.H.; Hwang, S.H.; Chung, C.K. The optimization of hyperbolic settlement prediction method with the field data for preloading on the soft ground. J. Korean Geotech. Soc. 2010, 26, 147–159. [Google Scholar] [CrossRef]
  22. Asaoka, A. Observational procedure of settlement prediction. Soils Found. 1978, 18, 87–101. [Google Scholar] [CrossRef] [PubMed] [Green Version]
  23. Muller, A. Assessment of Vertical Accuracy from UAV-LiDAR and Structure from Motion Point Clouds in Floodplain Terrain Mapping. Master’s Thesis, Portland State University, Portland, OR, USA, 2021. [Google Scholar]
  24. Kucharczyk, M.; Hugenholtz, C.; Zou, X. UAV-LiDAR accuracy in vegetated terrain. J. Unmanned Veh. Syst. 2018, 6, 212–234. [Google Scholar]
  25. Shibata, T.; Shuku, T.; Murakimi, A.; Nishimura, S.; Fujisawa, K.; Hasegawa, N.; Nonami, S. Prediction of long-term settlement and evaluation of pore water pressure using particle filter. Soils Found. 2019, 59, 67–83. [Google Scholar]
  26. Park, H.; Kim, H. Analysis of the settlement of Pusan new port construction site using the settlement prediction methods. In Proceedings of the International Symposium on Urban Geotechnics 2009, Inchoen, Korea, 25–26 September 2009. [Google Scholar]
Figure 1. Flowchart of the study.
Applsci 13 08277 g001
Figure 2. Aerial LiDAR measurement principle.
Applsci 13 08277 g002
Figure 3. DTM generation (a) before filtering and (b) after filtering.
Applsci 13 08277 g003
Figure 4. Surface settlement measurement stick.
Applsci 13 08277 g004
Figure 5. Hyperbolic regression.
Applsci 13 08277 g005
Figure 6. Drone and LiDAR sensor.
Applsci 13 08277 g006
Figure 7. Drone Path (three sub-targets).
Applsci 13 08277 g007
Figure 8. A cross section profile AA’ in Figure 3 (Red: June 2020; Yellow: July 2020; Green: January 2021).
Applsci 13 08277 g008
Figure 9. Differential DTM (February 2022 to February 2021).
Applsci 13 08277 g009
Figure 10. Embankment height and cumulative settlement graphs with drone surveying data (surface settlement, K-SK-10~K-SK-19).
Applsci 13 08277 g010aApplsci 13 08277 g010b
Figure 11. Regression of cumulative settlement: (a) K-SK-10, (b) K-SK-11.
Applsci 13 08277 g011
Figure 12. Sites where no surface settlements are installed (blue squares).
Applsci 13 08277 g012
Figure 13. Settlement graphs of sites near K-SK-10 and K-SK-11.
Applsci 13 08277 g013aApplsci 13 08277 g013b
Table 1. LiDAR Specifications.
ItemSpecifications
LiDAR sensorVelodyne Puck VLP-16
Field of View360° × 30°
Maximum distance100 m
Scan rate0.3 million points/s
AccuracyBelow ±3 cm
IMUAPX 15
Roll/Pitch0.015 deg
Table 2. Surface settlements.
No.LocationMeasurementsNum of Data
1.K-SK-10Daily or 1 per 3 days116
2K-SK-11Daily or 1 per 3 days120
3K-SK-14Daily or 1 per 3 days89
4K-SK-19Daily or 1 per 3 days137
Table 3. Drone survey.
No.LocationMeasurementsNum of Data
1K-SK-101~2 per month21
1K-SK-111~2 per month22
1K-SK-141~2 per month19
1K-SK-191~2 per month14
Table 4. Differences between drone-survey settlement and the surface settlement.
LocationAveraged Difference over Time (mm)RMSE Difference over Time (mm)
K-SK-10−84109
K-SK-11656
K-SK-14−185254
K-SK-19−90101
Table 5. The predicted settlements and the rates of consolidation from the drone survey and surface settlement.
Drone SurveySurface SettlementsDifference
Predicted
Settlement
(m)
Predicted
Consolidation
(%)
Predicted
Settlement (m)
Predicted
Consolidation
(%)
Predicted
Settlement
Difference
(mm)
Consolidation
Rate Difference
(%)
K-SK-103.15462.173.16267.06−8−4.88
K-SK-112.48557.152.29362.71192−5.56
K-SK-140.47671.771.38263.33−9068.44
K-SK-191.08558.731.42053.29−3355.43
RMSE4926.23
Table 6. Predicted settlements and rates of consolidation of each point using drone survey at K-SK-10 and K-SK-11.
Location R 2 Predicted Settlement (m)Consolidation (%)
K-SK-10 (surface)0.9883.16267.1
K-SK-100.9683.15462.2
K-SK-10-0010.9902.56071.1
K-SK-10-0020.9902.62973.0
K-SK-10-0030.9353.73760.2
K-SK-10-0040.8951.78894.7
K-SK-11 (surface)0.9912.29362.7
K-SK-110.9432.48557.1
K-SK-11-0010.9222.03462.6
K-SK-11-0020.9682.01859.0
K-SK-11-0030.9682.47953.5
K-SK-11-0040.9343.47749.3
Disclaimer/Publisher’s Note: The statements, opinions and data contained in all publications are solely those of the individual author(s) and contributor(s) and not of MDPI and/or the editor(s). MDPI and/or the editor(s) disclaim responsibility for any injury to people or property resulting from any ideas, methods, instructions or products referred to in the content.