1. Introduction
Modern technological breakthroughs have made it feasible to facilitate artificial intelligence (AI) components in many sectors that are unrelated to computer science. ML components can be found in the form of computer-aided decision-making systems in applications ranging from healthcare to trading and economics [
1,
2,
3]. Nevertheless, most of these models do not offer insight into their prediction processes or how they evaluate the impact of each input factor. Furthermore, as far as healthcare is concerned, ML systems that lack explainability may not be perceived as trustworthy by patients or medical personnel [
4,
5,
6] and they may fail to comply with regulations, which set explanations as a mandatory requirement for automated decision-making systems [
7]. Therefore, if AI is truly set to transform healthcare soon, it would help considerable if it were less opaque.
Conversely, cardiovascular diseases (CVDs) pose a significant health challenge, representing a major cause of mortality worldwide [
8]. According to the World Health Organization (WHO), CVDs accounted for approximately 17.9 million deaths in 2019, constituting 32% of all global fatalities [
9]. In this context, CAD has become a prevalent focus for the implementation of machine learning (ML) prediction models [
10,
11,
12,
13]. These models are utilized to assess CAD risk and have exhibited varying degrees of accuracy. Reported accuracies of such systems range from 71.1% to over 98%, especially when incorporating image data [
14]. However, nearly every ML decision-making system for CAD functions as a black box, simply providing a diagnosis/prediction and minimum information regarding how the result was reached. It is safe to assume that information on the process of making the prediction would greatly enhance the trust factor of such appliances, especially given the fact that they are used by medical personnel.
The explainability aspect of an ML prediction model remains a relatively unexplored field. Most of the existing work on this matter focuses on the image explainability aspect [
15,
16,
17,
18,
19] instead of feature importance explainability, like this project does. Most of the related works employ the Grad-CAM technique to identify the parts of an input image that have the greatest impact on the classification score. Nevertheless, there are some works that touch on non-image explainability. In ref. [
20], the researchers incorporate a rule-based mechanism to increase the knowledge of the proposed system and the explainability of the decision mechanism of their advanced fuzzy cognitive maps (A-FCM) model. In ref. [
21], a dataset of 13 features is passed to a XGBoost prediction model and then possible explainability techniques are presented, such as local interpretable model–agnostic explanation (LIME) [
22] and Shapley additive explanations (SHAP) [
23]. Another study [
24] utilized a dataset consisting of 31 features (mainly medical test results) and 5 ML prediction algorithms (max accuracy 82%) and tackled the explainability issue via the respective SHAP values of the features. Still, there is enough fuzziness regarding CAD applications of ML/DL prediction models that make no use of image data and how common features compare with the common decision process feature evaluation of medical experts and doctors. Additionally, a comprehensive summary of recent studies focused on CAD classification can be found in
Table 1. It is immediately apparent that most of the existing body of research consists of studies utilizing image data from SPECT and PET scans. Moreover, certain studies include the medical expert’s diagnosis as input. The current work is differentiated on both these major aspects. Firstly, the dataset used contains no images, just clinical information. Secondly, it does not use the doctor’s opinion as a reference, which makes the proposed model pure AI, with no human input. These two differentiations are also the two most contributing factors that enable the proposed model to function as a preliminary computer-aided diagnosis system for cardiovascular diseases for primary health care. It could help decongest the NHS by enabling medical experts to pinpoint unhealthy patients accurately and early. A detailed discussion and comparison of these findings with the results of the present study are elaborated upon in the discussion section.
By leveraging the SHAP explainability technique and Cohen effect sizes, we aim to emphasize the significance of each feature in the chosen prediction model, which is built based on the Catboost algorithm. These analytical approaches enable us to gain insights into how individual features contribute to the model’s predictions, shedding light on their relative importance and impact on the overall classification process. We examine the entire feature set (consisting of 27 features), as well as the specific feature subset, as it was created through a feature selection process. Additionally, we highlight established common patterns between the feature subset of the model and common risk factors for CAD by checking whether these results are in agreement with the contemporary literature on cardiovascular diseases. Thus, overall, the three major axes of this work can be summed up as follows: (1) explaining the prediction results of a blackbox ML algorithm for CAD diagnosis; (2) exploring common patterns in feature selection/importance for ML prediction models and lastly, (3) we will compare the results with expected outcomes related to the prevailing determinants of CAD and evaluate the clinical credibility of this AI-driven decision-making system.
The remainder of this paper is structured as follows. In
Section 2, we present the patient dataset and provide a concise overview of the ML prediction model utilized in this study. Feature importance plots for the prediction model and feature dataset are presented in
Section 3. In
Section 4, there is an analysis of how the model weights its input data, and the common patterns and limitations of these results are discussed. It is in this section that a discussion of the findings from the medical expert’s point of view is offered as well. Finally, some concluding remarks and future directions are provided in
Section 5.
2. Materials and Methods
2.1. Patient Population
This study encompasses a comprehensive dataset comprising 571 participants. Within this population, 248 patients are confirmed to have CAD based on ICA testing, accounting for 43.43% of the total cohort, while the remaining participants are considered healthy controls. The subjects in this patient population display notable diversity in their biometric and clinical data. Regarding demographics, approximately 79.68% of the entries correspond to male participants, with ages spanning from 32 to 90 years and body mass index (BMI) values ranging from 16.53 (underweight) to 87.2 (extremely obese). Additionally, various clinical data, such as arterial hypertension and chronic kidney disease, are combined with lifestyle factors like smoking status and diagnostic resting electrocardiogram results. The complete list of 27 features is presented in detail in
Table 2.
For this study, we opted to explain just the best-performing dataset without the expert’s diagnosis. Including the expert’s diagnosis as an input datum can enhance the accuracy of a prediction model. Nevertheless, the doctor’s diagnosis encapsulates all the data from medical tests, images and medical history of a patient and other features. Hence, some features’ importance is already represented in the expert’s diagnosis. Without a doubt, this is especially true for the most common risk factors for CAD, as they tend to have a greater impact on the decision process of the doctor. Thus, by choosing this approach, even though the prediction accuracy may be somewhat lesser, we believe we can purely capture the decision making process of the algorithm/model and showcase the “true” weight the algorithm assigns to each of the input features.
In this study, all patients included in the dataset underwent gated-SPECT myocardial perfusion imaging (MPI) as part of the diagnostic process. Additionally, within 60 days of the MPI, ICA was performed to further investigate their condition. The results obtained from the ICA procedure were considered the definitive ground truth for determining the actual CAD condition (affected or healthy) of each patient. These ICA-confirmed results served as the gold standard for the analysis and evaluation of the prediction models in the current research.
The patient data used in this study were collected from the Clinical Sector of the Department of Nuclear Medicine at the University Hospital of Patras from 16 February 2018 to 30 June 2022. The study was conducted with the approval of the Ethical and Research Committee of the University Hospital of Patras, under protocol number 108/10-3-2022. As a retrospective study, the requirement for obtaining informed consent from the participants was waived. During the data acquisition process, the anonymity of the subjects was strictly maintained to ensure their privacy and confidentiality. Moreover, all procedures carried out in this study were in full compliance with the principles outlined in the Declaration of Helsinki, which sets ethical guidelines for medical research involving human subjects.
2.2. ML Prediction Models
This study employs a prediction model based on the well-documented CatBoost ML algorithm [
34]. This is a state-of-the-art ML classification algorithm, and it is widely used by the research community, especially on medical datasets, with proven efficacy [
35,
36,
37,
38,
39]. It is arguably one of the most accurate and modern algorithms in this field of research. Hence, an explainability approach for it could form a step towards shedding light on the black-box mechanisms for its other applications as well.
Moreover, a data preselection function and hyper-parameter selection were run. For this particular scenario, implementing the forwards sequential feature selection [
40] algorithm gave the best-performing feature subset. Thus, the current prediction model uses a dedicated feature subset to achieve maximum prediction accuracy. As far as training and testing splitting is concerned, a 10-fold stratified cross validation [
41] was selected. By implementing stratified sampling, the training subsets had the same percentage of CAD-positive inputs as the original dataset (i.e., 43.43%). On this matter, the dataset was split in a 90/10 analogy (training/testing set) and the prediction results were validated across multiple runs. The model achieved the best performance with specific values for its main initialization parameters; specifically, the n_estimators parameter was tuned to ‘79’ and the learning_rate parameter to ‘0.1’. Eventually, the performance of the deployed prediction model was evaluated using five common metric scores: accuracy, sensitivity, specificity, Jaccard score, F1-score and a confusion matrix.
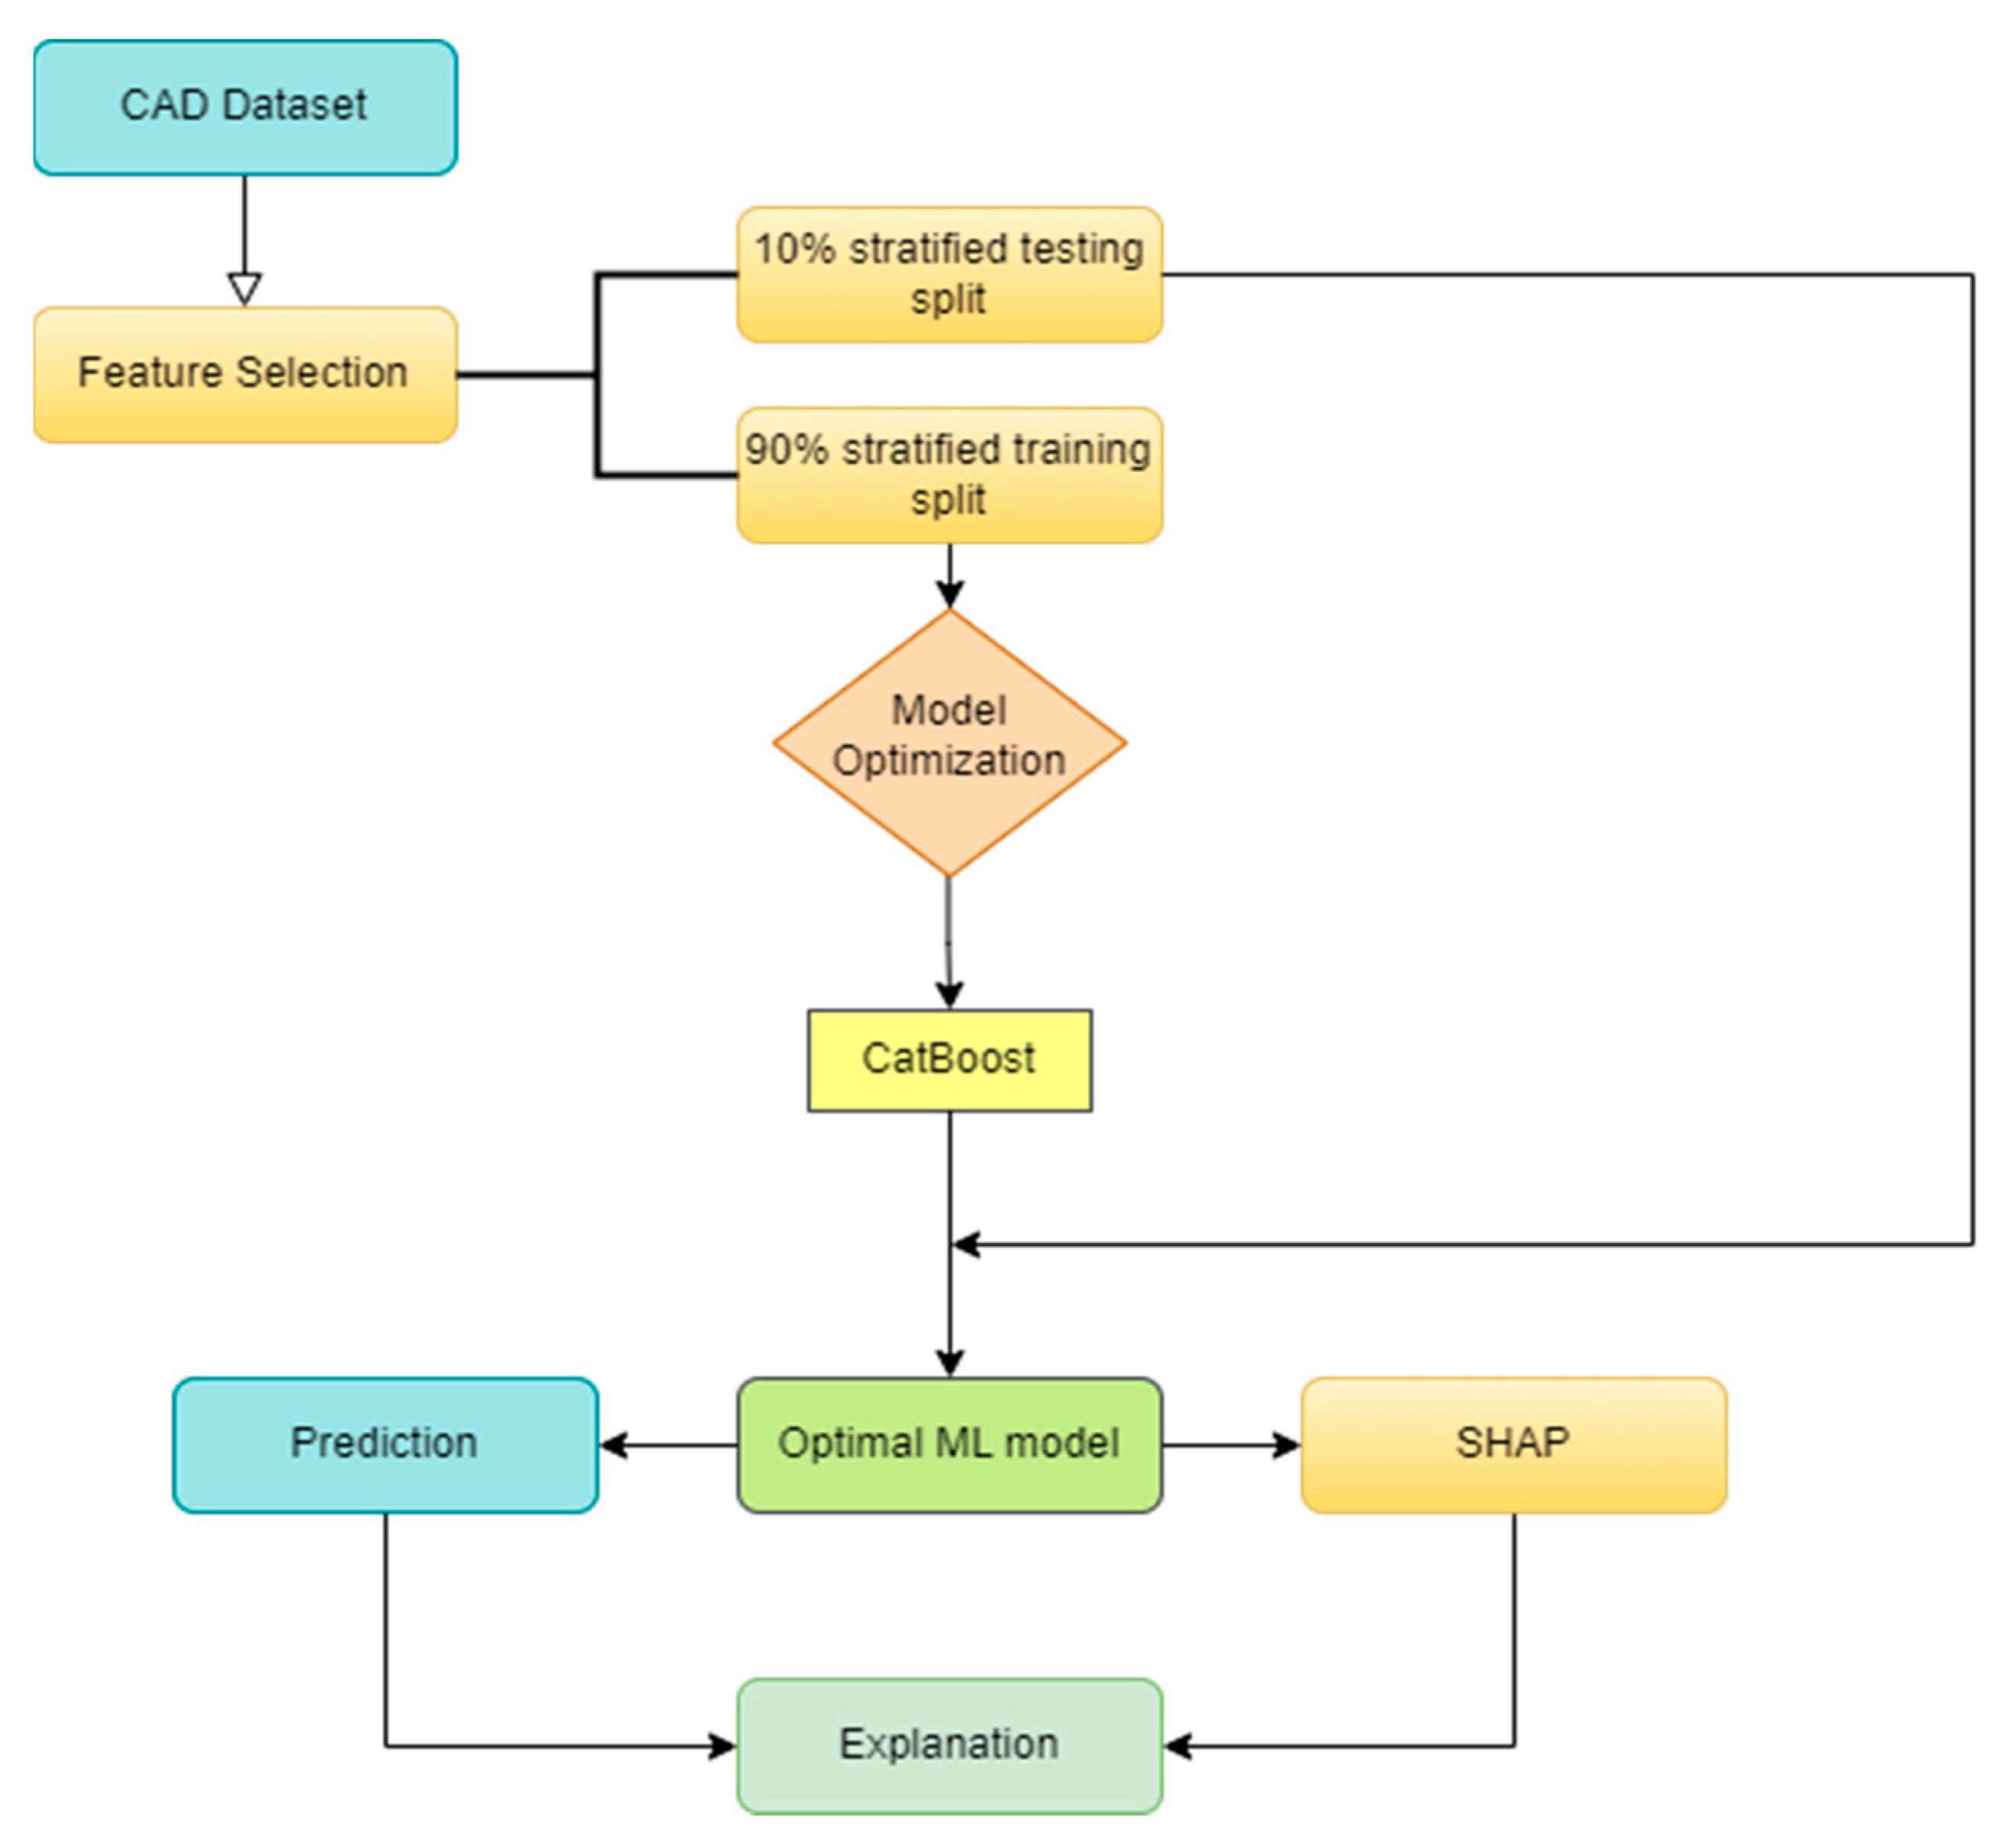
Overall, the complete methodology of this work, as depicted in
Figure 1, can be summed up in 4 steps:
Feature selection/model optimization;
Training/testing of ML model;
Plotting SHAP on the prediction results;
Explainability of prediction results.
2.3. Explainability
To tackle the problem of explaining a black-box ML prediction model, two main analytical approaches were employed in tandem; Cohen effect sizes and SHAP analysis. These two widely established techniques are used in many scientific fields to analyze datasets and the results of experiments.
The Cohen effect size (Cohen’s d), introduced in 1969 [
42], is a statistical measure used to quantify the magnitude of the difference between two groups. It is particularly useful when comparing the performance of different features or algorithms in machine learning. To calculate Cohen’s d, the difference between the means of the two groups is divided by the pooled standard deviation of the two groups. The resulting value represents the effect size, indicating the magnitude of the difference between the groups. A Cohen’s d value of 0.2 is considered small, 0.5 is considered medium and 0.8 is considered large. By using Cohen’s d in machine learning, researchers can gain insights into the significance of differences between various features or models. It helps in making more informed decisions when selecting a model for a specific task, as it allows for a better understanding of the performance variations among different algorithms or features. Several studies have highlighted the importance of using Cohen’s d to improve the interpretability and decision making in machine learning tasks [
43,
44].
SHAP (SHapley Additive exPlanations) [
45] is a well-established technique used to enhance the transparency and explainability of machine learning prediction models. It is based on concepts from cooperative game theory and offers valuable insights into how each feature contributes to the model’s predictions. The SHAP method approaches explainability by treating each feature as a "player" in a game, and the ultimate prediction as the game’s goal. It then allocates the responsibility for the prediction to all the features in a fair manner. In simpler terms, SHAP assigns an importance value to each feature for a particular prediction, indicating how much that feature influences the outcome. By employing SHAP, researchers and practitioners can gain a deeper understanding of the model’s decision making process. It enables them to identify which features play crucial roles in the prediction, providing valuable insights into how the model arrived at its conclusions. This method is particularly useful in scenarios where model interpretability is essential for building trust and confidence in the AI-powered decision-making system.
First introduced by Shapley in 1953 [
23], the Shapley value is a mathematical concept in game theory that aims to assign “pay-outs” to players of a game based on their individual contribution to the overall goal/pay-out of the game. Players can form coalitions and work towards the final goal in a collaborative fashion. Thus, this method highlights the effectiveness of certain combinations and the contributions of each player of the game. By applying this concept in ML prediction models, each feature of the dataset is considered a player and the prediction is the final goal/pay-out. The Shapley values indicate the importance of each feature and the most effective combinations, thus giving an explainability factor to the whole system. By comparing the difference between the prediction of a single feature and the average prediction value of all features, we obtain the total “gains” achieved by it. If this is for a set of features, then the “gains” are split accordingly between the players/features taking part.
Consequently, the SHAP technique calculates the mean prediction value of the model. The next step is to calculate the relative contribution of all features to the deviation (positive or negative) from the mean prediction value of the model. Ergo, by adding this final step to the procedure of this work, as depicted in
Figure 1, we try to shed more light on the mechanics of an otherwise black-box decision-making computer-aided system. By showing the individual contributions of each feature to the final prediction value, the user of this system can elaborate on/rationalize the result and even justify predictions that would normally alienate them.
3. Results
In this section of the paper, we present plots that will be useful for interpreting the decision process of each model and highlight the reasoning behind each prediction. We will explore the behavior of the model while using only the selected fields of its dedicated feature subset as input. In order to address the explainability issue, for each of the afore-mentioned two cases covered by this work, we present the following plots and charts:
the Cohen effect sizes chart;
the SHAP values summary plot;
a waterfall plot describing the way each feature contributed towards the prediction for a CAD (unhealthy) instance;
a waterfall plot describing the way each feature contributed towards the prediction for a NO-CAD (healthy) instance.
As explained in the Introduction section, one major benefit of this approach is that the CAD/NO-CAD (healthy/unhealthy) criterion is based on the results of the ICA procedure (golden truth) and not the expert’s diagnosis. Thus, when referencing the health status of an entry we are, in fact, using the outcome of the procedure.
3.1. Performance Metrics for CatBoost Model
Two test scenarios were conducted in this section. Firstly, the model’s performance was assessed using the entire dataset as input. Subsequently, the model’s behavior was examined when only the selected fields of its dedicated feature subset were used as input. The evaluation metric scores reached by the CatBoost ML algorithm-based prediction model are presented in
Table 3. The middle column depicts the scores and the relative standard deviations (STD) when the algorithm uses the dataset in its entirety, while the right one depicts the same scores when its input is just the fields from the subset selected by the sequential feature selection algorithm.
The features that comprise the dedicated feature subset, which was created through the forwards SFS algorithm, are the following:
[‘known CAD’, ‘previous PCI’, ‘previous CABG’, ‘previous Stroke’, ‘Diabetes’, ‘Smoking’, ‘Angiopathy’, ‘Chronic Kidney Disease’, ‘Angina-like’, ‘Precordial Pain ’, ‘RST ECG’, ‘Sex’, ‘Obese’, ‘40–50’, ‘50–60’]
3.2. Explainability Plots for CatBoost Using Dedicated Subset as Input
In this test case, instead of using the whole dataset as input, the algorithm uses the dedicated subset created through feature selection. Hence, the importance weights refer to only the selected features. In the same fashion, just these selected features contribute to the final resulting prediction. In the same way as before, feature values in the SHAP diagrams can be either ‘0’ or ‘1’. Specifically, a value of ‘1’ indicates the positive case (e.g., male = 1, identifies the specific patient as male).
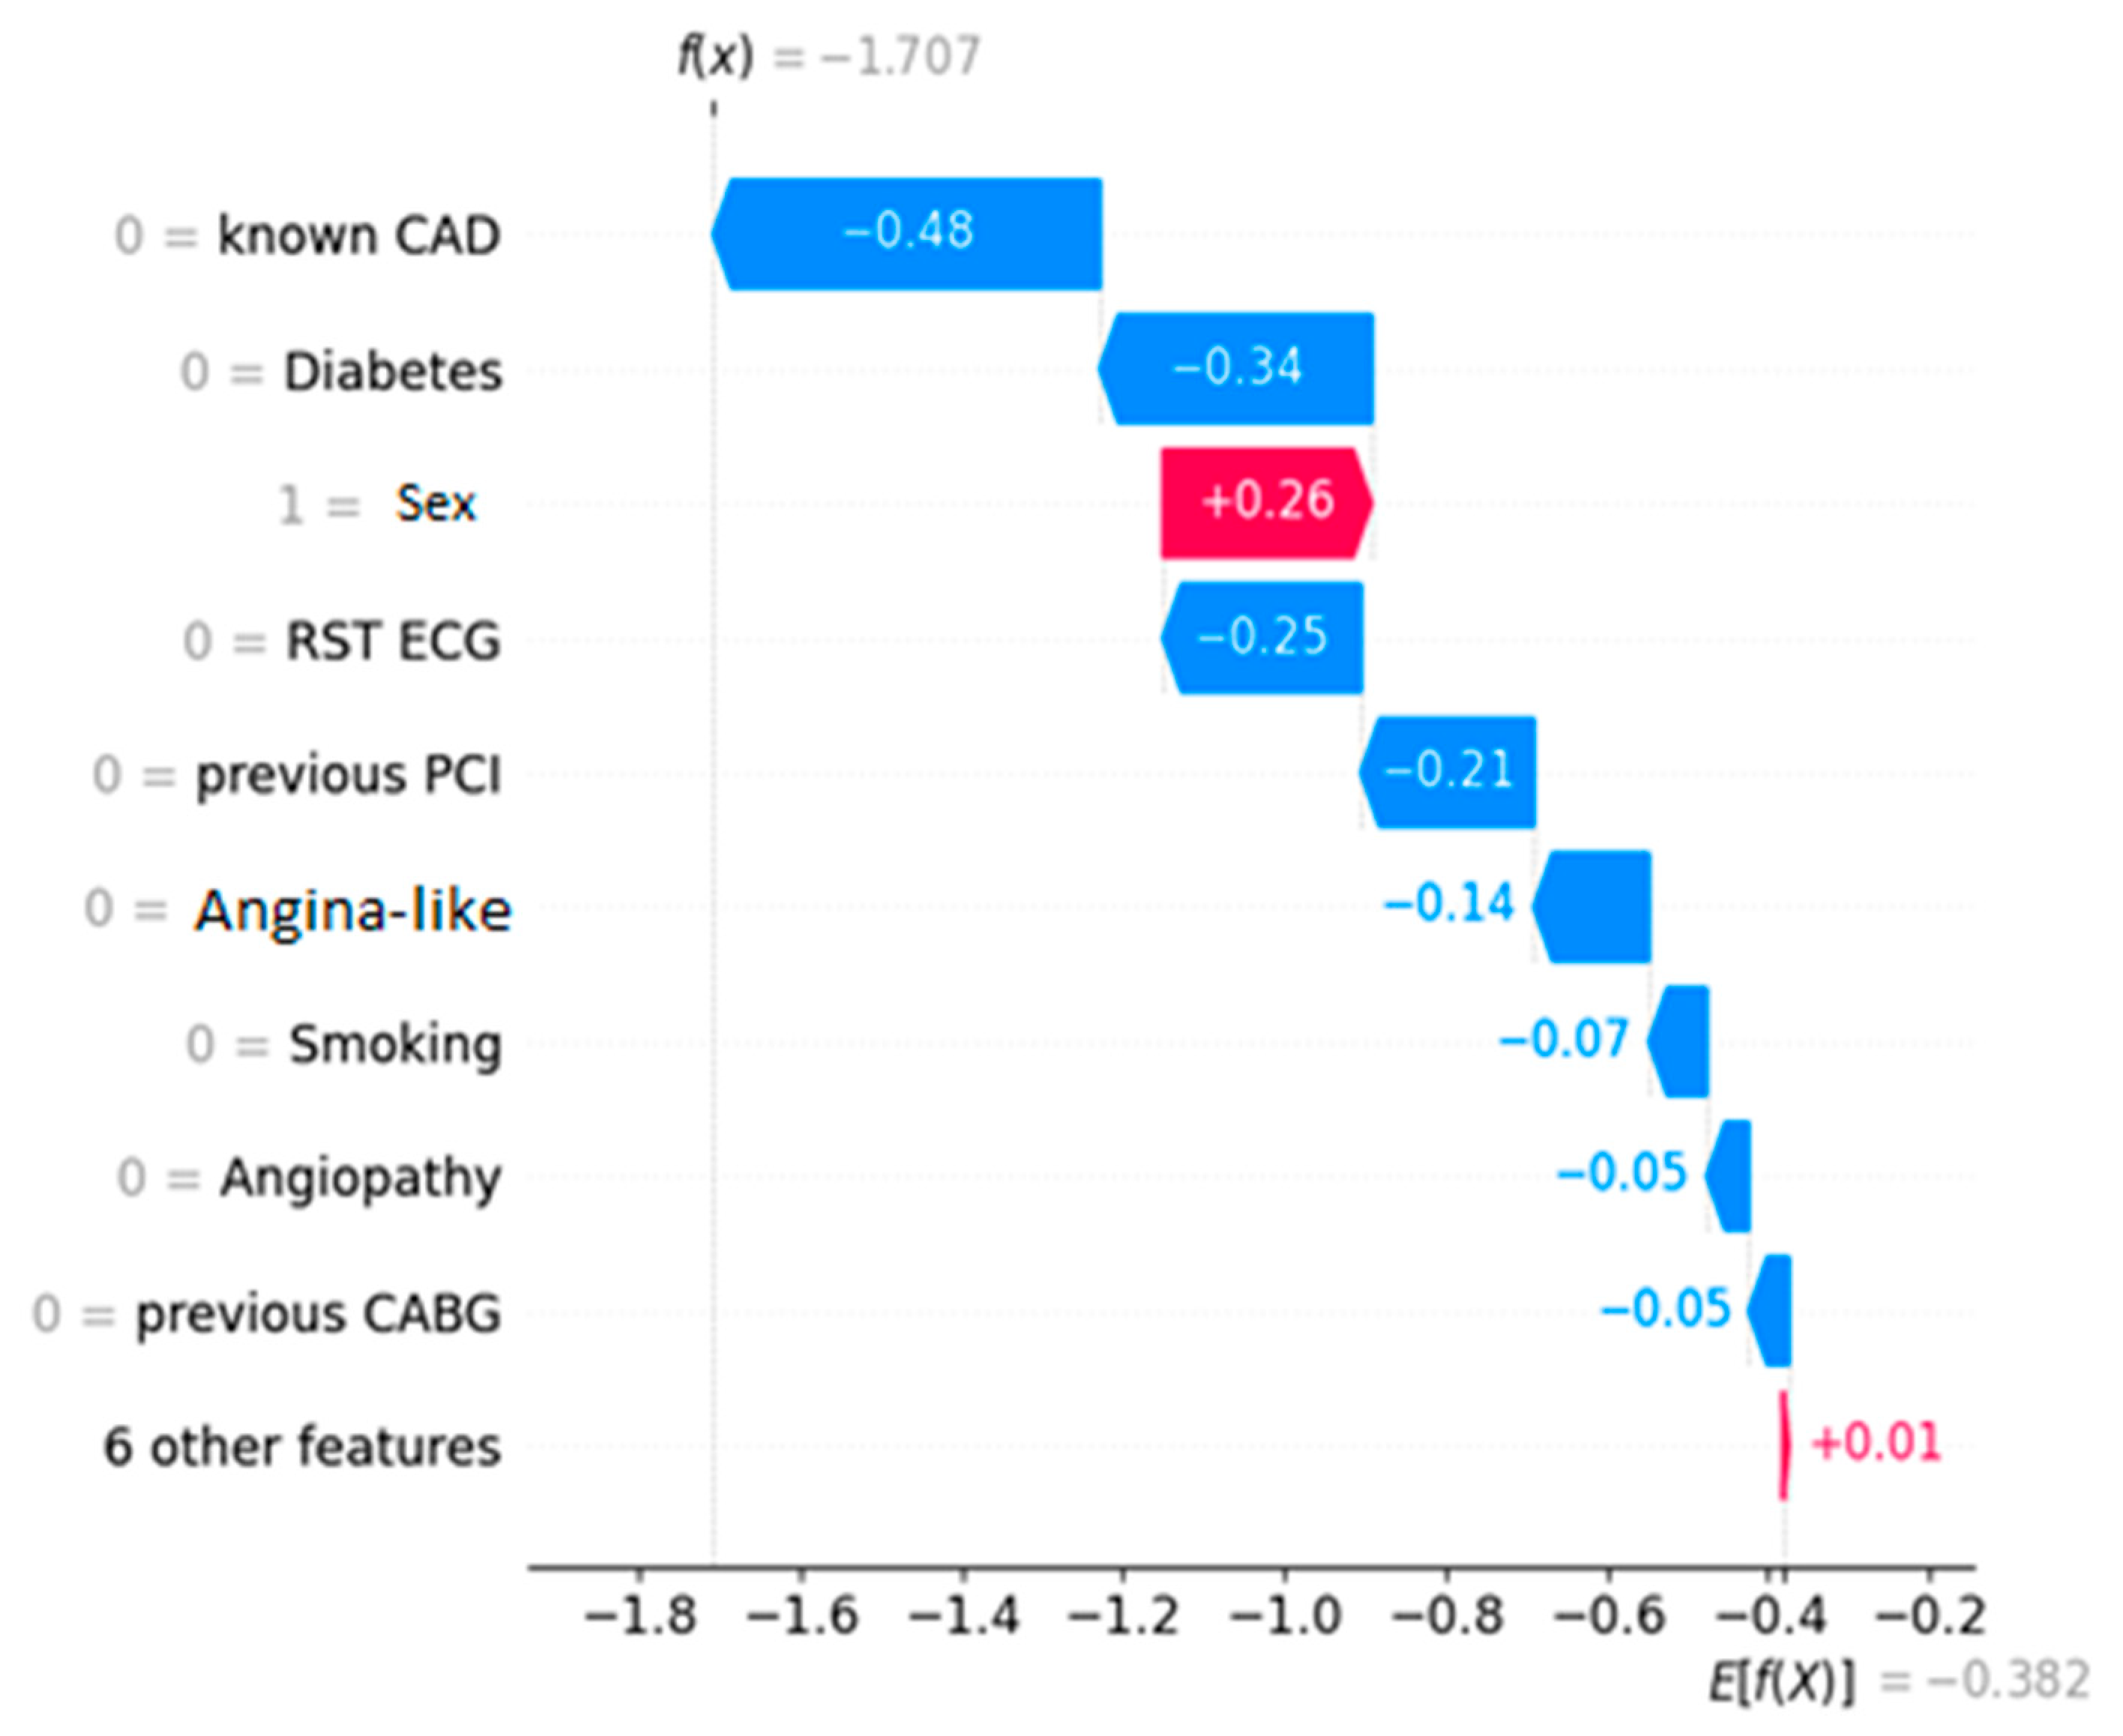
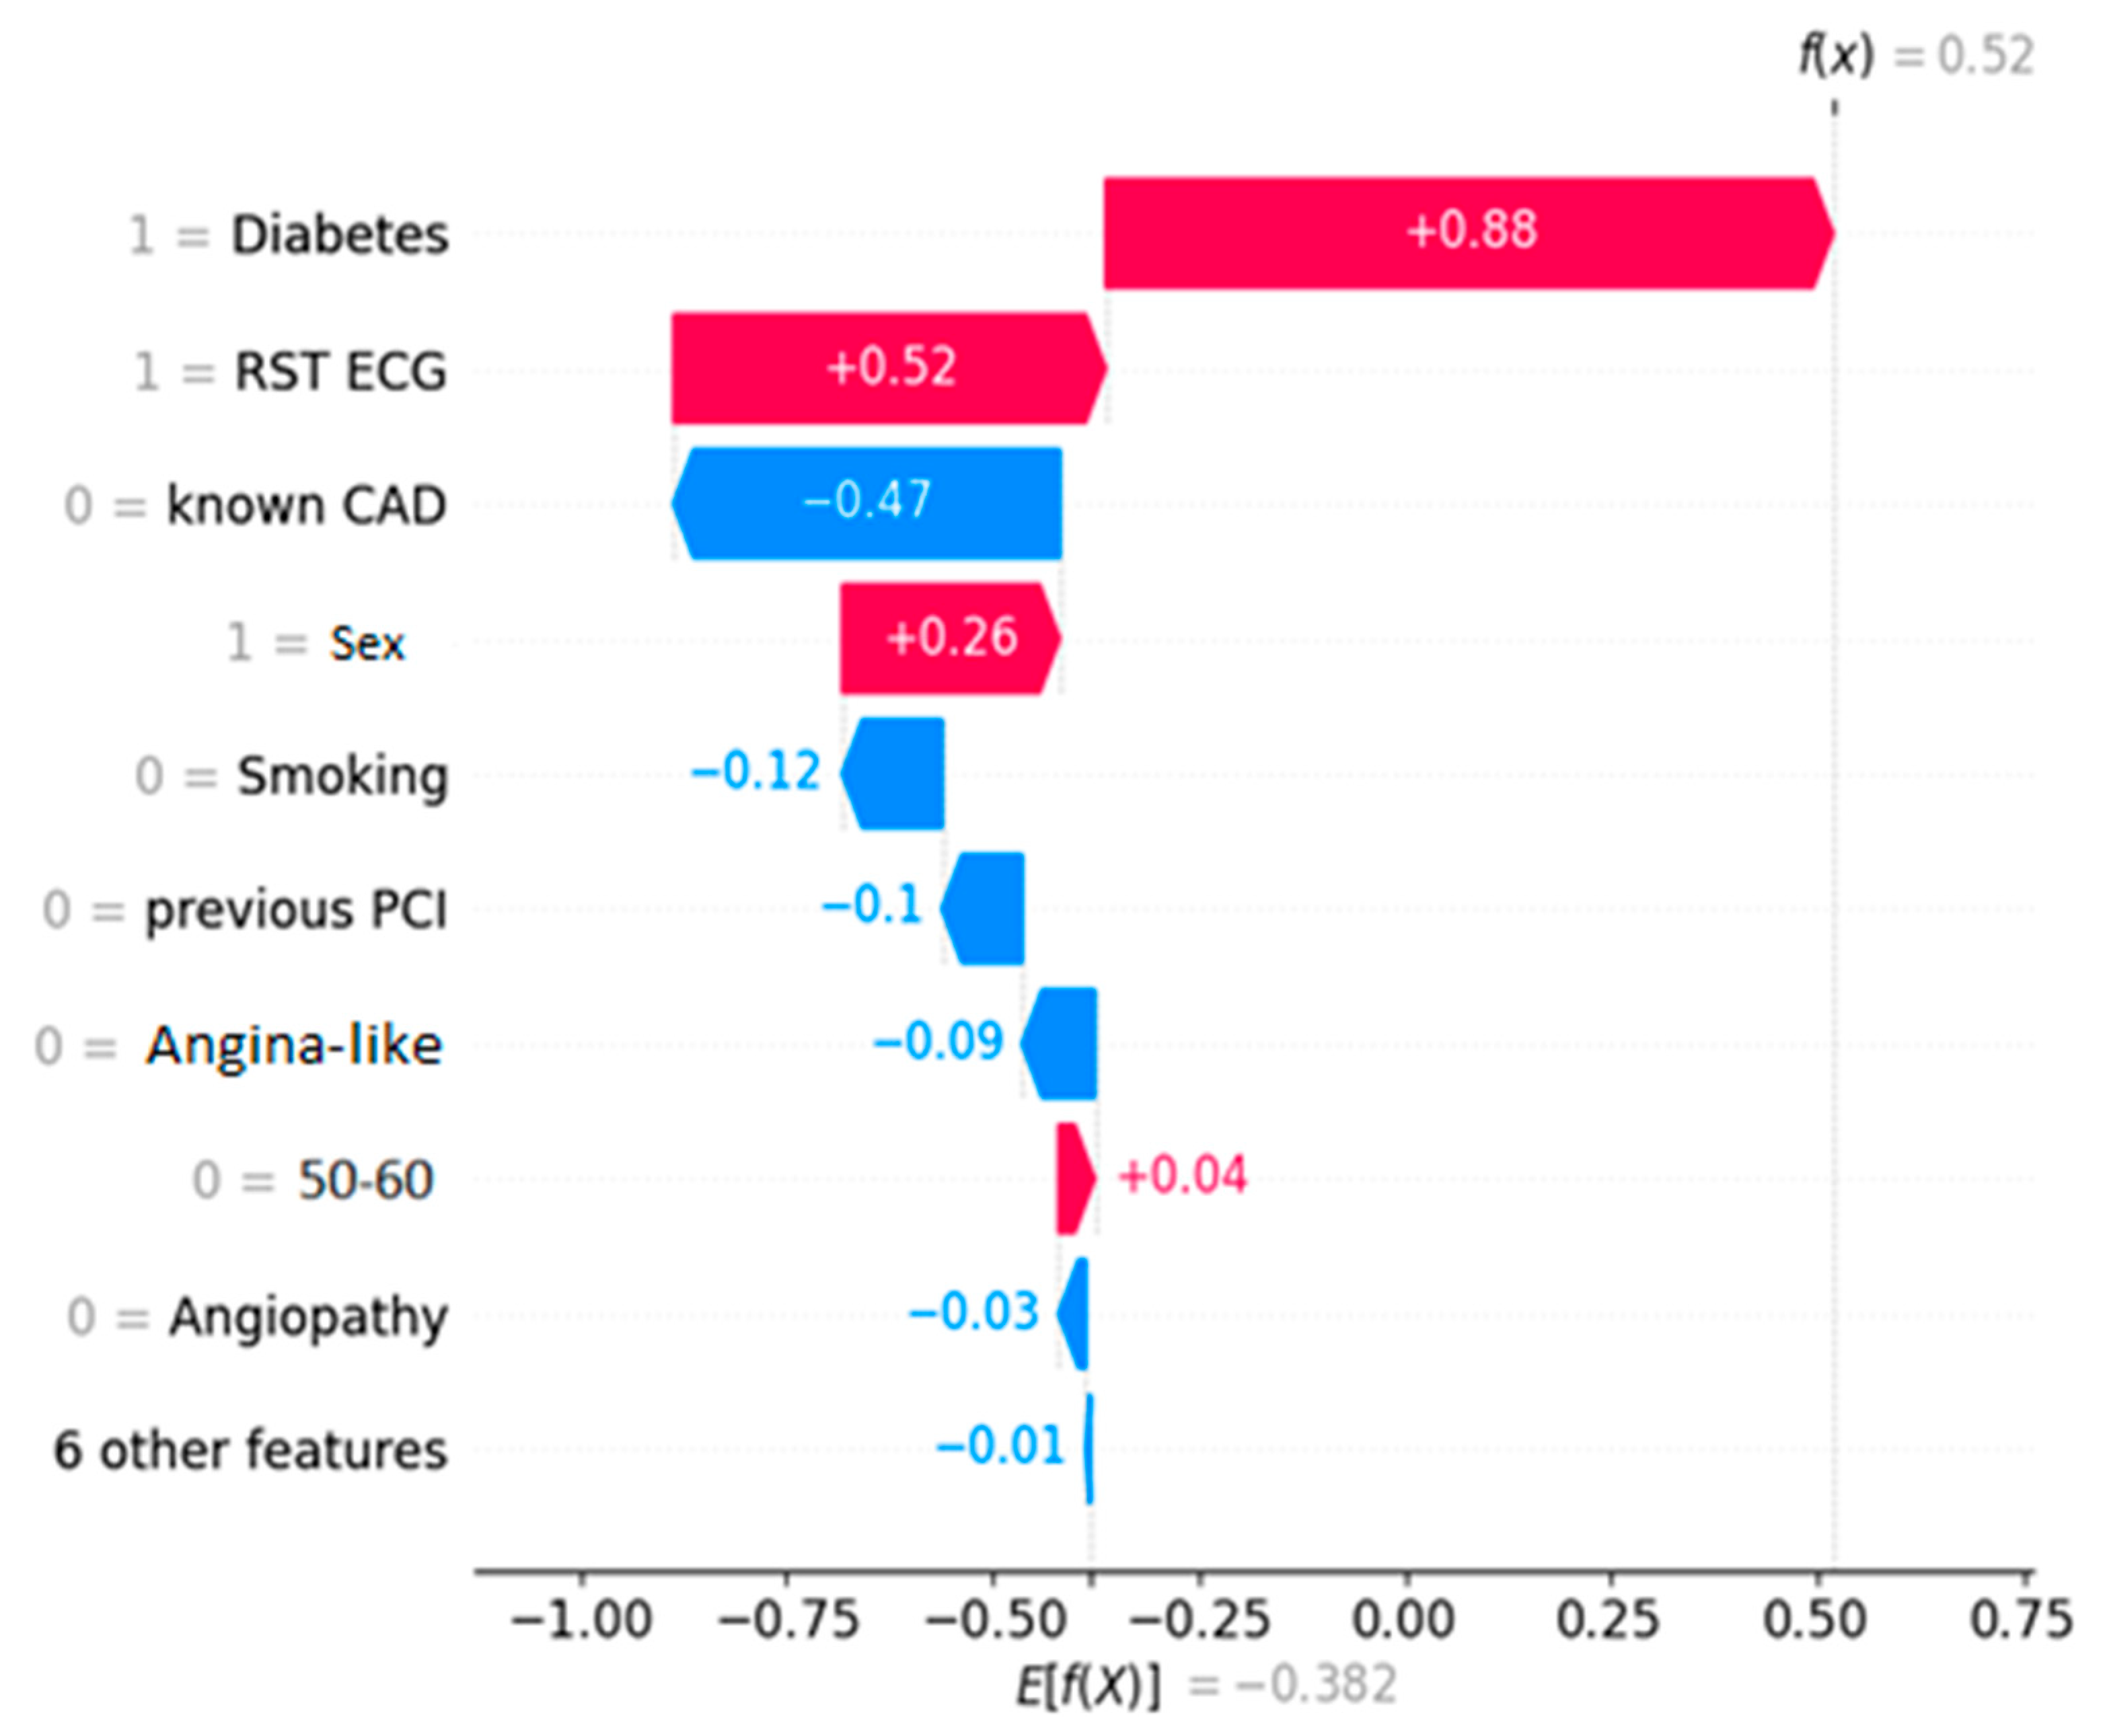
Figure 2 depicts the decision process for a healthy entry, while
Figure 3 shows an unhealthy one, both ICA-confirmed. The decision threshold for the algorithm is E[f(x)] = −0.382. The latter essentially means that any prediction score lower than this value classifies the instance as NO-CAD, whereas prediction scores higher than the threshold classify it as CAD. The prediction score for each instance is noted on the plots as f(x). Every feature depending on its value “drives” the outcome towards a specific class, and the eventual equilibrium decides the prediction score.
4. Discussion
The main focus of this work is to illustrate the decision process of a black-box computer-aided decision-making model. Within this scope, the proposed explainability analysis offers valuable insight as to which features were the most essential for the classification and how each datum contributed to the final outcome. Below, we will explain what these figures showcase and then we will discuss these findings from a medical viewpoint.
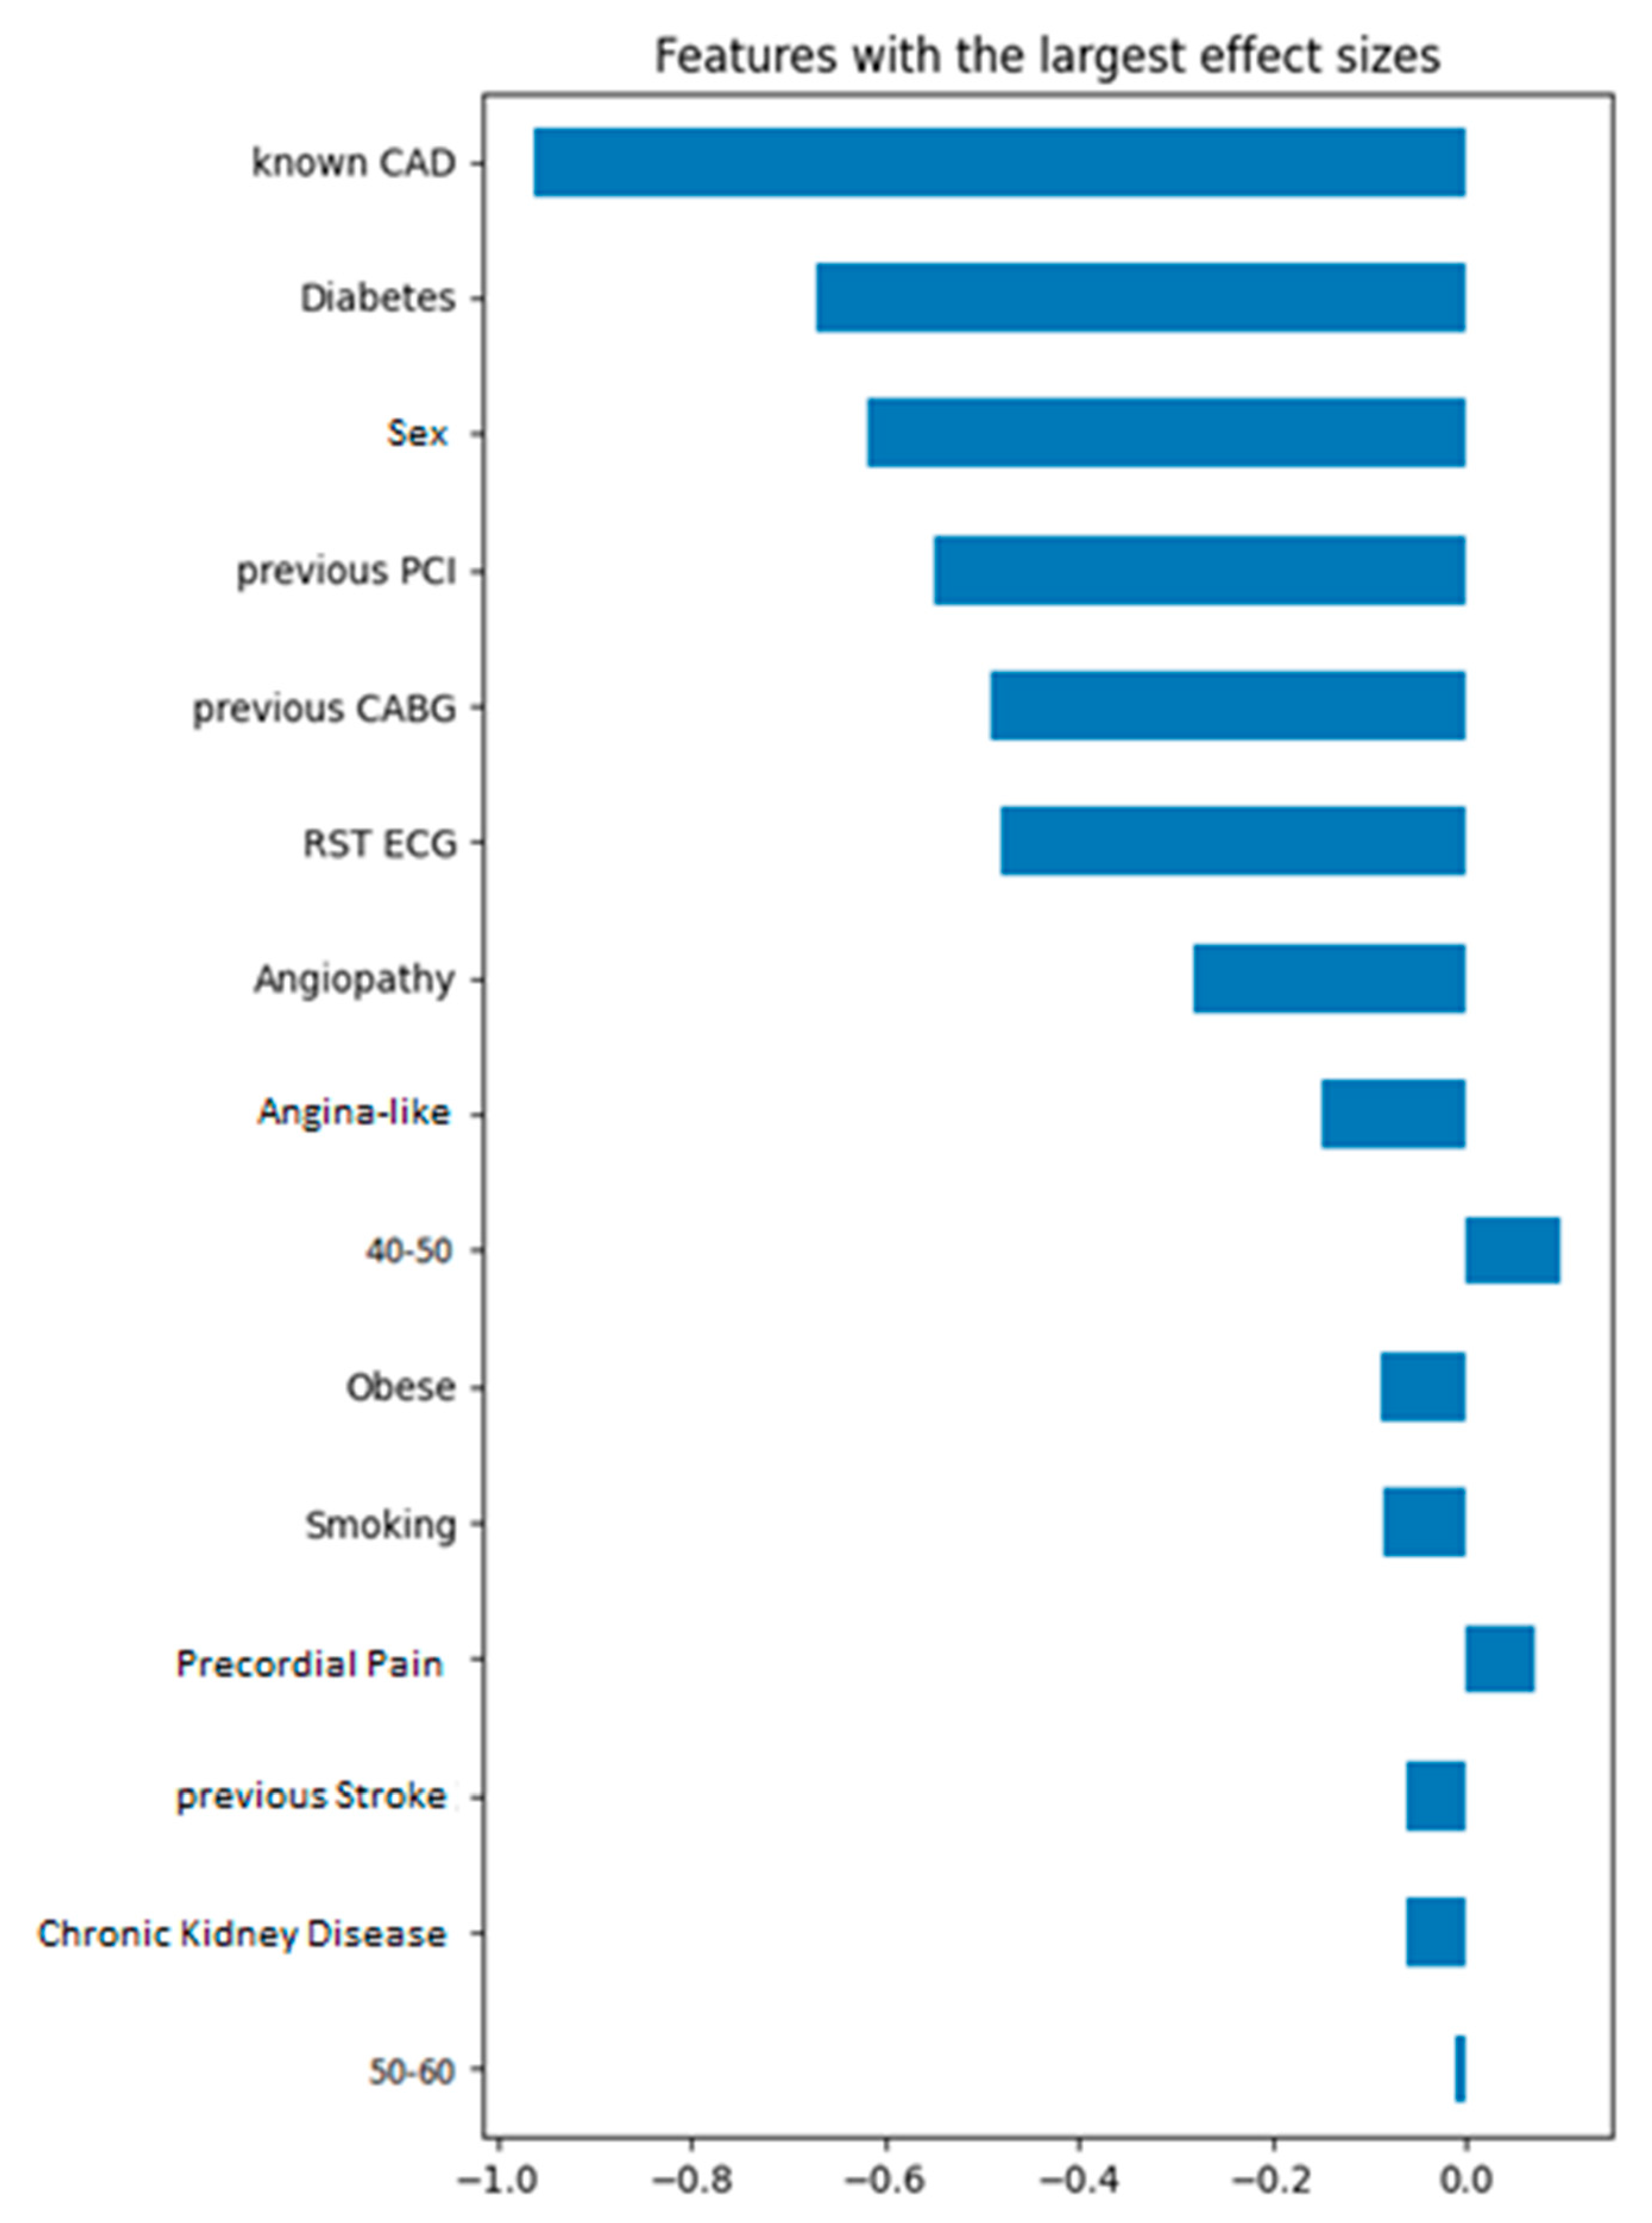
Cohen effect sizes (
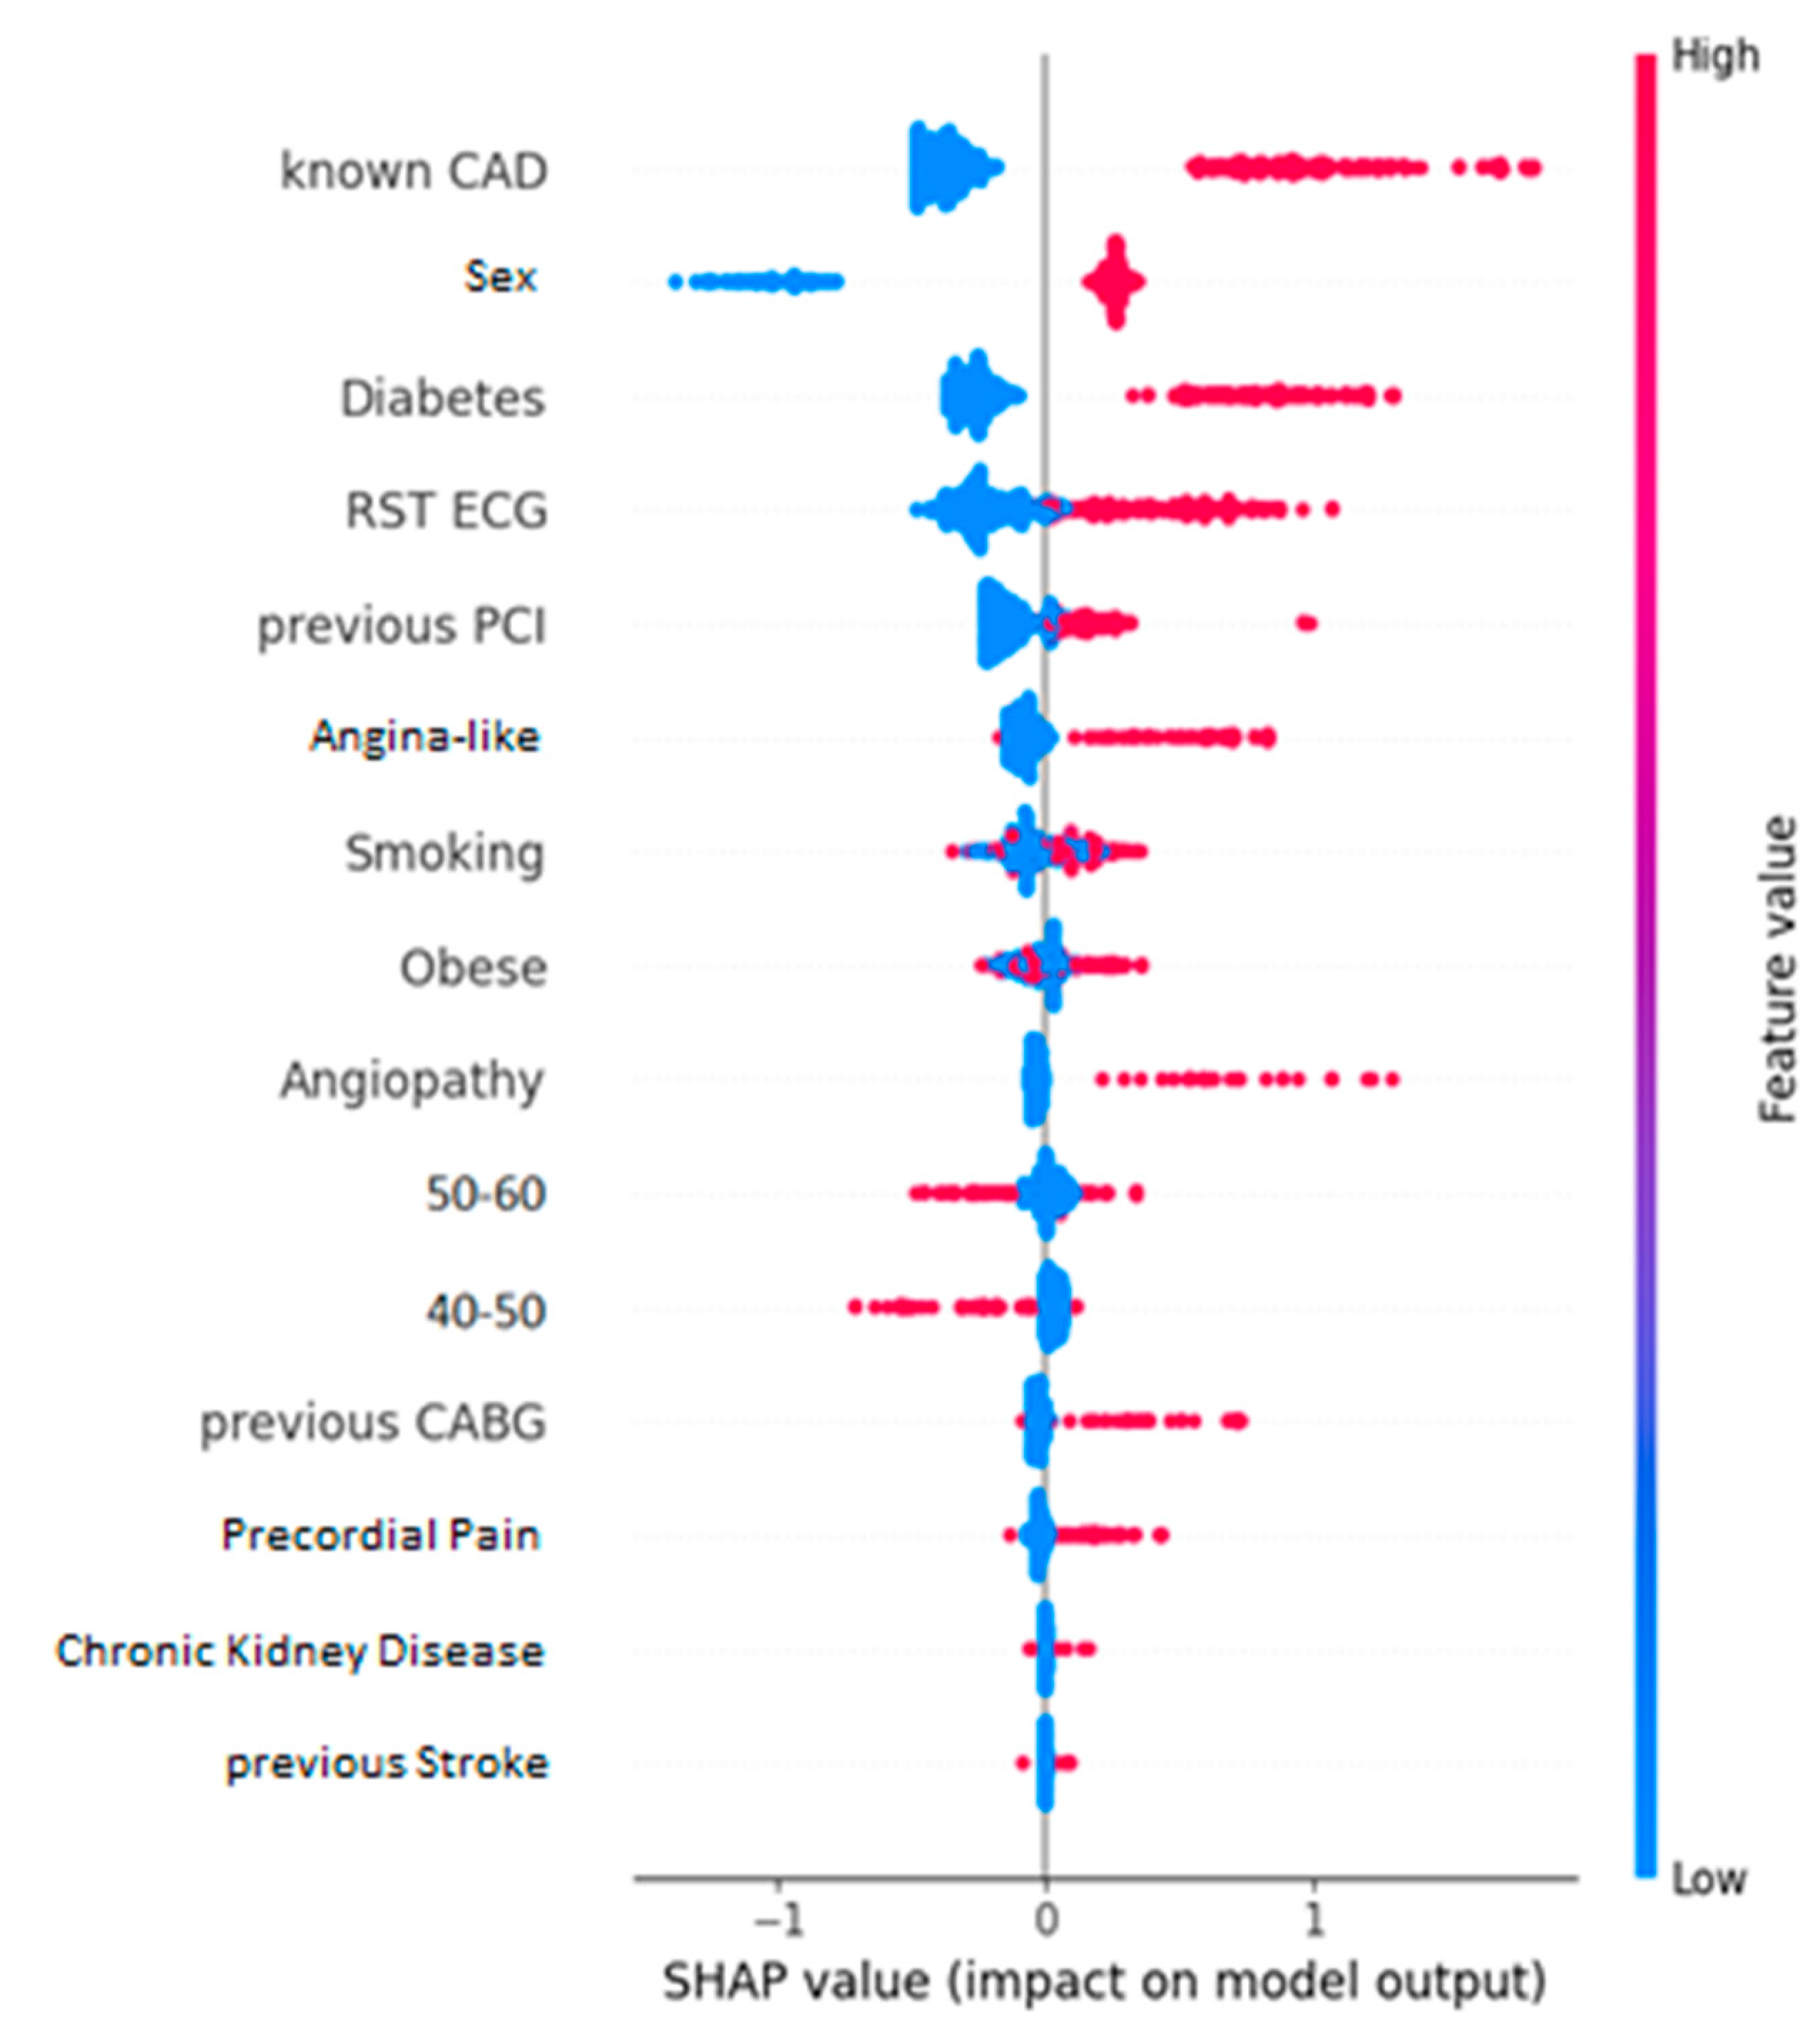
Figure 4) and their relative SHAP values (
Figure 5) showcase an increased degree of similarity when it comes to identifying the most influencing features of the dataset. In both cases, it seems the most impactful kind of information is whether the entry previously had a CAD condition. Additionally, two more features that appear to play a major role are whether the patient is diabetic and their sex. Specifically, if the patient is diabetic or is male, they are more likely to have CAD than otherwise. Unsurprisingly, all these features are well-documented risk factors for CAD [
46,
47,
48,
49,
50,
51,
52,
53]. Other factors that also contribute much to the classification are the level of exercise of the entry (RST ECG) and age. Moreover, these plots highlight that patients who exercise little to never or are between 40 and 50 years of age seem to be more prone to CAD. Alternatively, individuals who engage in regular physical activity and are younger than 40 years old tend to have a lower susceptibility to CAD, as indicated by higher values of RST ECG. These findings are in line with the existing medical literature on cardiovascular diseases and their associated risk factors [
46,
47,
48,
49,
50,
51,
52,
53]. The Cohen effect size chart leads to observations that not only match with the ones from the SHAP summary plot, but also perfectly align with the established knowledge in this field.
The waterfall plots showcase the decision process for a NO-CAD subject (
Figure 2) and a CAD one (
Figure 3). These plots showcase how each feature “pushes” the decision towards the CAD or the NO-CAD class. This classification is based on the decision threshold, which for this problem is equal to -0.382. Each feature adds (equivalent of “pushing” right) or subtracts (equivalent of “pushing” left) to the prediction score, and eventually, if this is higher than the threshold of -0.382, the entry is classified as a CAD instance. In lieu of this information, a human doctor can assimilate the prediction process of the black-box model and determine the outcome by knowing which factors contributed to the prediction and by how much.
By comparing the evaluation metrics (
Table 3) of the two scenarios (entire dataset as input vs. dedicated feature subset as input), it is evident that the selected feature subset leads to a far better prediction accuracy. Not only does the information depicted in
Table 3 indicate a more accurate model when using a subset, but the true positive rate (sensitivity) and true negative rate (specificity) increase too. Hence, when using a stripped-down dataset as input, the model isolates the true condition of the subjects far more accurately. It is especially important to have a better true positive rate, because false positive instances can lead to increased costs and congestion of the healthcare system. This increase in performance is logical, given the fact that this dedicated subset contains the more important features, while also missing out factors that may confuse the model or contribute less to the decision process. Moreover, the majority of the most common risk factors for CAD are present in the dedicated feature subset, which further contributes to the legitimacy of the feature selection process from the viewpoint of a human medical expert/doctor.
Considering the existing body of research, it is evident that it primarily consists of studies that utilize image data from SPECT and PET scans in the context of CAD classification. Furthermore, some studies incorporate the medical expert’s diagnosis as an input. It is also evident that these studies achieve better performance metrics than the current work. The nature of the dataset deployed in the current study makes it impossible to achieve top-of-class accuracy for CAD classification. More specifically, without the use of data from medical scans or the medical expert’s input, this model cannot compete with others that contain such information. Nevertheless, not only is this singularity what enables the proposed model to serve as a preliminary computer-aided diagnosis system for cardiovascular diseases in primary healthcare, but also it does achieve results on par with medical experts for this particular dataset (i.e., model’s accuracy: 78.82% versus doctor’s accuracy: 78.81%). By accurately identifying unhealthy patients at an early stage, it could assist in alleviating the strain on healthcare systems like the NHS. Other proposed models, though more accurate, cannot be used in such a manner, mainly because general practitioners and family doctors that comprise the primary healthcare system do not have access to tomographs nor to cardiologists and nuclear doctors like hospitals do to collect all the data needed for the rest of the prediction models to function properly.
In summary, incorporating explainability mechanisms like Cohen effect sizes and SHAP values in machine learning models enhances our comprehension regarding the prediction making process and factors influencing decisions. This fosters trust and makes these prediction tools more appealing to the medical community. Furthermore, the insights gained from explainability can serve as a suggestion tool, aiding in the identification of outlier cases and potential errors in input data. This, in turn, leads to more precise predictions and better diagnosis of CAD. Ultimately, the integration of explainability mechanisms contributes to advancing the field of medical diagnosis.
Nevertheless, this study has certain limitations. Specifically, the data used as input in the current work lack any image data. Image data derived from SPECT/PET examinations hold crucial information that is widely used by medical experts to assess the health condition of a patient. Thus, we consider it highly likely that incorporating such images into the input dataset would further improve the prediction accuracy of a decision model for CAD/NO-CAD classification. Furthermore, the patient population in this dataset are all people from roughly the same country/region. This low geographic diversity/dispersion means that these people share a common lifestyle and nutritional habits. Therefore, it is possible that certain risk factors were more prevalent than others due to this fact.
5. Conclusions
The main objective of this work is to provide an explainable model that sheds light on a black-box prediction system for predicting CAD classification by offering an explainability aspect for its decision process. By utilizing SHAP analysis and Cohen effect sizes for the features, we highlight exactly which features contributed the most to the prediction mechanism. These findings can be of great significance because they make predictions about something more than just an outcome. The human user would be able to access the reasoning behind the prediction of the AI model and assess it accordingly. Ergo, it makes it more feasible and easier to facilitate a much-needed trust factor between the AI model and its human medical user. This trust is paramount, especially in the medical field, given the impact of such a prediction.
Another key takeaway of this study is that the AI prediction system shows an almost complete alignment with the contemporary literature and research on the matter of CAD. The most common risk factors for CAD [
37,
38,
39,
40,
41,
42,
43,
44] show substantial SHAP values and Cohen effect sizes. Certainly, this significantly boosts confidence, particularly when the model generates unexpected outputs. Additionally, the explainability outcomes offer an aspect of legitimacy to the specific computer-aided decision-making system since they are aligned with the findings of years of research on the matter. However, it is worth noting that some well-known risk factors for CAD, such as dyslipidemia, were consistently overlooked during the feature selection process.
Future plans include incorporating data from images or the prediction results of AI models utilizing such data into the AI prediction model. Image results from SPECT and PET tests hold important information that can almost certainly enhance the prediction accuracy of such a system. Furthermore, it could be interesting to further research why some well-known CAD risk factors were absent from the feature selection and creation of the dedicated feature subsets (e.g., arterial hypertension). Additionally, there is an ongoing and robust discussion in the field about the methods and techniques to make AI models even more interpretable and trustworthy. This is indeed an area that requires further research, and we plan to explore additional methods to enhance model explainability in our future work.
Author Contributions
Design and conduction of the study: A.-D.S. and S.M.; data collection: I.D.A., N.P. and E.P.; data processing: A.-D.S. and I.D.A.; manuscript preparation: A.-D.S., S.M. and I.D.A.; manuscript review: N.P. and E.P.; medical expertise: N.P.; supervision, N.P., S.M. and E.P.; project administration, E.P. All authors have read and agreed to the published version of the manuscript.
Funding
This research project was supported by the Hellenic Foundation for Research and Innovation (H.F.R.I.) under the “2nd Call for H.F.R.I. Research Projects to support Faculty Members & Researchers” (Project Number: 3656).
Institutional Review Board Statement
The ethical committee of the University General Hospital of Patras has greenlighted this particular data recording (Ethical & Research Committee of University Hospital of Patras—protocol number 108/10-3-2022).
Informed Consent Statement
This study is retrospective in its nature and hence the requirement of obtaining informed consent from the participants was waived. The anonymity of the subjects was maintained during the data acquisition process. Furthermore, all procedures in this study are in accordance with the Declaration of Helsinki.
Data Availability Statement
Upon reasonable request, the data used in the current study can be available for sharing.
Conflicts of Interest
The authors declare no conflict of interest.
References
- Sworna, N.S.; Islam, A.M.; Shatabda, S.; Islam, S. Towards development of IoT-ML driven healthcare systems: A survey. J. Netw. Comput. Appl. 2021, 196, 103244. [Google Scholar] [CrossRef]
- Heidari, A.; Navimipour, N.J.; Unal, M. Applications of ML/DL in the management of smart cities and societies based on new trends in information technologies: A systematic literature review. Sustain. Cities Soc. 2022, 85, 104089. [Google Scholar] [CrossRef]
- Gerlein, E.A.; McGinnity, M.; Belatreche, A.; Coleman, S. Evaluating machine learning classification for financial trading: An empirical approach. Expert Syst. Appl. 2016, 54, 193–207. [Google Scholar] [CrossRef]
- Kundu, S. AI in medicine must be explainable. Nat. Med. 2021, 27, 1328. [Google Scholar] [CrossRef]
- Caspers, J. Translation of predictive modeling and AI into clinics: A question of trust. Eur. Radiol. 2021, 31, 4947–4948. [Google Scholar] [CrossRef] [PubMed]
- Lysaght, T.; Lim, H.Y.; Xafis, V.; Ngiam, K.Y. AI-assisted decision-making in healthcare: The application of an ethics framework for big data in health and research. Asian Bioeth. Rev. 2019, 11, 299–314. [Google Scholar] [CrossRef] [PubMed]
- Middleton, S.E.; Letouzé, E.; Hossaini, A.; Chapman, A. Trust, regulation, and human-in-the-loop AI: Within the European region. Commun. ACM 2022, 65, 64–68. [Google Scholar] [CrossRef]
- Malakar, A.K.; Choudhury, D.; Halder, B.; Paul, P.; Uddin, A.; Chakraborty, S. A review on coronary artery disease, its risk factors, and therapeutics. J. Cell. Physiol. 2019, 234, 16812–16823. [Google Scholar] [CrossRef] [PubMed]
- Organization WHO. Cardiovascular Diseases (CVDs). Available online: https://www.who.int/news-room/fact-sheets/detail/cardiovascular-diseases-(cvds) (accessed on 10 October 2022).
- Alizadehsani, R.; Abdar, M.; Roshanzamir, M.; Khosravi, A.; Kebria, P.M.; Khozeimeh, F.; Nahavandi, S.; Sarrafzadegan, N.; Acharya, U.R. Machine learning-based coronary artery disease diagnosis: A comprehensive review. Comput. Biol. Med. 2019, 111, 103346. [Google Scholar] [CrossRef]
- Abdar, M.; Książek, W.; Acharya, U.R.; Tan, R.-S.; Makarenkov, V.; Pławiak, P. A new machine learning technique for an accurate diagnosis of coronary artery disease. Comput. Methods Programs Biomed. 2019, 179, 104992. [Google Scholar] [CrossRef]
- Berkaya, S.K.; Sivrikoz, I.A.; Gunal, S. Classification models for SPECT myocardial perfusion imaging. Comput. Biol. Med. 2020, 123, 103893. [Google Scholar] [CrossRef] [PubMed]
- Akella, A.; Akella, S. Machine learning algorithms for predicting coronary artery disease: Efforts toward an open source solution. Future Sci. OA 2021, 7, FSO698. [Google Scholar] [CrossRef] [PubMed]
- Apostolopoulos, I.D.; Papandrianos, N.I.; Feleki, A.; Moustakidis, S.; Papageorgiou, E.I. Deep learning-enhanced nuclear medicine SPECT imaging applied to cardiac studies. EJNMMI Phys. 2023, 10, 6. [Google Scholar] [CrossRef] [PubMed]
- Otaki, Y.; Singh, A.; Kavanagh, P.; Miller, R.J.; Parekh, T.; Tamarappoo, B.K.; Sharir, T.; Einstein, A.J.; Fish, M.B.; Ruddy, T.D. Clinical deployment of explainable artificial intelligence of SPECT for diagnosis of coronary artery disease. Cardiovasc. Imaging 2022, 15, 1091–1102. [Google Scholar] [CrossRef] [PubMed]
- Chen, J.-J.; Su, T.-Y.; Chen, W.-S.; Chang, Y.-H.; Lu, H.H.-S. Convolutional neural network in the evaluation of myocardial ischemia from CZT SPECT myocardial perfusion imaging: Comparison to automated quantification. Appl. Sci. 2021, 11, 514. [Google Scholar] [CrossRef]
- Nakajima, K.; Kudo, T.; Nakata, T.; Kiso, K.; Kasai, T.; Taniguchi, Y.; Matsuo, S.; Momose, M.; Nakagawa, M.; Sarai, M. Diagnostic accuracy of an artificial neural network compared with statistical quantitation of myocardial perfusion images: A Japanese multicenter study. Eur. J. Nucl. Med. Mol. Imaging 2017, 44, 2280–2289. [Google Scholar] [CrossRef]
- Otaki, Y.; Tamarappoo, B.; Singh, A.; Sharir, T.; Hu, L.-H.; Gransar, H.; Einstein, A.; Fish, M.; Ruddy, T.; Kaufmann, P. Diagnostic accuracy of deep learning for myocardial perfusion imaging in men and women with a high-efficiency parallel-hole-collimated cadmium-zinc-telluride camera: Multicenter study. Soc. Nuclear Med. 2020, 92. [Google Scholar]
- Spier, N.; Nekolla, S.; Rupprecht, C.; Mustafa, M.; Navab, N.; Baust, M. Classification of polar maps from cardiac perfusion imaging with graph-convolutional neural networks. Sci. Rep. 2019, 9, 7569. [Google Scholar] [CrossRef]
- Apostolopoulos, I.D.; Groumpos, P.P.; Apostolopoulos, D.J. Advanced fuzzy cognitive maps: State-space and rule-based methodology for coronary artery disease detection. Biomed. Phys. Eng. Express 2021, 7, 045007. [Google Scholar] [CrossRef]
- Dave, D.; Naik, H.; Singhal, S.; Patel, P. Explainable ai meets healthcare: A study on heart disease dataset. arXiv 2020, arXiv:2011.03195. [Google Scholar]
- Zafar, M.R.; Khan, N.M. DLIME: A deterministic local interpretable model-agnostic explanations approach for computer-aided diagnosis systems. arXiv 2019, arXiv:1906.10263. [Google Scholar]
- Winter, E. The shapley value. Handb. Game Theory Econ. Appl. 2002, 3, 2025–2054. [Google Scholar]
- Wang, K.; Tian, J.; Zheng, C.; Yang, H.; Ren, J.; Liu, Y.; Han, Q.; Zhang, Y. Interpretable prediction of 3-year all-cause mortality in patients with heart failure caused by coronary heart disease based on machine learning and SHAP. Comput. Biol. Med. 2021, 137, 104813. [Google Scholar] [CrossRef] [PubMed]
- Samaras, A.-D.; Moustakidis, S.; Apostolopoulos, I.D.; Papandrianos, N.; Papageorgiou, E. Classification models for assessing coronary artery disease instances using clinical and biometric data: An explainable man-in-the-loop approach. Sci. Rep. 2023, 13, 6668. [Google Scholar] [CrossRef] [PubMed]
- Apostolopoulos, I.D.; Apostolopoulos, D.I.; Spyridonidis, T.I.; Papathanasiou, N.D.; Panayiotakis, G.S. Multi-input deep learning approach for cardiovascular disease diagnosis using myocardial perfusion imaging and clinical data. Phys. Med. 2021, 84, 168–177. [Google Scholar] [CrossRef] [PubMed]
- Apostolopoulos, I.D.; Groumpos, P.P. Non-invasive modelling methodology for the diagnosis of coronary artery disease using fuzzy cognitive maps. Comput. Methods Biomech. Biomed. Eng. 2020, 23, 879–887. [Google Scholar] [CrossRef] [PubMed]
- Muhammad, L.; Al-Shourbaji, I.; Haruna, A.A.; Mohammed, I.A.; Ahmad, A.; Jibrin, M.B. Machine learning predictive models for coronary artery disease. SN Comput. Sci. 2021, 2, 350. [Google Scholar] [CrossRef]
- Sayadi, M.; Varadarajan, V.; Sadoughi, F.; Chopannejad, S.; Langarizadeh, M. A Machine Learning Model for Detection of Coronary Artery Disease Using Noninvasive Clinical Parameters. Life 2022, 12, 1933. [Google Scholar] [CrossRef]
- Liu, Y.; Ren, H.; Fanous, H.; Dai, X.; Wolf, H.M.; Wade Jr, T.C.; Ramm, C.J.; Stouffer, G.A. A machine learning model in predicting hemodynamically significant coronary artery disease: A prospective cohort study. Cardiovasc. Digit. Health J. 2022, 3, 112–117. [Google Scholar] [CrossRef]
- Huang, X.; Chen, P.; Tang, F.; Hua, N. Detection of coronary artery disease in patients with chest pain: A machine learning model based on magnetocardiography parameters. Clin. Hemorheol. Microcirc. 2021, 78, 227–236. [Google Scholar] [CrossRef]
- Johri, A.M.; Singh, K.V.; Mantella, L.E.; Saba, L.; Sharma, A.; Laird, J.R.; Utkarsh, K.; Singh, I.M.; Gupta, S.; Kalra, M.S. Deep learning artificial intelligence framework for multiclass coronary artery disease prediction using combination of conventional risk factors, carotid ultrasound, and intraplaque neovascularization. Comput. Biol. Med. 2022, 150, 106018. [Google Scholar] [CrossRef] [PubMed]
- Benjamins, J.W.; Yeung, M.W.; Maaniitty, T.; Saraste, A.; Klén, R.; van der Harst, P.; Knuuti, J.; Juarez-Orozco, L.E. Improving patient identification for advanced cardiac imaging through machine learning-integration of clinical and coronary CT angiography data. Int. J. Cardiol. 2021, 335, 130–136. [Google Scholar] [CrossRef] [PubMed]
- Prokhorenkova, L.; Gusev, G.; Vorobev, A.; Dorogush, A.V.; Gulin, A. CatBoost: Unbiased boosting with categorical features. Adv. Neural Inf. Process. Syst. 2018, 31. [Google Scholar]
- Ramadhani, H.F.; Kusuma, W.A.; Hasibuan, L.S.; Heryanto, R. Association of single nucleotide polymorphism and phenotypes in type 2 diabetes mellitus using genetic algorithm and catboost. In Proceedings of the 2020 International Conference on Computer Science and Its Application in Agriculture (ICOSICA), Bogor, Indonesia, 16–17 September 2020; pp. 1–6. [Google Scholar]
- Zheng, Y.; Guo, X.; Yang, Y.; Wang, H.; Liao, K.; Qin, J. Phonocardiogram transfer learning-based CatBoost model for diastolic dysfunction identification using multiple domain-specific deep feature fusion. Comput. Biol. Med. 2023, 156, 106707. [Google Scholar] [CrossRef]
- Zhao, H.; Ma, Z.; Sun, Y. Predict Onset Age of Hypertension Using CatBoost and Medical Big Data. In Proceedings of the 2020 International Conference on Networking and Network Applications (NaNA), Haikou, China, 10–13 December 2020; pp. 405–409. [Google Scholar]
- Postnikov, E.B.; Esmedljaeva, D.A.; Lavrova, A.I. A CatBoost machine learning for prognosis of pathogen’s drug resistance in pulmonary tuberculosis. In Proceedings of the 2020 IEEE 2nd Global Conference on Life Sciences and Technologies (LifeTech), Kyoto, Japan, 10–12 March 2020; pp. 86–87. [Google Scholar]
- Wei, X.; Rao, C.; Xiao, X.; Chen, L.; Goh, M. Risk Assessment of Cardiovascular Disease Based on SOLSSA-CatBoost Model. Expert Syst. Appl. 2023, 219, 119648. [Google Scholar] [CrossRef]
- Rückstieß, T.; Osendorfer, C.; Van Der Smagt, P. Sequential feature selection for classification. In Proceedings of the AI 2011: Advances in Artificial Intelligence: 24th Australasian Joint Conference, Perth, Australia, 5–8 December 2011; Proceedings 24. pp. 132–141. [Google Scholar]
- Berrar, D. Cross-validation. In Encyclopedia of Bioinformatics and Computational Biology; Ranganathan, S., Gribskov, M., Nakai, K., Schönbach, C., Eds.; Academic Press: Oxford, UK, 2019; pp. 542–545. [Google Scholar] [CrossRef]
- Cohen, J. Statistical Power Analysis for the Behavioral Sciences, 2nd ed.; Erlbaum: Hillsdale, NJ, USA, 1988. [Google Scholar]
- Gignac, G.E.; Szodorai, E.T. Effect size guidelines for individual differences researchers. Personal. Individ. Differ. 2016, 102, 74–78. [Google Scholar] [CrossRef]
- Peng, C.-Y.J.; Chen, L.-T. Beyond Cohen’s d: Alternative effect size measures for between-subject designs. J. Exp. Educ. 2014, 82, 22–50. [Google Scholar] [CrossRef]
- Lundberg, S.M.; Lee, S.-I. A unified approach to interpreting model predictions. Adv. Neural Inf. Process. Syst. 2017, 30. [Google Scholar]
- Saleheen, D.; Frossard, P. CAD risk factors and acute myocardial infarction in Pakistan. Acta Cardiol. 2004, 59, 417–424. [Google Scholar] [CrossRef]
- Krämer, B.K.; Zülke, C.; Kammerl, M.C.; Schmidt, C.; Hengstenberg, C.; Fischereder, M.; Marienhagen, J.; Group, E.T.v.C.M.R.T.S. Cardiovascular risk factors and estimated risk for CAD in a randomized trial comparing calcineurin inhibitors in renal transplantation. Am. J. Transplant. 2003, 3, 982–987. [Google Scholar] [CrossRef]
- Petri, M.; Spence, D.; Bone, L.R.; Hochberg, M.C. Coronary artery disease risk factors in the Johns Hopkins Lupus Cohort: Prevalence, recognition by patients, and preventive practices. Medicine 1992, 71, 291–302. [Google Scholar] [CrossRef] [PubMed]
- Rozanski, A.; Blumenthal, J.A.; Davidson, K.W.; Saab, P.G.; Kubzansky, L. The epidemiology, pathophysiology, and management of psychosocial risk factors in cardiac practice: The emerging field of behavioral cardiology. J. Am. Coll. Cardiol. 2005, 45, 637–651. [Google Scholar] [CrossRef] [PubMed]
- Wilson, P.W. Established risk factors and coronary artery disease: The Framingham Study. Am. J. Hypertens. 1994, 7, 7S–12S. [Google Scholar] [CrossRef]
- Almas, A.; Hameed, A.; Sultan, F.A.T. Knowledge of coronary artery disease (CAD) risk factors and coronary intervention among university students. JPMA. J. Pak. Med. Assoc. 2008, 58, 553. [Google Scholar] [PubMed]
- Iqbal, S.; Dodani, S.; Qureshi, R. Risk factors and behaviours for coronary artery disease (CAD) among ambulatory Pakistanis. J. Pak. Med. Assoc. 2004, 54, 261. [Google Scholar]
- Foody, J.; Huo, Y.; Ji, L.; Zhao, D.; Boyd, D.; Meng, H.J.; Shiff, S.; Hu, D. Unique and varied contributions of traditional CVD risk factors: A systematic literature review of CAD risk factors in China. Clin. Med. Insights Cardiol. 2013, 7, CMC-S10225. [Google Scholar] [CrossRef]
| Disclaimer/Publisher’s Note: The statements, opinions and data contained in all publications are solely those of the individual author(s) and contributor(s) and not of MDPI and/or the editor(s). MDPI and/or the editor(s) disclaim responsibility for any injury to people or property resulting from any ideas, methods, instructions or products referred to in the content. |
© 2023 by the authors. Licensee MDPI, Basel, Switzerland. This article is an open access article distributed under the terms and conditions of the Creative Commons Attribution (CC BY) license (https://creativecommons.org/licenses/by/4.0/).


 ,
, 


