Article

A Comparative Biomechanical Analysis of Topspin Forehand against Topspin and Backspin in Table Tennis

1
School of Physical Education, Shaanxi Normal University, Xi’an 710119, China
2
Department of Physical Education, Chang’an University, Xi’an 710064, China
*
Authors to whom correspondence should be addressed.
Appl. Sci. 2023, 13(14), 8119; https://doi.org/10.3390/app13148119
Submission received: 14 June 2023 / Revised: 10 July 2023 / Accepted: 11 July 2023 / Published: 12 July 2023

Abstract

:
The topspin forehand is the most frequent and effective shot in top-level table tennis matches. The present study assesses the biomechanical differences in the topspin forehand stroke technique when the incoming ball is in different rotations. Eight national level-1 male table tennis athletes (176.6 ± 4.8 cm, 70.8 ± 6.6 kg, 20.9 ± 2.4 yr) performed two kinds of techniques—topspin forehand strokes against topspin (AT) and against backspin (AB) balls, respectively. The kinematic parameters of their bodies and rackets were calculated. Meanwhile, the force plates analyzed their lower limb moments through inverse dynamics. Paired t-test and non-parametric paired t-test mapping were used to assess the differences between the two conditions. Their center of gravity (COG) vertical distance, elbow flexion, thorax–pelvis flexion, and knee flexion angles had significant differences during the stroke phase (p < 0.05). The moment of the racket-side hip rotation and ankle dorsiflexion showed significant differences during the stroke phase (p < 0.05). The racket velocity, angle, and trajectories showed significant differences at characteristic moments (p < 0.05). This study revealed the different topspin forehand stroke techniques in table tennis, even though the two movements look similar. Compared with AT strokes, the athletes kept a straight elbow and lower center of gravity than they did during the stroke phase of AB strokes. They increased the distance of the racket trajectory and velocity to meet the incoming ball with a backspin, especially in the vertical direction. This detailed information is necessary for beginners to improve the efficiency of their forehand topspin technique, especially in strokes against incoming balls with different rotations.

1. Introduction

The topspin forehand is one of the essential techniques in table tennis. It is the most frequent and effective shot in top-level table tennis matches [1], representing 19.5% of total shots [2]. From a biomechanical perspective, the topspin forehand is a complex, multi-joint movement.
Previous studies have investigated the kinematic characteristics of the topspin forehand technique [3,4,5]. It was found that an efficient topspin forehand shot was associated with high angular velocities and great energy transfer from the trunk to the upper arm [6,7]. The shot directions of the topspin forehand (down-the-line vs. cross-court), which are likely due to more rotation of the trunk with respect to the table tennis table [8], have also been investigated [8,9,10]. In addition, elite players showed significantly larger maximum shoulder and forearm rotation and wrist abduction [7]. A biomechanical study of the lower limbs also concluded that elite athletes had better lower extremity drivability and stronger core and leg muscles to achieve stable control of their center of gravity [11].
However, as Hodges concluded, “not only must you learn to loop, but you must learn to return the loop” [12]. The incoming ball’s condition (e.g., rotation, velocity, and path) also affects the athlete’s stroke technique. For example, generating a higher topspin rate and initial speed while serving could reduce the opponent’s preparation time [13]. Meanwhile, Bankosz and Winiarski compared the topspin forehand against a ball without rotation and with backspin. They concluded that the athletes performed the motion with the longest racket distance when they stroke against the backspin balls [4]. However, few studies have examined the differences between the topspin forehand stroke against topspin (AT) and against backspin (AB) incoming balls, which might provide more practical information for learners. In addition, the kinematic parameters of the racket are also important for the topspin forehand. However, the racket speed has been widely examined [14,15,16]. More recently, Lanzoni and his colleagues accessed the racket position during the topspin forehand drive [9]. They suggested that athletes need to increase the racket height to improve its effectiveness during the stroke [9]. In addition, the racket angle at the ball–racket impact point during the topspin forehand may also affect the stroke effectiveness [8]. However, to the best of our knowledge, these studies failed to further compare the incoming balls under different conditions or analyze the process from the perspective of the racket.
For the preceding reasons, this study aims to compare the kinematic differences in the topspin forehand stroke between AT and AB incoming balls. Not only did we focus on the kinematics of the trunk and racket-side arm, but the racket angles, velocity, and trajectory were also evaluated. Thus, we hypothesized that the racket-side arm and racket would show significant differences between AT and AB stroke returns.

2. Materials and Methods

2.1. Participants

Eight male elite table tennis players (age: 20.9 ± 2.4 yr, body weight: 70.8 ± 6.6 kg, and body height: 176.6 ± 4.8 cm) agreed to participate in the study. The effectiveness of the sample size was calculated in G*Power software (ver. 3.1.9.7; Heinrich-Heine-Universität Düsseldorf, Düsseldorf, Germany). One similar previous study reported that the effect size was 1.37 for the elbow flexion [8]. When the G*power (1-β) was set at 0.80, and the α level was set at 0.05, the sample size was indicated to require at least seven participants, according to the calculation using G*Power. All participants were at least national level-1 table tennis athletes, and they were recruited from the college table tennis team of Shaanxi Normal University, Xian, China. They were all offensive players that used a shakehand grip. They had no previous upper or lower extremity diseases or deformities and were free from injury for at least six months before the test. Seven were right-handed, one was left-handed, and the latter’s data were mirrored during processing. All the players signed written informed consent forms. A local ethics committee approved the experimental procedure (No: 202216002 2022-04).

2.2. Procedures

The experiment was conducted in the biomechanical laboratory of Shaanxi Normal University. Figure 1 shows the experimental setup. All athletes wore the same uniform tights and used the same racket (TIMO BOLL ZLC, Butterfly Technical Center, Tokyo, Japan) with Butterfly Tenergy 64 (Butterfly Technical Center, Tokyo, Japan) and DHC Hurricane 3 (Double Happiness Sports Company, Shanghai, China) rubber sheets. The racket side with the DHC Hurricane 3 rubber sheet was used for the forehand.
After a standard 5-min warm-up, the participants were instructed to perform topspin forehand against balls (D40+, Double Happiness Sports Company, Shanghai, China) projected by a serving machine (Tai De V-989E, Tai De, Zhongshan, China) to ensure that they were familiar with the procedures. The speed and frequency of the serving machine were adjusted to approximate the situations in a real match, according to the coach’s advice. A set of wheels in the serving machine controlled the ball’s speed and spin. The upper and lower wheel were set at levels 10 and 4, respectively, to project the topspin balls toward the impact zone (68 × 50 cm). On the contrary, the upper wheel was set at level 4, and the lower wheel was level 10 for the backspin ball. The shot frequency was set at level 8 invariably.
During the data collection, the participants were asked to perform down-the-line topspin forehand strokes to the target zone (Figure 1). The instruction by the coach was: “Hitting the ball just like in the game.” At first, they played the forehand topspin against a set of continuous topspin balls from the serving machine. Then, we adjusted the settings of the serving machine after a sufficient interval, and they played against a set of continuous backspin balls. Trials were completed when the player accurately played ten shots on the target zone. Three successful shots in each condition were considered for analysis.

2.3. Kinematics and Kinetics

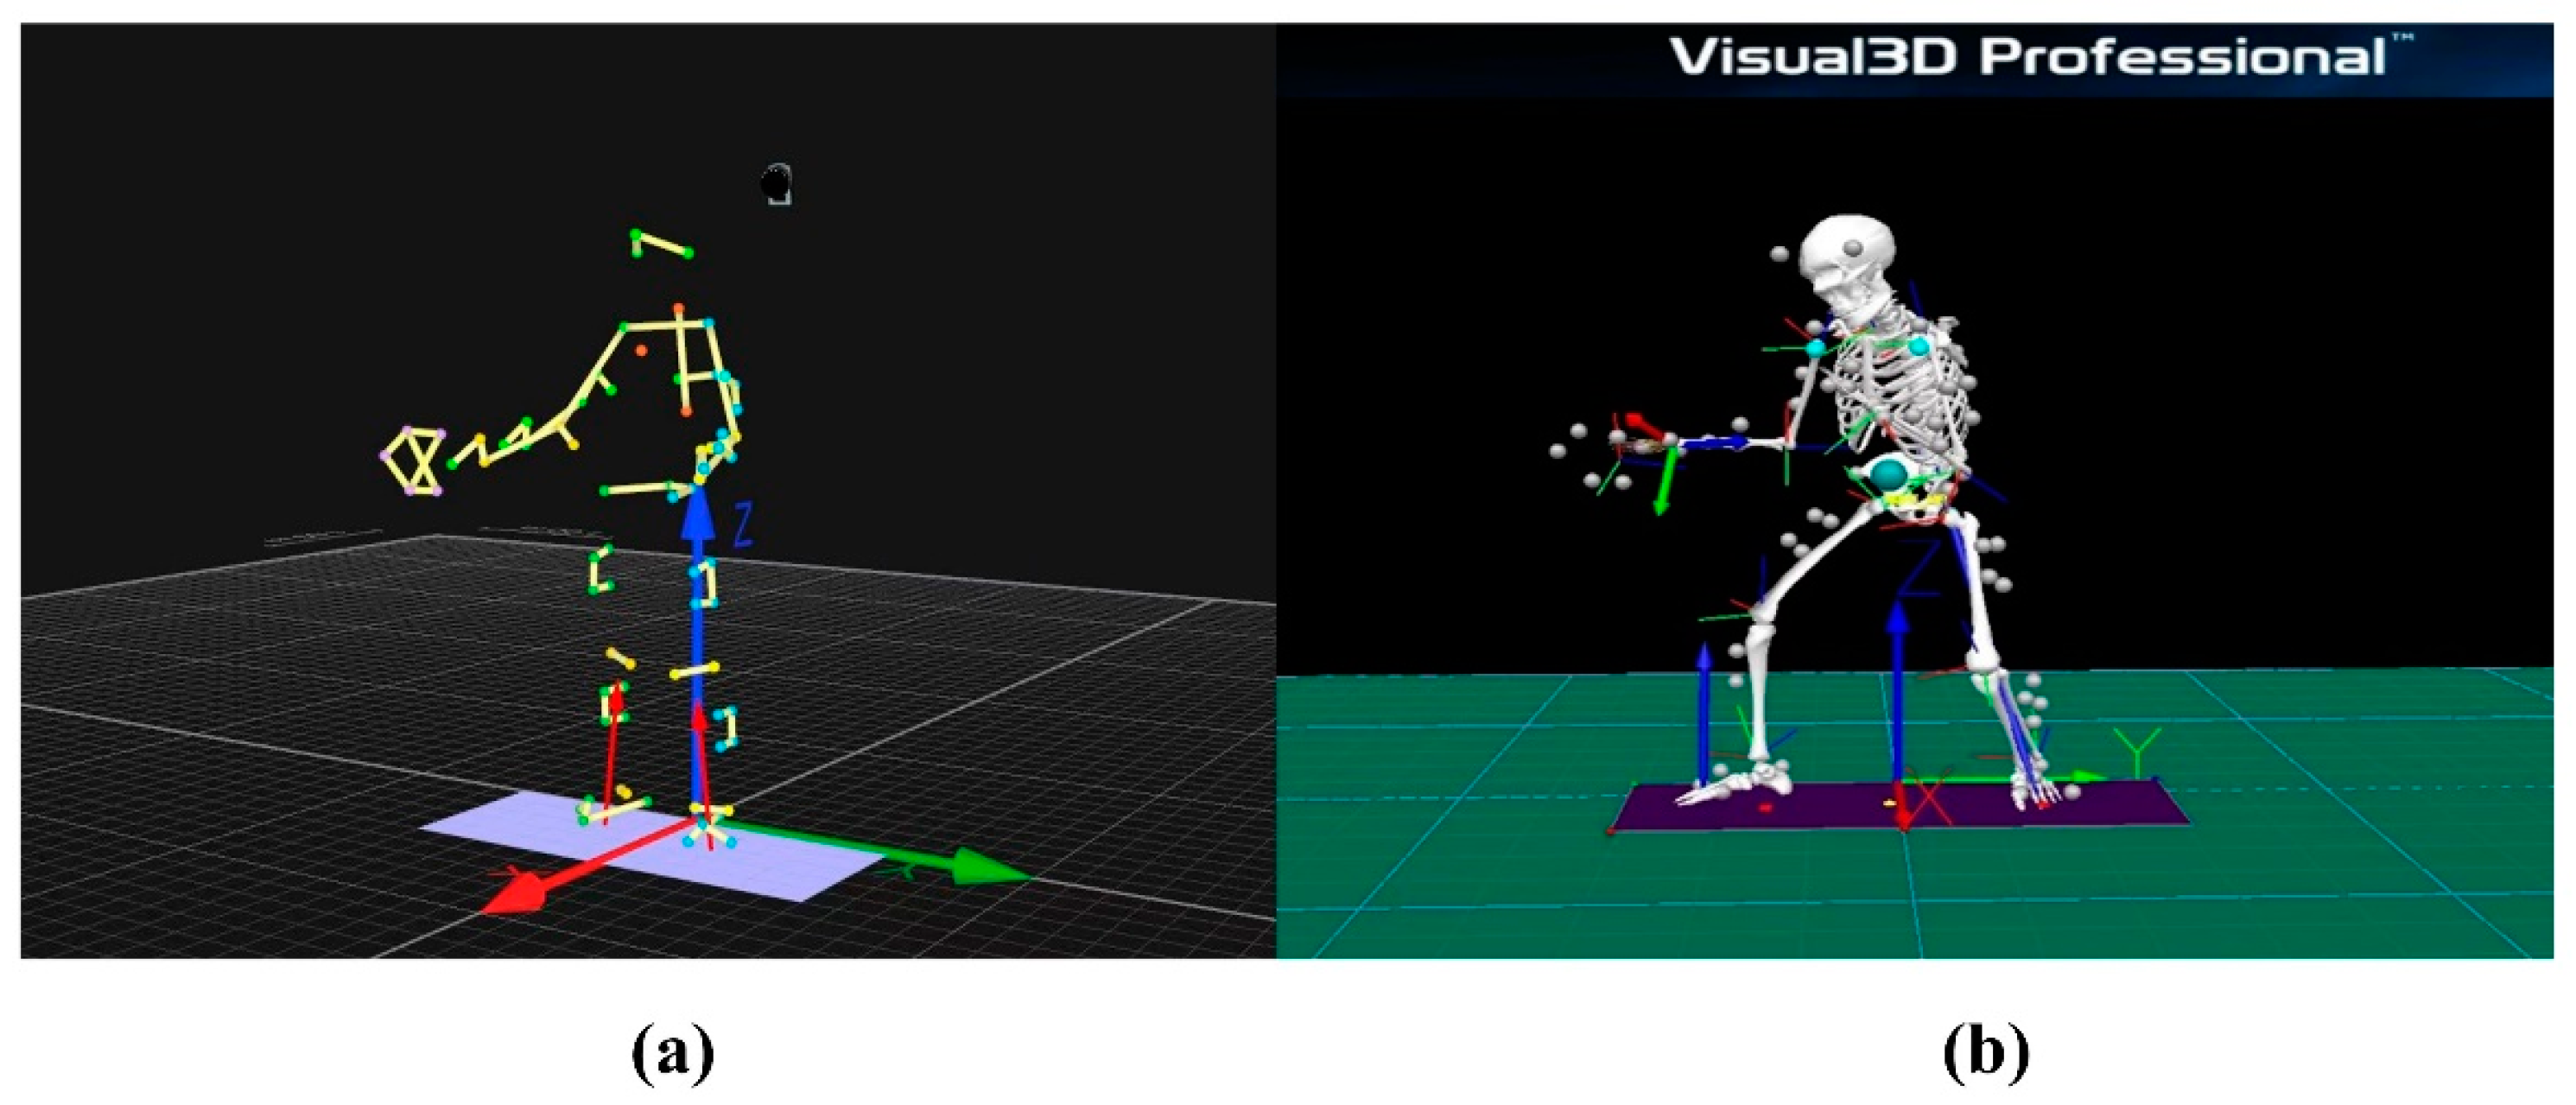
A 10-camera motion analysis system (Oqus700+, Qualisys AB, Göteborg, Sweden) was used to record kinematics. The sampling frequency was 200 Hz. Kinetic data were collected using two recessed force platforms (Kistler 9260AA6, 0.4 m × 0.6 m; Kistler Instruments Corp., Winterthur, Switzerland) at a sampling frequency of 1000 Hz. A modified, full-body Helen Hayes marker system (Orthopedic Engineering and Research Center, Helen Hayes Hospital, New York, NY, USA) with marker clusters was used in addition to a custom-made model for the racket (57 reflective markers) [17,18]. There were five markers on the racket. One was attached to the racket top, and the other four markers were symmetrically attached. The racket velocity was calculated from the data of the top marker on the racket [4] (Figure 2). The other markers on the racket’s side were added to calculate the racket’s spatial orientation, described as the center displacement and angles between the racket surface and axes planes [19]. Given a few markers lacking partial trajectory data, we used Qualisys Track Manager (QTM 2023.1, Qualisys AB, Sweden) to fill in the marker data gaps according to the actual conditions. Linear, Polynomial, Relational, and Kinematic were the main gap-fill types that interpolate the data in the software.

2.4. Data Filtering and Pre-Processing

Pre-processed kinematic data (C3D format) were imported to Visual3D (V6.0, C-Motion, Germantown, MD, USA). A fourth-order Butterworth low-pass digital filter was used to filter the data, and the kinematic and kinetic cut-off frequencies were set at 14 Hz and 100 HZ, respectively [20,21]. Anatomical landmarks and segments were defined according to the Visual 3D framework model (Figure 2b) and the anthropometric data [17]. The joint angle and bilateral lower limb moment were calculated, as well as the racket trajectories, velocities, and angles of the racket [22]. The center of gravity (COG) variables were relative to the laboratory coordinate system and have also been considered a key factor [21]. In addition, the joint moments were normalized to the body mass of each athlete. The top three markers on the racket determined the plane’s composition and calculated its angle with each plane in three-dimensional space (Figure 3).

2.5. Movement Phase Definition

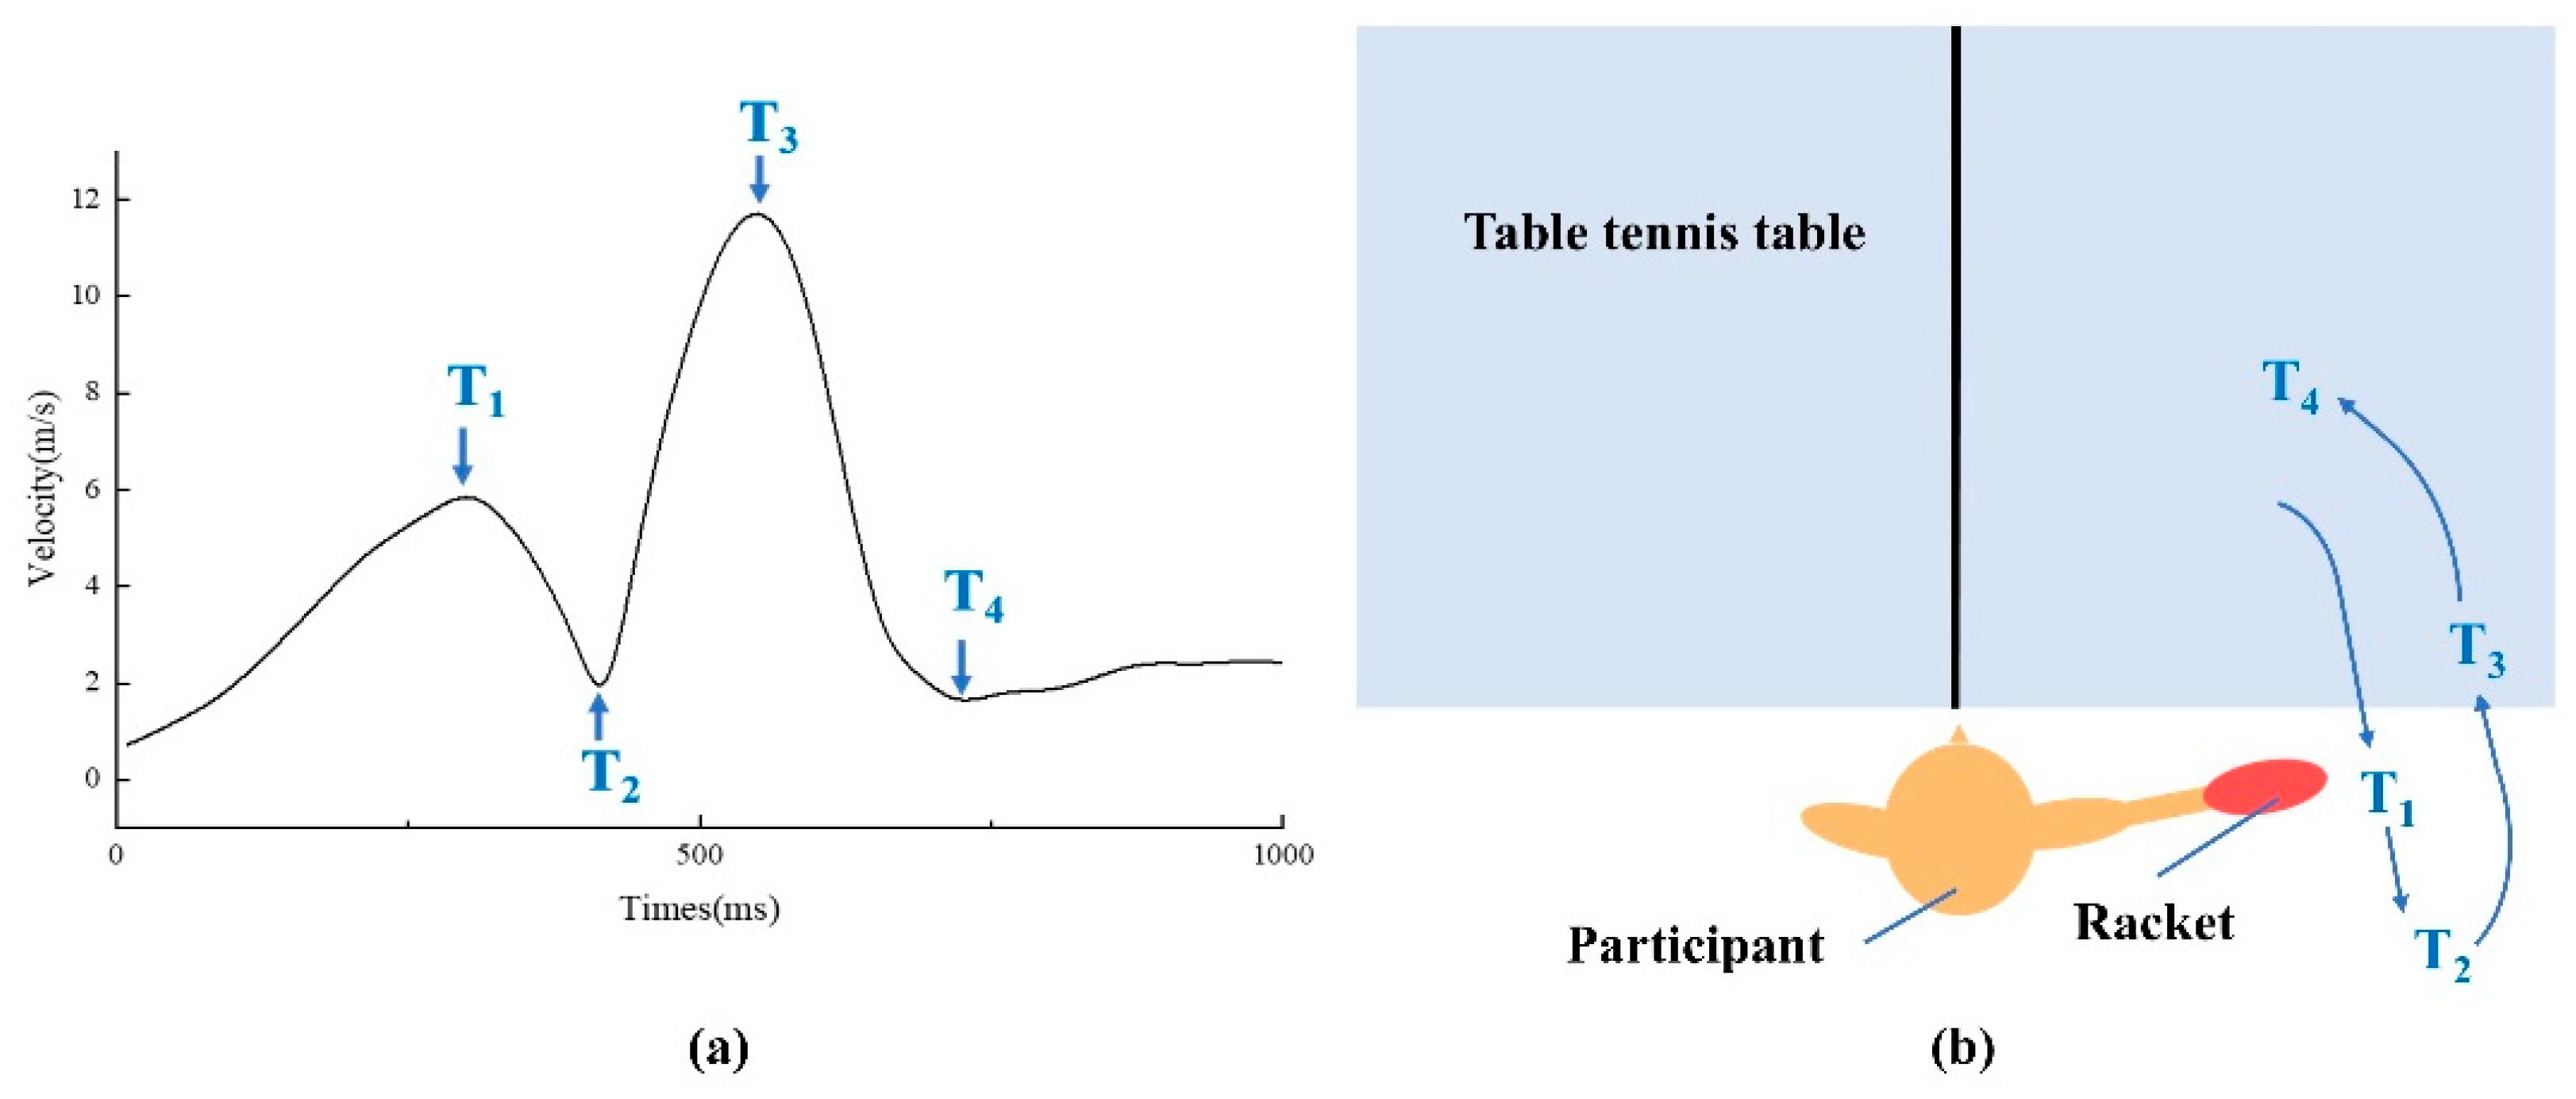
According to previous studies, the moment of maximum racket velocity (T3) was considered the closest to the impact time [6,7,8,16,23]. The valley value (T2) before T3 was considered as the end of the backward swing. T1 was the moment when the racket velocity reached its peak value during the backswing. T4 was the end of the follow-through [19]. In this study, we focused on the three main phases: backward swing (T1–T2), forward swing (T2–T3), and follow-through (T3–T4) (Figure 4a,b). We defined the combination of the forward swing and follow-through as the stroke phase (T2–T4). Since the initial backward swing was not sufficiently reliably identified, the duration of T1–T2 was used to define the backswing phase. The duration of phases was then calculated.

2.6. Statistics Analysis

Statistics were performed in Matlab (Matlab R2016b, The Matworks Inc., Beltsville, MD, USA) and SPSS (IBM SPSS Statistics 25, Armonk, NY, USA). The normality of distributions of differences was verified with Shapiro–Wilk tests. The data from the kinetics and kinematics were normally distributed. Statistical significance was set at α = 0.05, and all the data were reported as the mean ± standard deviation (SD). The effect size (ES) was calculated as Cohen’s d. The magnitude of effect sizes was categorized as none (0 < Cohen’s d < 0.20), small (0.20 < Cohen’s d < 0.50), medium (0.50 < Cohen’s d < 0.80), and large (Cohen’s d ≥ 0.80).
Statistical parametric mapping (SPM) is a gold standard statistical method for numerical signal data analysis [24,25]. For the one-dimensional variables recorded with the motion analysis system, the general SPM model can be simplified to the one-dimensional model SPM1D. It has been used to compare the time waveforms for kinematic and dynamic variables [26,27,28]. The non-parametric paired t-test mapping implemented in the SPM1D toolbox was used to assess the effect of different strokes (AB vs. AT) on the entire waveforms of kinetics and kinematics, except for the variables of the racket as they have scalar values. This statistical analysis was processed in Matlab 2016a (MathWorks, Natick, MA, USA). The significance level was set at α = 0.05.

3. Results

3.1. The Variable of the Center of Gravity and the Joint Angle

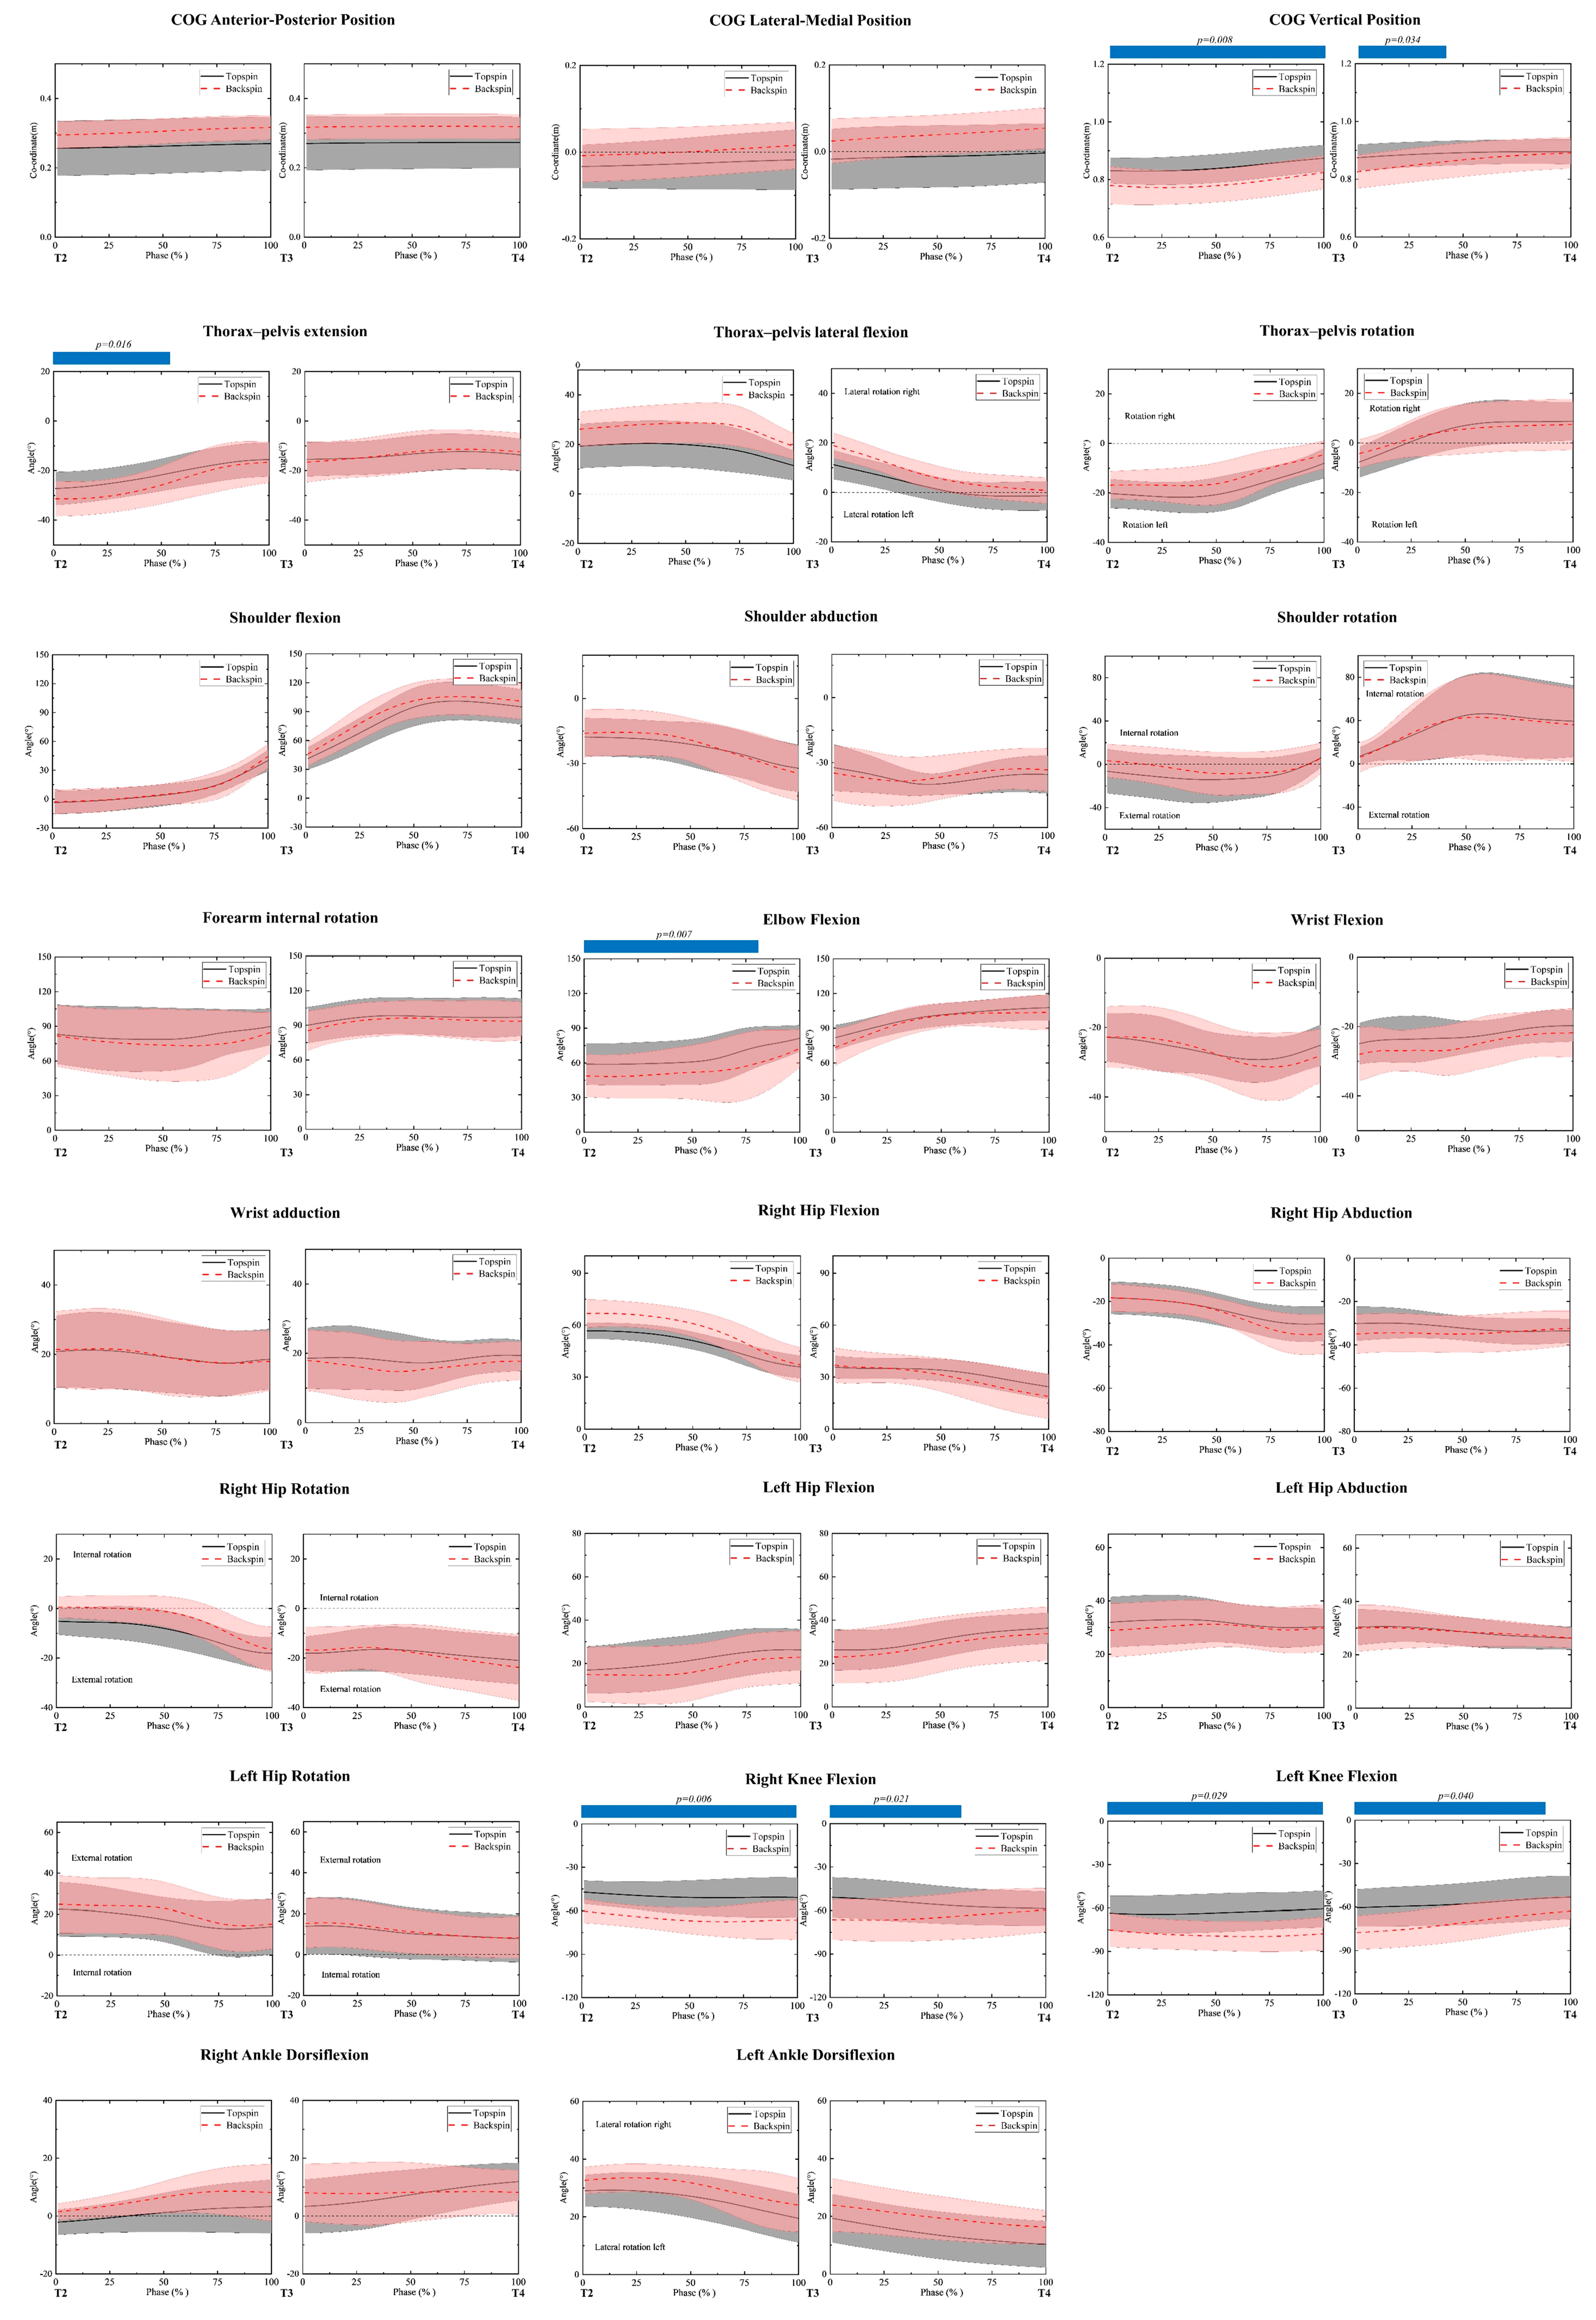
Figure 5 shows the distance of the center of gravity (COG) in the three directions and the main joint angles during the forward swing (T2–T3) and follow-through phase (T3–T4). The SPM1D result shows that the topspin forehand AT has a larger vertical distance of COG during the 0–100% forward swing phase (p = 0.008) and the 0–41.07% follow-through phase (p = 0.034). The topspin forehand AB had a greater thorax–pelvis flexion angle during the 0–53.31% follow-through phase (p = 0.016) while the topspin forehand AT had a greater elbow flexion angle during the 0–78.58% forward swing phase (p = 0.007). The topspin forehand AB had a greater right knee flexion angle during the 0–100% forward swing phase (p = 0.006) and 0–61.36% during the follow-through phase (p = 0.021). The topspin forehand AB also had a greater left knee flexion angle during the 0–100% forward swing phase (p = 0.029) and 0–85.55% during the follow-through phase (p = 0.040).

3.2. The Variables of the Joint Moment

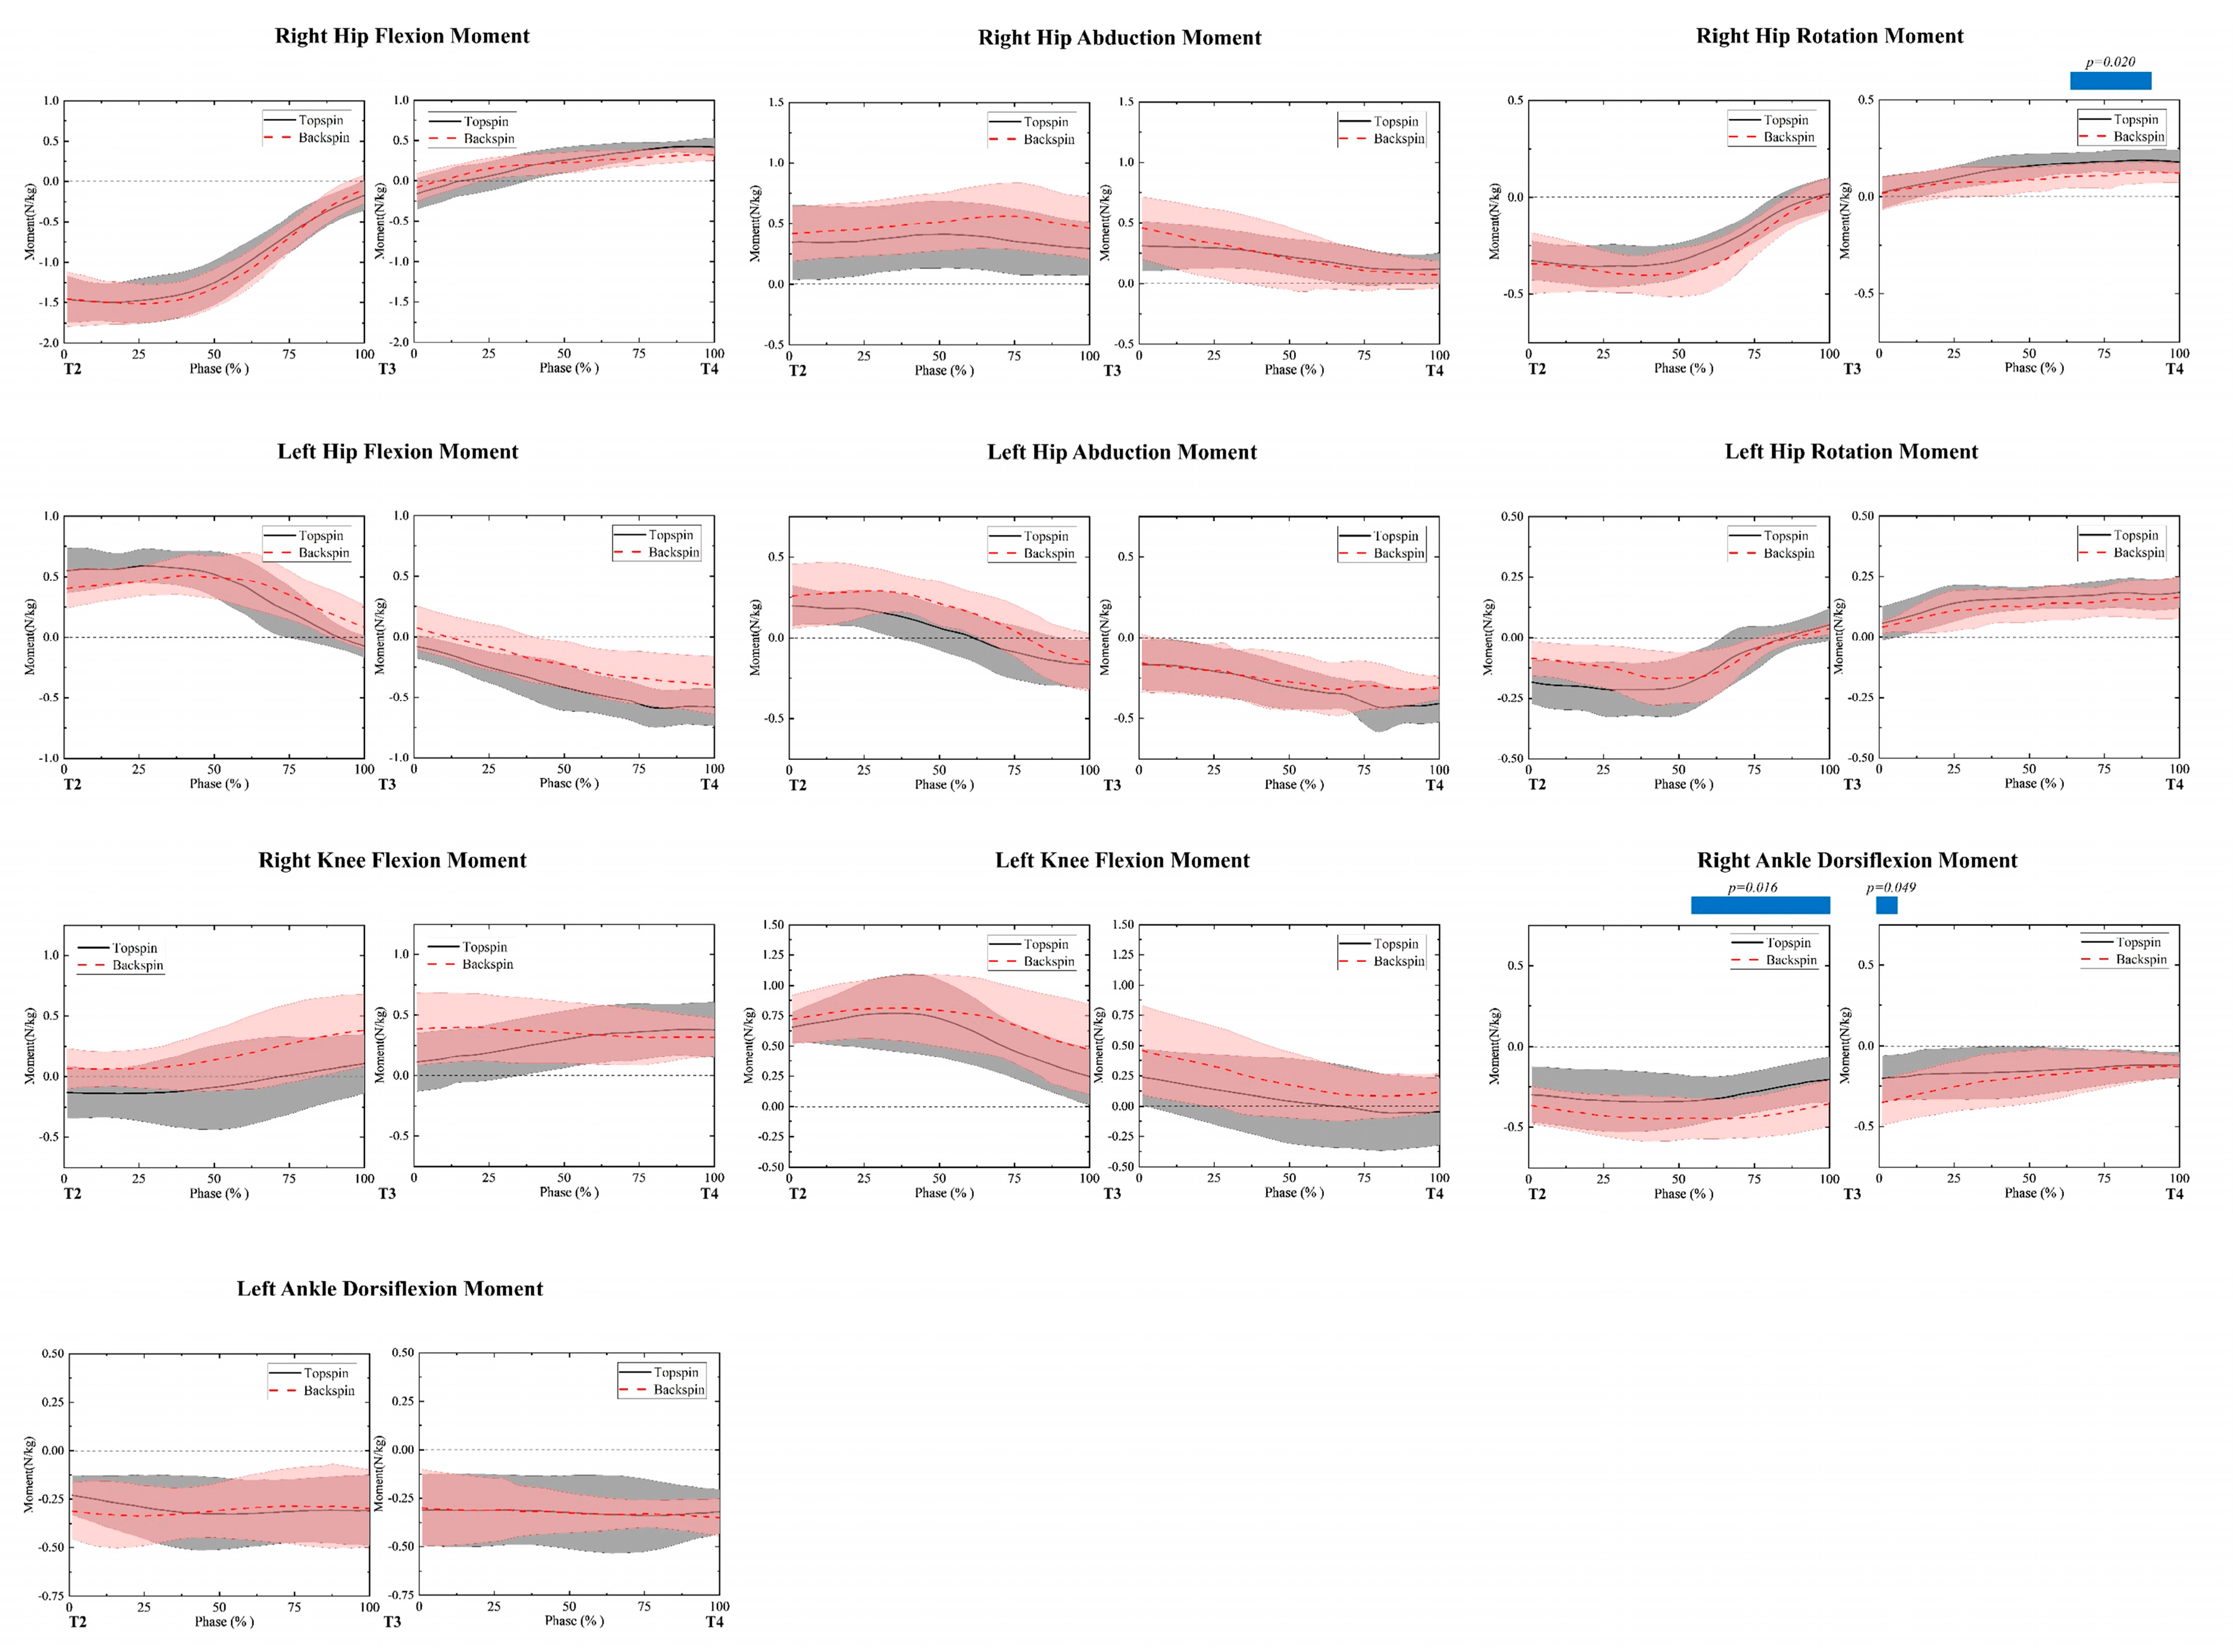
Figure 6 shows the joint moments of the lower limbs during the forward swing (T2–T3) and follow-through phase (T3–T4). The SPM1D result shows that topspin forehand AT had a greater right hip rotation moment during the 64.10–87.10% follow-through phase (p = 0.020) while the topspin forehand AB had a greater right ankle dorsiflexion moment during the 55.67–100% forward swing phase (p = 0.016) and 0–6.04% follow-through phase (p = 0.049).

3.3. Kinematic Analysis of Racket

Table 1 shows the racket’s maximum velocity at impact in different directions. The resultant velocity of AB was significantly greater than AT’s (p = 0.023, ES = 1.026), which was mainly due to the difference in the vertical velocity component (p = 0.001, ES = 6.210).
The racket angles within the XY and YZ planes had significant differences between AT and AB at the end of the backward swing in Table 2. The racket angle of AT within the XY plane was less than AB’s (p = 0.007, ES = 1.336) and the racket angle of AT within the YZ plane was significantly greater than AB’s (p = 0.001, ES = 3.096).
The racket angles within the XY and YZ planes differed significantly between AT and AB at impact. The racket angle of AT within the XY plane was significantly less than AB’s at impact (p = 0.001, ES = 2.538) and the racket angle of AT within the YZ plane was significantly greater than AB’s at impact (p = 0.001, ES = 3.074).
The top marker of the racket was chosen to represent the racket’s trajectory during the movement. The distance variables of the racket’s movement are shown in Table 3. During the backward swing, the distances of AT were significantly greater than AB’s in the X component-backward swing (p = 0.001, ES = 2.550), Z component-backward swing (p = 0.042, ES = 0.876), and Resultant-backward swing (p = 0.008, ES = 1.311). During the forward swing, the distances of AB were significantly greater than AT’s in the Y component-forward swing (p = 0.002, ES = 1.754), Z component-forward swing (p = 0.009, ES = 1.280), and Resultant component-forward swing (p = 0.028, ES = 0.975). The distance of AB was significantly greater in the Z component-follow-through (p = 0.002, ES = 1.660) during the follow-through phase.

4. Discussion

The primary focus of this study was to record the motion during a topspin forehand stroke against backspin and topspin (AB vs. AT) incoming balls using the Qualisys motion system. The motion was divided into three main phases: backward swing (T1–T2), forward swing (T2–T3), and follow-through (T3–T4). Then, we used the SPM1D method to explore and compare the two similar movements and discussed them further.
The main results showed the detailed center of gravity (COG), joint angles, and joint moments phase analysis information. In addition, the result of the racket analysis from multiple dimensions was also helpful in this study. The athletes were found to keep a lower COG for the upcoming backspin ball to meet the lower limbs’ power requirements by fully pushing off the ground with the racket-side foot and extending their bilateral knee joints. Meanwhile, they would unbend their elbow slightly, increase the racket face’s tilt angle at impact, and increase the range of the movement to a faster racket velocity, especially in the vertical direction.

4.1. The Backward Swing Phase (T1–T2)

The topspin forehand, like most powerful activities, involves a countermovement. The muscles involved were initially stretched during the backward swing and then shortened to accelerate the body and limb during the forward swing [29]. This action employs the energy storage capabilities of the elastic components and stimulation of the stretch reflex to facilitate a maximal increase in muscle recruitment over a minimal amount of time [30]. Therefore, the movement of both the body and racket in the backward swing significantly affect the efficiency of the forehand topspin stroke.

4.2. During the Forward Swing (T2–T3)

The characteristic of the topspin forehand AB was a lower position of COG that may be caused by the bilateral knee joint angles and racket side’s ankle moments from the view of lower limbs. Meanwhile, these adjustments generate and transfer energy from the lower limbs to the upper limb [31,32]. The COG distance changes of the athlete during the stroke phase were from three directions, the posterior to anterior, the racket side to the non-playing side, and from down to up. Thus, the athlete kept a posture of leaning forward to slightly upright [33]. For AB, leaning forward was similar to the racket’s greater distance of the trajectories, especially in the vertical direction. Both increased the stroke movement range [34,35]. Bankosz and Winiarski also found that the resultant total distance of the racket movement was the longest for the topspin forehand AB compared to the stroke against the ball without rotation [4]. Additionally, with an incoming ball’s heavier backspin, the players swung the racket more perpendicularly to the ground [3].
In addition, the athletes performed less elbow flexion in AB. The straight elbow increased the radius of rotation of the upper limb, leading to a greater linear velocity of the racket and strength of the impact. Iino and Kojima compared the topspin forehand against a light and heavy backspin, and they found that the elbow flexion had a significant difference between the different strokes [6,7]. Thus, the elbow flexion could be considered an essential and sensitive indicator for the topspin forehands between AT and AB.

4.3. During the Follow-Through (T3–T4)

The movement during follow-through can be regarded as a continuation of the forward swing. The follow-through movement can indirectly represent the stroke’s quality [29]. In contrast to the steady trajectory and high speed of the topspin ball, the backspin ball’s horizontal velocity might not only be irregular before contact with the table but also decrease sharply after contact with the table and even rebound back towards the net [36]. Given that different spins of the ball result in different heights of the stroke position [1,12,13,37], the athletes kept a lower COG in AB even after the impact and fully accomplished the follow-through movement by the racket-side hip rotation.
Furthermore, players should adjust the direction of the racket swing according to the pre-impact ball rotation [3,7], make the racket face more upright [37], and enhance the moving distance and velocity of the racket in the down–up direction during the topspin forehand stroke AB [6]. In this way, when the racket collides with the backspin ball, adequate pressure can be generated at the contact area to raise both the ball’s velocity and the frictional force. Thus, the ball could obtain greater quality and easily make it over the net.

4.4. Limitations

This study used the biomechanical method to explore the difference between the topspin forehand AT and AB. The measurable result derived from the racket, joint angle, and joint moment could explain the difference in detail. This information could help athletes to improve their technique of topspin forehand. However, electromyography (EMG) analyses might support the interpretation of existing data in the current study. Moreover, studies on the spin rate and velocity of the table tennis ball might be very interesting and valuable for the current study. Finally, the discrepancy between male and female athletes should also be considered, given their different physiological structures and strengths.

5. Conclusions

This study revealed the biomechanical differences in the topspin forehand stroke between AT and AB. For these two similar stroke movements, the AB stroke led to a lower center of gravity being created by athletes bending their knees and leaning forward. In addition, they increased torsion by using their lower limb to accomplish the follow-through movement fully. Meanwhile, they used less elbow flexion to increase the racket trajectory and velocity, especially in the vertical direction. At the time of ball–racket impact, the racket face of the AB stroke had a greater angle with the horizontal plane. These actions might be in response to the features of the upcoming backspin ball, giving it more impact power and topspin effect to increase the success rate of the strokes. This study could offer learners and coaches more essential and detailed information to optimize their topspin forehand techniques against the coming ball, with different rotations to improve the efficiency of their forehand topspin technique.

Author Contributions

Data curation: Z.L. (Zijun Lu) and Z.L. (Zhengao Li); Formal analysis: X.L.; Investigation: T.L.; Methodology: C.M. and K.X.; Writing—original draft: C.M.; Writing—review and editing: L.C. and Y.S. All authors have read and agreed to the published version of the manuscript.

Funding

This research received no external funding.

Institutional Review Board Statement

The study was conducted in accordance with the Declaration of Helsinki and approved by the Ethics Committee of Shaanxi Normal University (No: 202216002 2022-04).

Informed Consent Statement

Informed consent was obtained from all subjects involved in the study.

Data Availability Statement

The data presented in this study are available on request from the corresponding author. The data are not publicly available for reasons of confidentiality.

Acknowledgments

The authors thank the other investigators, the staff, and the participants of the study for their valuable contributions.

Conflicts of Interest

The authors declare no conflict of interest.

References

  1. Seemiller, D.; Holowchak, M. Winning Table Tennis: Skills, Drills, and Strategies, 1st ed.; Human Kinetics Publishers: Champaign, IL, USA, 1997. [Google Scholar]
  2. Lanzoni, I.M.; Di Michele, R.; Merni, F. A notational analysis of shot characteristics in top-level table tennis players. Eur. J. Sport Sci. 2014, 14, 309–317. [Google Scholar] [CrossRef] [PubMed]
  3. Iino, Y. Hip joint kinetics in the table tennis topspin forehand: Relationship to racket velocity. J. Sports Sci. 2017, 36, 834–842. [Google Scholar] [CrossRef] [PubMed]
  4. Bańkosz, Z.; Winiarski, S. The kinematics of table tennis racquet: Differences between topspin strokes. J. Sports Med. Phys. Fit. 2018, 57, 202–213. [Google Scholar] [CrossRef]
  5. Iino, Y.; Kojima, T. Mechanical energy generation and transfer in the racket arm during table tennis topspin backhands. Sports Biomech. 2016, 15, 180–197. [Google Scholar] [CrossRef]
  6. Iino, Y.; Kojima, T. Kinematics of table tennis topspin forehands: Effects of performance level and ball spin. J. Sports Sci. 2009, 27, 1311–1321. [Google Scholar] [CrossRef] [PubMed] [Green Version]
  7. Iino, Y.; Kojima, T. Kinetics of the upper limb during table tennis topspin forehands in advanced and intermediate players. Sports Biomech. 2011, 10, 361–377. [Google Scholar] [CrossRef] [PubMed]
  8. Lanzoni, I.M.; Bartolomei, S.; Di Michele, R.; Fantozzi, S. A kinematic comparison between long-line and cross-court top spin forehand in competitive table tennis players. J. Sports Sci. 2017, 36, 2637–2643. [Google Scholar] [CrossRef] [PubMed]
  9. Lanzoni, I.M.; Bartolomei, S.; Di Michele, R.; Gu, Y.; Baker, J.S.; Fantozzi, S.; Cortesi, M. Kinematic Analysis of the Racket Position during the Table Tennis Top Spin Forehand Stroke. Appl. Sci. 2021, 11, 5178. [Google Scholar] [CrossRef]
  10. He, Y.; Lv, X.; Zhou, Z.; Sun, D.; Baker, J.S.; Gu, Y. Comparing the Kinematic Characteristics of the Lower Limbs in Table Tennis: Differences between Diagonal and Straight Shots Using the Forehand Loop. J. Sports Sci. Med. 2020, 19, 522–528. [Google Scholar]
  11. Zhu, R.; Yang, X.; Chong, L.C.; Shao, S.; István, B.; Gu, Y. Biomechanics of Topspin Forehand Loop in Table Tennis: An Application of OpenSim Musculoskeletal Modelling. Healthcare 2023, 11, 1216. [Google Scholar] [CrossRef]
  12. Hodges, L. Table Tennis: Steps to Success, 1st ed.; Human Kinetics: Champaign, IL, USA, 1993. [Google Scholar]
  13. Kidokoro, S.; Inaba, Y.; Yoshida, K.; Yamada, K.; Ozaki, H. A topspin rate exceeding 110 rps reduces the ball time of arrival to the opponent: A table tennis rally study. Sports Biomech. 2022, 1–17. [Google Scholar] [CrossRef] [PubMed]
  14. Le Mansec, Y.; Dorel, S.; Nordez, A.; Jubeau, M. Sensitivity and Reliability of a Specific Test of Stroke Performance in Table Tennis. Int. J. Sports Physiol. Perform. 2016, 11, 678–684. [Google Scholar] [CrossRef] [PubMed]
  15. Wu, W.-L.; Liang, J.-M.; Chen, C.-F.; Tsai, K.-L.; Chen, N.-S.; Lin, K.-C.; Huang, I.-J. Creating a Scoring System with an Armband Wearable Device for Table Tennis Forehand Loop Training: Combined Use of the Principal Component Analysis and Artificial Neural Network. Sensors 2021, 21, 3870. [Google Scholar] [CrossRef] [PubMed]
  16. Xing, K.; Hang, L.; Lu, Z.; Mao, C.; Kang, D.; Yang, C.; Sun, Y. Biomechanical Comparison between Down-the-Line and Cross-Court Topspin Backhand in Competitive Table Tennis. Int. J. Environ. Res. Public Health 2022, 19, 5146. [Google Scholar] [CrossRef]
  17. Sun, Y.; Wei, S.; Zhong, Y.; Fu, W.; Li, L.; Liu, Y. How Joint Torques Affect Hamstring Injury Risk in Sprinting Swing–Stance Transition. Med. Sci. Sports Exerc. 2015, 47, 373–380. [Google Scholar] [CrossRef] [Green Version]
  18. Collins, T.D.; Ghoussayni, S.N.; Ewins, D.J.; Kent, J.A. A six degrees-of-freedom marker set for gait analysis: Repeatability and comparison with a modified Helen Hayes set. Gait Posture 2009, 30, 173–180. [Google Scholar] [CrossRef]
  19. Zhang, Z.; Halkon, B.; Chou, S.M.; Qu, X. A novel phase-aligned analysis on motion patterns of table tennis strokes. Int. J. Perform. Anal. Sport 2017, 16, 305–316. [Google Scholar] [CrossRef]
  20. Yu, B.; Gabriel, D.; Noble, L.; An, K.-N. Estimate of the Optimum Cutoff Frequency for the Butterworth Low-Pass Digital Filter. J. Appl. Biomech. 1999, 15, 318–329. [Google Scholar] [CrossRef]
  21. Winter, D.A. Biomechanics and Motor Control of Human Movement, 1st ed.; John Wiley & Sons, Inc.: Hoboken, NJ, USA, 2009. [Google Scholar]
  22. Cole, G.K.; Nigg, B.M.; Ronsky, J.L.; Yeadon, M.R. Application of the Joint Coordinate System to Three-Dimensional Joint Attitude and Movement Representation: A Standardization Proposal. J. Biomech. Eng. 1993, 115, 344–349. [Google Scholar] [CrossRef]
  23. Iino, Y.; Kojima, T. Effect of the racket mass and the rate of strokes on kinematics and kinetics in the table tennis topspin backhand. J. Sports Sci. 2016, 34, 721–729. [Google Scholar] [CrossRef]
  24. Pataky, T.C. One-dimensional statistical parametric mapping in Python. Comput. Methods Biomech. Biomed. Eng. 2012, 15, 295–301. [Google Scholar] [CrossRef] [PubMed]
  25. Nichols, T.E.; Holmes, A.P. Nonparametric permutation tests for functional neuroimaging: A primer with examples. Hum. Brain Mapp. 2002, 15, 1–25. [Google Scholar] [CrossRef] [PubMed] [Green Version]
  26. Yang, C.; Bouffard, J.; Srinivasan, D.; Ghayourmanesh, S.; Cantú, H.; Begon, M.; Côté, J.N. Changes in movement variability and task performance during a fatiguing repetitive pointing task. J. Biomech. 2018, 76, 212–219. [Google Scholar] [CrossRef] [PubMed]
  27. Bańkosz, Z.; Winiarski, S. Statistical Parametric Mapping Reveals Subtle Gender Differences in Angular Movements in Table Tennis Topspin Backhand. Int. J. Environ. Res. Public Health 2020, 17, 6996. [Google Scholar] [CrossRef]
  28. Lu, Z.; Zhang, X.; Mao, C.; Liu, T.; Li, X.; Zhu, W.; Wang, C.; Sun, Y. Effects of Mobile Phone Use on Gait and Balance Control in Young Adults: A Hip–Ankle Strategy. Bioengineering 2023, 10, 665. [Google Scholar] [CrossRef]
  29. Lees, A. Science and the major racket sports: A review. J. Sports Sci. 2003, 21, 707–732. [Google Scholar] [CrossRef]
  30. Komi, P.V. Physiological and biomechanical correlates of muscle function: Effects of muscle structure and stretch-shortening cycle on force and speed. Exerc. Sport Sci. Rev. 1984, 12, 81–122. [Google Scholar] [CrossRef]
  31. Le Mansec, Y.; Dorel, S.; Hug, F.; Jubeau, M. Lower limb muscle activity during table tennis strokes. Sports Biomech. 2018, 17, 442–452. [Google Scholar] [CrossRef]
  32. He, Y.; Fekete, G.; Sun, D.; Baker, J.S.; Shao, S.; Gu, Y. Lower Limb Biomechanics during the Topspin Forehand in Table Tennis: A Systemic Review. Bioengineering 2022, 9, 336. [Google Scholar] [CrossRef]
  33. Wong, D.W.-C.; Lee, W.C.-C.; Lam, W.-K. Biomechanics of Table Tennis: A Systematic Scoping Review of Playing Levels and Maneuvers. Appl. Sci. 2020, 10, 5203. [Google Scholar] [CrossRef]
  34. Bańkosz, Z.; Winiarski, S. The Evaluation of Changes of Angles in Selected Joints During Topspin Forehand in Table Tennis. Mot. Control 2018, 22, 314–337. [Google Scholar] [CrossRef] [PubMed]
  35. Bańkosz, Z.; Winiarski, S. Correlations between Angular Velocities in Selected Joints and Velocity of Table Tennis Racket during Topspin Forehand and Backhand. J. Sports Sci. Med. 2018, 17, 330–338. [Google Scholar] [PubMed]
  36. Tang, D.; Zeng, O.; Leng, L. Robustness and Menace of Backspin and its Physical Principle. J. Wuhan Inst. Phys. Educ. 2013, 47, 85–92. [Google Scholar] [CrossRef]
  37. Tsai, C.; Pan, K.; Huang, K.; Chang, T.; Hsueh, Y.; Wang, L.; Chang, S. The surface emg activity of the upper limb muscles in table tennis forehand drives. In Proceedings of the Proc XXVIII Int Symp Biomech Sport, Marquette, MI, USA, 19–23 July 2010; Volume 1, pp. 305–308. [Google Scholar]
Figure 1. Experimental setup of the study.
Applsci 13 08119 g001
Figure 2. (a) Marker system adopted in the study, (b) 3D model based on the marker set. The X-axis represents the anterior–posterior direction. The Y-axis represents the medial–lateral direction. The Z-axis represents the down–up direction.
Applsci 13 08119 g002
Figure 3. The racket’s three-dimensional (3D) schematic diagram. (a) The racket angle relative to the table and (b) the racket angle with each plane in 3D space. The racket angle within the XY plane (horizontal plane), the YZ plane (sagittal plane), and the XZ plane (frontal plane) during the stroke phase.
Applsci 13 08119 g003
Figure 4. The phases of movement divided based on the racket’s resultant velocity. (a) A typical example of the racket’s resultant velocity profile and (b) different phases of a forehand stroke.
Applsci 13 08119 g004
Figure 5. The SPM1D process for the COG and joint angles variables during the stroke phase. Differences in the kinematics of the joint angle between AT (in black) and AB (in red) players were revealed during the forward swing (T2–T3) and follow-through phase (T3–T4). Solid lines are the mean group values of AT, with one SD (black shading) after normalizing to 100% of the stroke phase. Dash–dotted lines indicate mean group values of AB with one SD (red shading). The statistically significant differences (for p < 0.05) are marked on the horizontal blue bar at the top of each graph. COG anterior–posterior position, +: anterior and −: posterior. COG lateral–medial position, +: non-playing side and −: racket-side. COG vertical position, +: up and −: down. Thorax–pelvis extension, +: extension and −: flexion. Thorax–pelvis lateral flexion, +: lateral rotation right and −: lateral rotation left. Thorax–pelvis rotation, +: rotation right and −: rotation left. Shoulder flexion, +: flexion and −: extension. Shoulder abduction, +: adduction and −: abduction. Shoulder axial rotation, +: internal rotation and −: external rotation. Forearm internal rotation, +: internal rotation and −: external rotation. Elbow flexion, +: flexion and −: extension. Wrist flexion, +: internal rotation and −: external rotation. Wrist adduction, +: adduction and −: abduction. Hip flexion, +: flexion and −: extension. Right hip abduction, +: adduction and −: abduction. Right hip rotation, +: internal rotation and −: external rotation. Left hip abduction, +: abduction and −: adduction. Left hip rotation, +: external rotation and −: internal rotation. Knee flexion, +: extension and −: flexion. Ankle dorsiflexion, +: dorsiflexion and −: plantar flexion.
Applsci 13 08119 g005
Figure 6. The joint moment of the lower limbs. Solid lines are the mean group values of AT, with one SD (black shading) after normalizing to 100% of the stroke phase. Dash–dotted lines indicate mean group values of AB with one SD (red shading). The statistically significant differences (for p < 0.05) are marked on the horizontal blue bar at the top of each graph. Hip flexion, +: flexion and −: extension. Right hip abduction, +: adduction and −: abduction. Right hip rotation, +: internal rotation and −: external rotation. Left hip abduction, +: abduction and −: adduction. Left hip rotation, +: external rotation and −: internal rotation. Knee flexion, +: extension and −: flexion. Ankle dorsiflexion, +: dorsiflexion and −: plantar flexion.
Applsci 13 08119 g006
Table 1. The racket velocity at impact (N = 8).
Racket Velocity (m/s)AT (Mean ± SD)AB (Mean ± SD)pES
X component value 10.35 ± 0.888.27 ± 2.010.028 *0.973
Y component value 4.26 ± 1.852.81 ± 2.330.037 *0.906
Z component value 7.62 ± 0.9311.70 ± 0.680.001 **6.210
The resultant value 13.67 ± 0.9014.83 ± 1.550.023 *1.026
The statistical significance is marked with “*”, * indicates p < 0.05, and ** indicates p < 0.01. Values are the mean ± SD (N = 8). ES: effect size. AB: against topspin, AT: against backspin, X component value: the racket velocity in the anterior–posterior direction, Y component value: the racket velocity in the lateral direction, and Z component value: the racket velocity in the vertical direction.
Table 2. The racket angle within each plane (N = 8).
Angle VariableAT (Mean ± SD)AB (Mean ± SD)pES
T2
XY plane (°)47.3 ± 17.766.9 ± 20.50.007 **1.336
YZ plane (°)56.9 ± 14.542.0 ± 17.00.001 **3.096
XZ plane (°)69.1 ± 22.563.6 ± 16.20.2910.404
T3
XY plane (°)58.5 ± 6.074.7 ± 5.40.001 **2.538
YZ plane (°)34.6 ± 5.318.7 ± 2.90.001 **3.074
XZ plane (°)82.6 ± 11.081.1 ± 4.10.0670.159
The statistical significance is marked with “*”, and ** indicates p < 0.01. Values are the mean ± SD (N = 8). ES: effect size, AB: against topspin, and AT: against backspin.
Table 3. Distances of the racket movement during phases (N = 8).
Distance Variable (m)AT (Mean ± SD)AB (Mean ± SD)pES
X component-backward swing 0.72 ± 0.240.30 ± 0.180.001 **2.550
Y component-backward swing 0.27 ± 0.170.34 ± 0.150.4020.315
Z component-backward swing 0.29 ± 0.170.13 ± 0.100.042 *0.876
Resultant-backward swing0.88 ± 0.320.51 ± 0.210.008 **1.311
X component-forward swing 0.91 ± 0.180.82 ± 0.160.0830.715
Y component-forward swing 0.63 ± 0.250.84 ± 0.270.002 **1.754
Z component-forward swing0.54 ± 0.110.72 ± 0.120.009 **1.280
Resultant-forward swing1.36 ± 0.311.54 ± 0.290.028 *0.975
X component-follow-through 0.41 ± 0.090.37 ± 0.100.5120.244
Y component-follow-through 0.82 ± 0.050.89 ± 0.150.3830.330
Z component-follow-through 0.46 ± 0.100.62 ± 0.100.002 **1.660
Resultant-follow-through1.11 ± 0.101.25 ± 0.150.0510.832
The statistical significance is marked with “*”, * indicates p < 0.05, and ** indicates p < 0.01.
Disclaimer/Publisher’s Note: The statements, opinions and data contained in all publications are solely those of the individual author(s) and contributor(s) and not of MDPI and/or the editor(s). MDPI and/or the editor(s) disclaim responsibility for any injury to people or property resulting from any ideas, methods, instructions or products referred to in the content.