Article

Whole Rock, Mineral Chemistry during Skarn Mineralization-Case Study from Tongshan Cu-Mo Skarn Profile

1
Ore Deposit and Exploration Center, School of Resources and Environmental Engineering, Hefei University of Technology, Hefei 230009, China
2
Anhui Province Engineering Research Center for Mineral Resources and Mine Environments, Hefei 230009, China
*
Author to whom correspondence should be addressed.
Appl. Sci. 2023, 13(14), 8118; https://doi.org/10.3390/app13148118
Submission received: 12 May 2023 / Revised: 5 July 2023 / Accepted: 8 July 2023 / Published: 12 July 2023

Abstract

:
Studying the activation, migration and precipitation processes of ore-forming elements is essential for understanding the genesis and mechanisms of skarn deposits. A typical skarn profile formed by the intrusion of Yanshanian granodiorite into the Carboniferous carbonate strata was studied. The profile is highly consistent with the classic skarn profile, ranging from the intrusion, weak alteration belt, skarn belt (inner and outer skarn belt) and mineralization belt (mainly characterized by Cu mineralization) to the surrounding marble without being affected by late-stage low-temperature or supergene weathering alteration. Whole-rock data show that the major and trace elements exhibit relatively small changes in the granodiorite and inner skarn, but huge variation in the boundary between the inner and outer skarn; Na, Al, Ti and Sr show significant decreases, while Fe, Mg, Zn, V and Ni show significant increases. The elemental content in the outer skarn is 10–100 times or more higher than that in the marble, but the elements such as Ca, Sr and Cs diluted from the marble. During the migration process from the inner skarn to the outer skarn, some elements (such as K, Rb and Ba) were depleted in the inner, but not enriched in the outer, indicating that they may migrate to farther locations. Grossularite developed in the inner skarn, with light rare earth element (LREE) depletion and heavy REE enrichment, as well as positive and negative anomalies of Eu (δEu = 0.42–3.95). Andradite developed in the outer skarn, with zonation development, light REE enrichment, and heavy REE depletion and a positive Eu anomaly (δEu = 0.36–46.83). Some negative Eu anomalies appear at the edges of garnets in the outer skarn, indicating fluctuations in fO2 during the late skarn process. A positive correlation between Fe3+ and REE3+ in the garnets from the inner skarn, as well as between Al3+ and REE3+ from the outer skarn indicated that there are different YAG substitution mechanisms of REE between the inner and outer skarn. Low garnet REE contents and highly variable Y/Ho ratios in outer skarn suggest that the significant fluctuations in REEs may be primarily controlled by water-rock interactions. Considering the whole-rock major and trace element contents, as well as the trace element features of garnet, we found that whole-rock Na, Al, Ti and Sr elements, garnet Ti, Zr and Nb elements exhibit significant differences between the inner and outer skarn. These characteristics can be used to distinguish the boundary between the rock body and carbonate during the skarnification process.

1. Introduction

Skarn is a type of metamorphic rock primarily formed by contact metasomatism [1]. Swedish geologists initially coined the term “skarn” to refer to a green, calcic siliceous rock mainly composed of minerals such as garnet, pyroxene, hornblende, feldspar and epidote. The process of skarn mineralization is frequently linked with the concentration of metallic elements, leading to the formation of skarn-type deposits [1,2]. Skarn-type deposits have a long geological history and manifest in various forms, including Fe-Cu(Au)-Mo polymetallic deposits, which are among the primary sources of iron, copper, molybdenum and related platinum group element mineral resources in China [3,4,5,6]. During the process of skarn formation through contact metasomatism, the composition, physical-chemical conditions and evolution of ore-forming fluids play a crucial role in controlling the mineralization enrichment and ore grades [2]. Activation, migration and precipitation processes of ore-forming elements are the key to understanding the mineralization mechanisms and processes of skarn-type deposits [7]. Accurately defined boundaries of a skarn deposit can precisely constrain the ore-forming model, provide information on mineralization distance and guide mineral exploration. Additionally, it can determine variations in ore grades, distribution, rock characteristics, etc. [8].
Previous studies on skarn deposits have been relatively extensive and a fairly complete model of skarn formation has been established [2]. In skarn formed by magmatic processes, those formed within the rock body are called inner skarn, while those formed in the surrounding rocks are called outer skarn. Worldwide studies indicate that the inner zone is generally less developed in the skarn [1,2,3]. Outer skarn is characterized by the presence of numerous skarn minerals, which are also the primary sites of skarn-type deposit formation. Microscopically, inner skarn may contain remnants of original minerals such as feldspar and mica, whereas outer skarn does not show any trace of the original minerals. However, some weak outer skarn still retains the characteristics of the original rock, which can often cause interference [9]. Moreover, compared to intrusive rocks, carbonate surrounding rocks are less likely to preserve the characteristics of the original rock. For example, in the Antamina skarn deposit in Peru, the vein-like outer skarn is often mistaken for inner skarn [8]. In certain deposits such as Qiaoxiahala, late-stage overprinting influenced the classification and interpretation of the deposit type in earlier years [10]. From a geochemical perspective, there are significant differences in the whole-rock major and trace elements between the inner and outer skarn [8,11]. Generally, inner skarn contains higher levels of high-field-strength elements (HFSE) and heavy REEs such as Ti, Sc, Nb, Y, Lu and Dy [8]. However, skarn has complex compositions and can be affected by many factors such as water-rock reactions and supergene weathering, making the whole-rock major and trace element analysis process cumbersome and costly. Moreover, the previous research is unable to explain the control factors responsible for the significant differentiation of HFSE and HREEs between inner and outer skarn [8]. Discrimination methods based on whole-rock major and trace elements also require more typical skarn profiles to validate their accuracy.
Due to the complexity of the skarnization process and the superimposed reformation, previous studies often faced the problem of insufficient representativeness of the selected samples [1,8]. At present, most research on skarn is based on only whole-rock [8,11,12,13] or single-mineral analysis [14,15,16,17]. There is relatively a lack of research on how to determine the skarn contact zone. There is also a lack of work that combines the analysis of single minerals (such as garnet, pyroxene, etc.) with whole-rock analysis to understand the physical and chemical processes of skarn formation, using a simple skarn profile.
With the rapid development of in-situ analysis techniques in recent years, the testing accuracy has been greatly improved, especially Laser Ablation Inductively Coupled Plasma Mass Spectrometer (LA-ICP-MS), which can achieve ppm-level element content and spatial distribution analysis of minerals at the micrometer scale [18,19,20]. Compared with whole-rock geochemical analysis, LA-ICP-MS also has lower costs and faster speeds.
Garnet is the most common mineral in skarns, forming through contact metamorphism or hydrothermal alteration of silicate minerals [1]. The chemical formula of garnet is A3B2[SiO4]3, where A is a divalent cation, mainly including Mg2+, Fe2+, Mn2+, Ca2+ and B is a trivalent cation, mainly including Al3+, Fe3+, Cr3+ [21]. This structure enables certain elements to enter garnet through some mechanisms such as substitution and lattice defects [22]. It is often used as an indicator to trace the evolution of hydrothermal fluids in skarn-type mineral deposits [14,16,17]. Jamtveit et al. (1994) discovered that the garnet in the Oslo region showed significant differences in the contents of F and some other trace elements from the andradite core to the grossularite edge [23]. This change indicates that fluid convection and fluid dynamic mechanisms affected the distribution of elements in garnets during brittle deformation. Some garnet crystals show obvious zonation, which can reflect the process of water-rock reactions, indicating the source of ore-forming fluids, fluid mixing, changes of pH value and of fO2 and other physicochemical properties were changed during the garnet forming [24,25,26].
We discovered a typical skarn profile in the Tongshan Cu-Mo deposit of the Ningzhen mining district, located in the Lower Yangtze River Metallogenic Belt (LYRMB). This skarn profile closely conforms to the classic skarn zonation model, which includes a fresh intrusive rock, a weakly altered zone, a skarn zone (comprising inner and outer skarn), a mineralized zone (mainly characterized by Cu mineralization) and the surrounding marble over a span of approximately 4 m. The profile remains exceptionally fresh and has not undergone any significant alteration from late-stage low-temperature or supergene weathering. Furthermore, garnet and diopside are widely prevalent within this skarn profile.
In this study, we compared the distribution of whole-rock and garnet geochemistry between the inner and outer skarn zones, delved into the migration behavior of elements during skarnization (particularly trace element geochemistry) and aimed to characterize the formation process of the skarn. Our findings demonstrate that when it comes to distinguishing the boundary between the rock body and carbonate, combining both whole-rock and mineral geochemistry methods proves more effective than relying solely on either approach.

2. Geological Background and Sampling

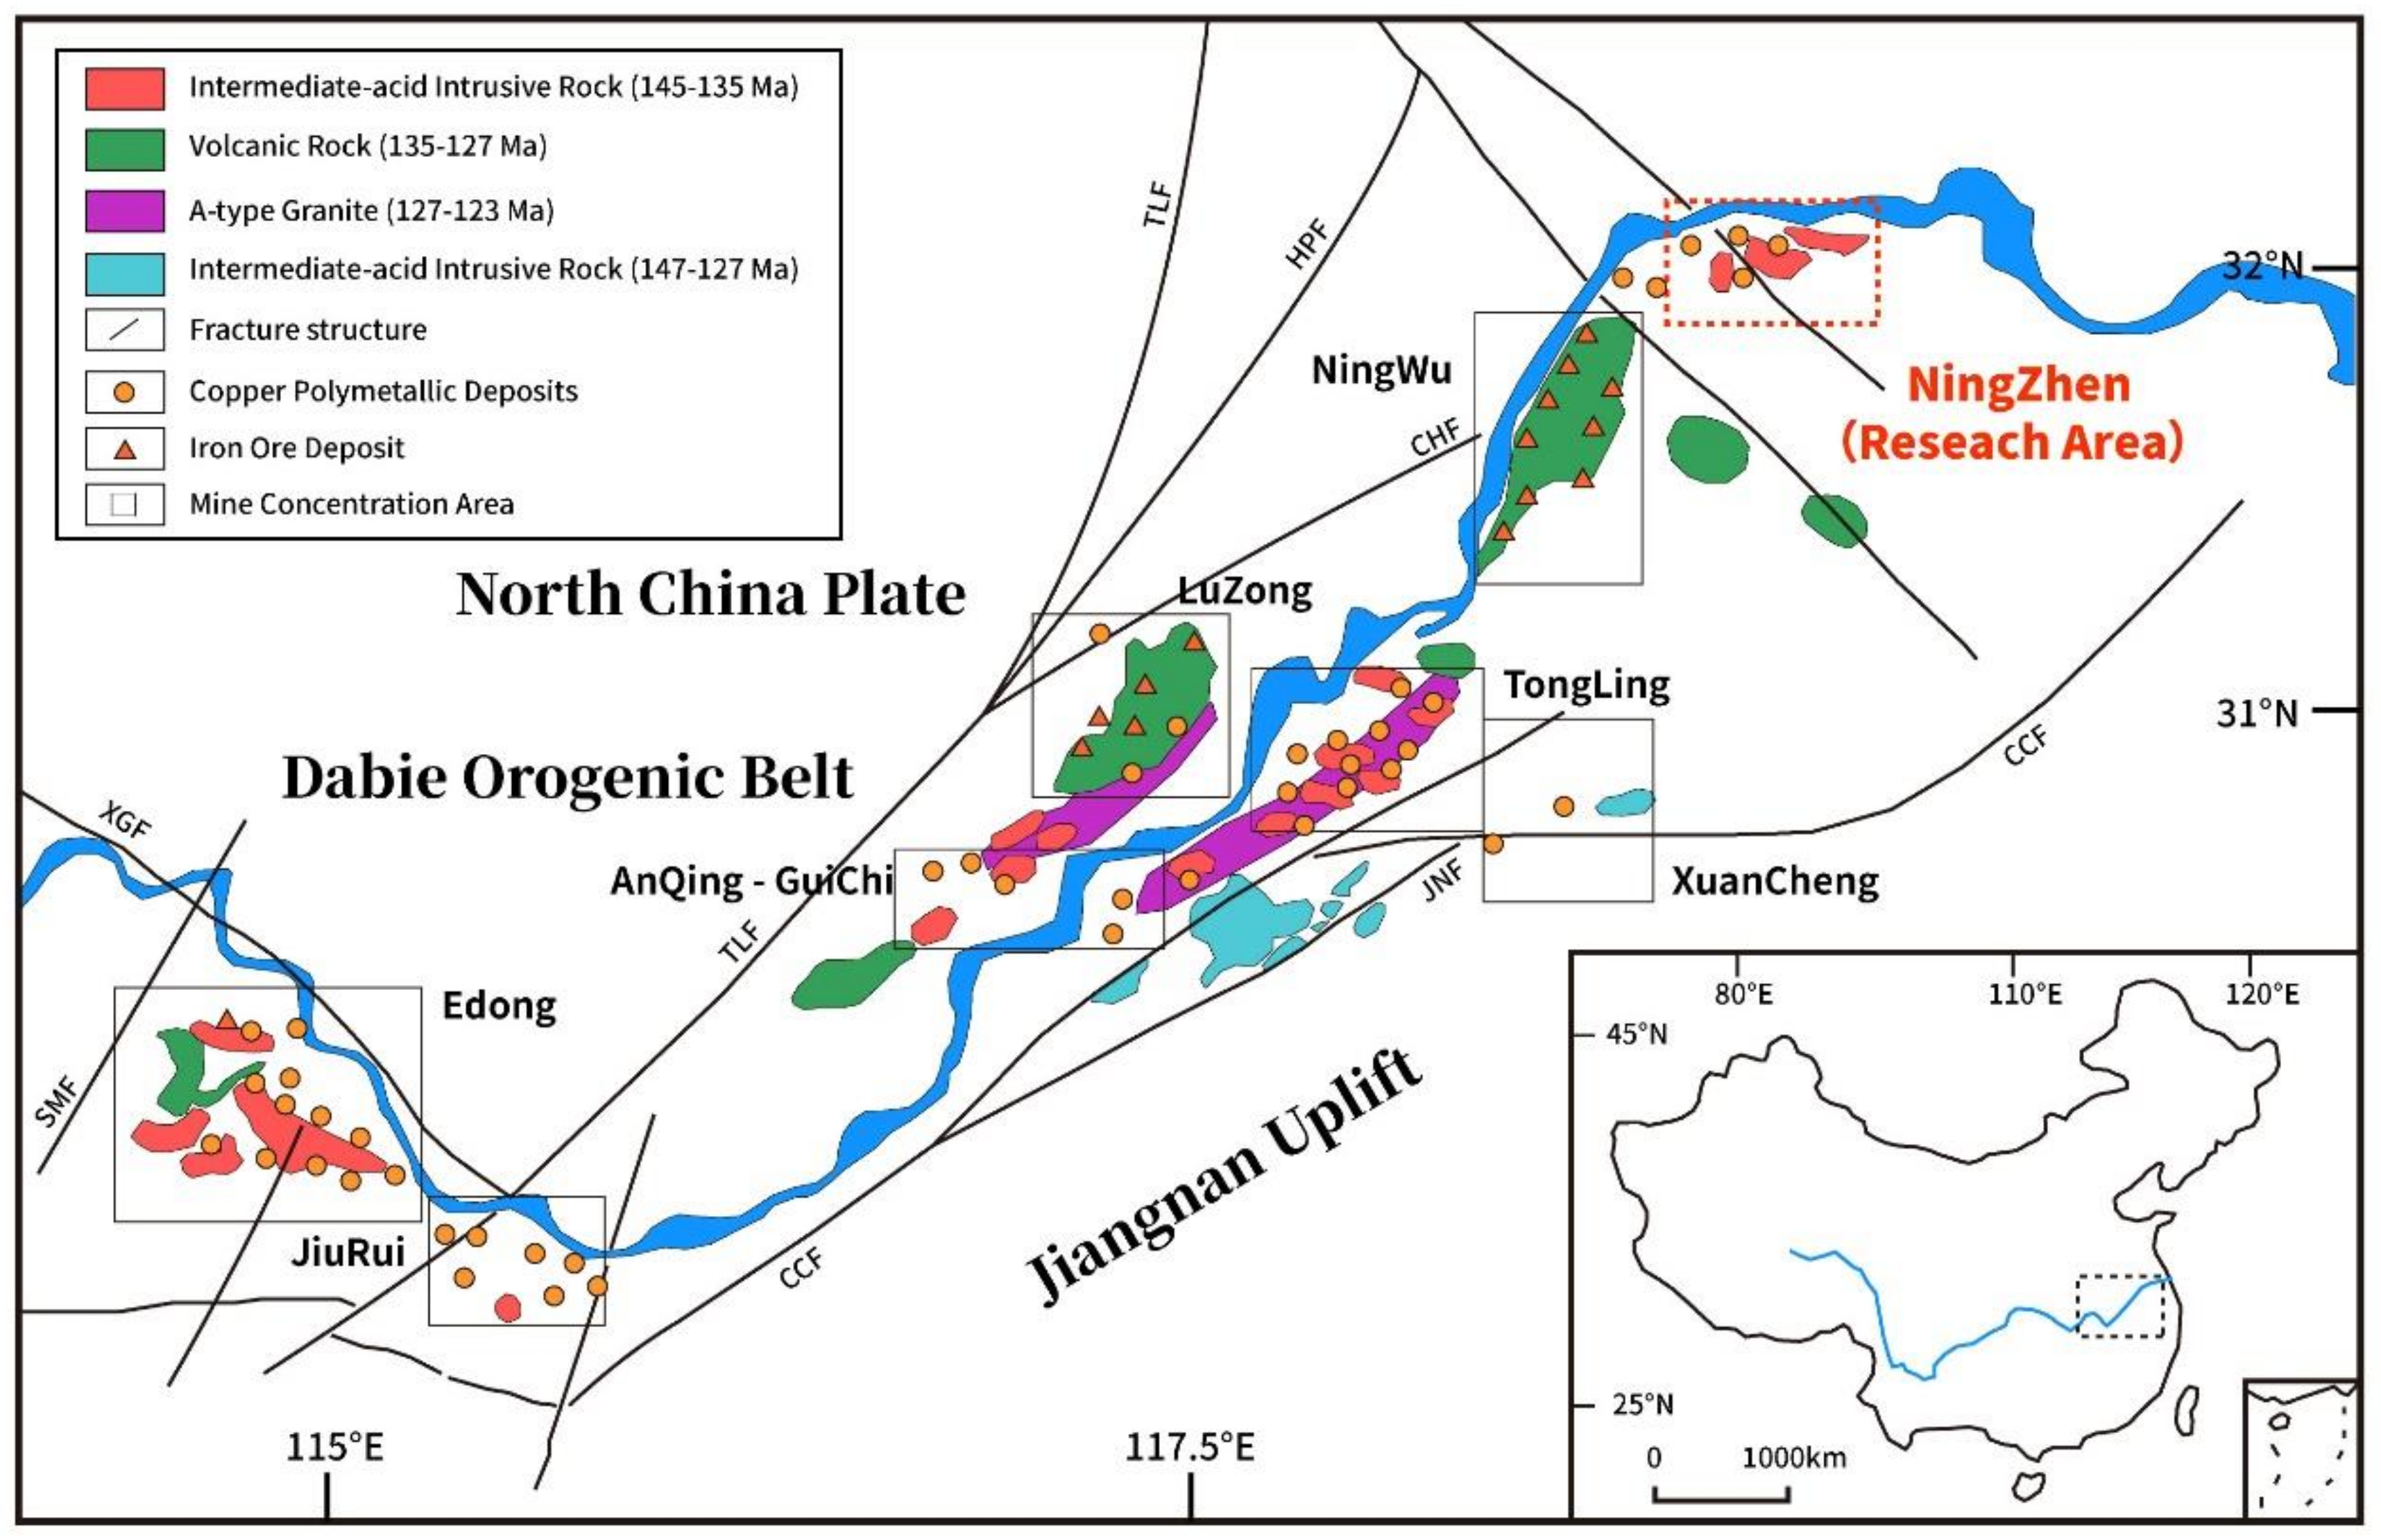
2.1. Geological Background

The study area is located in the Ningzhen region, which is part of LYRMB in eastern China. The LYRMB is one of the most important metallogenic belts in China, containing over 200 Cu-Fe-Au-S deposits. This belt comprises the eastern portion of the Yangtze block in central-eastern China and spans approximately 600 km from Hubei Province in the west to Jiangsu Province in the east. The LYRMB includes a Paleozoic basement and a sequence of Mesozoic sedimentary rocks [27]. The exposed stratigraphic sequences range from Silurian to Triassic and consist of shallow marine sandstones, shales, quasi-molasse and lacustrine sediments. Cretaceous volcanic rocks overlay the sediments, and the region was subsequently covered with red-bed clastic sedimentary rocks, with minor basalt.
Magmatic rocks are well-developed in this region, mainly forming during the Yanshanian period (Bai et al., 2022). As shown in Figure 1, moving from west to east, these ore clusters are: (1) Edong Cu-Fe-Au district, (2) Jiurui Cu-Fe-Au-W district, (3) Anqing-Guichi Cu-Mo-Au district, (4) Luzong Fe-Cu district, (5) Tongling Cu-Au-Fe-S district, (6) Nanling-Xuancheng district (Lu et al., 2022), (7) Ningwu Fe district and (8) Ningzhen Cu-Mo-Fe-W-Pb-Zn district. Most of the deposits are associated with Yanshanian magmatic rocks and are skarn-porphyry, strata-bound type deposits. The Tongshan skarn Cu-Mo deposit is located in the Ningzhen region. The structural framework of the Ningzhen region comprises three anticlines and two synclines in the west-east direction. The magmatic rocks in this region are primarily early Cretaceous, 20 Ma younger than other ore regions in LYRMB [28]. There are two skarn-porphyry type Cu-Mo deposits, e.g., Anjishan medium-sized porphyry Cu deposit and Tongshan skarn Cu-Mo deposit (Figure 2). The magmatic rocks in this district are mainly quartz diorite, named Anjishan, Funiushan, Xiyingkeng, Tongshan, Hongshuidang, and Xiashu plutons.

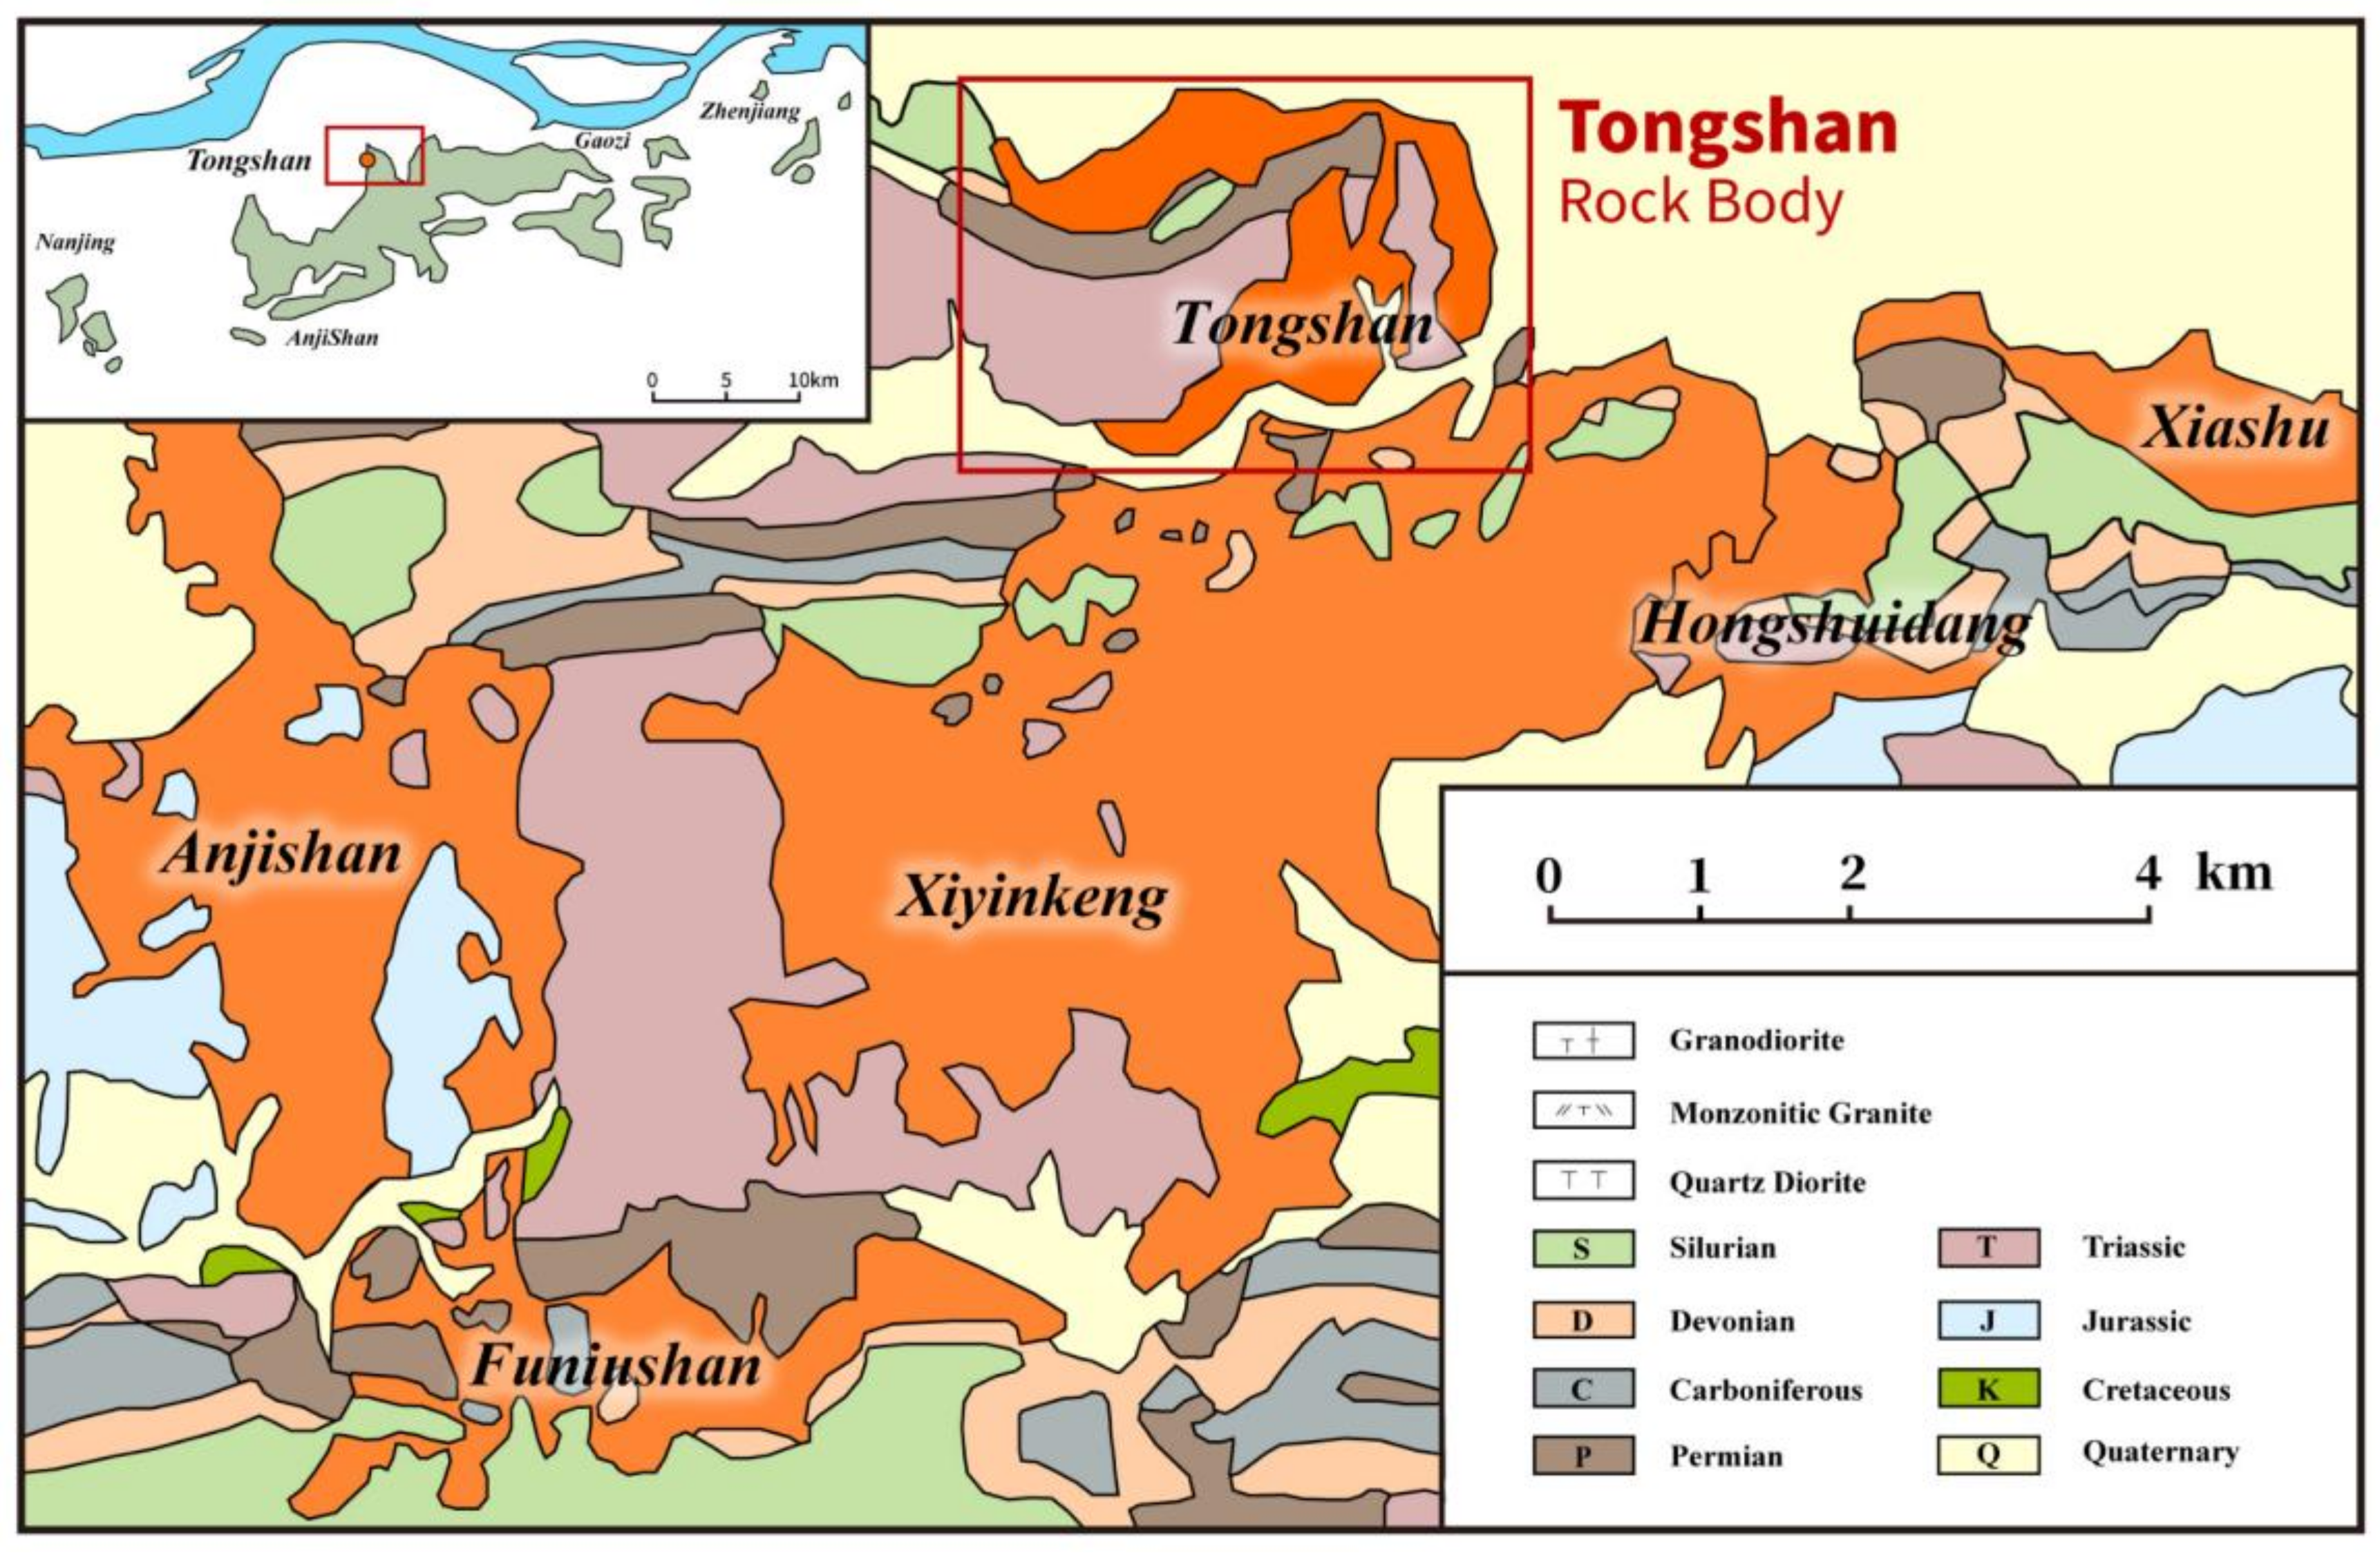
2.2. Geology of Tongshan Skarn Cu-Mo Deposit

The Tongshan skarn Cu-Mo deposit, located in the central part of the Ningzhen region, is a typical skarn Cu-Mo deposit. The granodiorite intruded into the limestone of the Carboniferous Huanglong Formation to form the Tongshan skarn Cu-Mo deposit. Previous zircon U-Pb dating of the granodiorite yielded an age of 106 Ma [28], similar to the molybdenite Re-Os age (106 Ma) [32], further indicating the genetic relationship between granodiorite and Cu-Mo mineralization. After detailed fieldwork, we identified a typical zoned skarn profile consisting of a fresh granodiorite zone, altered granodiorite zone, garnet-rich zone, pyroxene-rich zone, sulfide-rich zone, and marble zone. This profile is approximately 4 m long (Figure 3).
To document the various phases of skarn formation, we collected a total of 15 hand specimens from the TS-10 skarn section. Among them, Nos. 14–15 were collected from the granite belt, Nos. 8–13 from the inner skarn belt, Nos. 2–7 from the outer skarn belt, and No. 1 from the marble belt. Based on micro-petrographic observations, we estimated the mineral content in each sample. As shown in Figure 4, garnet is observed in samples Nos. 3–8, traversing the demarcation between inner skarn and outer skarn.

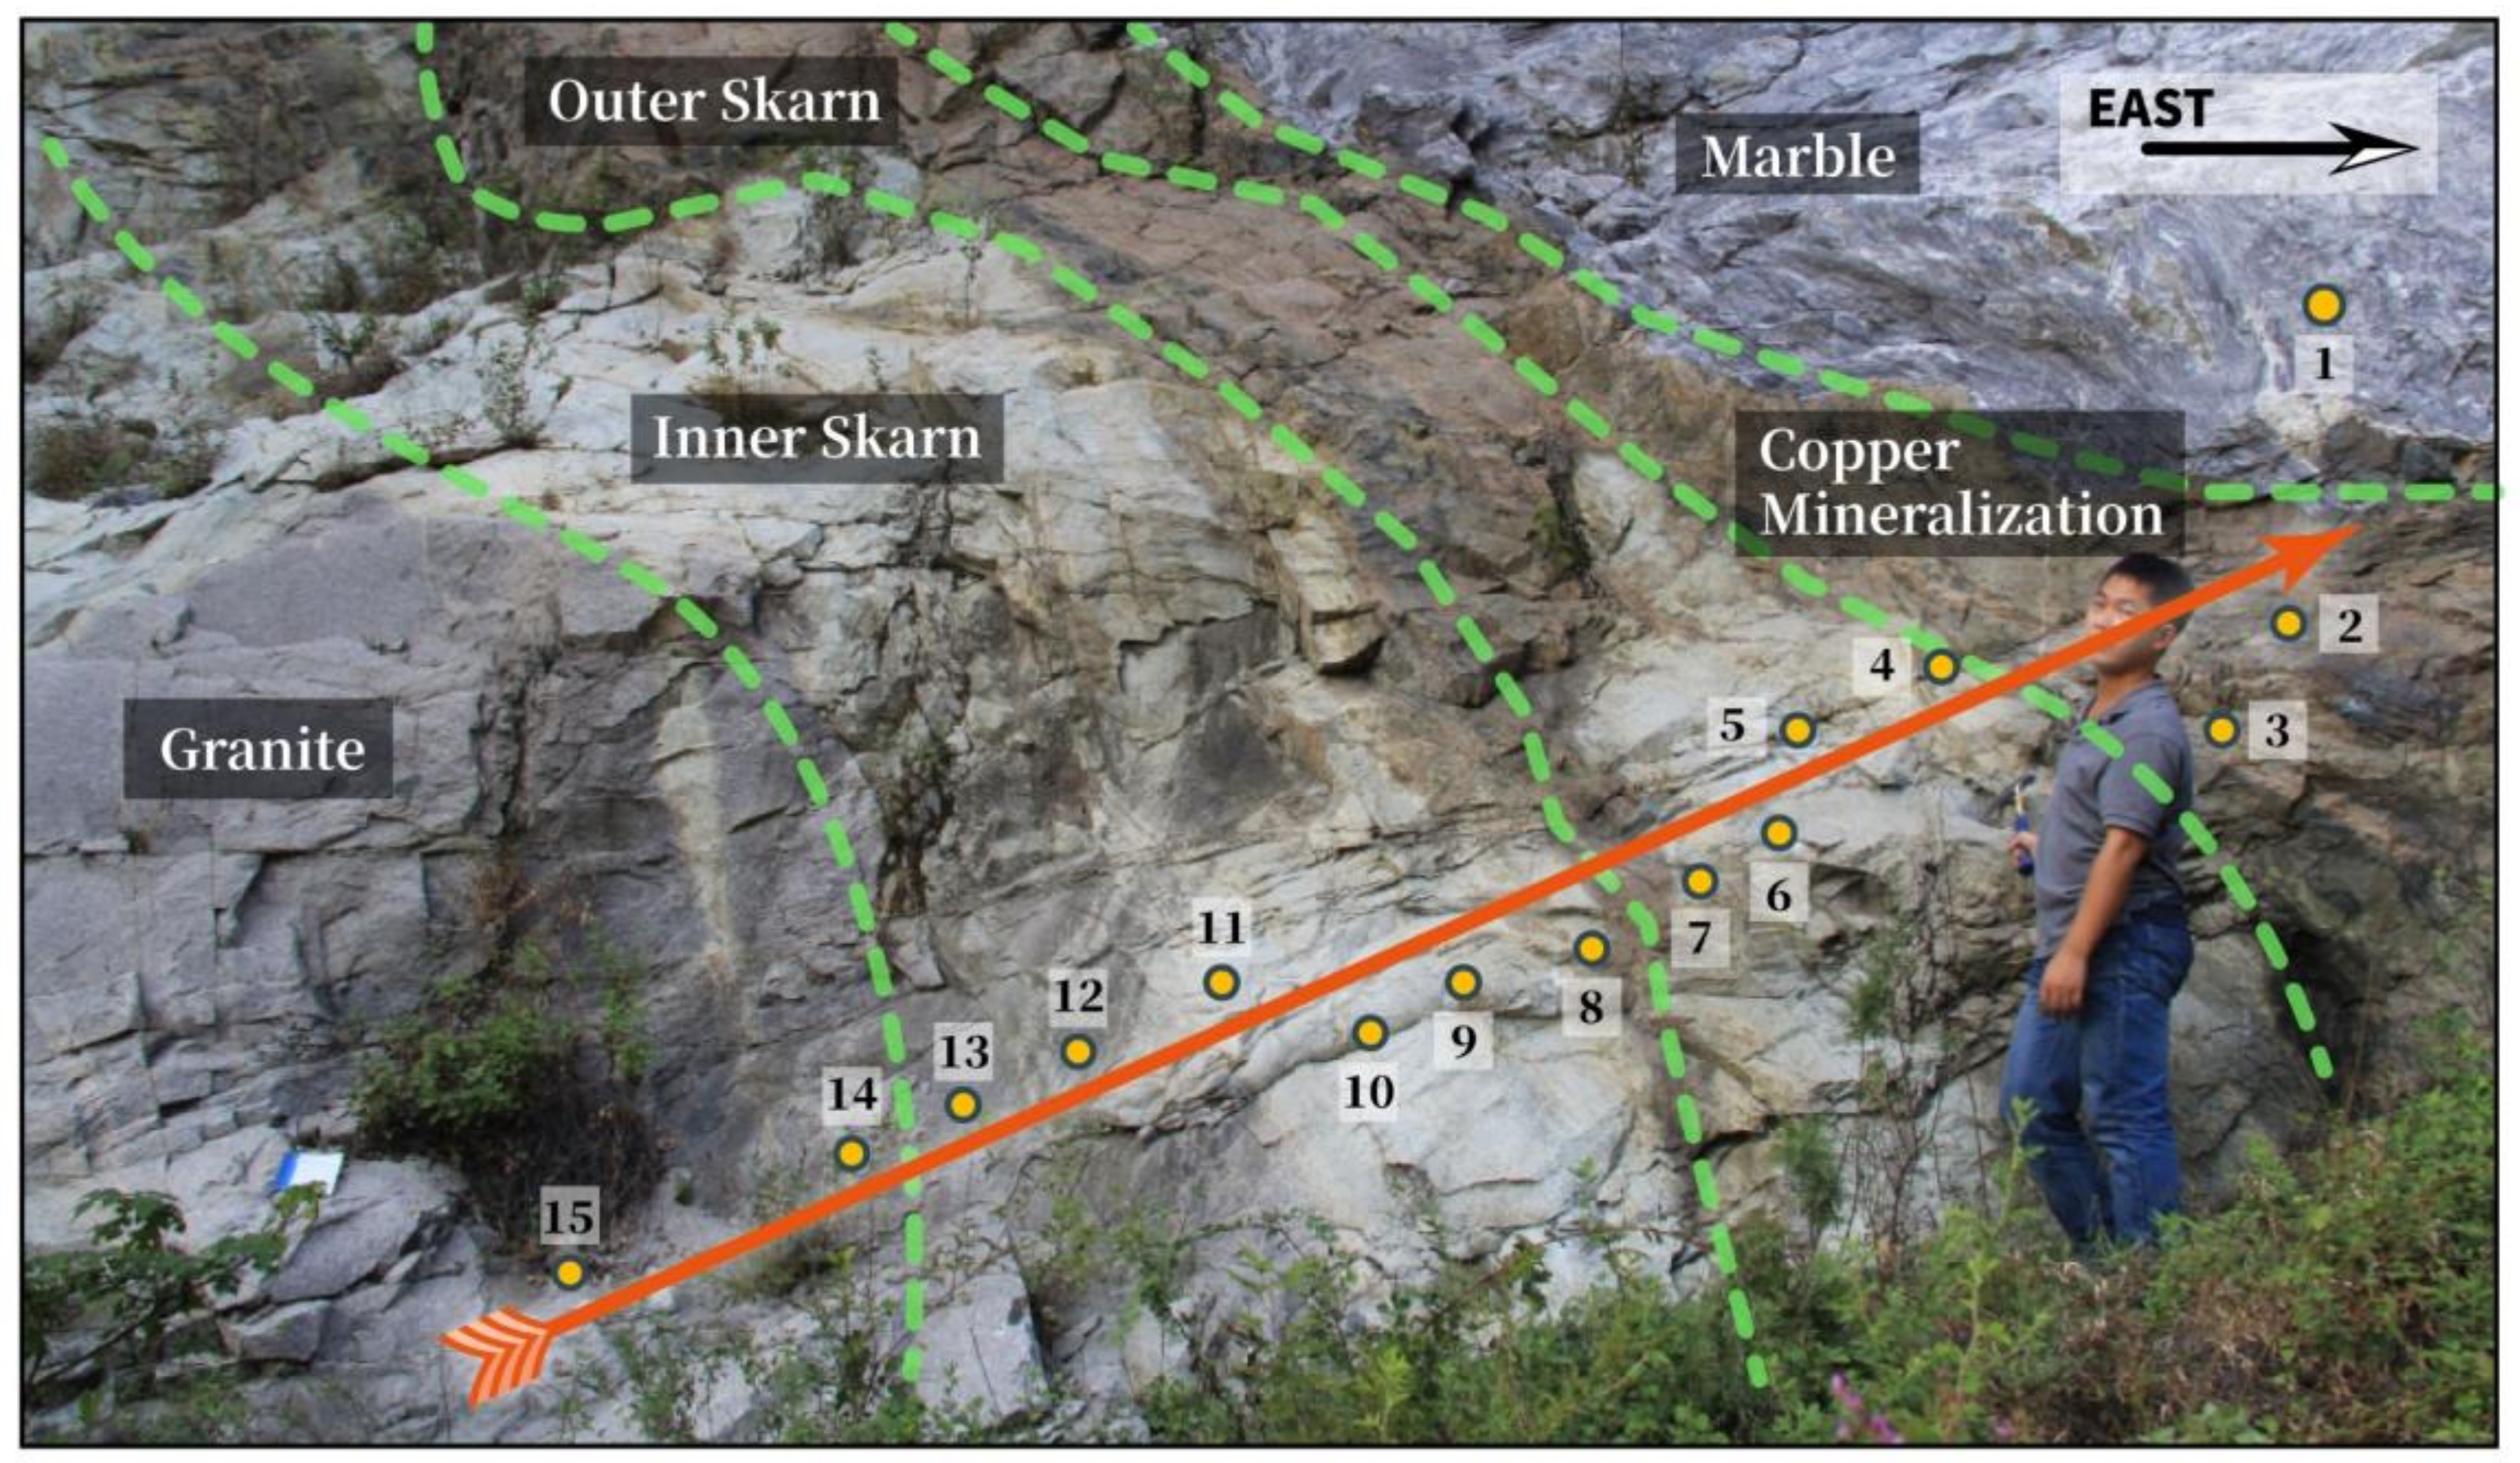
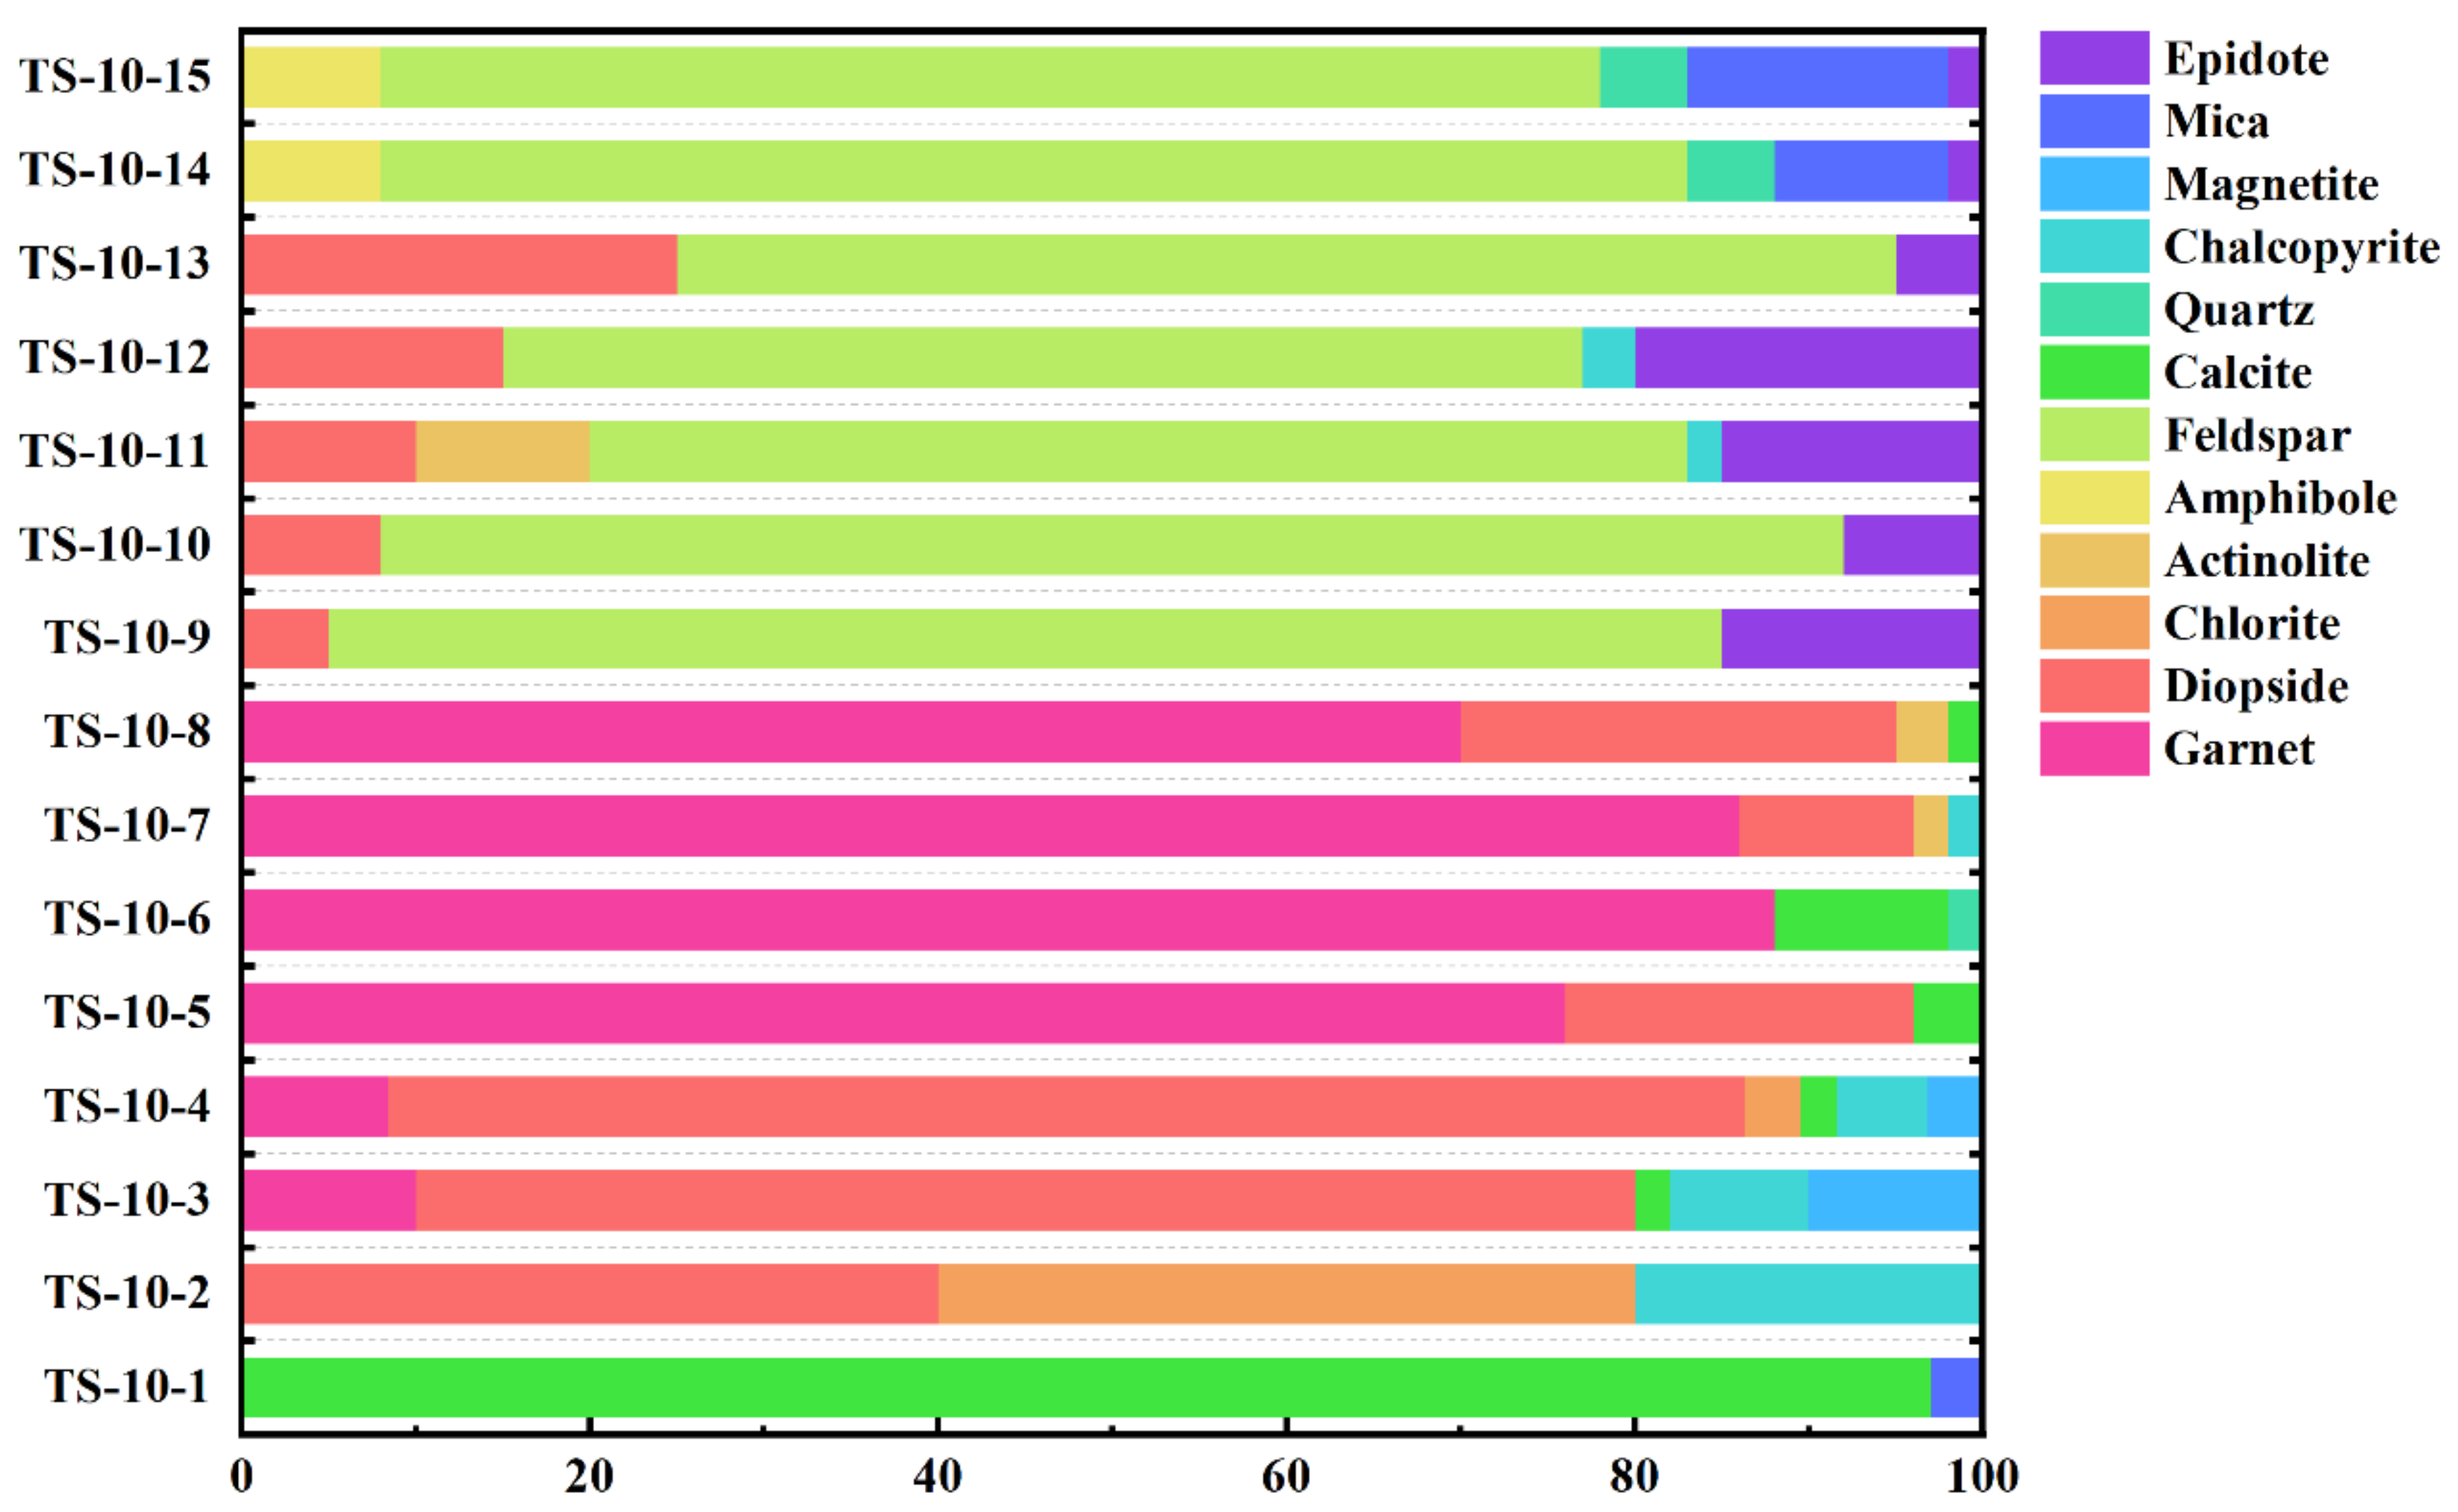
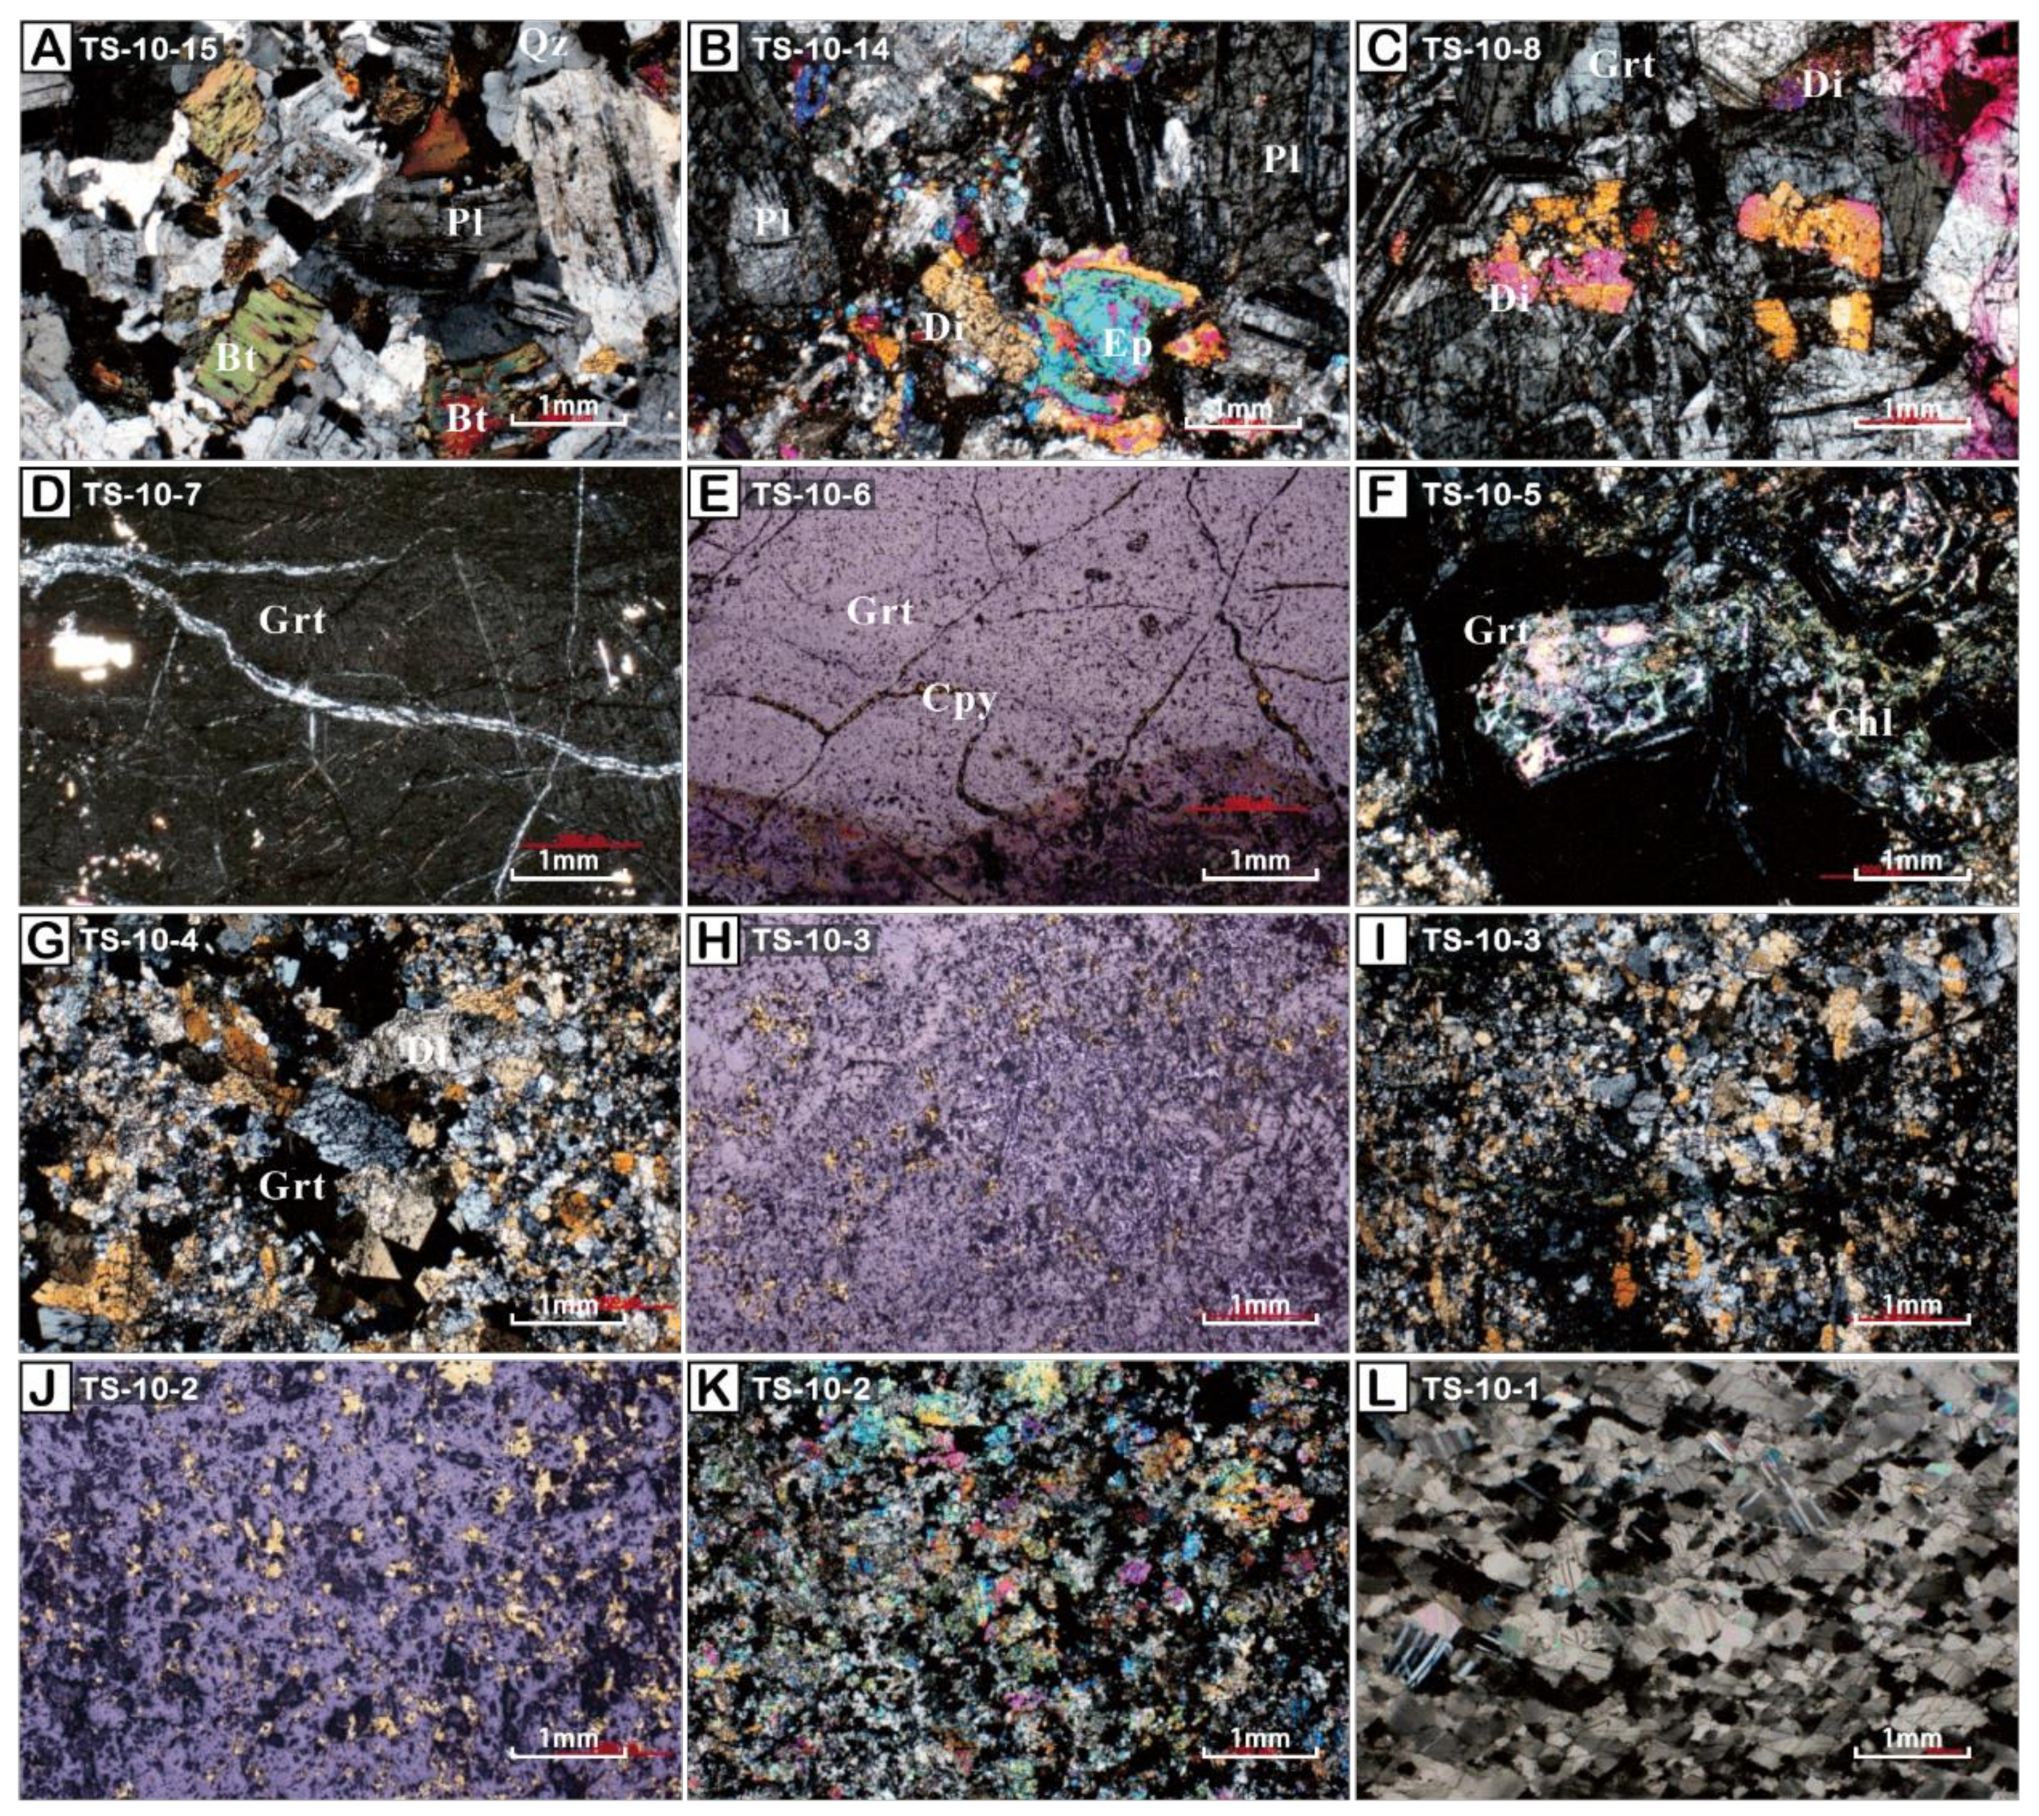
2.3. Sample Petrological Characteristics

The fresh granodiorite (Figure 5A, TS-10-15) is composed of quartz (25%), feldspar (~45%), biotite (~15%), and amphibole (15%). Near the skarn zone, plagioclase in granodiorite exhibits slight sericitization, and new minerals such as chlorite and diopside (0.1–0.2 mm) become more prominent, while Fe-rich amphibole and biotite minerals disappear (Figure 5B, TS-10-14). Moving further from the intrusion, garnet and pyroxene minerals increase in prominence, and chlorite disappears (Figure 5C); however, occasional chlorite veins are found within garnet. In this area, garnet and pyroxene are the primary minerals, with the proportion of garnet being five times greater than that of pyroxene. The proportion of garnet can increase to over 90% as one moves further from the intrusion in the eastern direction, where most garnets are euhedral, defining the garnet-enriched outer skarn zone. Chalcopyrite (cpy) veins also occur within cracks in the garnet (Figure 5E, TS-10-6). Chloritization and epidotization are evident in the core of garnet (Figure 5F, TS-10-5). As one continues further from the intrusion, fine-grained pyroxene appears, and its proportion relative to garnet gradually increases (garnet:pyroxene < 1:5) (Figure 5G, TS-10-4). Cpy and magnetite growth and abundance increase at the boundaries of the main minerals (Figure 5H, TS-10-3; Figure 5J, TS-10-2). This area has experienced copper mineralization with a copper content of 2 wt.%. Calcite constitutes over 99% of the marble in this field (Figure 5L, TS-10-1).
From preliminary observations of specimens, we noted that the skarn profile ranges from rock mass, weak alteration zone, skarn zone, and mineralization zone (mainly Cu mineralization), to fully developed marble surrounding rock. Later stages of low-temperature and superficial weathering alteration were not developed. This profile is similar to the classic skarn profile [2] and serves as a good example for the study of skarnization processes.

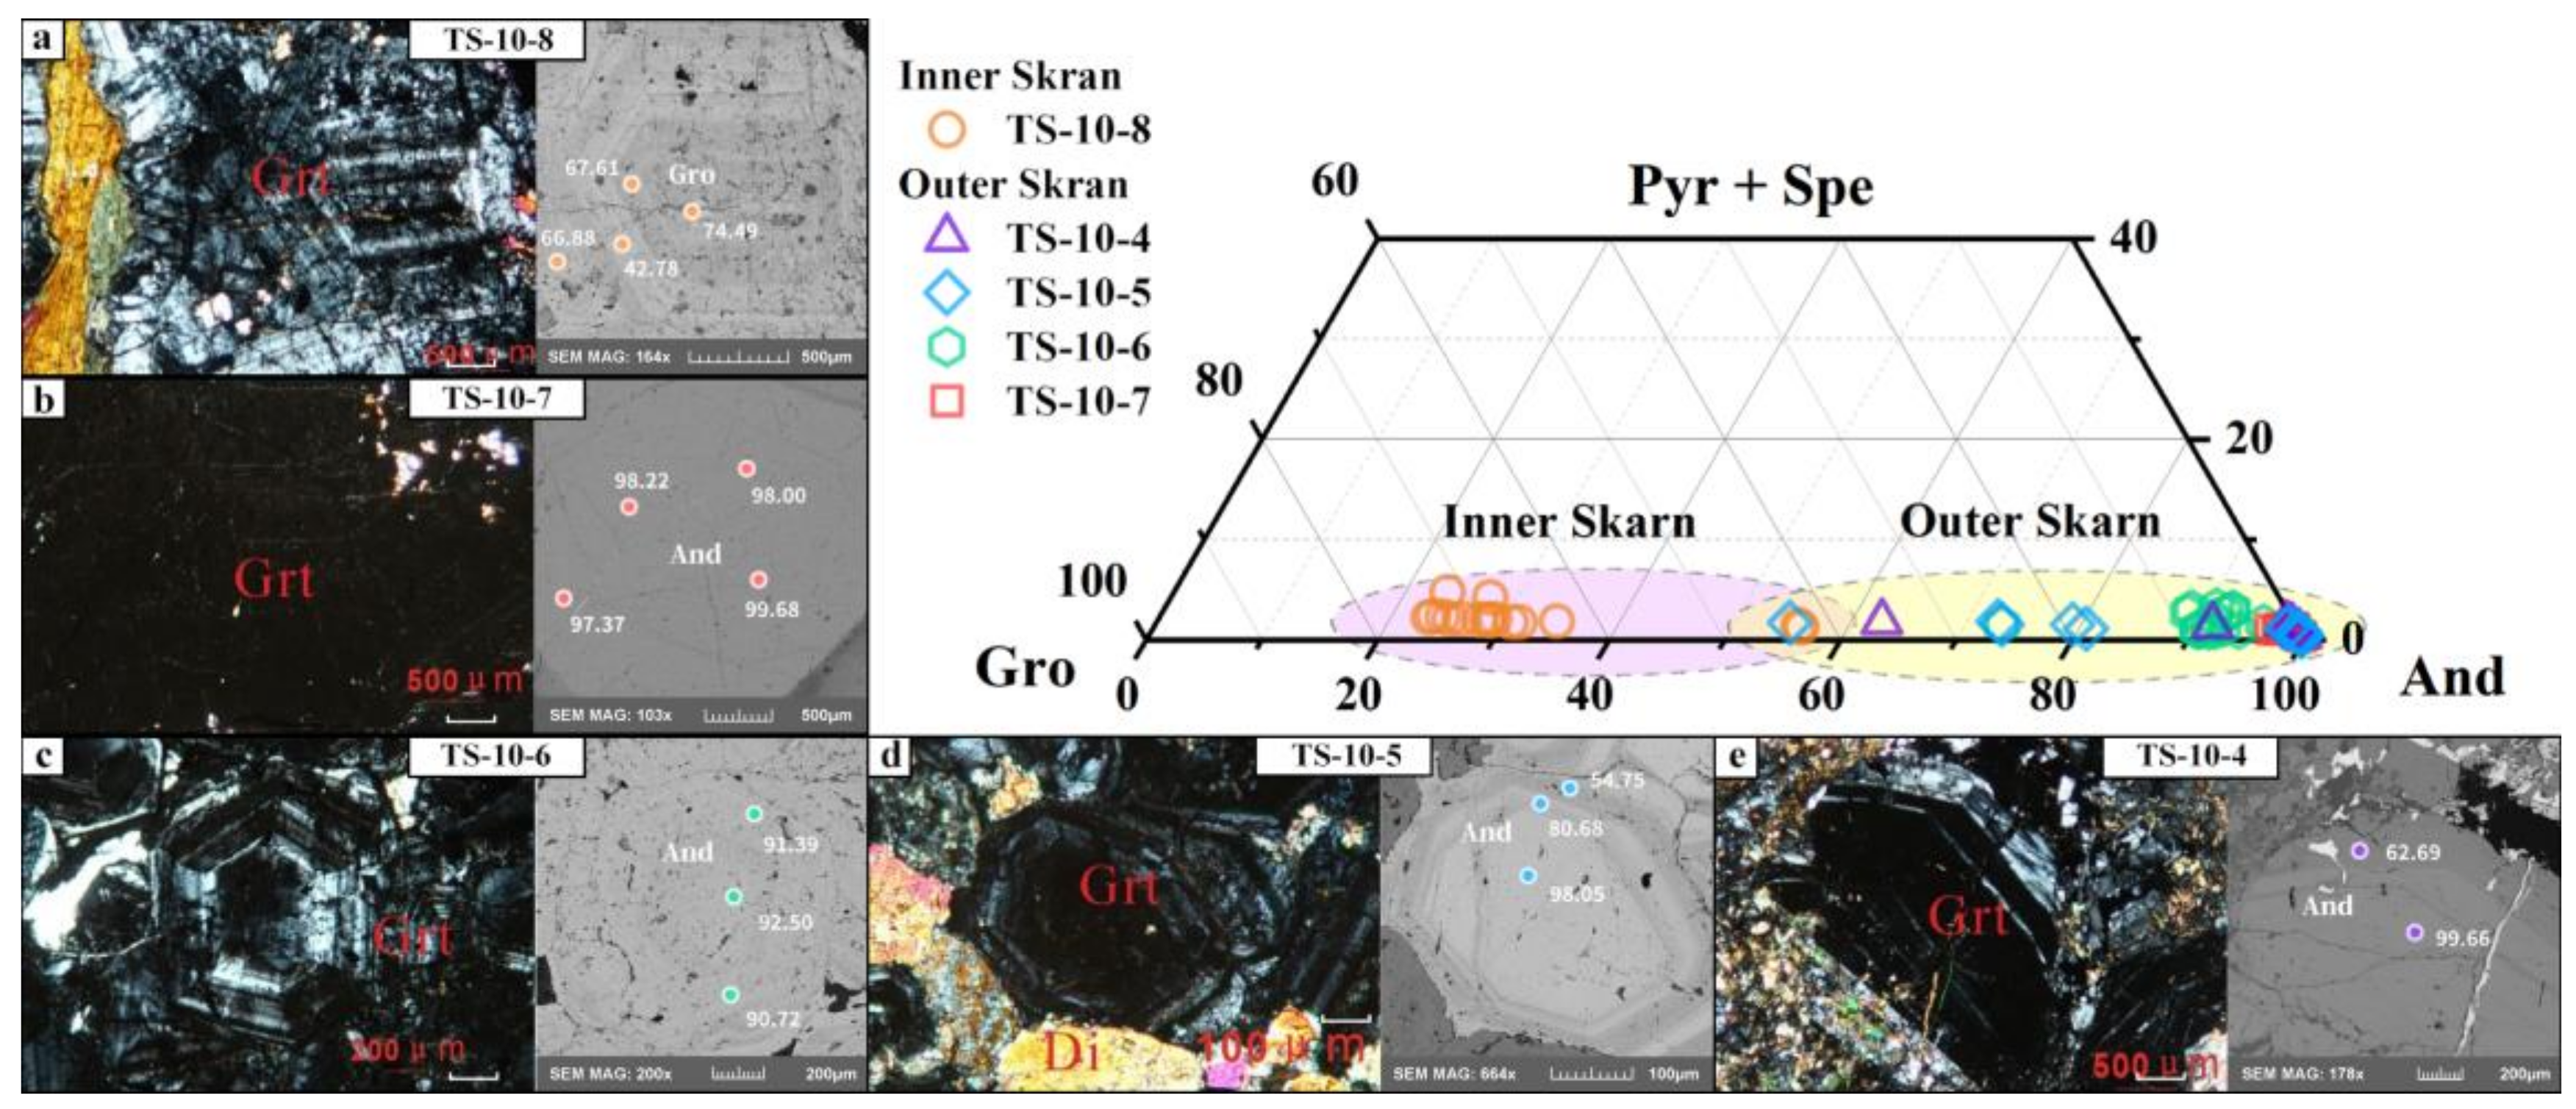
2.4. Garnet in Skarn Profiles

Garnets from different parts of the profile exhibit distinct characteristics. In the sample TS-10-8 (Figure 6a) from the inner skarn, the predominant mineral assemblages consist of grossularite (70%), diopside (25%), actinolite (3%), and calcite (2%). The grossularite has And (andradite) end-member ranging from 42.78% to 74.50%, with an average value of 66.73%. The crystal form of almandine is commonly known as a pyritohedron, with larger particles measuring between 2 and 5 mm.
The outer skarn samples include TS-10-7 to TS-10-4, and all their garnets are andradite. The mineral assemblage of TS-10-7 consists mainly of andradite (86%), diopside (10%), actinolite (2%) and chalcopyrite (2%). The end-member of And ranges from 96.66% to 99.68%, with an average value of 98.14%. The garnet is massive and homogeneous, partially penetrated by garnet veins and lacks a ring structure (Figure 6b). The mineral assemblage of TS-10-6 consists mainly of andradite (88%), calcite (10%) and quartz (2%). The end-member of And are 88.71% to 95.76%, with an average value of 91.55%. The andradite is mostly hexagonal and has a well-formed ring structure with a particle size ranging from 0.5 to 1.5 mm (Figure 6c). The mineral assemblage of TS-10-5 is made up of andradite (76%), pyroxene (20%) and calcite (4%). The terminal elements of andradite range from 54.75% to 99.55%, with an average value of 87.82%. The garnet is euhedral allomorphic. The mineral assemblage of TS-10-4 includes andradite (8%), pyroxene (74%), chlorite (3%), calcite (2%), chalcopyrite (5%) and magnetite (3%). The end-member of And ranges from 66.69% to 99.66%, with an average value of 91.50%. The decomposition characteristics of andradite are evident, and there is a chloritization phenomenon in the core. The core is rich in iron (Adr91–99Gro0–7), and the edge is rich in aluminum (Adr62.3Gro35.5) (Figure 6e).

3. Analytical Methods

3.1. Whole-Rock Major and Trace Element Analysis

The whole-rock elemental and trace elemental contents were tested by the State Key Laboratory of Continental Dynamics, Northwestern University, China. The XRF method, utilizing the RIGAKU RIX 2100, was used to analyze the major elements, while the trace elements were tested using Agilent ICP-MS 7500a. A mixture of 1.5 mL HNO3 + 1.5 mL HF + 0.02 mL HClO4 was added to a Teflon high-pressure dissolution bomb for sample dissolution. The analytical precision and accuracy for the main and trace elements differ, with the precision for major elements generally being better than 5% and for trace elements generally better than 10% [34].

3.2. In-Situ Trace Element Analysis by LA-ICP-MS

In-situ trace element analysis was carried out at the In-situ Laboratory of the Ore Deposit and Exploration Center (ODEC), School of Resource and Environmental Engineering, Hefei University of Technology. The LA-ICP-MS analytical equipment, consisting of an AnalyteHE laser ablation system and an Agilent 7900 ICP-MS, was used for the major and trace element analysis. During the laser ablation process, helium was utilized as the carrier gas while argon was added as a compensating gas to adjust the sensitivity of the instrument. The helium and argon were mixed in the ICP through a T-connector. Prior to sample analysis, the ICP-MS system was optimized to achieve maximum sensitivity and minimum oxide yield, with the index of 232Th16O/232Th being less than 0.2%. Each sample point was analyzed for 60 s, with 20 s allocated for background signal acquisition and 40 s for sample signal acquisition. The stripping frequency was 7 Hz, and the stripping energy was 40 mJ. Sample points were selected with care, avoiding any rough or fractured areas, and each point was carefully focused prior to selection. A set of standard samples was inserted every 10 samples to ensure the accuracy and consistency of the analysis. Upon completion of signal acquisition, the data was processed using the ICPMSDataCal 10.2 software [35]. The calibration approach utilized the technique of multiple external standards without incorporating an internal standard for quantitative calculation. The calibration standard references used in this study were NIST610, NIST612 and BCR-2G [36]. The suggested elemental content values for standard samples are sourced from the GeoReM database, which can be accessed via the following URL (http://georem.mpch-mainz.gwdg.de, accessed on 31 March 2021). The detailed data processing methods and instrument operation steps are consistent with those described in Wang et al. (2017) and Shen et al. (2018) [18,37].

3.3. Mapping Analysis

The same experimental platform was utilized for both surface scanning and point analysis. The scanning area was first selected, followed by line-by-line scanning analysis. The linear scanning laser beam spot size generally ranged from 15 to 40 μm. The sample moving speed was adjusted based on the sample size, but it was always equal to or greater than the beam spot size. The scanning time for a single sample was controlled within 1.5 h. The ablation frequency was 7 Hz, and the laser ablation energy was 3 J/cm2. Prior to sample signal collection, a 30 s standard sample signal was collected, followed by a 20 s background signal. The laser parameters for the standard sample were consistent with those of the measured sample, particularly the beam spot size and ablation frequency. The data processing and post-mapping were performed using the laboratory-designed software LIMS (based on Matlab) [16,18], which automatically performed background signal deduction, instrument signal sensitivity drift, and other correction work. The element content was calculated using the 100% normalization method.

4. Results

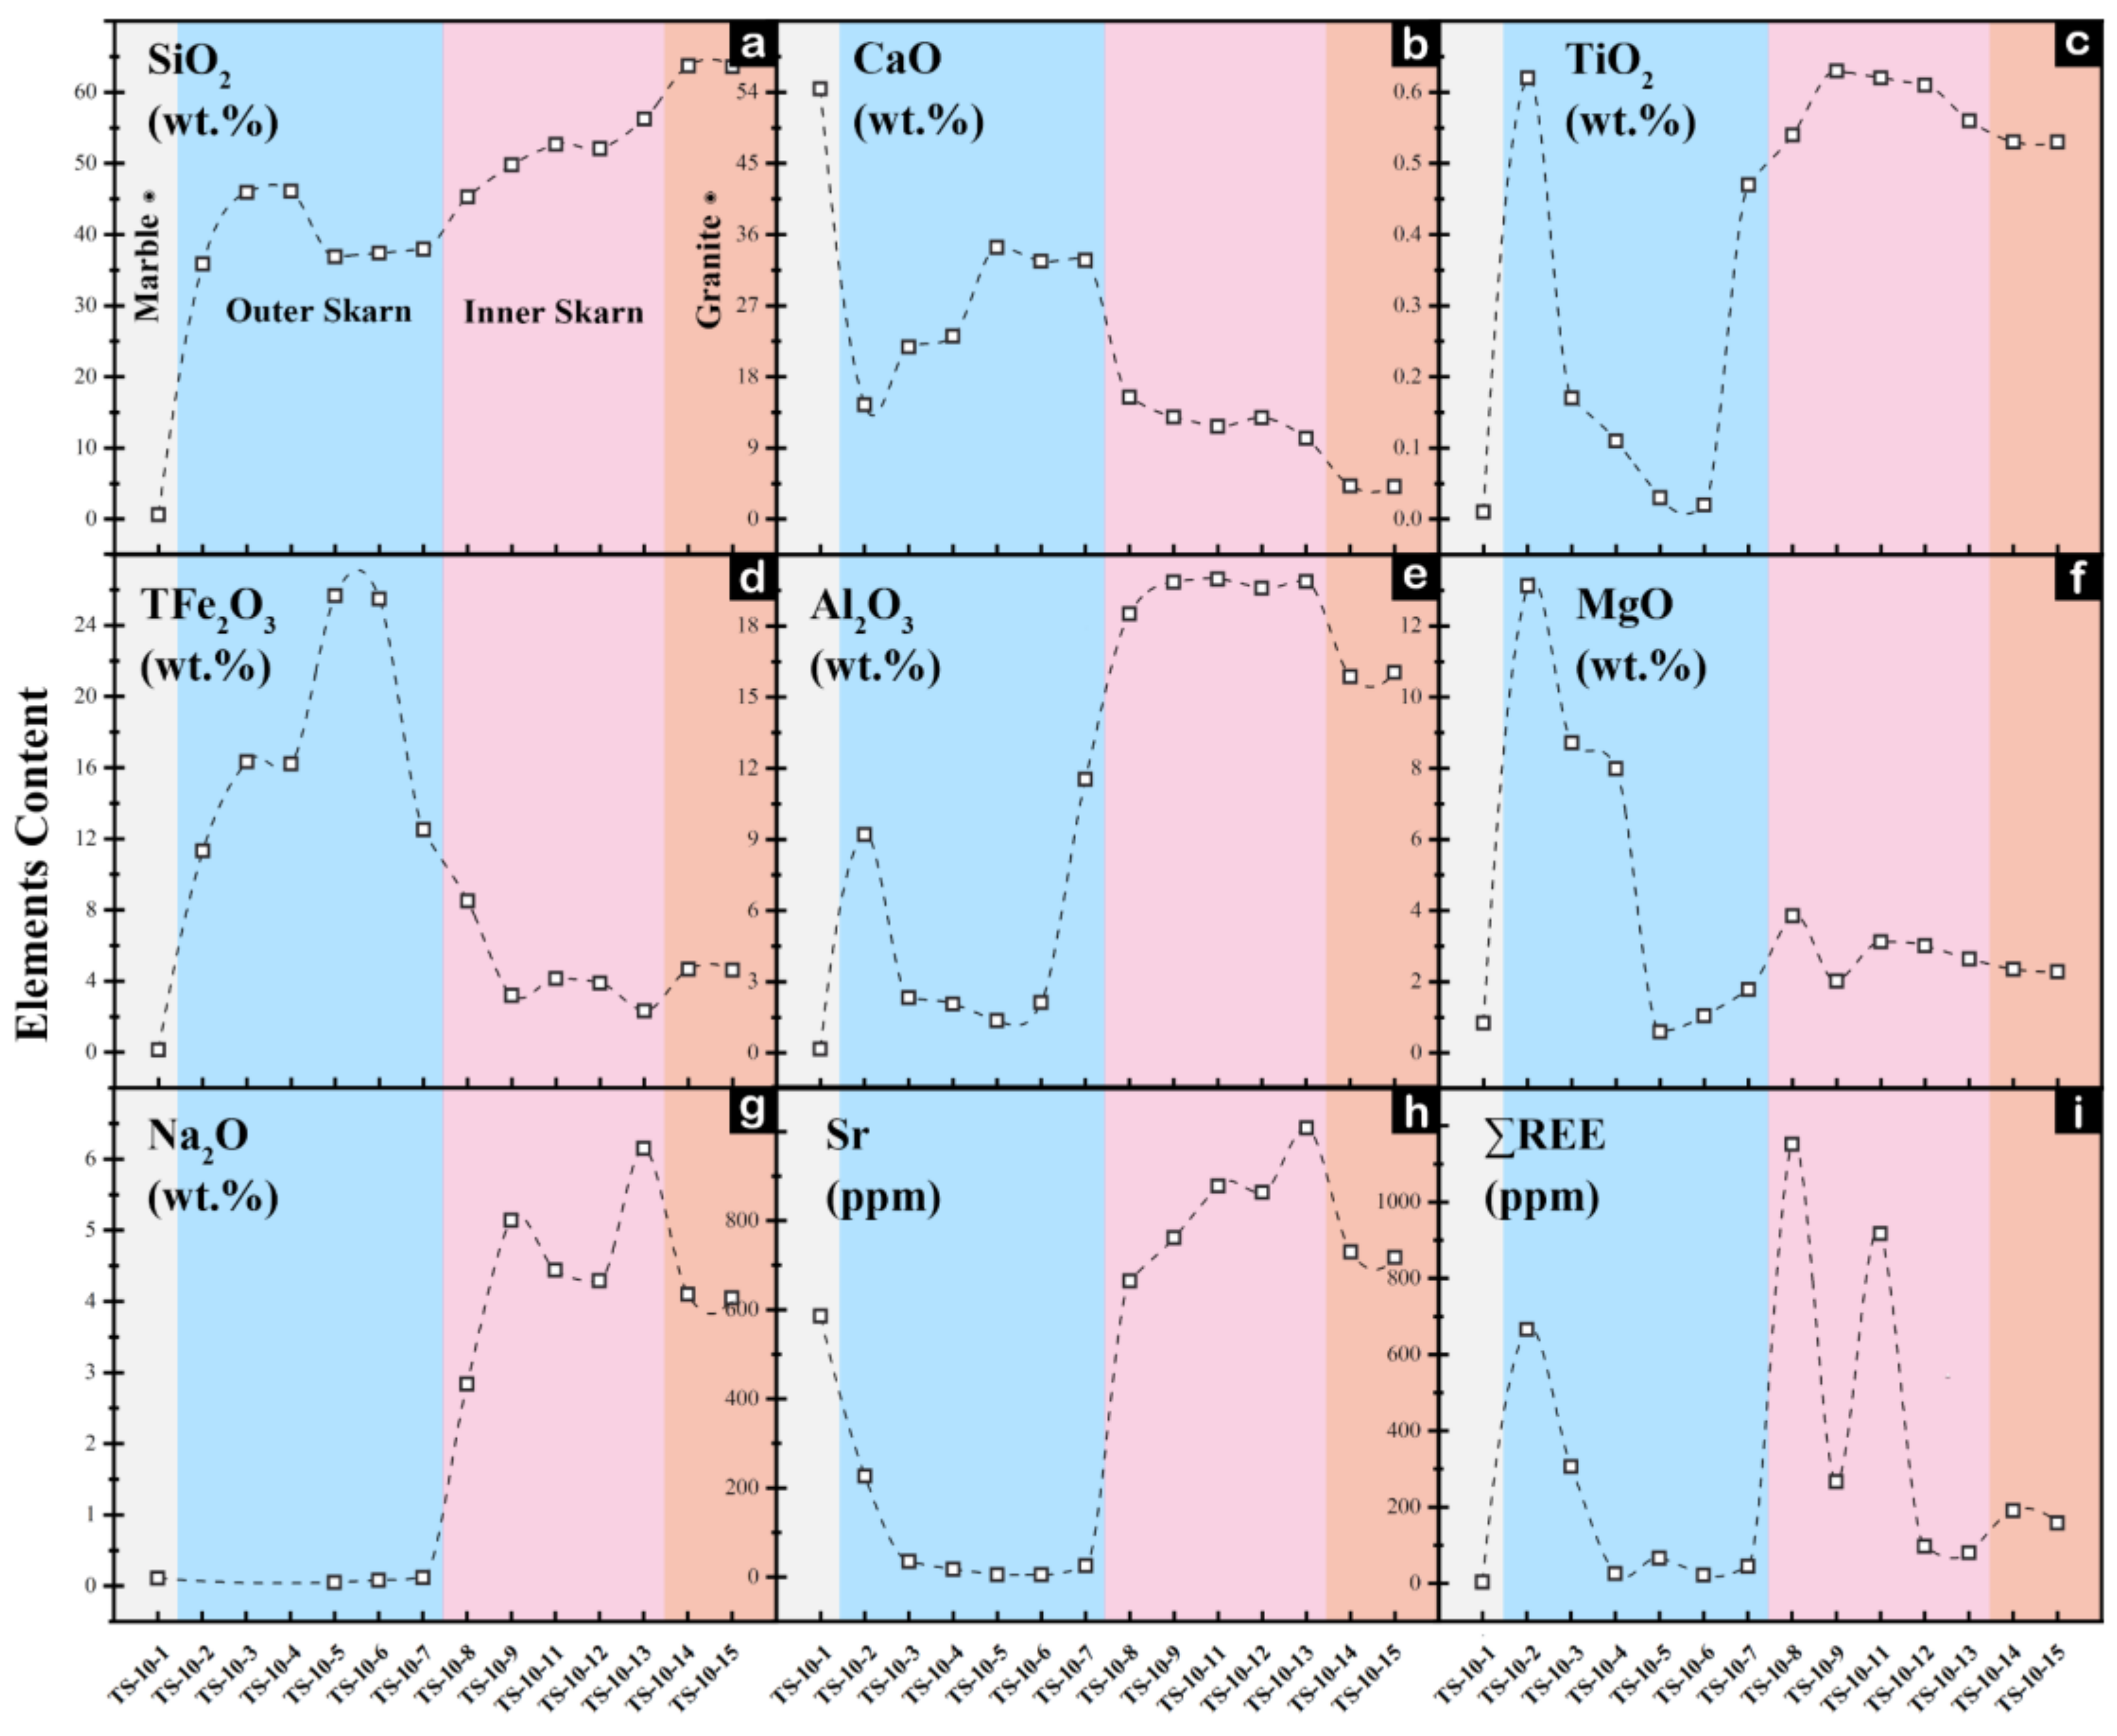
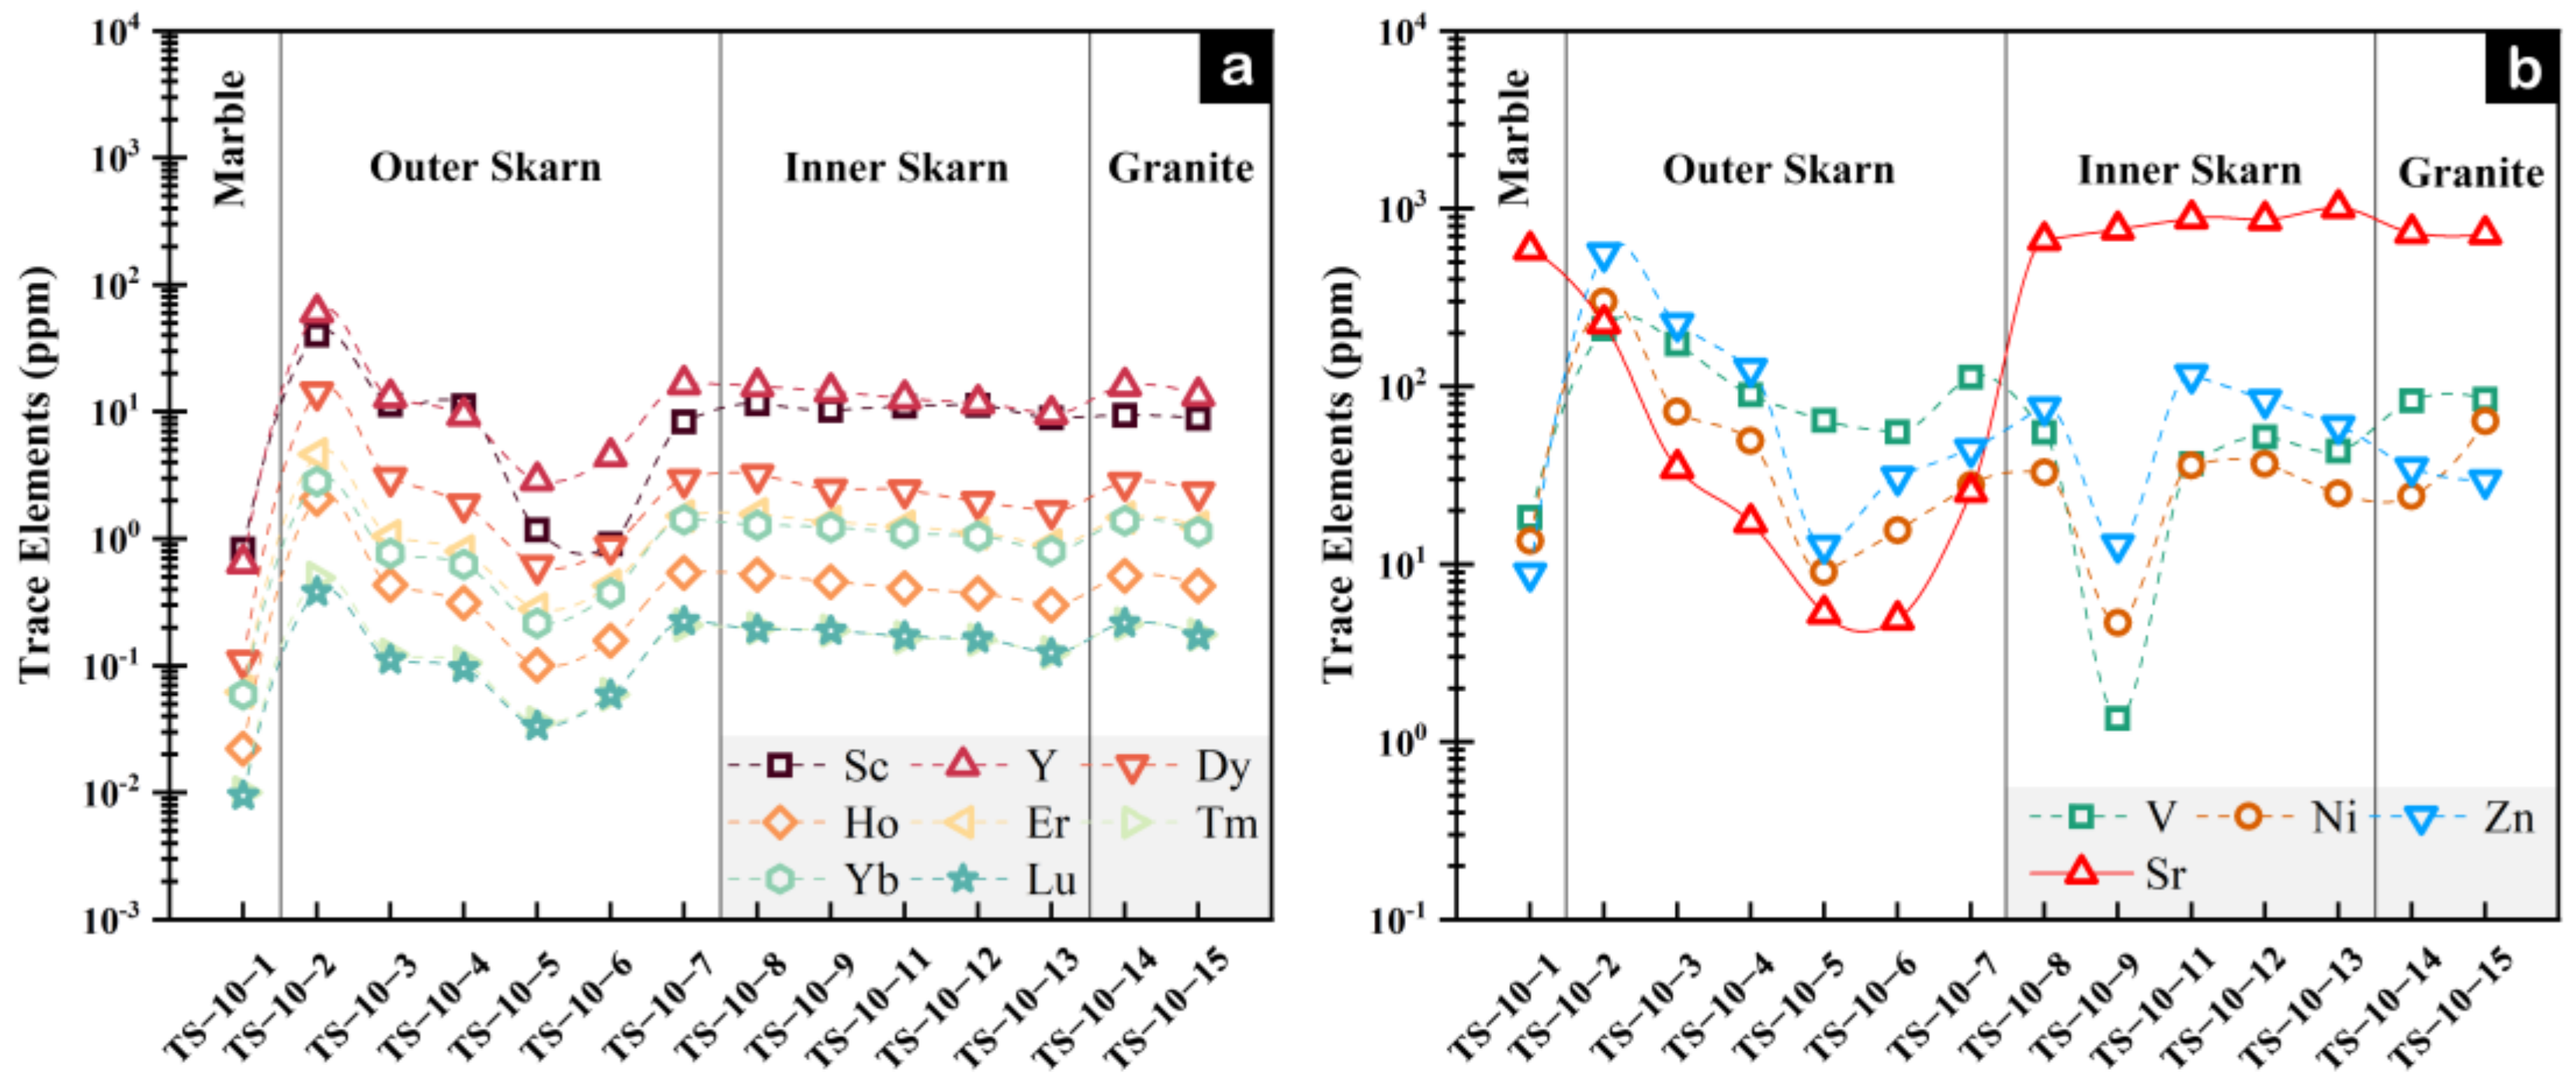
4.1. Whole-Rock Geochemical Characteristics

The whole-rock geochemical data of 14 samples from the TS-10 skarn profile are displayed in Supplementary Table S1. Among them, the mineral composition of the marble zone is 99% calcite, presenting the highest Ca content (approximately 54 wt%). In the skarn rock body, Ti, Al, Na and Sr exhibit the same evolutionary trend (Figure 7c,e,g,h), displaying enrichment in the inner skarn and depletion in the outer skarn. The changes in Ca, Fe and Mg are more pronounced (Figure 7b,d,f) and are generally enriched in the outer skarn. Ca initially increases gradually in the outer skarn, then decreases in the inner skarn, reaching a minimum in the granite zone (Figure 7b); the trend of Si and Ca changes is generally opposite, with the highest content in granite and the lowest in limestone (Figure 7a). Fe is more enriched, and its content progressively increases in the outer skarn (Figure 7d), while Al is more enriched, and its content remains relatively stable in the inner skarn (Figure 7e). This is consistent with the characteristic that the composition minerals of the outer skarn are mainly andradite and diopside, and the proportion of garnets with higher iron content increases from 10% to 88% towards the rock body (Figure 4). In contrast, feldspar, diopside, and epidote are widely developed in the inner skarn, while diopside is not present in the granite. This also results in higher Al content in the alteration zone compared to fresh granodiorite (TS-10-15) (Figure 7e).
Some trace elements have the same evolutionary trend, such as REE and similar elements. The variations of Dy, Ho, Er, Tm, Yb, Lu, Y and Sc (Figure 8a) are consistent. Transition elements, such as Zn, V and Ni, also show consistent geochemical characteristics (Figure 8b). Overall, from the inner to the outer skarn, there is an obvious decreasing trend in Na, Al, Ti and Sr (Figure 7c,e,g and Figure 8b), indicating that these elements may have been lost during the evolution of the skarn. On the other hand, Fe, Mg, Zn, V and Ni (Figure 7d,f and Figure 8b) show an obvious increasing trend, indicating that these elements may have been enriched during the process of skarnization. At the boundary between the inner and outer skarn, represented by samples TS-10-8 and TS-10-7, Na, Al, Ti and Sr show an obvious decrease, while Fe, Mg, Zn, V and Ni show a significant increase, indicating that the boundary between the two samples is possibly the original contact interface between the rock body and carbonate.

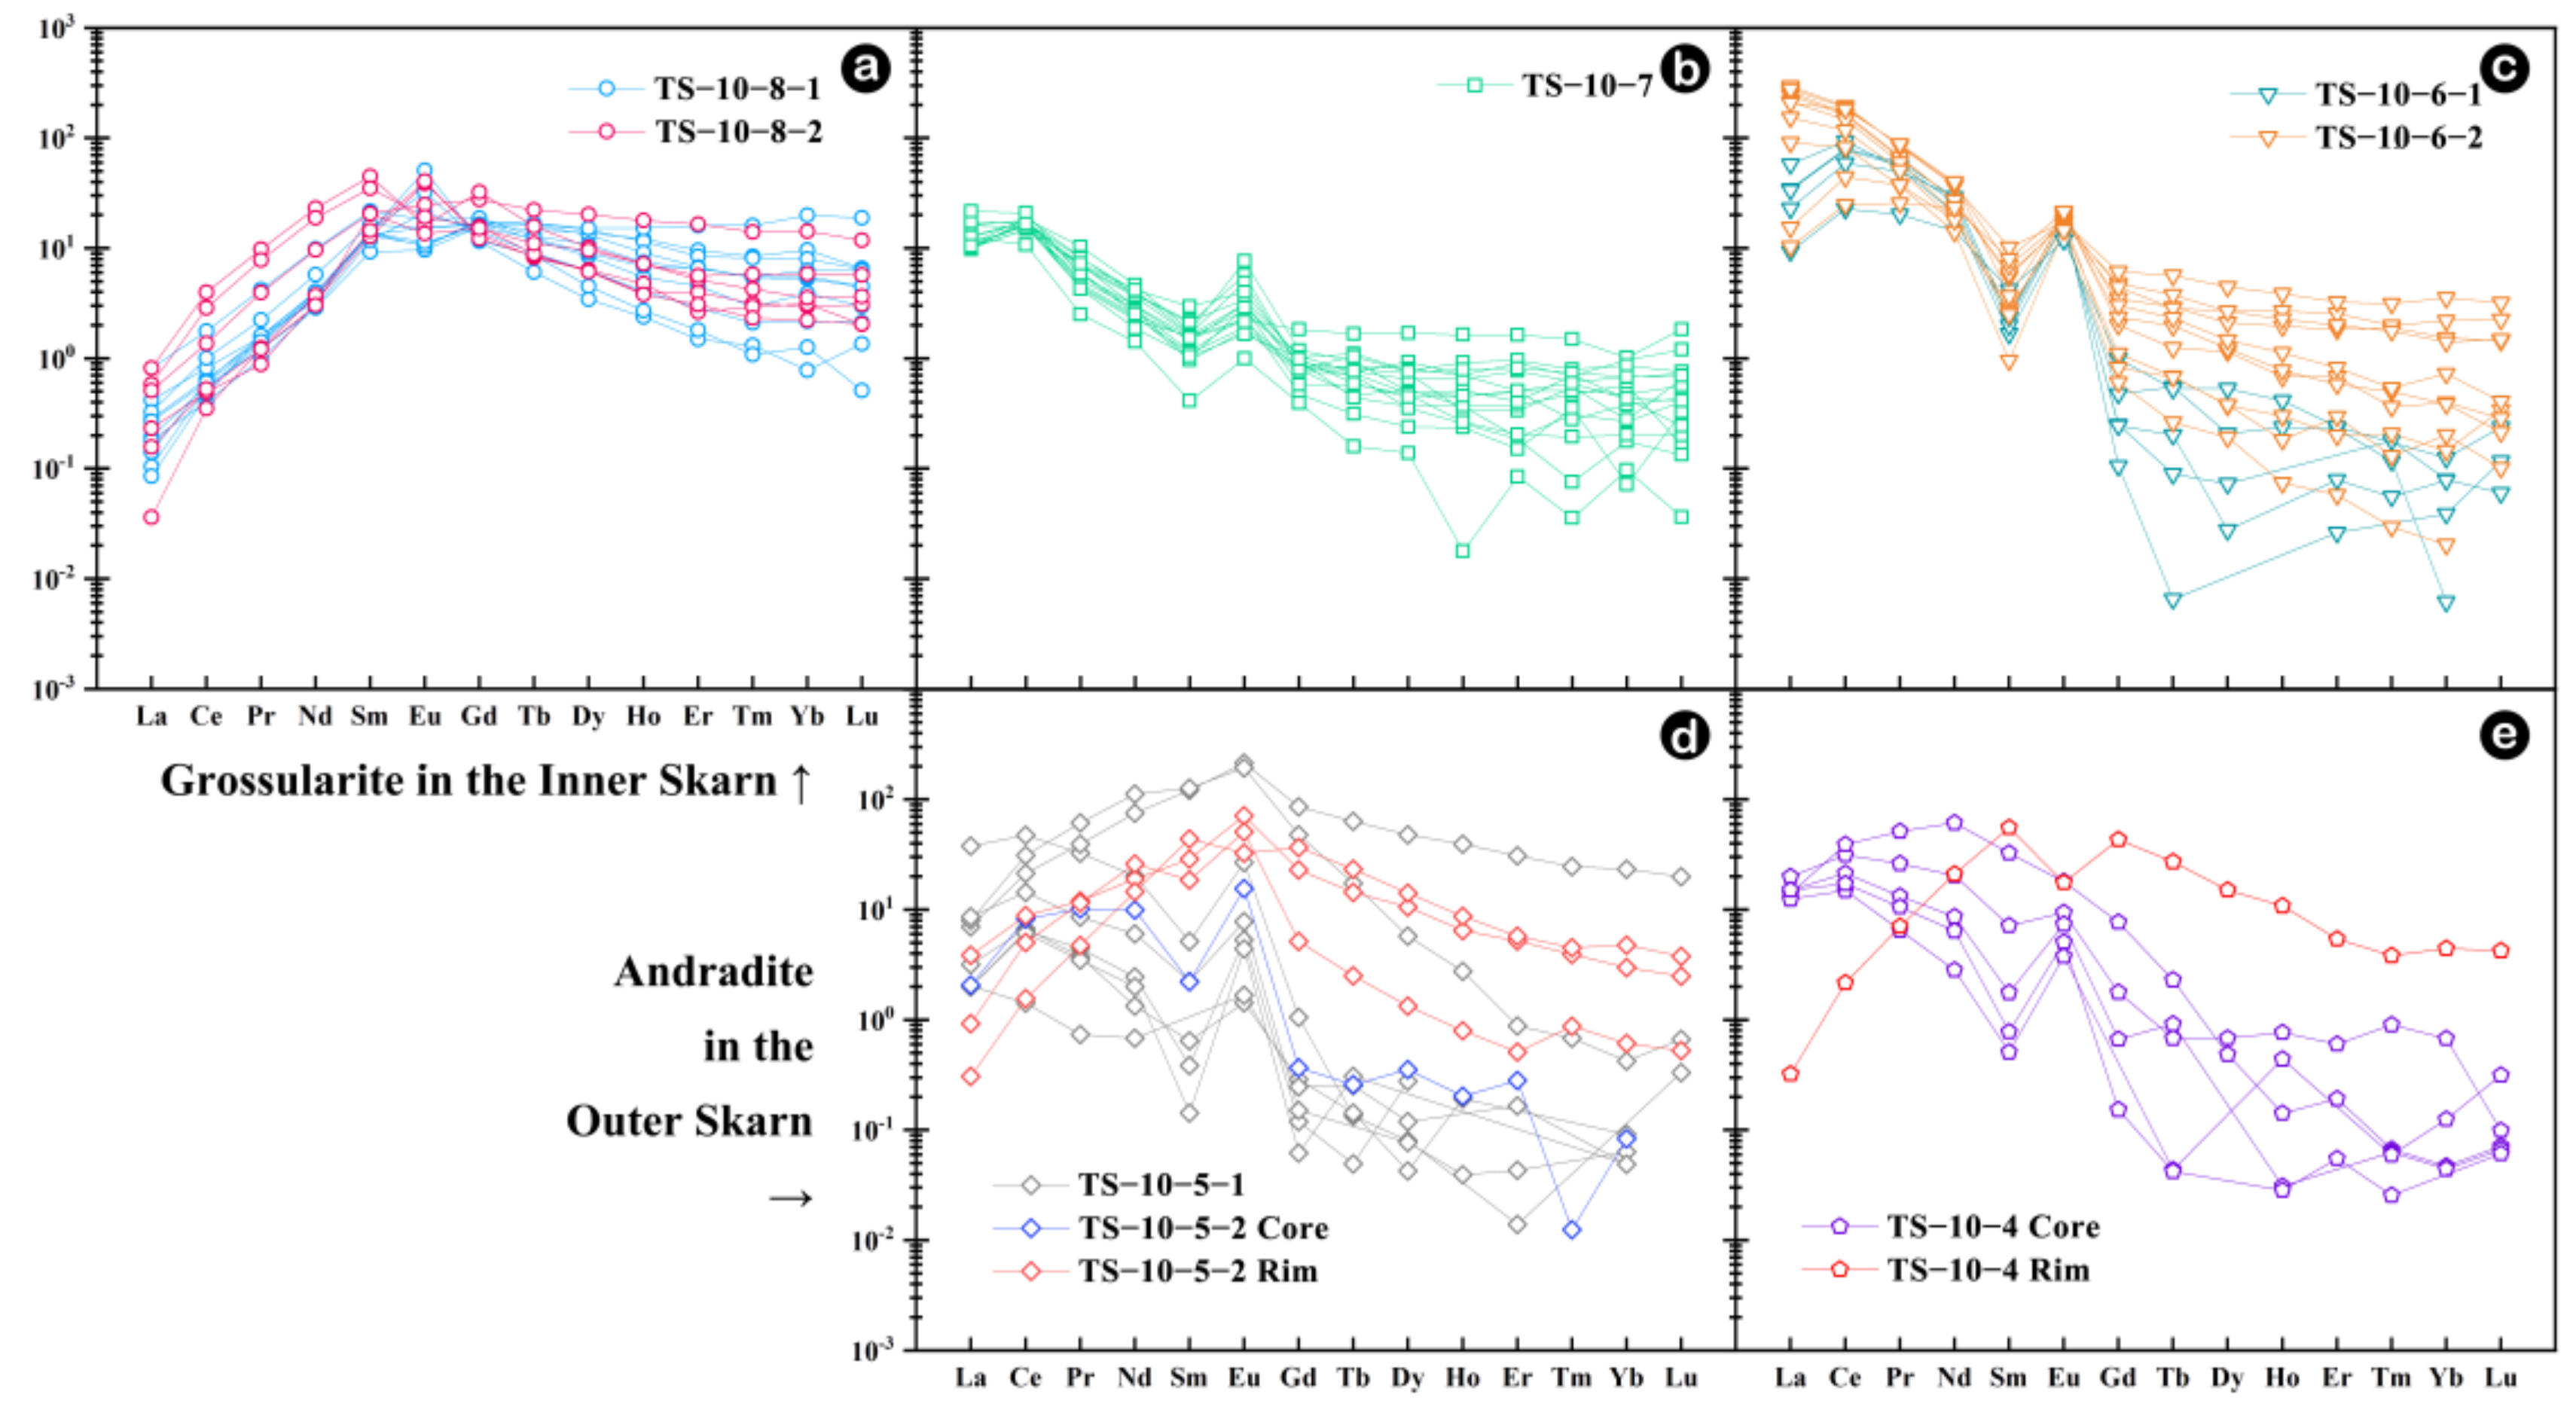
4.2. Geochemical Characteristic of Garnet

The major and trace element contents of garnet in the TS-10 profile are shown in Supplementary Table S2. The overall trend of the major elements in garnet is as follows: Garnets near the rock body in the inner skarn are characterized by aluminum-rich and iron-poor features, which are grossularite. The SiO2 content is 37.00–39.63% (Avg. 38.83%), the CaO content is 31.33–34.18% (Avg. 32.69%), the FeO content is 10.42–19.07% (Avg. 13.17%), and the Al2O3 content is 7.99–15.61% (Avg. 13.41%). Garnets in the outer skarn are characterized by iron-rich and aluminum-poor features, which are andradite. The SiO2 content is 34.88–38.32% (Avg. 36.66%), the CaO content is 27.67–34.57% (Avg. 31.05%), the FeO content is 18.98–33.56% (Avg. 29.66%), and the Al2O3 content is 0.05–8.43% (Avg. 1.23%). Apart from In and Si, the overall elemental variation range in garnet from the outer skarn is relatively small, whereas the elemental content in garnet from the inner exhibits considerable spatial fluctuations. Notably, the concentrations of Ti, Zr and Nb elements are extremely low in garnet from the outer skarn; however, they are higher in the inner and display substantial spatial variation.
As shown in Table 1, the fluctuation range of REE in garnets from the inner skarn is much smaller than that in garnets from the outer, and the ∑REE is also much lower than that in the outer. In the inner skarn, the REE content of grossularite in sample TS-10-8 is 10.14–34.02 ppm (Avg. 17.33 ppm). In the outer skarn, the REE content of andradite in samples TS-10-7 to TS-10-4 is 1.96–220.73 ppm (Avg. 50.97 ppm).
Grossularite garnet and andradite have different REE distribution patterns (Figure 9). Grossularite is characterized by LREE and HREE depletion, middle-REE enrichment, and weak Eu anomaly (δEu = 0.42–3.95, Avg. 1.43); while andradite shows an overall LREE enrichment, HREE depletion, and significant positive Eu anomaly (δEu = 0.36–46.83, Avg. 7.82). Garnets (TS-10-4 and TS-10-5) located near the outermost part of the outer skarn adjacent to the marble show a large amount of obvious core-rim structures. The core part has a higher andradite end member value, LREE enrichment and HREE depletion, while the rim part has a decreased And. end member value and shows a REE distribution pattern similar to that of grossularite.

4.3. Mapping of Garnets

We conducted trace-element mapping on representative garnet crystals from the inner skarn TS-10-8 and the outer skarn TS-10-5. The garnet in TS-10-8 from the inner has a relatively high degree of idioblastic texture, and the overall shape is idioblastic to semi-idioblastic (Figure 6a). The mapping results show that the garnet has an Al-rich core and a Fe-rich rim, and more obvious zoning features can be observed (Figure 10a). Mn is enriched in the core and depleted in the rim, while Ti, Nb and Y elements are enriched in the middle part and depleted in the core and rim, indicating multiple growth stages. The garnet in sample TS-10-5 from the outer also has a good degree of idioblastic texture, and the overall shape is semi-idioblastic (Figure 6d). The mapping results show that the garnet has a Fe-rich core and an Al-rich rim, and obvious zoning features can be observed (Figure 10b). Ti, Mn, Y and Nb elements in TS-10-5 are depleted in the core and enriched in the rim.

5. Discussion

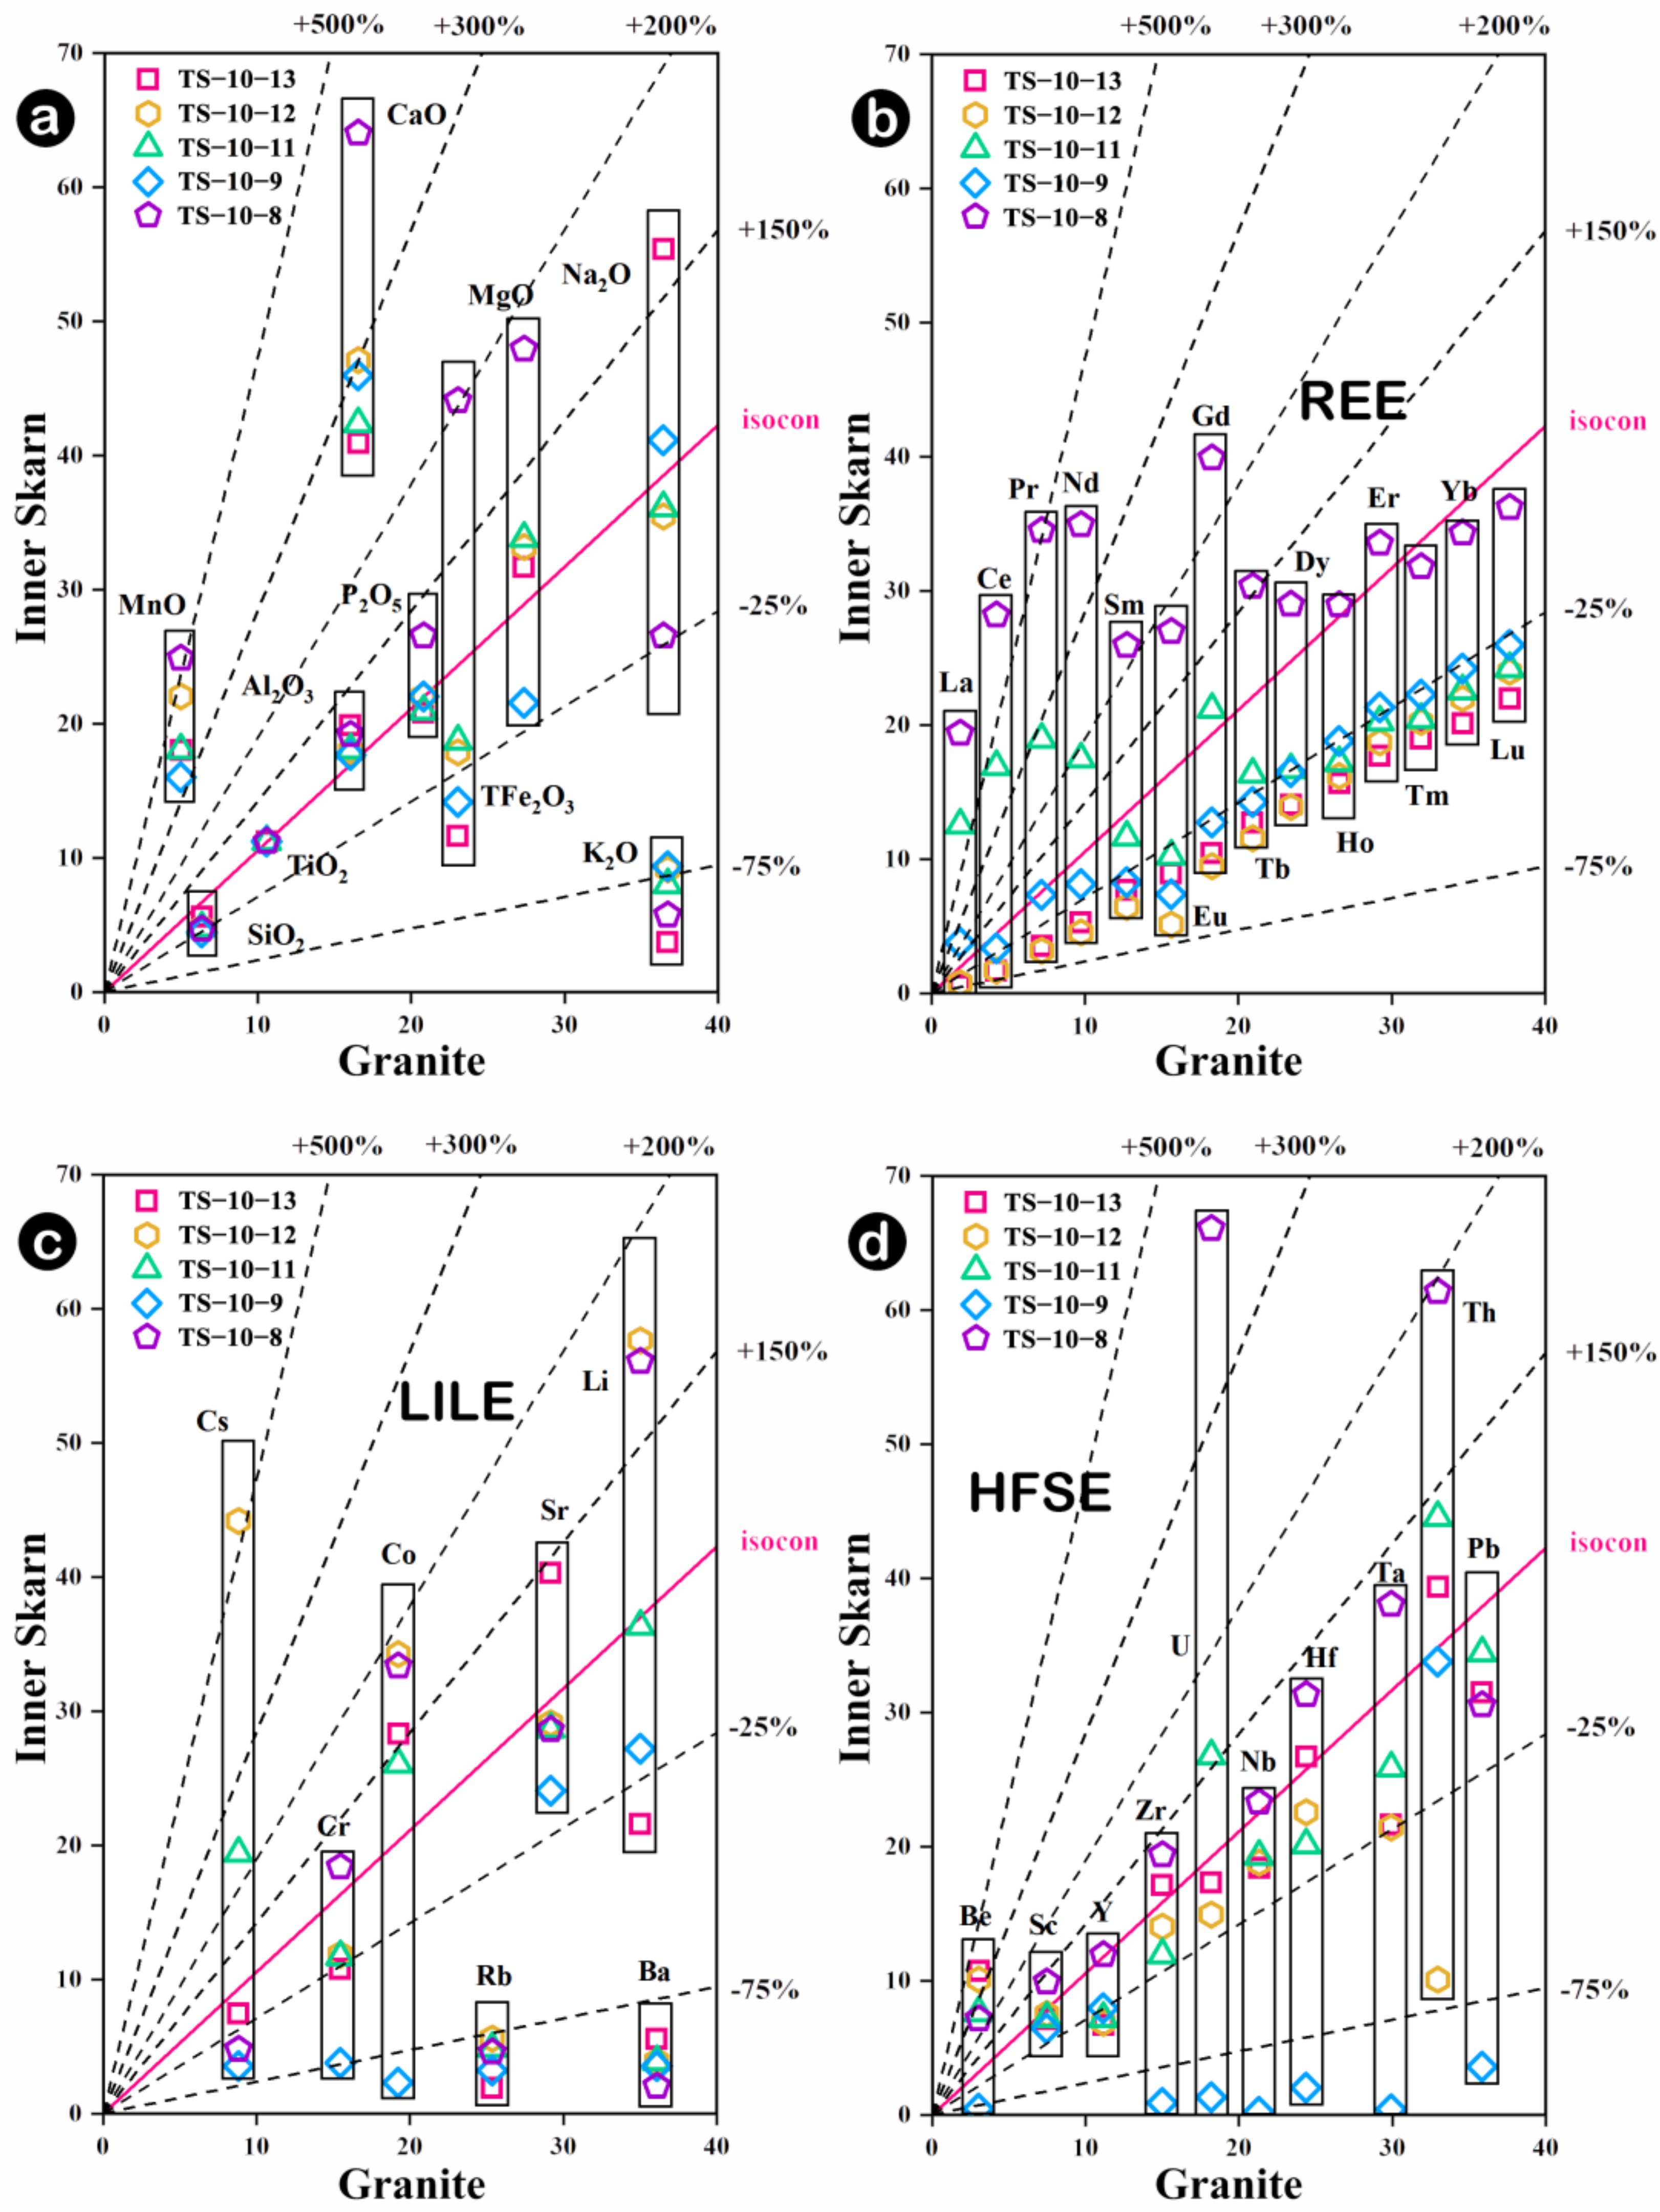
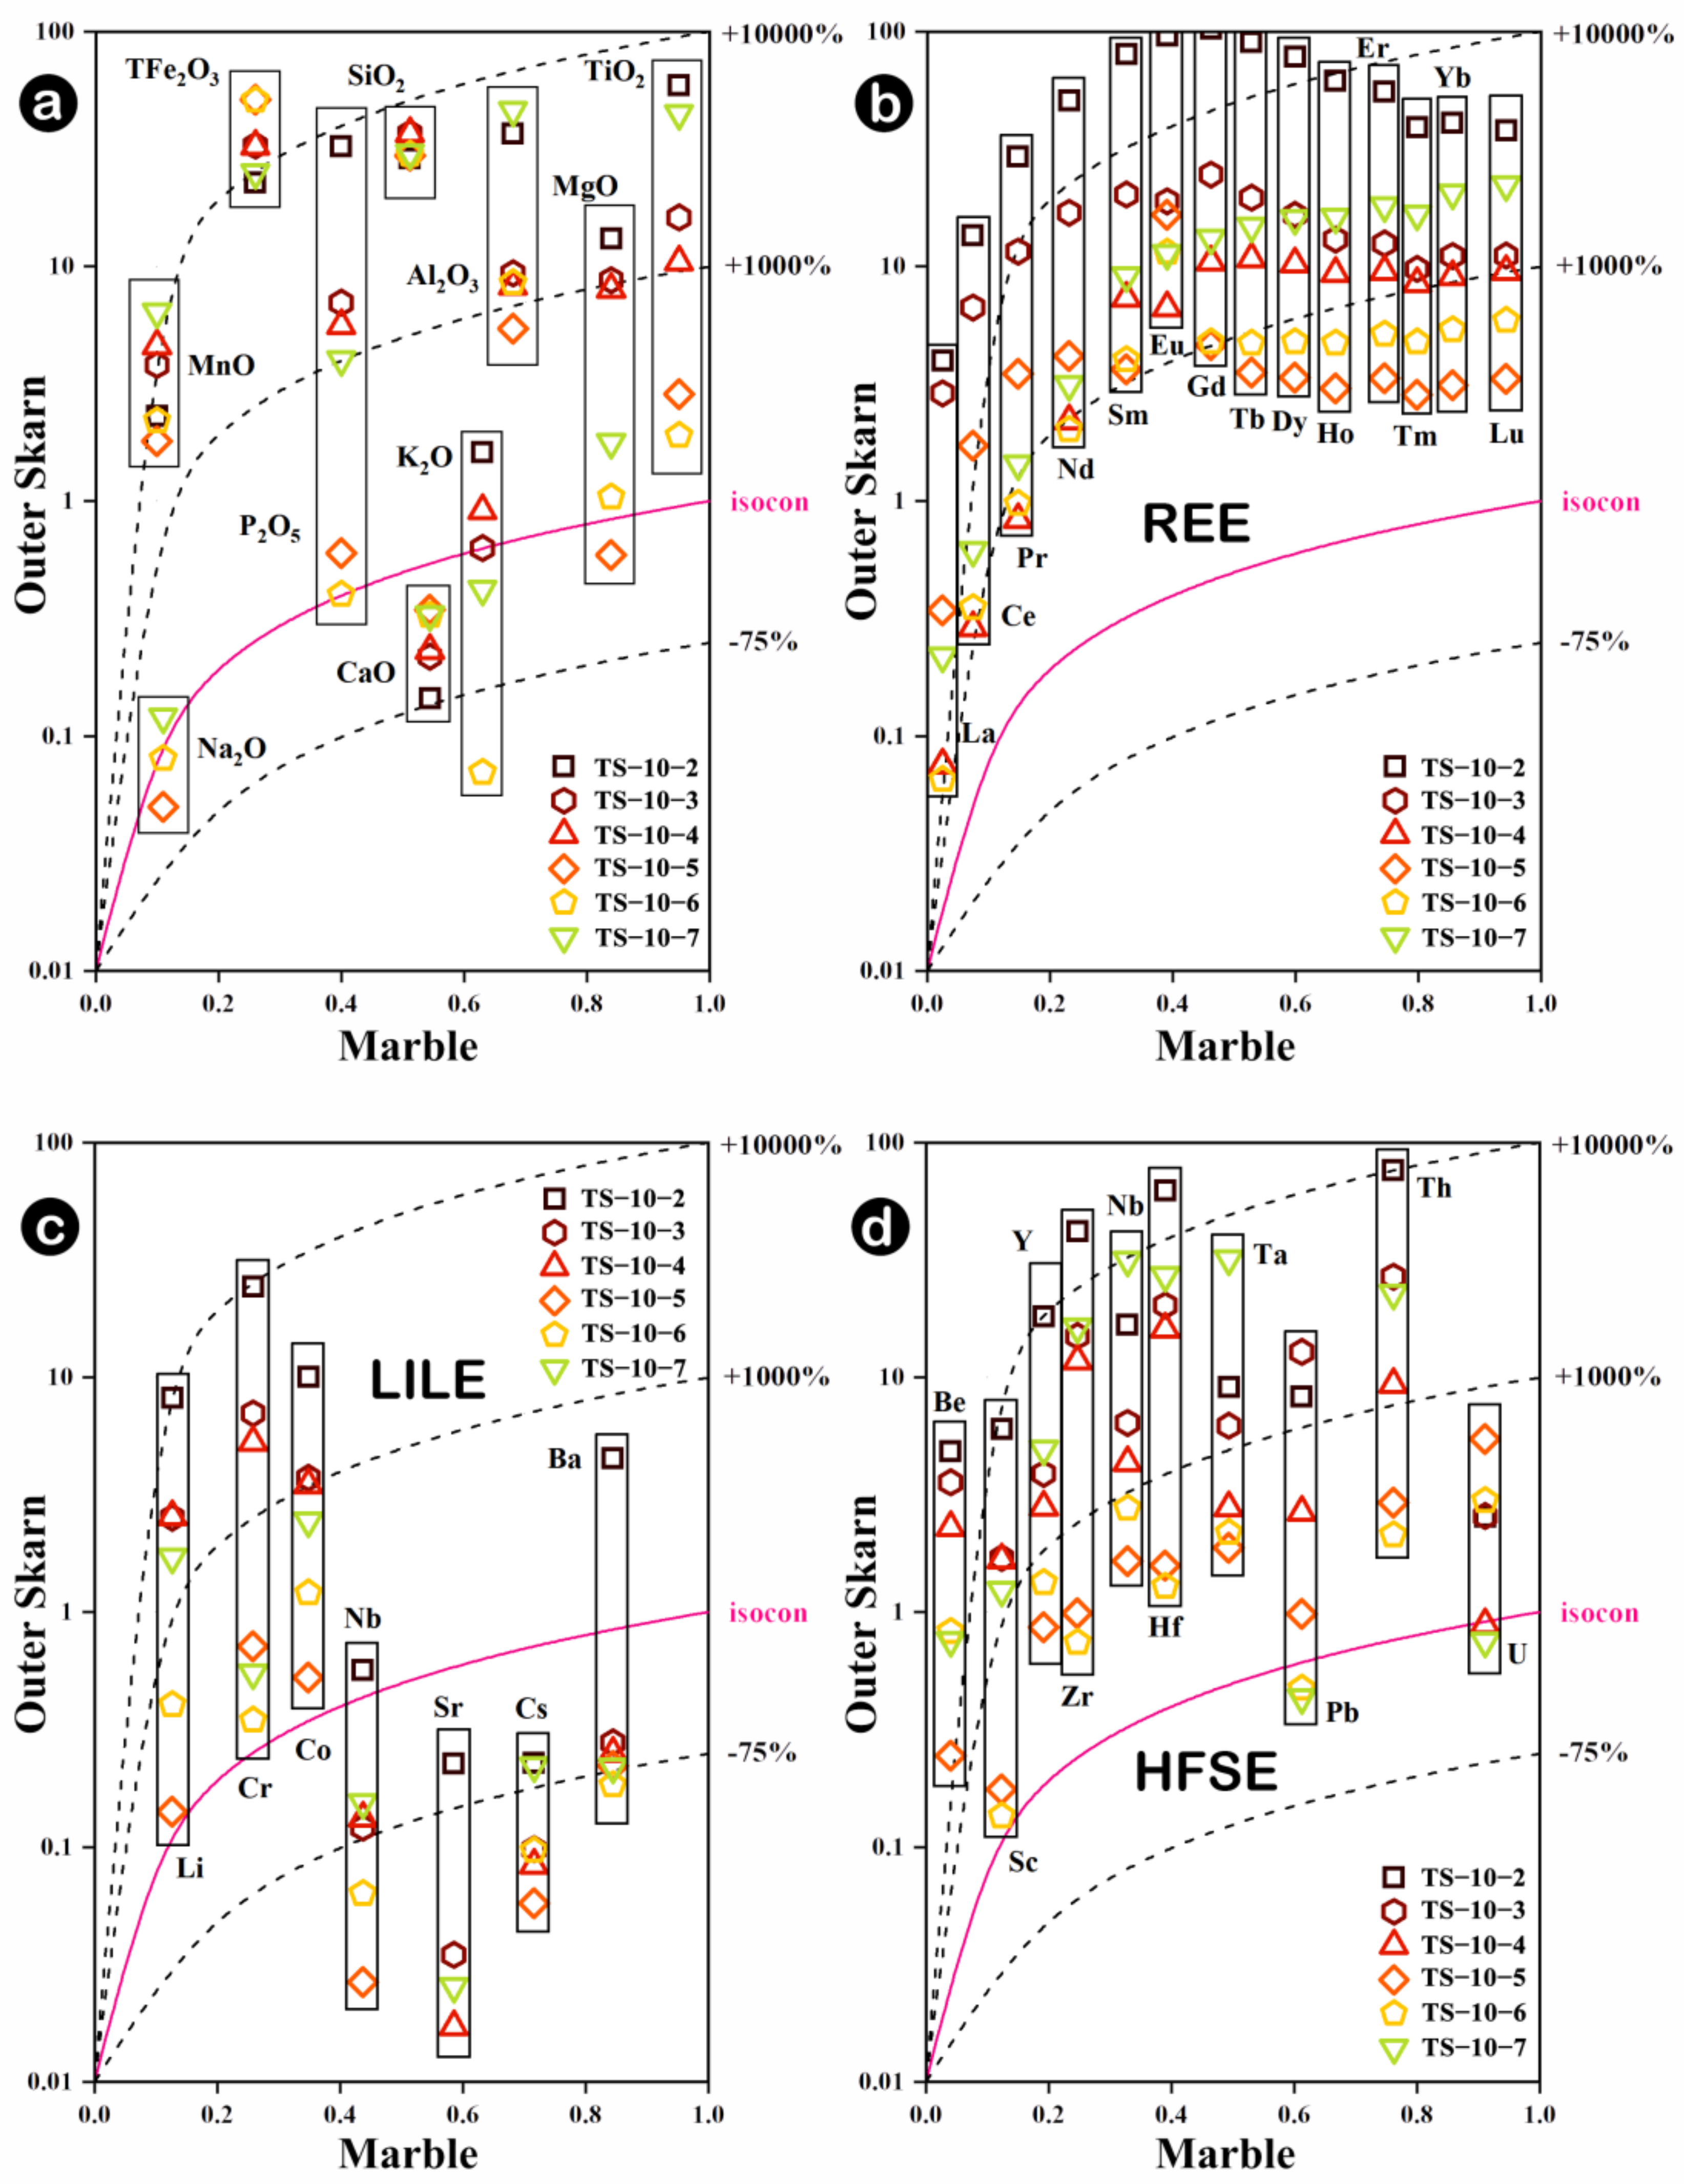
5.1. Mechanisms of Whole-Rock Element Migration

The field identification of skarn types mainly relies on their structures that are similar to their protoliths. The banded structures in the outer skarn are closely related to the layered metamorphic sedimentary rock protolith, while the weakly altered inner skarn usually shows residual igneous rock patches [3]. However, some skarn have a spotty structure, which may affect the accuracy of visual identification. Therefore, distinguishing skarn types based on geochemical methods is more reliable [8]. Based on the whole-rock data in Section 4.1, it can be seen that most elements undergo significant changes during the evolution of skarn. From the inner skarn to the outer skarn, Dy, Ho, Er, Tm, Yb, Lu, Y, Zn and Sc show the same evolutionary trend, while Na, Al, K, Ti and Sr show a decreasing trend, and V, Ni, Fe, Mg and Zn show an increasing trend.
Based on the major and trace element analysis of the granite, inner skarn, outer skarn and marble on the TS-10 skarn profile, we have discussed the migration regularities of the constant elements and trace elements in this profile. Guo et al. (2009) proposed an isocon diagram based on Grant’s (1986) method to reflect the migration of elements after the opening of a closed system [38,39]. The mathematical derivation process can be found in Guo et al. (2009, 2013) [38,40]. We first assume that the granite (TS-10-14) and marble (TS-10-1) represents the initial state, and the inner or outer skarn represents the state after the system has been opened. Next, it is necessary to perform mass balance calculations on the geological samples before and after the system is opened to eliminate the influence of changes in the total mass of the samples [39,41,42,43]. According to the discussion results of Grant (2005) [44], the selection of the invariant component needs to be combined with the actual geological processes studied to choose the most inactive component. In the granite-inner skarn system, TiO2 is a suitable invariant component. However, in the marble-outer skarn system, due to the significant migration of elements, we cannot find a consistent invariant component. Therefore, we assume that the total mass is constant under various conditions in this system, in order to draw diagrams that reflect the relative migration of elements.
The isocon diagram indicates that the inner skarn stage may result in the enrichment of Ca and Mn, accompanied by the loss of K, Rb and Ba. The inner skarn gradually shows enrichment in light REEs (such as Ce, Pr, Nd, etc.) towards the boundary, while heavy REEs are generally depleted. The element migration in the outer skarn is very intense. In the process from TS-10-2 to TS-10-7, the contents of most elements show a downward trend, but are still enriched by 10–100 times compared to marble, which is consistent with the feature that these elements were originally not present in the surrounding marble. In addition, Ca, Sr and Cs in the outer skarn show depletion characteristics, indicating that these elements may have migrated from marble to the outer skarn. In the inner skarn, K, Rb and Ba are almost completely depleted (Figure 11c), but in the outer skarn, except at the boundary with marble, they are still in a depleted state (Figure 12c), indicating that these elements may have migrated to a further location than marble. In the outer skarn, in addition to Sr and Cs from marble, most of the elements from the inner skarn are enriched at the boundary between marble and the outer skarn, such as Cr, Th, Nb, Y, etc. (Figure 11c,d and Figure 12c,d).
At the boundary between the inner skarn and outer skarn, sample TS-10-7 in the granite-inner karn system and sample TS-10-8 in the marble-outer skarn system each exhibit significant differences from the other samples. At the inner skarn boundary, major elements such as Ca, Fe and Mg are significantly enriched in sample TS-10-8 (Figure 11a). Compared to the generally depleted heavy REEs in other samples, TS-10-8 is only depleted in HREEs such as Lu, Yb and Tm, while LREEs are significantly enriched (Figure 11b). Among the HFSE, U and Th are almost entirely depleted in the adjacent TS-10-9, while they are enriched by 2–3 times in TS-10-8 (Figure 11d). In the outer skarn, most elements show an overall increasing trend from TS-10-6 to TS-10-2, while the elemental characteristics at the boundary of TS-10-7 are significantly different. For example, Ca and Mn are enriched in sample TS-10-8 of the inner skarn (Figure 11a), and their content in TS-10-7 of the outer skarn is also somewhat higher (Figure 12a). Such changes indicate the presence of a strong element exchange near the boundary between the inner skarn and outer skarn, which may be the reason for weakening the whole-rock geochemical characteristics of the boundary.

5.2. Geochemical Characteristics of Garnets in Skarn

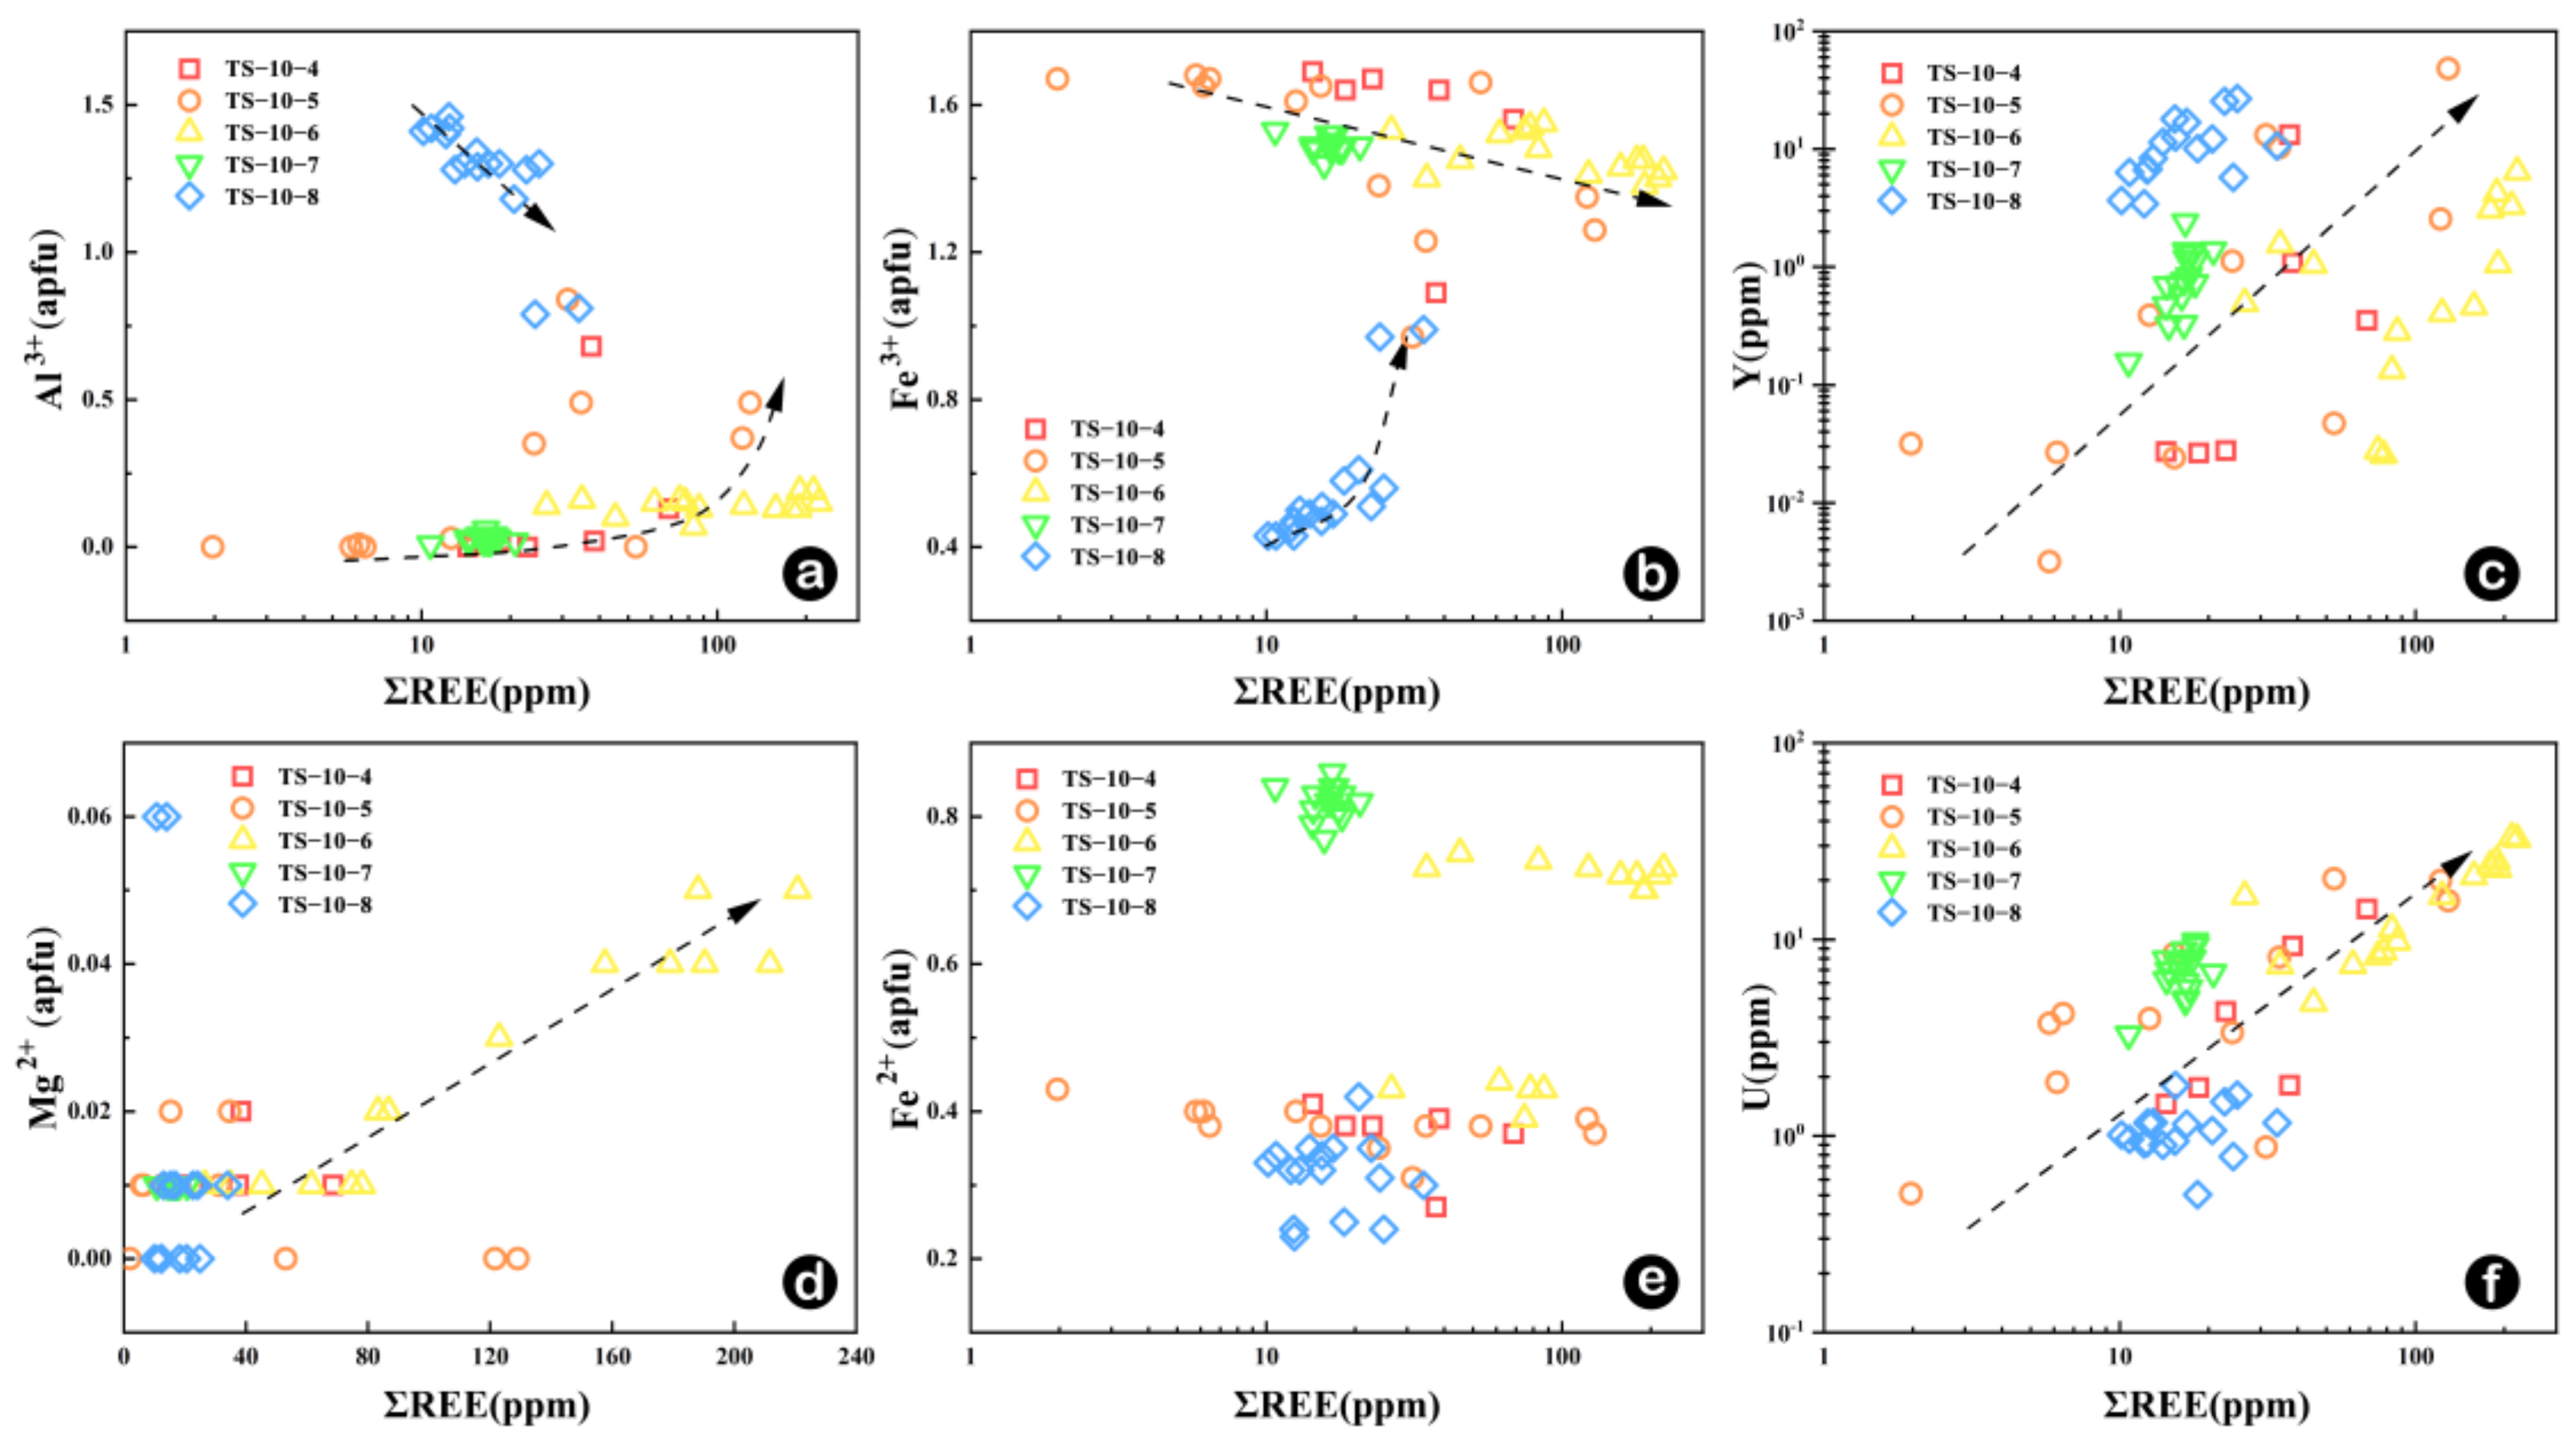
5.2.1. Mechanism of Rare Earth Element into Garnet

The chemical formula of garnet is X3Y2Z3O12, where X is the divalent cation of the dodecahedron, usually Ca2+, Mg2+, Mn2+, Fe2+ in octa-coordination; Y is the trivalent cation of the octahedron, usually Fe3+, Al3+, Cr3+ in hexa-coordination; Z is the divalent cation of the tetrahedron, generally occupied by Si4+ in tetra-coordination [21]. Previous studies have shown that trace elements enter garnets mainly through the following four mechanisms: (1) Surface adsorption, (2) Occlusion, (3) Substitution, and (4) Solid solution [22]. The first two mechanisms are mainly controlled by mineral growth kinetics, while the latter two are mainly controlled by crystal chemistry [14].
There is still debate on how REEs and trace elements enter into garnets. U, REE3+ and Y3+ can only enter the octahedral position by replacing divalent cations such as Ca2+ [24,45]. The substitution of Eu2+ is equivalent and will not cause charge imbalance (Formula (1)). However, U, REE3+ and Y3+ substitutions are inequivalent and can only be replaced by coupled substitution or creating vacancies to avoid charge imbalance (Formula (2)) [14].
Ca3(Al, Fe)2Si3O12 + 3Eu2+ (aq) = Eu3(Al,Fe)2Si3O12 + 3Ca2+(aq)
Ca3(Al, Fe)2Si3O12 + 3REE2+(aq) + 3(Al3+, Fe3+) (aq) = REE3(Al, Fe)2(Al, Fe)3O12 + 3Ca2+(aq) + 3Si4+(aq)
From the perspective of crystal chemistry, there may be four possible mechanisms that influence the variation characteristics of REEs in the garnet from the Tongshan deposit. (1) REE3+ can couple with monovalent cations, such as Na+, to enter the X site, which is represented as 2[X2+]VIII→[X+]VIII+[REE3+]VIII. This mechanism typically forms garnet containing Na [46]. However, the content of Na in spessartine garnets from the Tongshan deposit is extremely low, even lower than the detection limit of the instrument. This suggests that the Na-REE3+ coupled substitution mechanism is unlikely to exist in garnets from the Tongshan deposit. (2) REE3+ can couple with divalent cations, such as Fe2+ and Mg2+, to enter both X and Y sites, which is represented as [X2+]VIII+[Y3+]VI→[REE3+]VIII+[Y2+]VI (Menzerite-type substitution) [47,48]. Menzerite-type substitution requires garnet to be enriched in Y and heavy REEs, with Y content being higher than that of REE. In samples TS-10-6/7/8, REE3+ has a positive correlation with Mg2+, but there is no negative correlation trend between Fe2+ and REE3+ (Figure 13d,e). In addition, the content of Y is also lower than that of REE, indicating that the garnets in Tongshan deposits may not follow this substitution mechanism. (3) REE3+ can couple with trivalent cations, such as Al3+ and Fe3+, to enter both X and Z sites, which is represented as [X2+]VIII+[Si4+]IV→[REE3+]VIII+[Z3+]IV. This substitution mechanism is called YAG-type substitution [49]. In samples TS-10-4/5/6/7, there is a positive correlation between REE3+ and Al3+ in spessartine garnets, while in sample TS-10-8, there is a positive correlation between REE3+ and Fe3+ (Figure 13a,b). This suggests that REEs may enter the garnets in the samples through YAG-type substitution. These characteristics also indicate that Fe3+-REE is more likely to enter the crystal of Al-rich grossularite from inner skarn; Al3+-REE is more likely to enter the crystal of Fe-rich andradite from outer skarn. The different REE substitution mechanisms in garnets within the inner and outer skarn zones are discovered for the first time. These findings suggest that the incorporation process of REEs into the garnet lattice as trace elements, exhibits a stronger affinity with low-concentration isovalent elements in the system. For instance, in the inner skarn, the Fe3+ content is significantly lower than that of Al3+. As a result, trivalent REEs are more likely to combine with the lower concentration of Fe3+. This phenomenon provides mineralogical constraints that can be utilized to differentiate between the inner and outer skarn zones. (4) REEs can enter the X site of spessartine garnets through a vacancy in the octahedral site, which is represented as 3[X2+]VIII→2[REE3+]VIII+[] VIII [50,51]. From a geochemical perspective, we cannot rule out the possibility of REEs entering the garnets in this way.
Dziggel et al. (2009) found that there was no correlation between REE3+ and Al in the Navachab gold deposit, but there was a correlation between REE3+ and Y [52]. They suggested that during the process of REEs entering the garnet lattice, crystal chemistry can only control a small portion of the elements that enter the garnet through substitution mechanisms, and the chemical composition of the fluid plays a major role. In our samples, U, Y and REE also show a positive correlation (Figure 13c,f). The REE in andradite from outer skarn TS-10-4/5 also showed large fluctuations at different positions in the garnet (Figure 13 horizontal coordinate), while the Y/Ho ratio (Figure 14) indicates the presence of strong water-rock reactions in the meta-igneous rocks. Therefore, in the Tongshan skarn, the entry of trace elements into garnets may not only be controlled by equilibrium crystal chemistry, but the fluid and rock chemistry of water-rock reactions (such as surface adsorption and inclusions) may also play an important role [14].

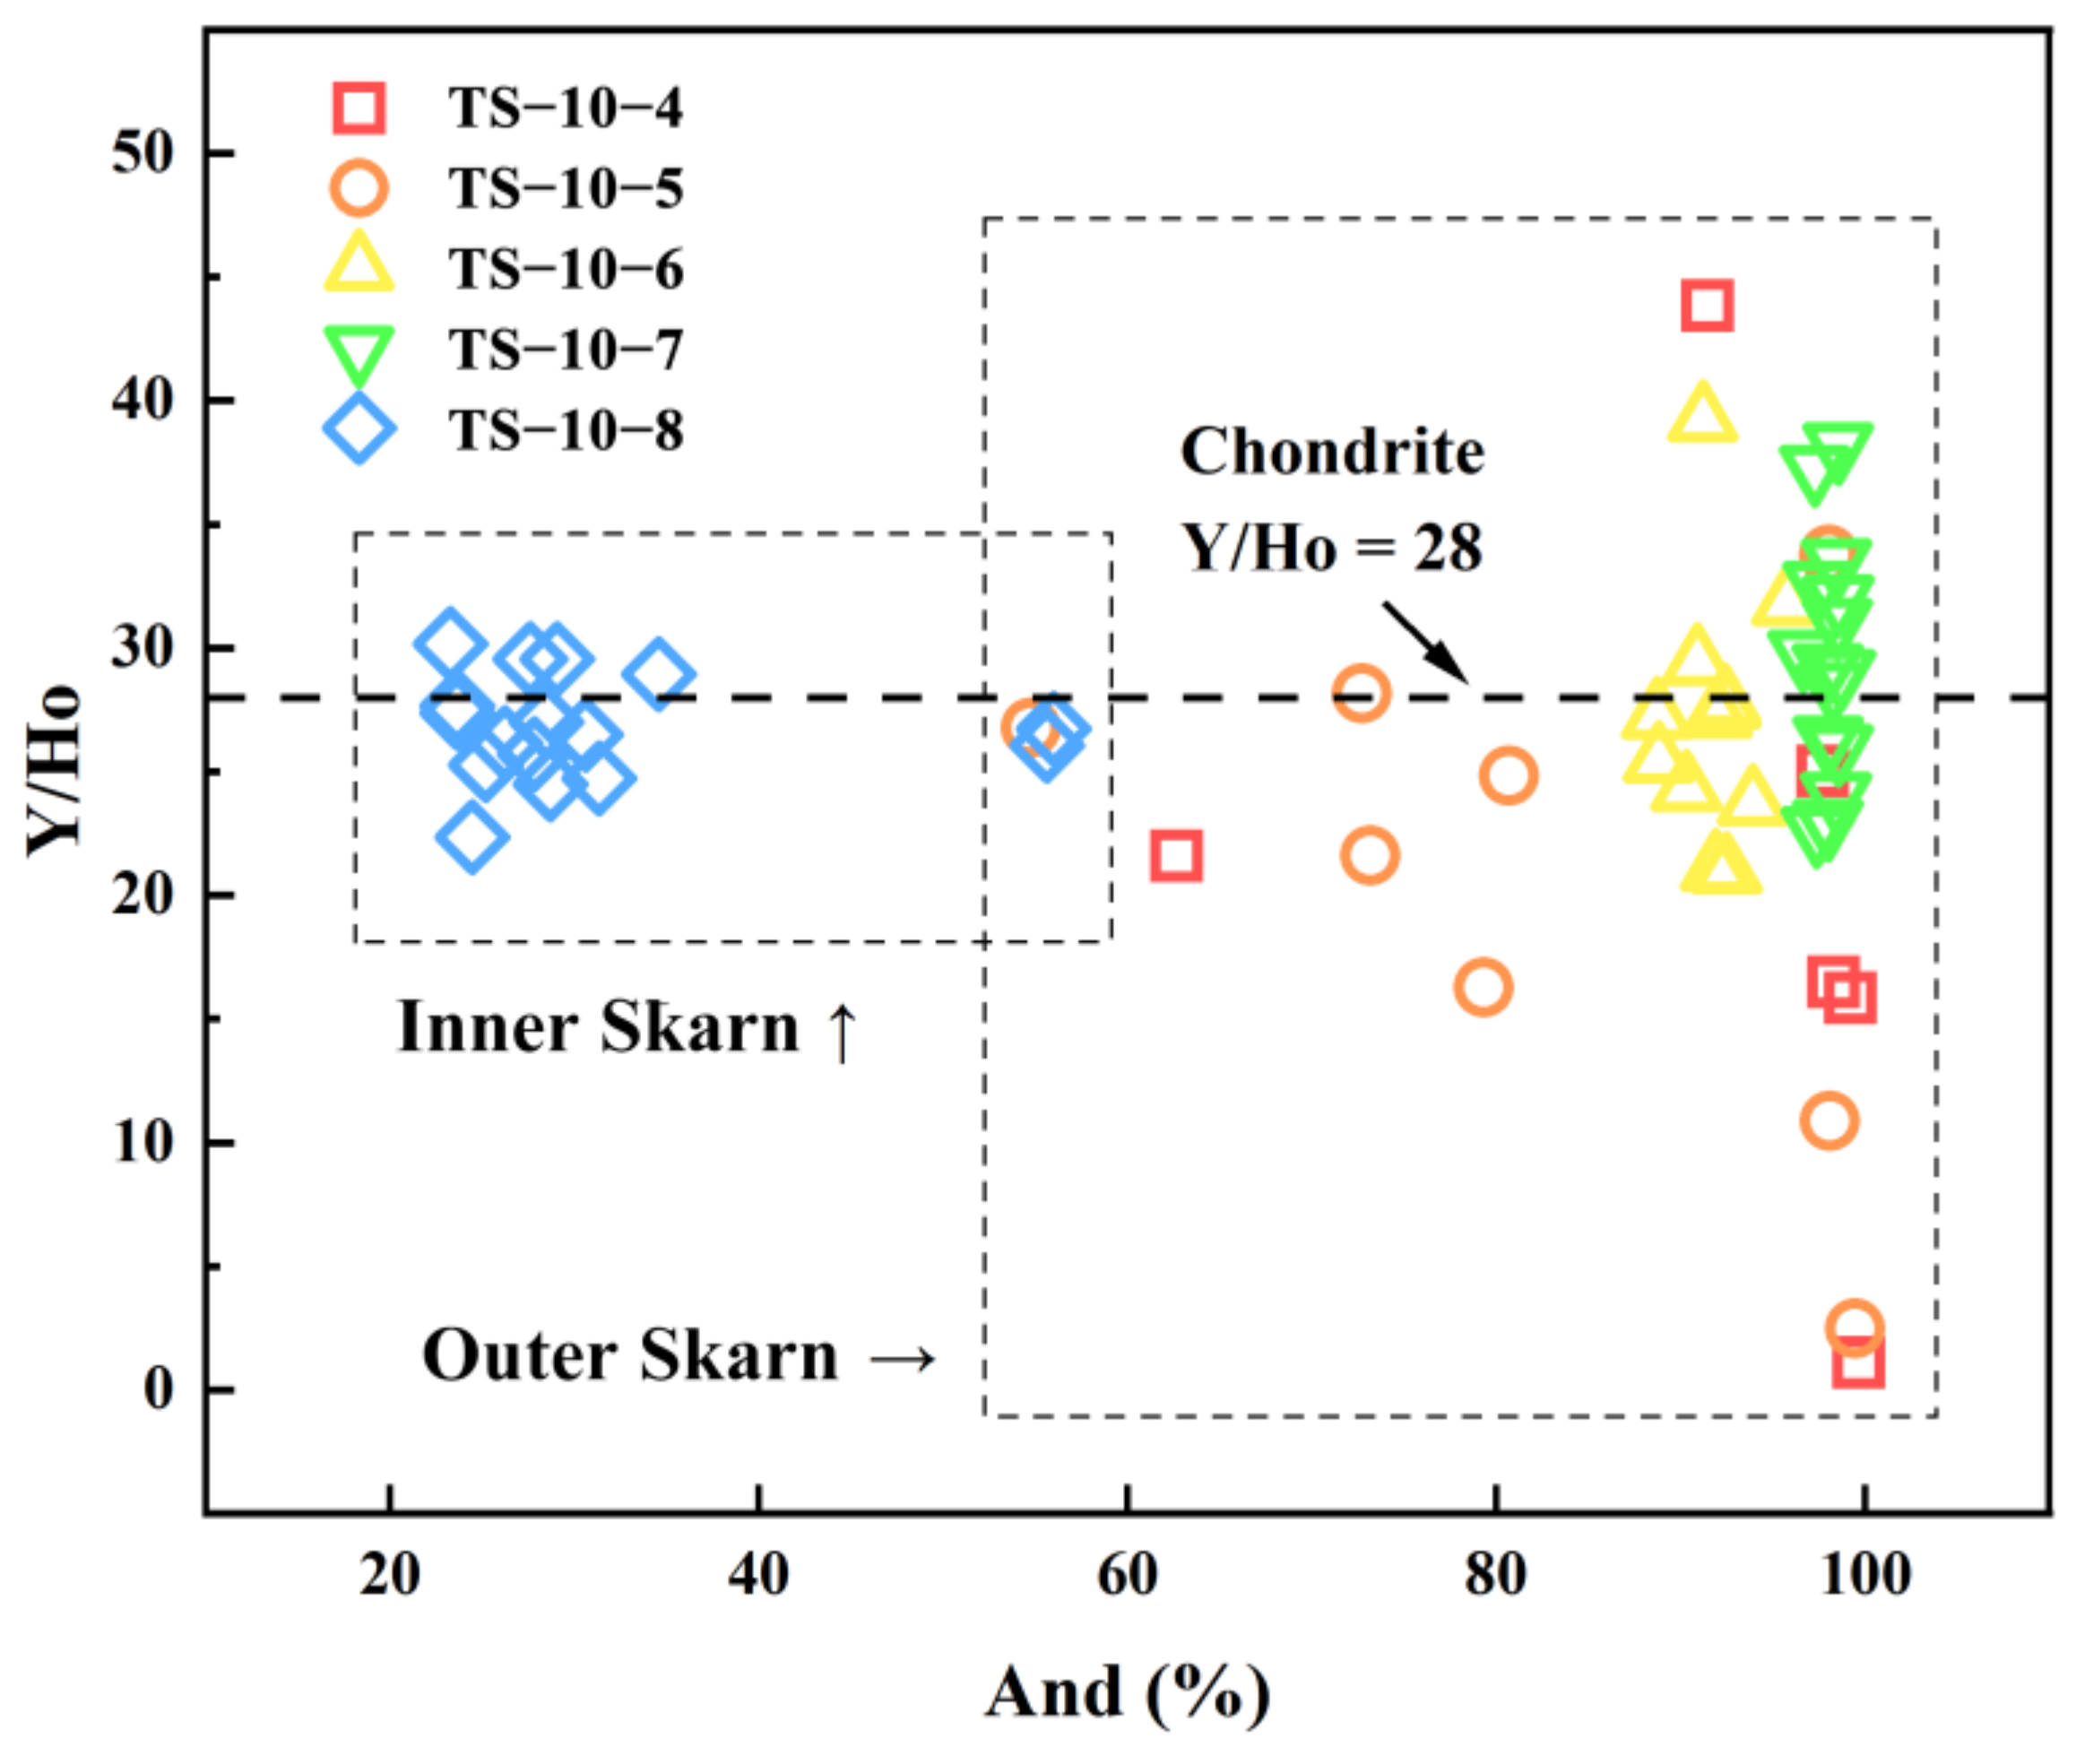
5.2.2. The Y/Ho Ratio and Its Water-Rock Ratio Indication

The Y/Ho ratio usually has important geochemical implications, as Y and Ho have similar ionic radii and valences and thus exhibit similar geochemical behaviors. Bau (1991) suggested that Y and Ho may exhibit significant fractionation in aqueous solutions, but partial melting or fractional crystallization of magma does not cause a significant fractionation of Y and Ho [53]. Therefore, when garnets are of hydrothermal origin, their Y/Ho ratios will deviate significantly from the Y/Ho value of chondritic meteorites (Y/Ho = 28). An imbalance in the chemical composition of the original rock or changes in the fluid composition during the crystallization of garnets can lead to a lack of correlation between Y and REEs. When the chemical composition of the original rock is relatively balanced or when changes in the fluid are small, Y and REEs show a positive correlation [14]. In our study, the Y/Ho ratio of the garnet in sample TS-10-8 from the inner skarn of the meta-igneous rocks is close to the value of chondritic meteorites and varies only slightly around 28 (Figure 14), indicating that the garnets were in a state of chemical equilibrium and were not significantly affected by fluids. The Y/Ho ratios of garnets in TS-10-4,5,6,7 from the outer skarn vary greatly and deviate significantly from the values of those in chondrites, suggesting an increased water-rock ratio during garnet formation. Furthermore, the formation temperature of andradite is lower than that of grossularite, as reported by Liang (1994) [54]. Consequently, as the temperature declines, hydrothermal fluids rich in metal elements separate from the magma, leading to an increased water-rock ratio. This process, in turn, contributes to the formation of clinopyroxene and significant variations in Y/Ho ratios at relatively lower temperatures.

5.2.3. Fluid Behavior Processes Recorded by Garnet

Consequently, U is a variable valence element, including U4+ and U6+. U4+ is highly reactive and easily migrates during fluid activity, while U6+ has low reactivity. Therefore, the U content in garnets may reflect the fO2 changes during their formation. Andradite usually forms in relatively oxidizing environments, while grossularite form in relatively reducing environments [1,2]. Near the rock body during skarn formation process, the temperature is relatively high and fO2 is relatively low. U mainly exists in the form of U4+ and migrates with the fluid towards the outer skarn, where it is enriched. This results in lower U content in the inner skarn when U enters the lattice of grossularite during its crystallization. In contrast, andradite formed in the outer exhibits higher fO2 characteristics, with U present as U6+, which subsequently precipitates in large quantities into the lattice of andradite. In the Tongshan skarn profile, we found garnets in the inner exhibit with relatively low U content, while those in the outer are enriched in U, adhering to the same principle (Figure 15a).
The factors that cause the Eu anomaly in garnets are complex and diverse, including fluid temperature, pH, fO2 and water-rock ratio, etc. The Eu element in the fluid mainly exists as Eu2+ and Eu3+. Fluid temperature controls the distribution of Eu, and at temperatures above 250 °C, Eu2+ is more easily incorporated into garnets than Eu3+. Therefore, garnets are more enriched in Eu2+ under such conditions [55]. Research by Allen and Seyfried (2005) suggests that Eu2+ combines with Cl to form EuCl42− and migrates [56]. Consequently, its behavior diverges from that of other REEs, often leading to Eu anomalies, such as the positive Eu anomaly of andradite, and the weak anomaly or negative Eu anomaly of grossularite. These anomalies may indicate that grossularite is developed in a relatively dry and water-poor environment, while the location where andradite forms exhibits a higher water-rock ratio and greater Cl content. The substantial variation in the Y/Ho ratio in andradite further supports this hypothesis (Figure 14). Simulation studies by Van Westrenen have found that andradite exhibits a larger unit cell volume than grossularite, resulting in smaller lattice relaxation of Eu2+ entering andradite compared to that of Eu2+ entering grossularite [57]. Eu2+ is more likely to occupy the Ca position in andradite, which aptly explains the weak Eu anomaly of grossularite and the pronounced positive Eu anomaly of andradite. The garnets, both grossularite and andradite, in the Tongshan skarn profile also support the above conclusions. Grossularite forms in a relatively reduced environment, whereas andradite develops in a relatively oxidized environment. It can be inferred that the proportion of Eu3+ in the system during andradite formation would be higher, potentially leading to a negative Eu anomaly. However, this inference is not consistent with the observed facts. Consequently, fO2 may not be the primary factor causing Eu anomalies in garnets.
Although the Eu anomalies in different types of garnets may not exhibit a significant relationship with fO2, the variations of Eu anomalies within the same type could still be influenced by changes in fO2 characteristics. For instance, in the grossularite developed in sample TS-10-6, its Eu anomaly demonstrates a negative correlation with U content (Figure 15a), which may indicate that the variation is caused by changes in fO2. As the fO2 increases, more Eu is converted to Eu3+ and enters the andradite, leading to a decrease in Eu in the garnet and a reduction in positive Eu anomaly. Simultaneously, the U element transforms into U6+ and enters the lattice of the andradite, exhibiting an increase in U content. In sample TS-10-4, located at the boundary between the outer skarn and limestone, we observed the formation of magnetite, indicating that the fO2 has reached its highest level. Subsequently, the formation and precipitation of magnetite led to a decrease in fO2 in the system, transitioning to a later, more reduced environment, where sulfides began to precipitate. The formation of grossularite at the edge of the crystal in sample TS-10-4 also reveals the characteristics of decreasing fO2 (Figure 9e).
Based on the characteristics of U and Eu in garnet, the Tongshan skarn profile displays various features reflecting changes in water-rock interactions, fO2, temperature, and other aspects of skarn formation processes. The inner skarn near the rock body exhibits features of acidic pH, high temperature, low water-rock ratio, and low fO2. In contrast, the outer skarn demonstrates neutral pH, high temperature, high water-rock ratio, and high fO2.

5.3. The Definition of the Inner and Outer Boundaries of Skarn

Mrozek et al. (2020) utilized the inactive elements present in the whole-rock data for binary diagrams to differentiate between the inner and outer skarn [8]. By plotting Al2O3 against Lu, Dy, Y, and Nd, they were able to clearly distinguish between the two types of skarn. It is found that most of the inner and outer skarn on the Tongshan skarn profile fall within a similar range [8], and only a few data points (such as TS-10-7 and TS-10-2) have poor differentiation effects (Figure 16). The observation of the petrographic characteristics shows that TS-10-7 is mainly composed of garnet and diopside, and later epidote intersects and replaces the garnet. No detailed residual plagioclase or pyroxene was observed, indicating that the sample belongs to the outer skarn. On the Al2O3-Nd diagram (Figure 16b), TS-10-7 does not fall within the range of either type of skarn, and on other diagrams, TS-10-7 also cannot be well distinguished for its skarn type. The TS-10-2 area is mainly composed of diopside and chalcopyrite, and it also belongs to the obvious category of outer skarn. On the Al2O3-Y and Al2O3-Dy diagrams (Figure 16a,c), TS-10-2 is significantly higher than the range of outer skarn, but its chemical composition is obviously different from that of inner skarn. These characteristics indicate that there is still a certain degree of uncertainty in distinguishing between inner and outer skarn based on whole-rock geochemical features. Further research is needed to determine the geochemical discrimination criteria for inner and outer skarn.
Skarn minerals, such as garnet, may also provide mineralogical constraints for distinguishing the boundary between inner and outer skarn. The Fe, In, Al, Mn, Ni, Ti, Zr and Nb contents of garnets in inner and outer skarn are significantly different. Garnets in inner skarn exhibit high concentrations of Al, Mn, Ni, Ti, Zr and Nb, whereas those in outer skarn possess lower levels of these elements but substantially higher Fe contents. The contents of these elements show a cliff-like change between the two types of skarn (Figure 17). Moreover, the contents of Ti, Zr and Nb elements in garnets show a negative correlation with the andradite end-member (And) of garnet (Figure 18). These mineralogical and chemical characteristics can be explained as follows: due to the relatively high formation temperature and the low water-rock ratio of inner skarn; immobile HFSE often accumulates in the grossularite formed during the high-temperature stage. In contrast, outer skarn has a high water-rock ratio and strong fluid activity, and immobile HFSE is not easily enriched in them. Therefore, the garnets formed in this area show low and fluctuating contents of these elements.
The trace element composition of garnets in the outer skarn sample TS-10-7 markedly differs from that of the inner skarn, exhibiting high Fe and In levels, along with low Al, Mn, Ni, Ti, Zr and Nb contents. These characteristics are similar to those of other garnets in outer skarn, further confirming that the TS-10-7 sample is a typical outer skarn sample. The major and trace element characteristics of skarn minerals partially compensate for the limitations of using a single whole-rock geochemical method. Comprehensive judgments from multiple methods on samples near the boundary are the most effective way to distinguish between inner and outer skarn.

6. Conclusions

Here, we found a typical skarn profile of the Ningzhen mining district in the MLYRB, which is highly consistent with the typical skarn model. Our detailed whole rock and mineral geochemical analysis comes to the following conclusions:
(1)
During the skarn formation process, inner skarn is enriched in Ca and Mn, accompanied by the loss of K, Rb and Ba. Compared to the marble zone, the outer skarn shows a large-scale enrichment of elements and certain dilutions of Ca, Sr and Cs. The element contents fluctuate more significantly at the contact zone between the rock body and the surrounding rocks, and the migration and transformation of Th and U are most significant.
(2)
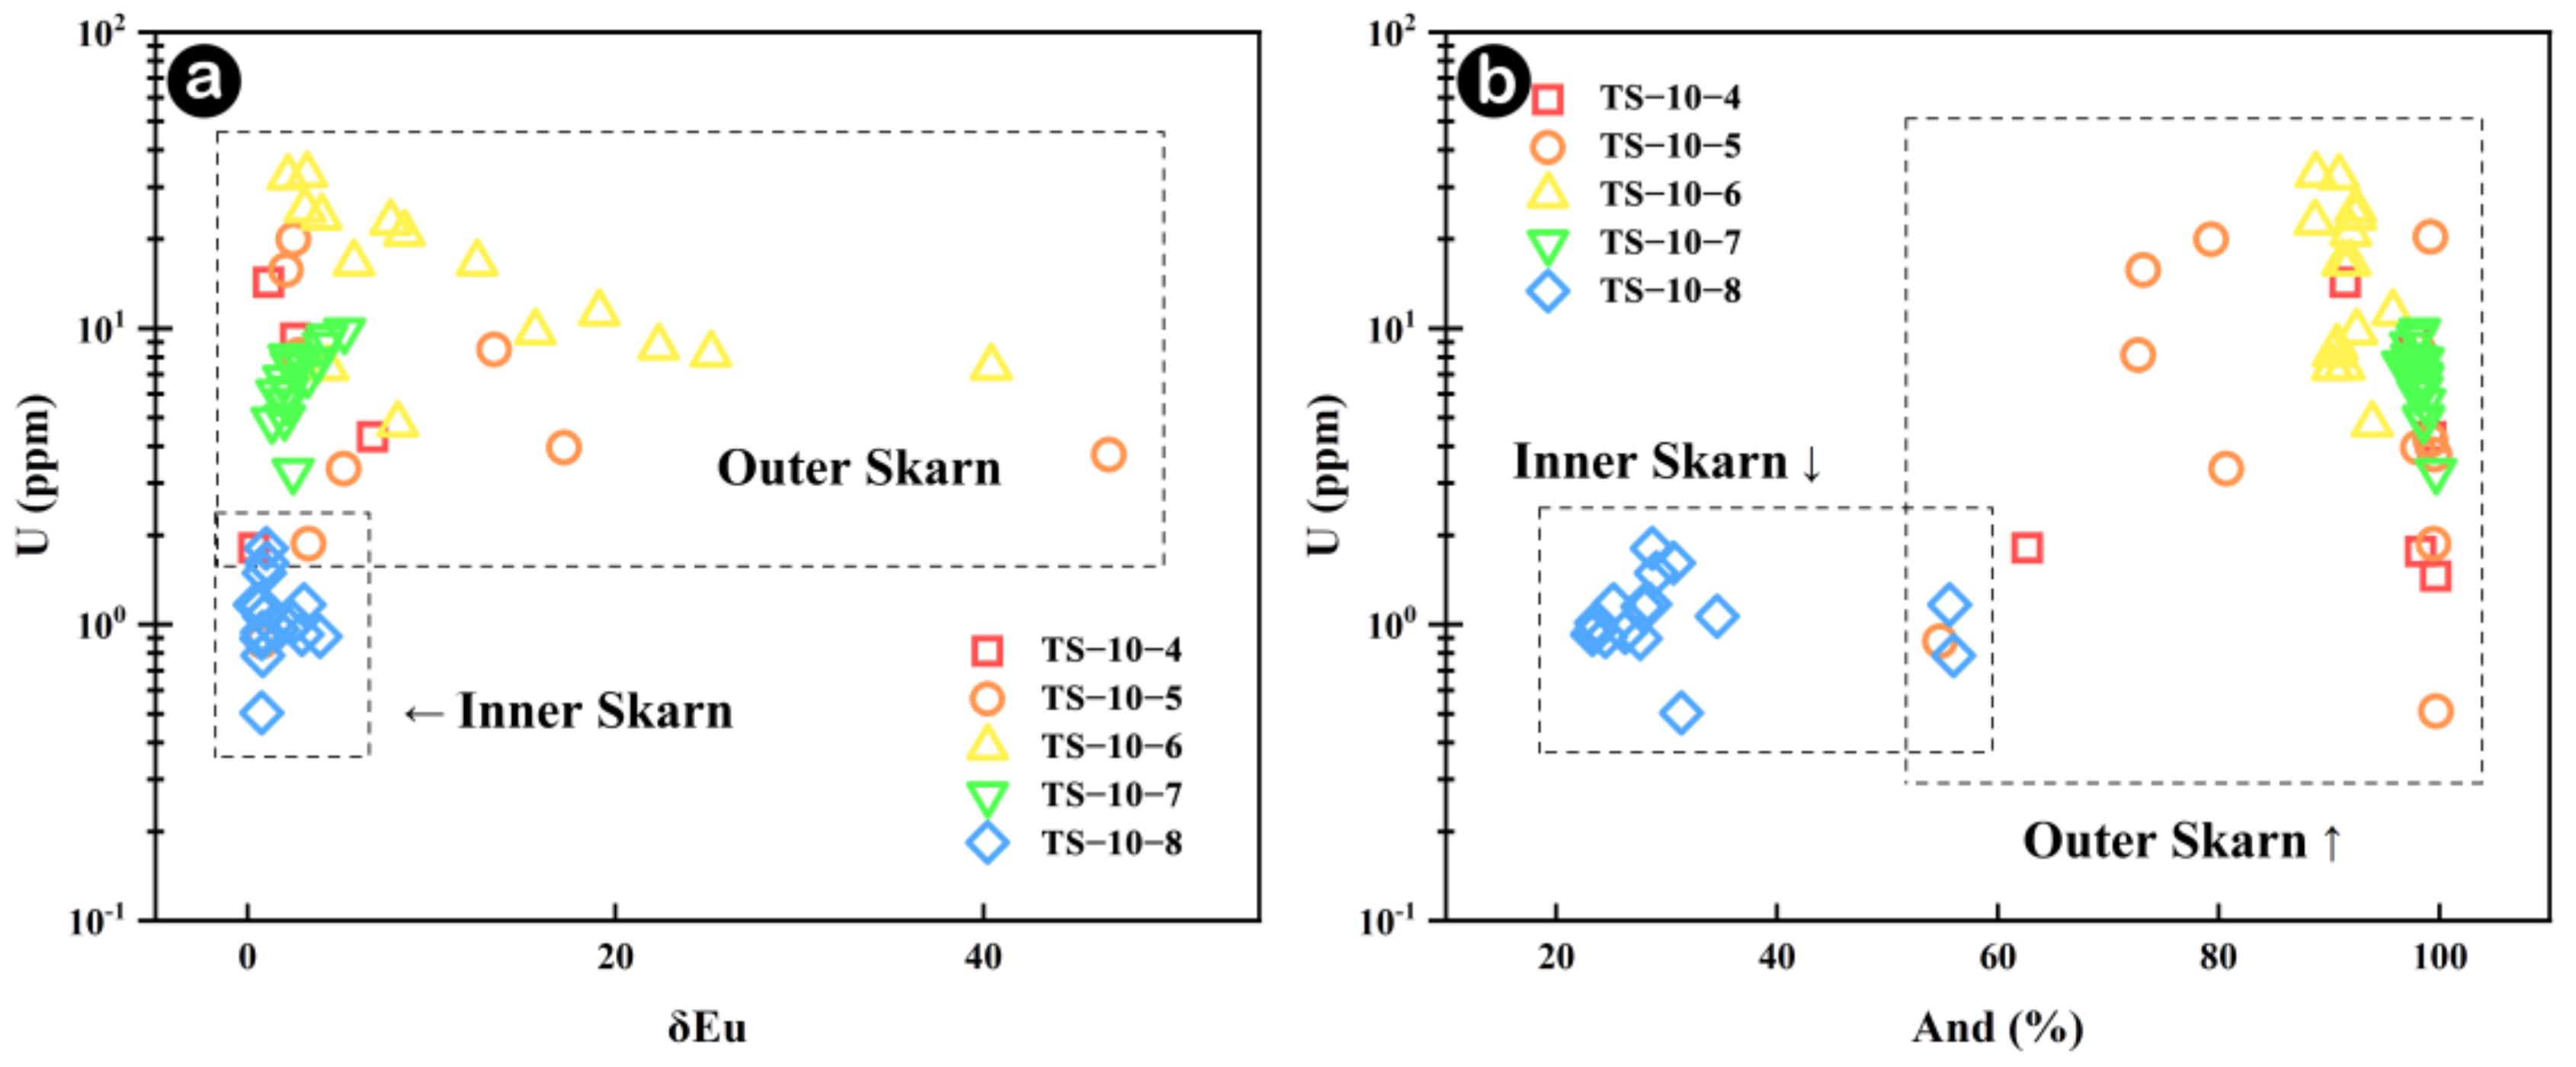
Garnet REEs are coupled with Fe in the inner skarn but with Al in the outer skarn following the YAG-type substitution mechanism. Garnets from the outer skarn show a significant variation in the Y/Ho ratio, indicating a large-scale water-rock interaction process in the external outer skarn zone. The U content in garnets may be greatly influenced by fO2 and fluid activity, while the Eu anomaly is not only controlled by fO2 changes in the system but is mainly restricted by various factors such as water-rock ratio, crystal structure and fO2, especially the change in the crystal structure, which is the main controlling factor.
(3)
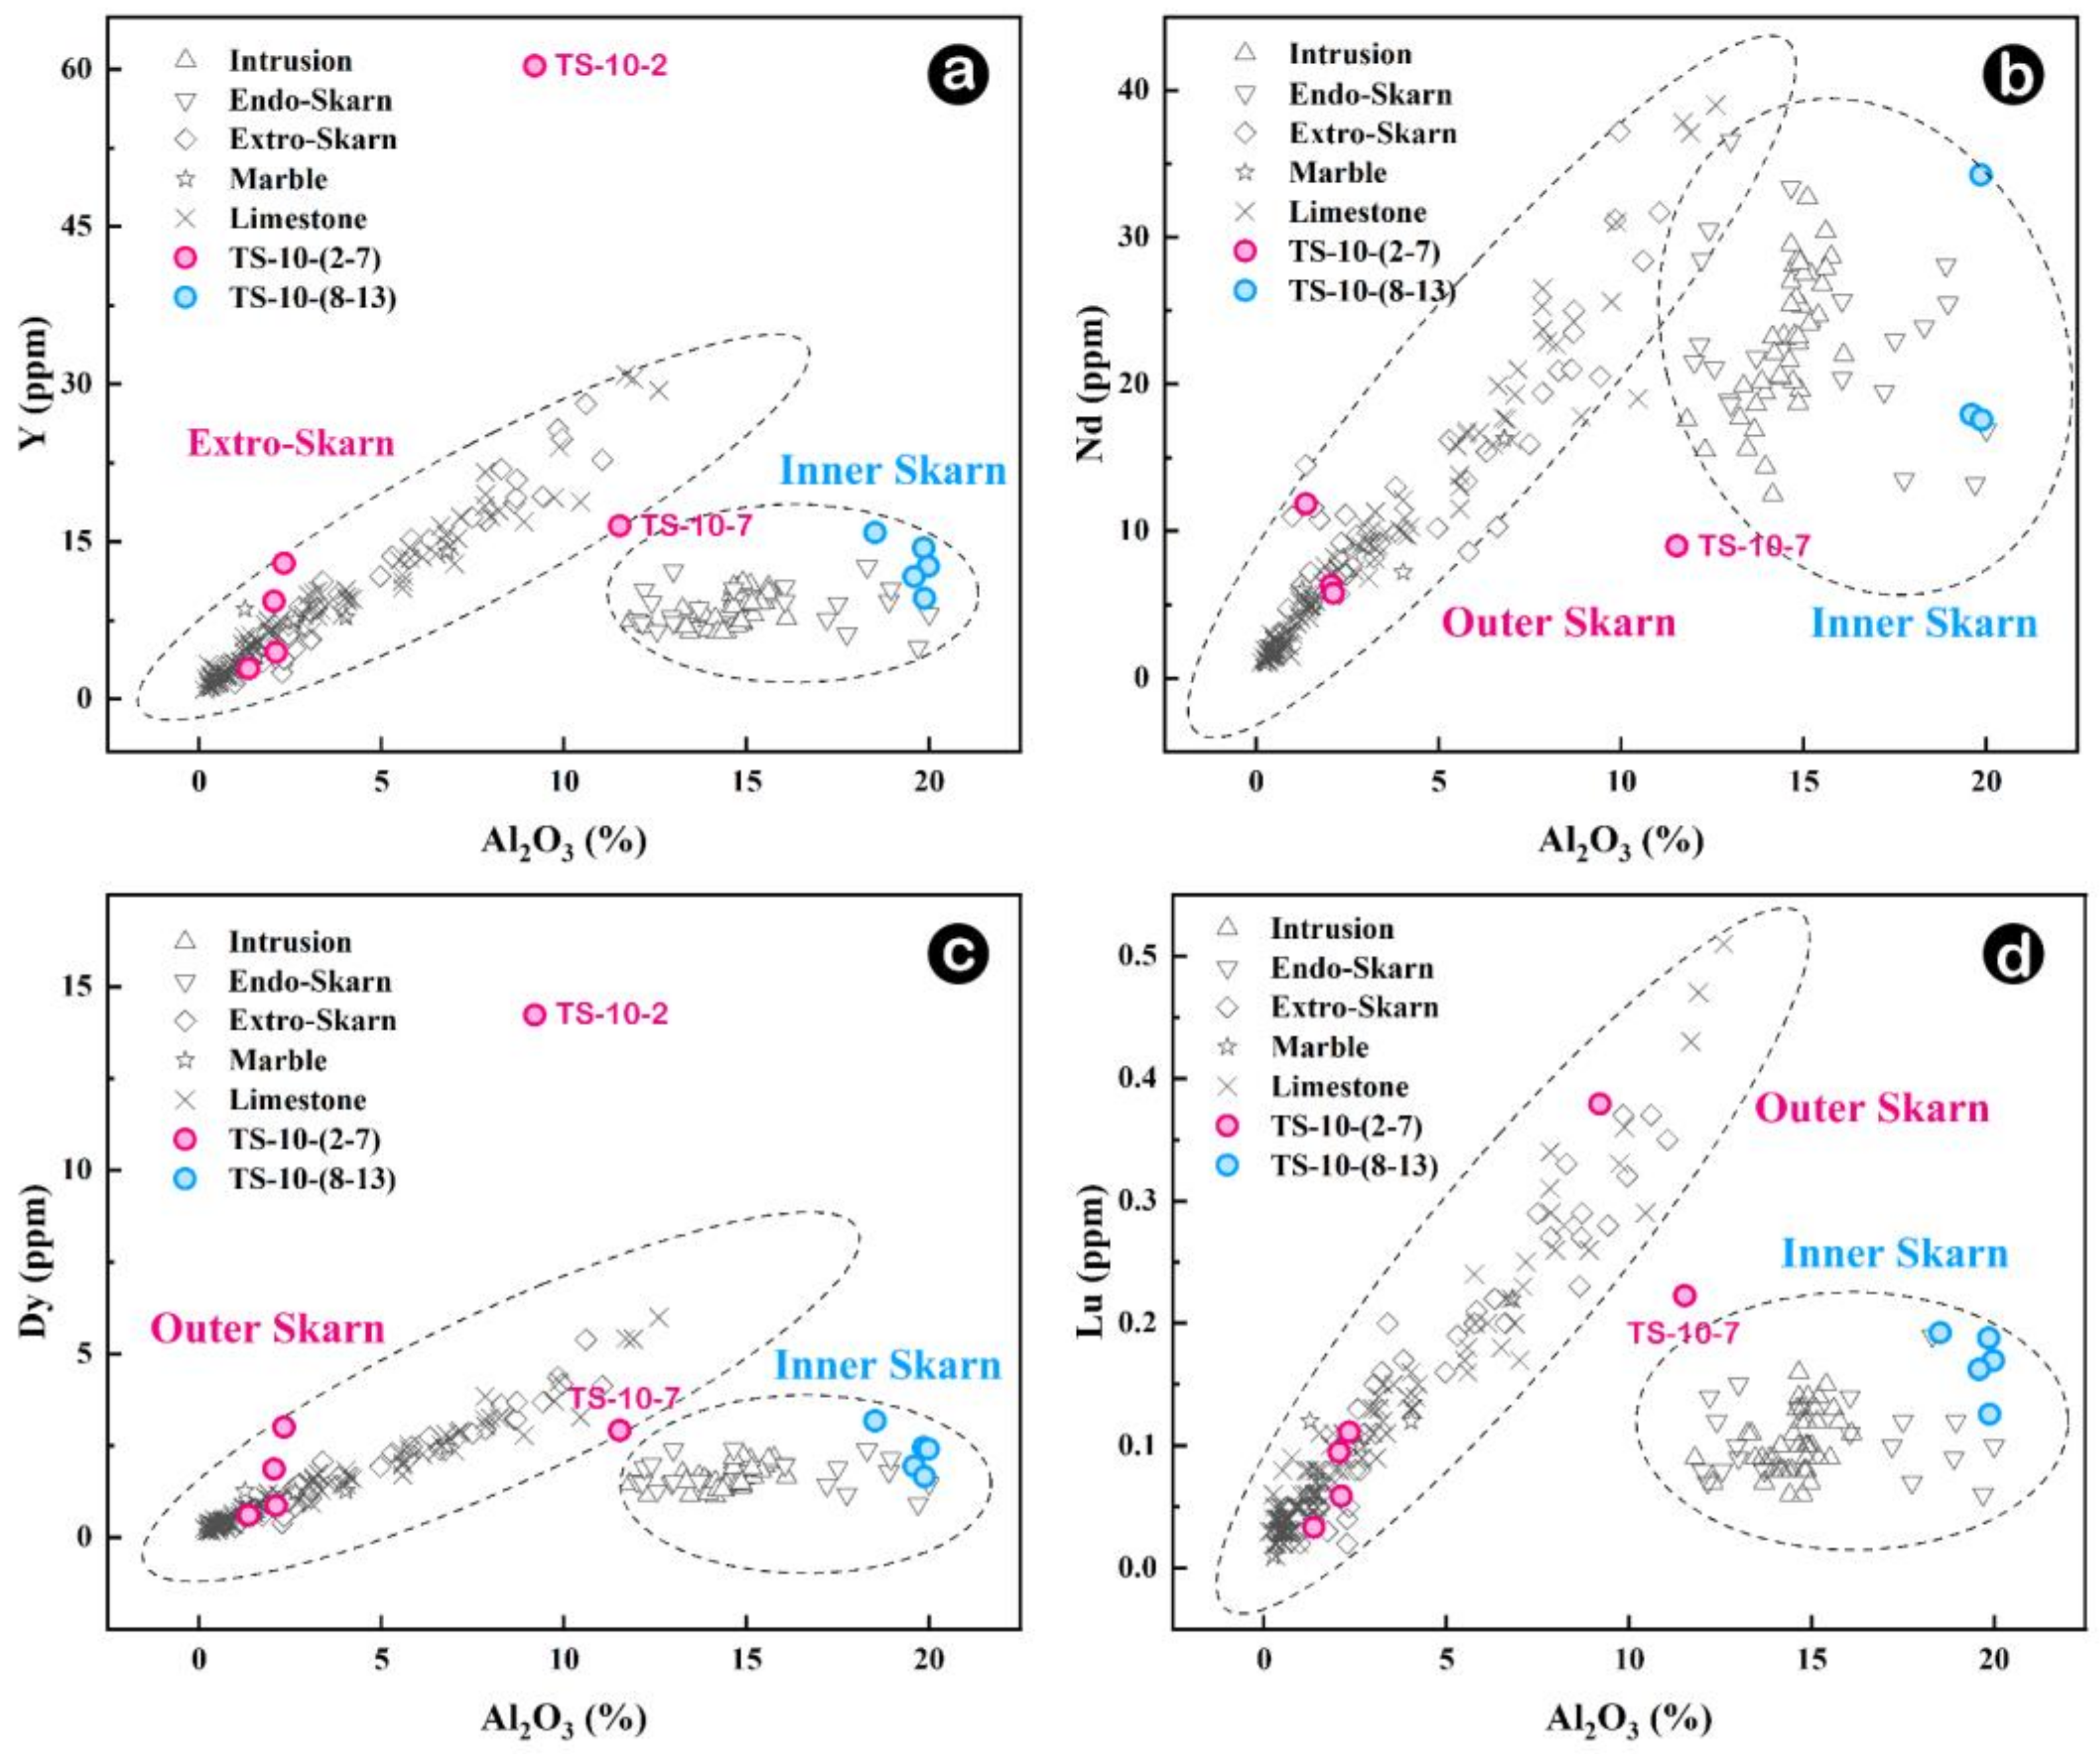
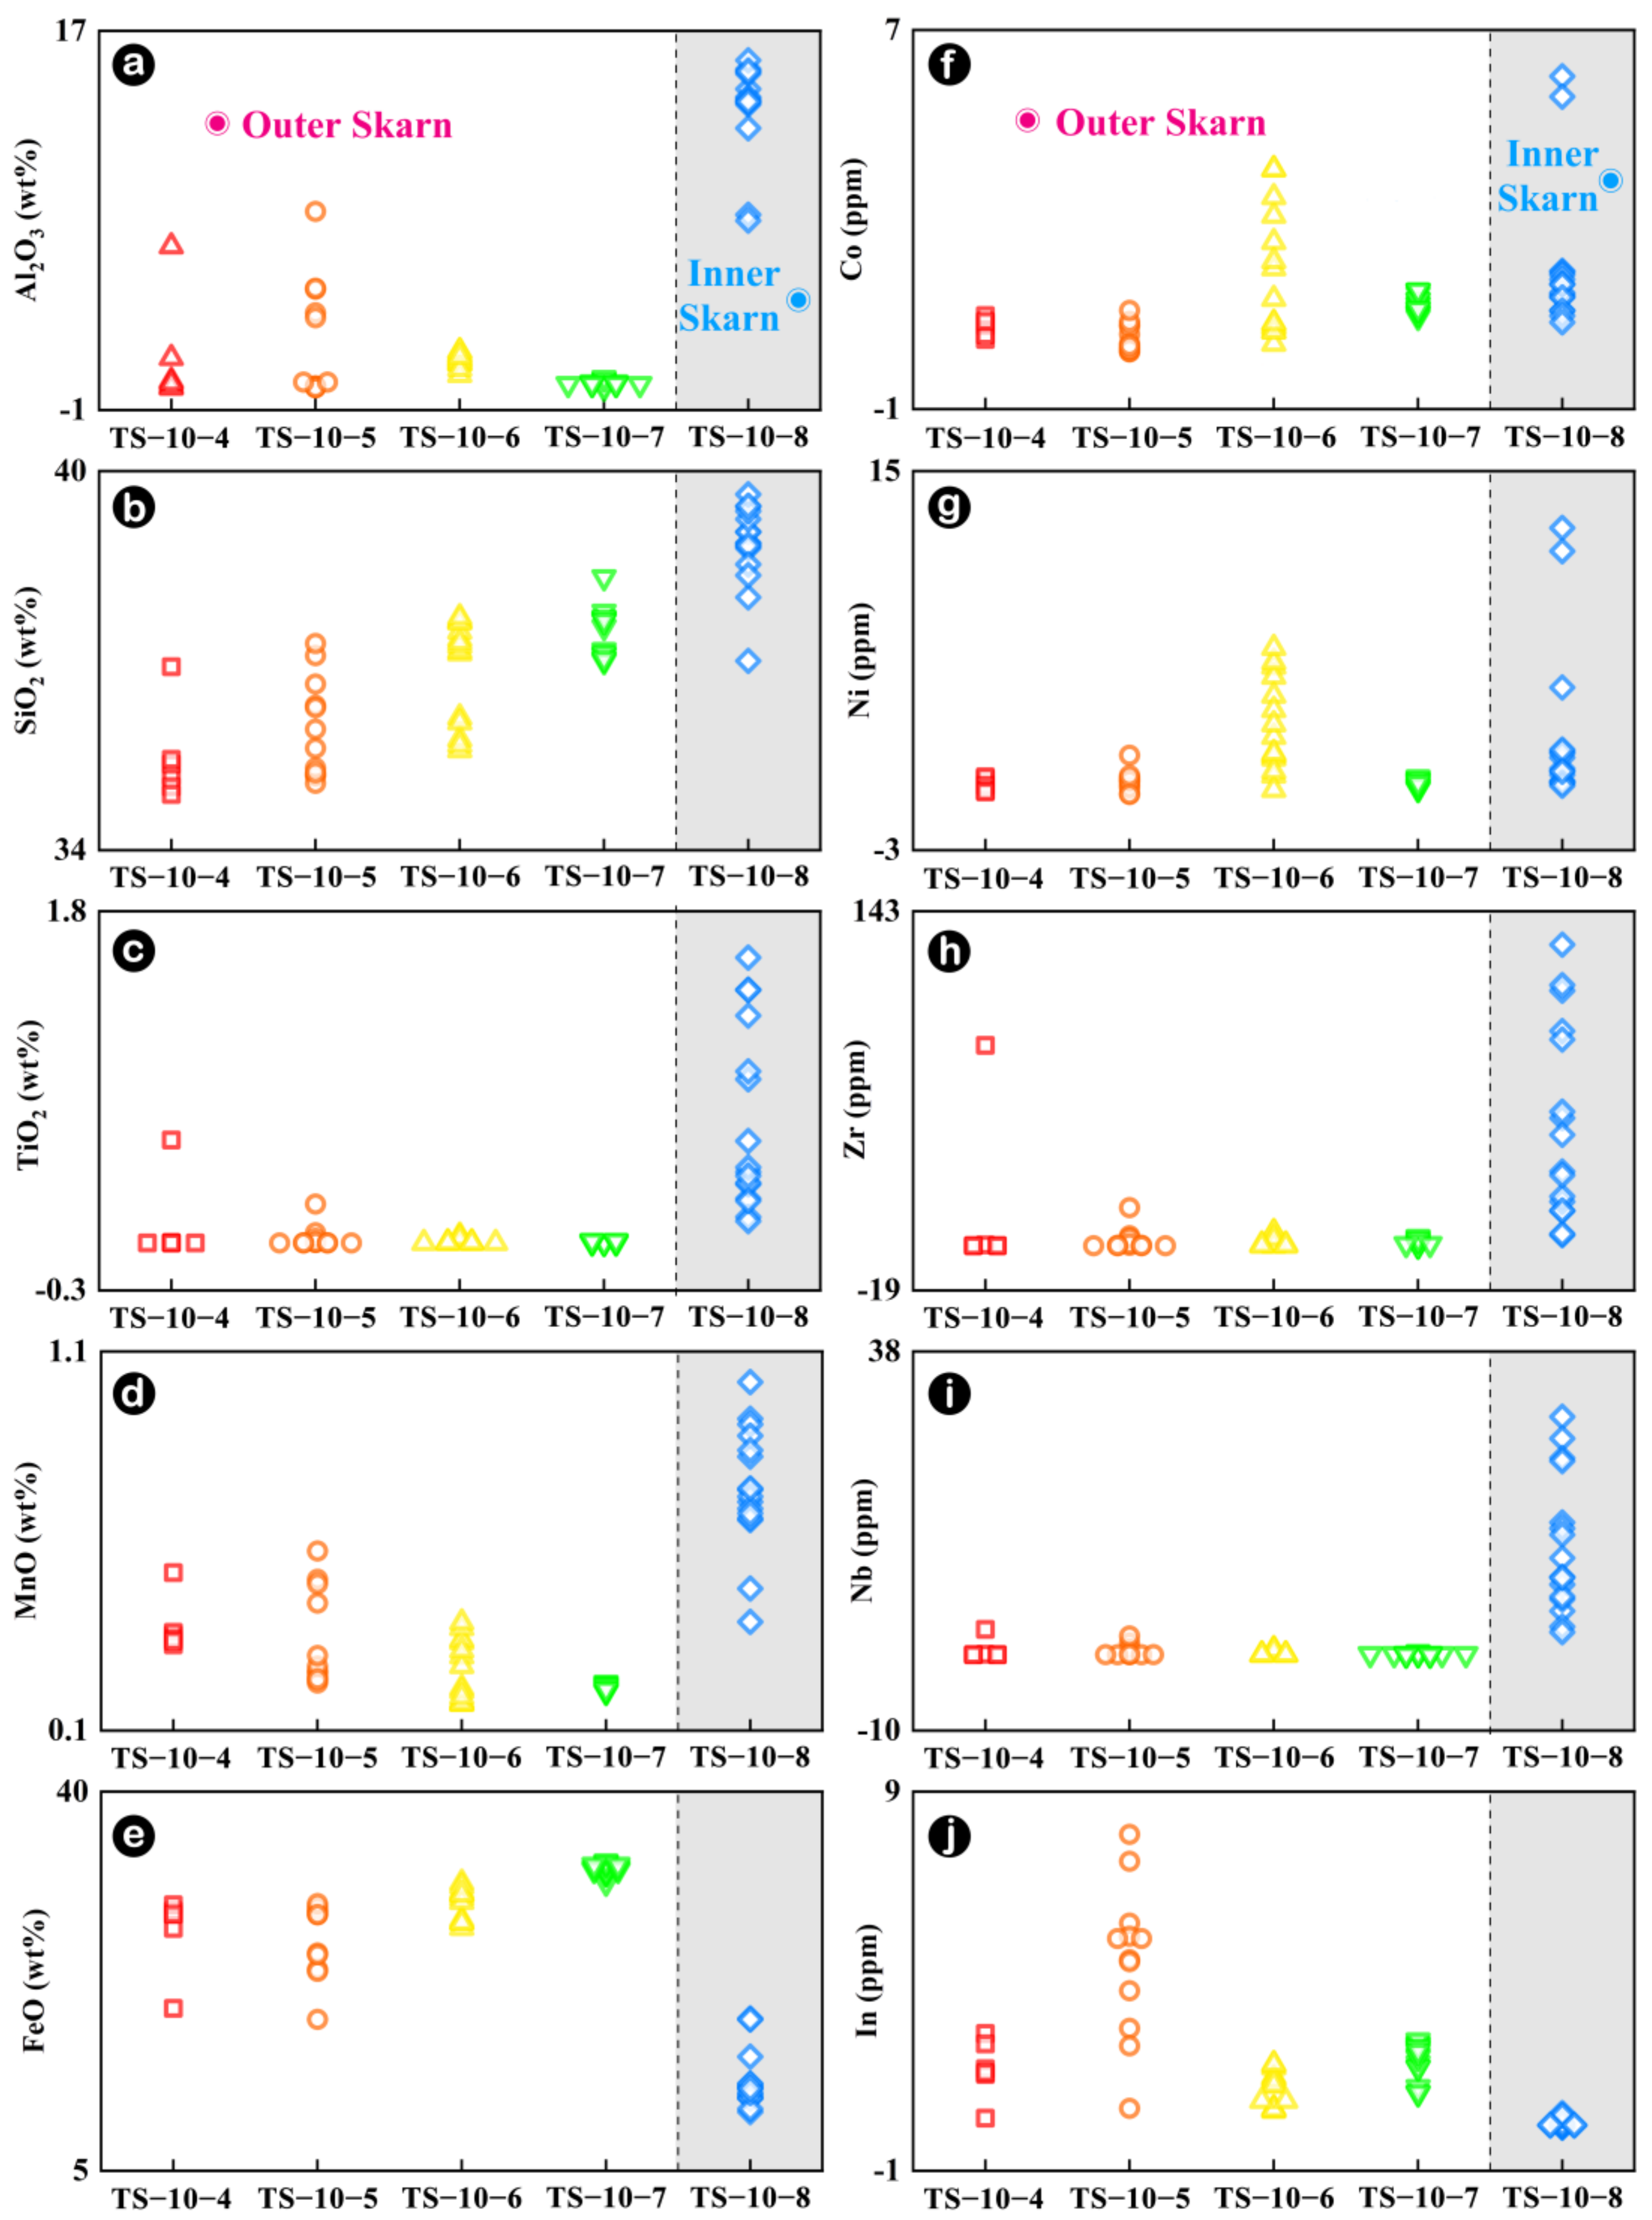
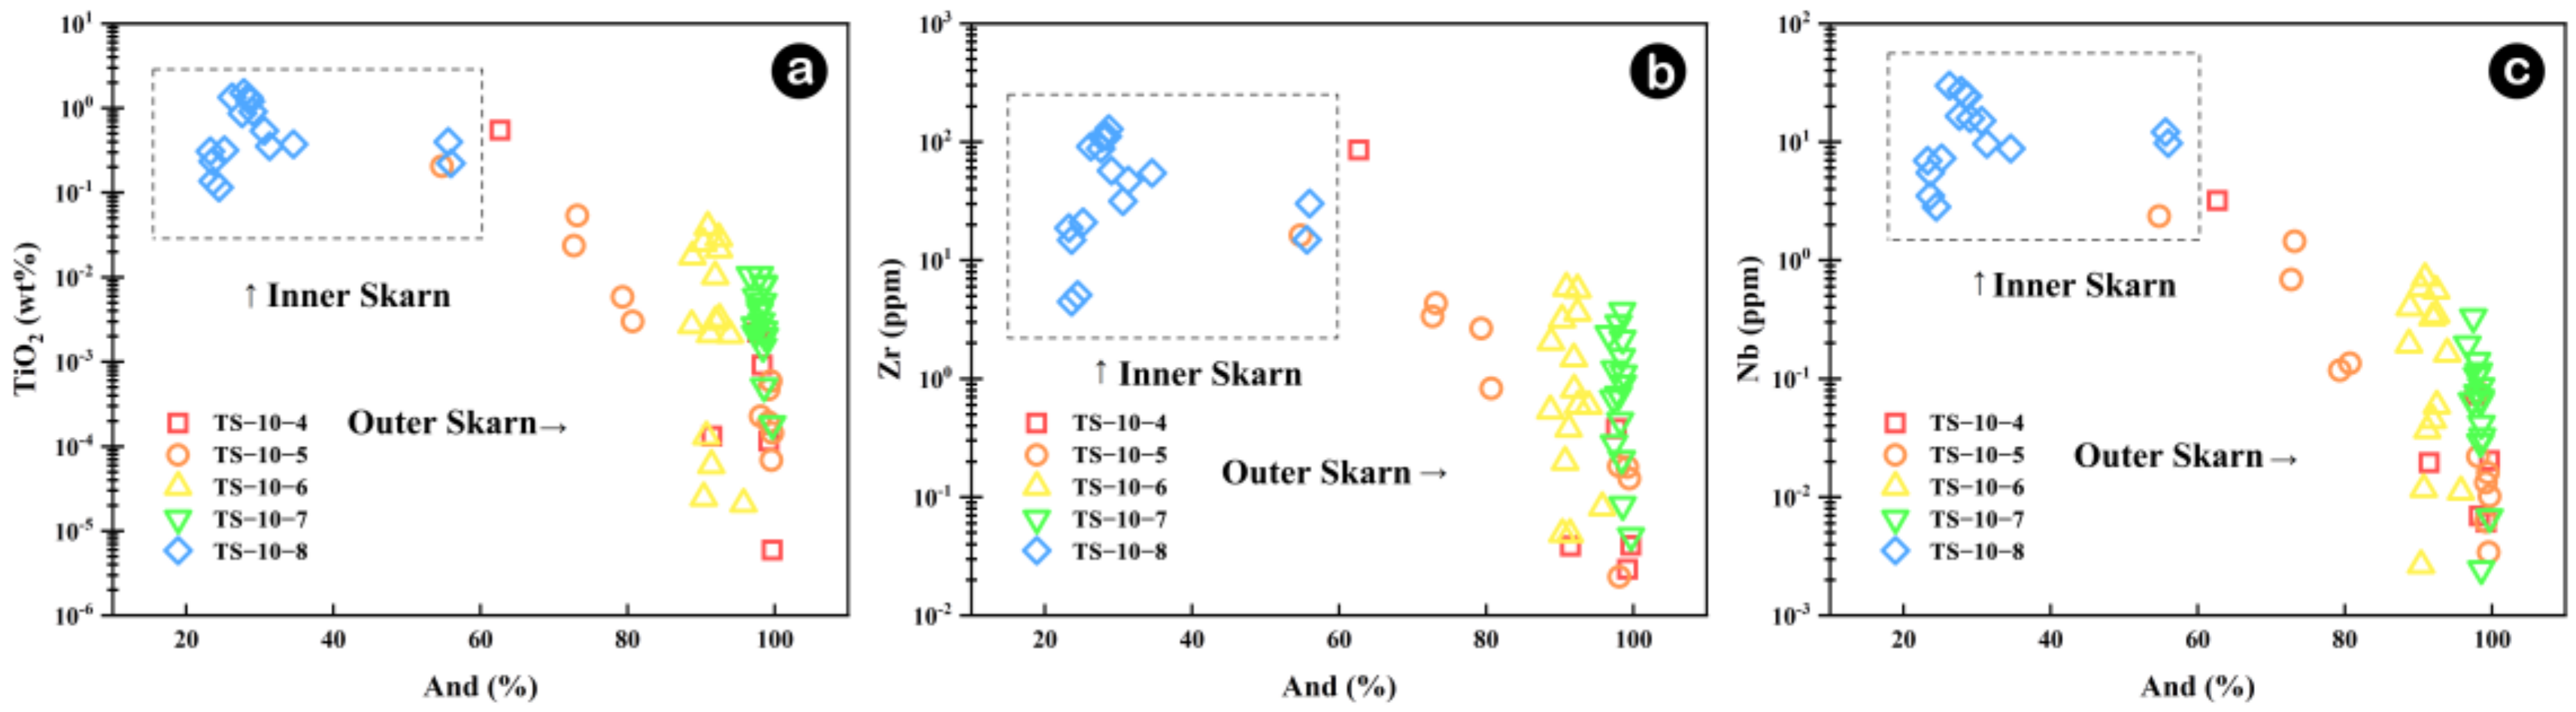
Whole-rock in Na, Al, Ti, and Sr elements between inner and outer skarn, particularly in chondrite-normalized diagrams of trace elements Lu, Dy and Y versus Al2O3 can effectively distinguish inner and outer skarn, except for samples located at the boundary. Fe, In, Al, Mn, Ni, Ti, Zr and Nb contents of garnets can also tell the boundary between inner and outer skarn. However, garnets in skarn are not fully developed, and multi-stage garnet features often occur, which may bring some interference. Whole-rock and mineral geochemistry each have their own advantages and disadvantages. It is more effective to determine the contact boundary of a rock body by combining the two methods for comprehensive analysis.
The hand specimens, microscopic observations, whole-rock chemistry and mineral chemistry of the Tongshan skarn profile display typical skarn characteristics. Because the properties of magmatic rocks and surrounding rocks in which skarns develop vary considerably, more classic skarn profiles are still needed to carry out similar research to further the understanding of skarn formation and expand the research scope.

Supplementary Materials

The following supporting information can be downloaded at: https://www.mdpi.com/article/10.3390/app13148118/s1, Table S1. Whole-rock major and trace elements in TS-10 profile. Table S2. Major and trace element of the garnets in TS-10 profile. Table S3a. Whole-rock data and processing results of granite and inner skarn in TS-10 profile. Table S3b. Whole-rock data and processing results of marble and outer skarn in TS-10 profile.

Author Contributions

Methodology, F.W.; Formal analysis, W.Z. and R.B.; Investigation, W.Z. and R.B.; Resources, F.W.; Writing–original draft, R.B., W.Z., F.W.; Writing–review & editing, F.W.; Supervision, F.W. All authors have read and agreed to the published version of the manuscript.

Funding

This research is jointly supported by the National Natural Science Foundation of China (Grants Nos. 91962218, 42273065) and the National Key Research and Development Program of China (Grant No. 2022YFC2903503).

Institutional Review Board Statement

Not applicable.

Informed Consent Statement

Not applicable.

Data Availability Statement

The original contributions presented in the study are included in the article and Supplementary Materials. Further inquiries can be directed to the corresponding author.

Conflicts of Interest

The authors declare no conflict of interest.

References

  1. Einaudi, M.T.; Meinert, L.D.; Newberry, R.J.; Skinner, B.J. Skarn Deposits. In Seventy-Fifth Anniversary Volume; Economic Geology Publishing Company: Littleton, CO, USA, 1981. [Google Scholar]
  2. Meinert, L.D.; Dipple, G.M.; Nicolescu, S.; Hedenquist, J.W.; Thompson, J.F.H.; Goldfarb, R.J.; Richards, J.P. World Skarn Deposits. In One Hundredth Anniversary Volume; Economic Geology Publishing Company: Littleton, CO, USA, 2005. [Google Scholar]
  3. Zhao, Y.; Lin, W.; Bi, C.; Li, D.; Jiang, C. Skarn Deposits of China; Geology Publishing House: Beijing, China, 1990; Volume 354. [Google Scholar]
  4. Zhou, T. Isotope geochemistry of copper mineralization in Yueshan, Anhui. Miner. Depos. 1996, 15, 341–350. [Google Scholar]
  5. Lu, H.-Z.; Liu, Y.; Wang, C.; Xu, Y.; Li, H. Mineralization and fluid inclusion study of the Shizhuyuan W-Sn-Bi-Mo-F skarn deposit, Hunan Province, China. Econ. Geol. 2003, 98, 955–974. [Google Scholar] [CrossRef]
  6. Zhu, Q.; Xie, G.; Wang, J.; Li, W.; Yu, B. The relationship between the evaporate and skarn-type iron deposit: A case study of the Jinshandian iron skarn deposit in Hubei. Acta Geol. Sin. 2013, 87, 1419–1428. [Google Scholar]
  7. Wilkinson, J.J. Triggers for the formation of porphyry ore deposits in magmatic arcs. Nat. Geosci. 2013, 6, 917–925. [Google Scholar] [CrossRef] [Green Version]
  8. Mrozek, S.A.; Chang, Z.; Spandler, C.; Windle, S.; Raraz, C.; Paz, A. Classifying skarns and quantifying metasomatism at the Antamina deposit, Peru: Insights from whole-rock geochemistry. Econ. Geol. 2020, 115, 177–188. [Google Scholar] [CrossRef]
  9. Chang, Z.; Meinert, L.D. The Empire Cu-Zn mine, Idaho: Exploration implications of unusual skarn features related to high fluorine activity. Econ. Geol. 2008, 103, 909–938. [Google Scholar] [CrossRef]
  10. Zang, Z.; Liu, W.; Dong, L. Geology, Geochemistry and Re-Os Age of the Qiaoxiahala Deposit in NW China: Evidence of an Overprinted Fe (-Cu/Au) Deposit. J. Earth Sci. 2021, 32, 208–218. [Google Scholar] [CrossRef]
  11. Matthews, S.; Marquillas, R.; Kemp, A.; Grange, F.; Gardeweg, M. Active skarn formation beneath Lascar Volcano, northern Chile: A petrographic and geochemical study of xenoliths in eruption products. J. Metamorph. Geol. 1996, 14, 509–530. [Google Scholar] [CrossRef]
  12. Sun, W.; Niu, Y.; Ma, Y.; Liu, Y.; Zhang, G.; Hu, Z.; Zhang, Z.; Chen, S.; Li, J.; Wang, X. Petrogenesis of the Chagangnuoer deposit, NW China: A general model for submarine volcanic-hosted skarn iron deposits. Sci. Bull. 2015, 60, 363–379. [Google Scholar] [CrossRef] [Green Version]
  13. Yano, R.I. Trace Element Distribution in Chalcopyrite-Bearing Porphyry and Skarn Deposits; University of Nevada: Reno, NV, USA, 2012. [Google Scholar]
  14. Gaspar, M.; Knaack, C.; Meinert, L.D.; Moretti, R. REE in skarn systems: A LA-ICP-MS study of garnets from the Crown Jewel gold deposit. Geochim. Cosmochim. Acta 2008, 72, 185–205. [Google Scholar] [CrossRef]
  15. Fei, X.; Zhang, Z.; Cheng, Z.; Santosh, M. Factors controlling the crystal morphology and chemistry of garnet in skarn deposits: A case study from the Cuihongshan polymetallic deposit, Lesser Xing’an Range, NE China. Am. Mineral. 2019, 104, 1455–1468. [Google Scholar] [CrossRef]
  16. Xiao, X.; Zhou, T.-f.; White, N.C.; Zhang, L.-J.; Fan, Y.; Wang, F.-Y.; Chen, X.-F. The formation and trace elements of garnet in the skarn zone from the Xinqiao Cu-S-Fe-Au deposit, Tongling ore district, Anhui Province, Eastern China. Lithos 2018, 302, 467–479. [Google Scholar] [CrossRef]
  17. Quelhas, P.; Mata, J.; Dias, Á.A. Magmatic Evolution of Garnet-Bearing Highly Fractionated Granitic Rocks from Macao, Southeast China: Implications for Granite-Related Mineralization Processes. J. Earth Sci. 2021, 32, 1454–1471. [Google Scholar] [CrossRef]
  18. Wang, F.; Ge, C.; Ning, L.; Nie, L.; Zhong, G.; White, N.C. A new approach to LA-ICP-MS mapping and application in geology. Acta Petrol. Sin. 2017, 33, 3422–3436. [Google Scholar]
  19. Zhu, X.; Wang, Z.; Chen, H. Advances in Isotope Geochronology and Isotope Geochemistry: A Preface. J. Earth Sci. 2022, 33, 1–4. [Google Scholar] [CrossRef]
  20. Zhang, W.; Hu, Z.; Feng, L.; Wang, Z.; Liu, Y.; Feng, Y.; Liu, H. Accurate determination of Zr isotopic ratio in zircons by femtosecond laser ablation MC-ICP-MS with “Wet” plasma technique. J. Earth Sci. 2022, 33, 67–75. [Google Scholar] [CrossRef]
  21. Menzer, G. Die Kristallstruckture von granat. Z. Kristallogr. 1926, 63, 157–158. [Google Scholar]
  22. McIntire, W. Trace element partition coefficients—A review of theory and applications to geology. Geochim. Cosmochim. Acta 1963, 27, 1209–1264. [Google Scholar] [CrossRef]
  23. Jamtveit, B.; Hervig, R.L. Constraints on transport and kinetics in hydrothermal systems from zoned garnet crystals. Science 1994, 263, 505–508. [Google Scholar] [CrossRef]
  24. Smith, M.; Henderson, P.; Jeffries, T.; Long, J.; Williams, C. The rare earth elements and uranium in garnets from the Beinn an Dubhaich Aureole, Skye, Scotland, UK: Constraints on processes in a dynamic hydrothermal system. J. Petrol. 2004, 45, 457–484. [Google Scholar] [CrossRef] [Green Version]
  25. Lessing, P.; Standish, R.P. Zoned garnet from Crested Butte, Colorado. Am. Mineral. J. Earth Planet. Mater. 1973, 58, 840–842. [Google Scholar]
  26. Zhai, D.-G.; Liu, J.-J.; Zhang, H.-Y.; Wang, J.-P.; Su, L.; Yang, X.-A.; Wu, S.-H. Origin of oscillatory zoned garnets from the Xieertala Fe–Zn skarn deposit, northern China: In situ LA–ICP-MS evidence. Lithos 2014, 190, 279–291. [Google Scholar] [CrossRef]
  27. He, Z.; Li, S.; Li, Y.; Gao, J. Multi-Directional and Multiphase Tectonic Modification, and Hydrocarbon Differential Enrichment in the Middle-Upper Yangtze Region. J. Earth Sci. 2022, 33, 1246–1259. [Google Scholar] [CrossRef]
  28. Wang, F.; Liu, S.-A.; Li, S.; Akhtar, S.; He, Y. Zircon U–Pb ages, Hf–O isotopes and trace elements of Mesozoic high Sr/Y porphyries from Ningzhen, eastern China: Constraints on their petrogenesis, tectonic implications and Cu mineralization. Lithos 2014, 200, 299–316. [Google Scholar] [CrossRef]
  29. Zhou, T. Advances on petrogenesis and metallogeny study of the mineralization belt of the Middle and Lower Reaches of the Yangtze River area. Acta Petrol. Sin. 2008, 24, 1666–1678. [Google Scholar]
  30. Liu, S.-A.; Li, S.; He, Y.; Huang, F. Geochemical contrasts between early Cretaceous ore-bearing and ore-barren high-Mg adakites in central-eastern China: Implications for petrogenesis and Cu–Au mineralization. Geochim. Cosmochim. Acta 2010, 74, 7160–7178. [Google Scholar] [CrossRef]
  31. Mao, J.; Wang, Y.; Lehmann, B.; Yu, J.; Du, A.; Mei, Y.; Li, Y.; Zang, W.; Stein, H.J.; Zhou, T. Molybdenite Re–Os and albite 40Ar/39Ar dating of Cu–Au–Mo and magnetite porphyry systems in the Yangtze River valley and metallogenic implications. Ore Geol. Rev. 2006, 29, 307–324. [Google Scholar] [CrossRef]
  32. Wang, L.; Ji, K.; Chen, D. Re-Os isotope ages of molybdenite from the Anjishan copper deposit and the Tongshan copper-molybdenum deposit and their implications. Acta Petrol. Mineral. 1997, 16, 154–159. [Google Scholar]
  33. Zhang, J.; Liang, X.; Wang, F.; Wang, H.; Fan, Y.; Ba, T.; Meng, X. CorelKit: An Extensible CorelDraw VBA Program for Geoscience Drawing. J. Earth Sci. 2023, 34, 735–757. [Google Scholar] [CrossRef]
  34. Rudnick, R.; Gao, S. Composition of the continental crust. In Treatise on Geochemistry; Rudnick, R.L., Ed.; The Crust; Elsevier: Pergamon, Turkey, 2003; Volume 3. [Google Scholar]
  35. Liu, Y.; Hu, Z.; Gao, S.; Günther, D.; Xu, J.; Gao, C.; Chen, H. In situ analysis of major and trace elements of anhydrous minerals by LA-ICP-MS without applying an internal standard. Chem. Geol. 2008, 257, 34–43. [Google Scholar] [CrossRef]
  36. Liu, Y.; Gao, S.; Hu, Z.; Gao, C.; Zong, K.; Wang, D. Continental and oceanic crust recycling-induced melt–peridotite interactions in the Trans-North China Orogen: U–Pb dating, Hf isotopes and trace elements in zircons from mantle xenoliths. J. Petrol. 2010, 51, 537–571. [Google Scholar] [CrossRef]
  37. Shen, J.; Qin, L.; Fang, Z.; Zhang, Y.; Liu, J.; Liu, W.; Wang, F.; Xiao, Y.; Yu, H.; Wei, S. High-temperature inter-mineral Cr isotope fractionation: A comparison of ionic model predictions and experimental investigations of mantle xenoliths from the North China Craton. Earth Planet. Sci. Lett. 2018, 499, 278–290. [Google Scholar] [CrossRef]
  38. Guo, S.; Ye, K.; Chen, Y.; Liu, J.-B. A normalization solution to mass transfer illustration of multiple progressively altered samples using the isocon diagram. Econ. Geol. 2009, 104, 881–886. [Google Scholar] [CrossRef]
  39. Grant, J.A. The isocon diagram; a simple solution to Gresens’ equation for metasomatic alteration. Econ. Geol. 1986, 81, 1976–1982. [Google Scholar] [CrossRef]
  40. Guo, S.; Ye, K.; Chen, Y.; Liu, J.; Zhang, L. Introduction of mass-balance calculation method for component transfer during the opening of a geological system. Acta Petrol. Sin. 2013, 29, 1486–1498. [Google Scholar]
  41. Gresens, R.L. Composition-volume relationships of metasomatism. Chem. Geol. 1967, 2, 47–65. [Google Scholar] [CrossRef]
  42. Ague, J.J. Mass transfer during Barrovian metamorphism of pelites, south-central Connecticut; I, Evidence for changes in composition and volume. Am. J. Sci. 1994, 294, 989–1057. [Google Scholar] [CrossRef]
  43. Ague, J.J. Crustal mass transfer and index mineral growth in Barrow’s garnet zone, northeast Scotland. Geology 1997, 25, 73–76. [Google Scholar] [CrossRef]
  44. Grant, J.A. Isocon analysis: A brief review of the method and applications. Phys. Chem. Earth Parts A/B/C 2005, 30, 997–1004. [Google Scholar] [CrossRef]
  45. Shannon, R.D. Revised effective ionic radii and systematic studies of interatomic distances in halides and chalcogenides. Acta Crystallogr. Sect. A Cryst. Phys. Diffr. Theor. Gen. Crystallogr. 1976, 32, 751–767. [Google Scholar] [CrossRef]
  46. Enami, M.; Bolin, C.; Yoshida, T.; Kawabe, I. A mechanism for Na incorporation in garnet: An example from garnet in orthogneiss from the Su-Lu terrane, eastern China. Am. Mineral. 1995, 80, 475–482. [Google Scholar] [CrossRef]
  47. Carlson, W.D. Rates and mechanism of Y, REE, and Cr diffusion in garnet. Am. Mineral. 2012, 97, 1598–1618. [Google Scholar] [CrossRef]
  48. Grew, E.S.; Marsh, J.H.; Yates, M.G.; Lazic, B.; Armbruster, T.; Locock, A.; Bell, S.W.; Dyar, M.D.; Bernhardt, H., Jr.; Medenbach, O. Menzerite-(Y), a new species,{(Y, REE)(Ca, Fe2+) 2}[(Mg, Fe2+)(Fe3+, Al)](Si3) O12, from a felsic granulite, Parry Sound, Ontario, and a new garnet end-member,{Y2Ca}[Mg2](Si3) O12. Can. Mineral. 2010, 48, 1171–1193. [Google Scholar] [CrossRef]
  49. Jaffe, H.W. The role of yttrium and other minor elements in the garnet group. Am. Mineral. J. Earth Planet. Mater. 1951, 36, 133–155. [Google Scholar]
  50. Quartieri, S.; Antonioli, G.; Geiger, C.; Artioli, G.; Lottici, P. XAFS characterization of the structural site of Yb in synthetic pyrope and grossular garnets. Phys. Chem. Miner. 1999, 26, 251–256. [Google Scholar] [CrossRef]
  51. Quartieri, S.; Chaboy, J.; Antonioli, G.; Geiger, C. XAFS characterization of the structural site of Yb in synthetic pyrope and grossular garnets. II: XANES full multiple scattering calculations at the Yb LI-and L III-edges. Phys. Chem. Miner. 1999, 27, 88–94. [Google Scholar] [CrossRef]
  52. Dziggel, A.; Wulff, K.; Kolb, J.; Meyer, F.M.; Lahaye, Y. Significance of oscillatory and bell-shaped growth zoning in hydrothermal garnet: Evidence from the Navachab gold deposit, Namibia. Chem. Geol. 2009, 262, 262–276. [Google Scholar] [CrossRef]
  53. Bau, M. Rare-earth element mobility during hydrothermal and metamorphic fluid-rock interaction and the significance of the oxidation state of europium. Chem. Geol. 1991, 93, 219–230. [Google Scholar] [CrossRef]
  54. Liang, X. Garnets of Grossular—Andraditend Series: Their Characteristics and Metasomatic Mechanism. Acta Petrol. Mineral. 1994, 13, 342–352. [Google Scholar]
  55. Sverjensky, D.A. Europium redox equilibria in aqueous solution. Earth Planet. Sci. Lett. 1984, 67, 70–78. [Google Scholar] [CrossRef]
  56. Allen, D.E.; Seyfried, W., Jr. REE controls in ultramafic hosted MOR hydrothermal systems: An experimental study at elevated temperature and pressure. Geochim. Cosmochim. Acta 2005, 69, 675–683. [Google Scholar] [CrossRef]
  57. Van Westrenen, W.; Allan, N.; Blundy, J.; Purton, J.; Wood, B. Atomistic simulation of trace element incorporation into garnets—Comparison with experimental garnet-melt partitioning data. Geochim. Cosmochim. Acta 2000, 64, 1629–1639. [Google Scholar] [CrossRef]
  58. Paz, A.; Raraz, C.; Paredes, D.; Mendoza, C.; Windle, S. Caracterización Litogeoquímica de las Formaciones Jumasha-Celendin Metalotectos Relacionados a la Mineralización de Cu-Zn Cercano al Yacimiento de Antamina. In Proceedings of the 9th International Congress of Prospectors and Explorers (ProEXPLO), Lima, Peru, 18–20 May 2015; Extended Abstract. p. 43. [Google Scholar]
Figure 1. Geological map of the middle and lower reaches of the Yangtze Rive (Modified from Zhou, 2008 [29]).
Applsci 13 08118 g001
Figure 2. Geological map of the Ningzhen mining district in LYRMB (Modified from Liu et al., 2010 [30]; Mao et al., 2006 [31]).
Applsci 13 08118 g002
Figure 3. Overview of the skarn profile in Tongshan, with the number of 1–15 where samples were collected, named TS-10-(1~15).
Applsci 13 08118 g003
Figure 4. Mineral content of each sample in the TS-10 profile. Values in the figure represent a preliminary estimation based on microscope and hand specimens observation.
Applsci 13 08118 g004
Figure 5. Micrographs of rocks at different positions in Tongshan skarn profile. (A) non-altered granodiorite; (B) diopside-epidote skarn; (C) garnet-rich skarn (garnet:diopside > 5:1); (D) early garnet cut by later garnet vein; (E) garnet mineral boundary filled with brass vein; (F) garnet decomposed and replaced by chlorite; (G) diopside-rich skarn (garnet:diopside < 5:1); (H) diopside rich zone fine vein disseminated distribution, magnetite and chalcopyrite coexist; (I) diopside rich skarn with chlorite; (J,K) disseminated distribution of diopside rich zone and reflection of chalcopyrite; (L) marble belt. (Cc-calcite, Ccp-chalcopyrite, Mag-magmagnetite, Chl-chlorite, Di-diopside, Grt-garnet, Ep-epidote, Pl-plagioclase, Qz-quartz, Bt-biotite. (E,H,J) were captured under reflected light, while the remaining were under transmitted light.).
Applsci 13 08118 g005
Figure 6. End-member diagram with microscope and Back-Scattered Electron (BSE) images of typical garnets in the TS-10 profile. (a) Grossularite from the inner skarn,(be) Andradite from the outer skarn. CorelKit was used for the projection here [33].
Applsci 13 08118 g006
Figure 7. Geochemical variations of major elements in the TS-10 profile based on whole-rock analysis. (ag) Trend of important major elements, (h,i) Trend of important trace element (Sr) and ΣREE. The labels of different color zones are shown in (a), gray-marble, bule-outer skarn, pink-inner skarn, orange-granite.
Applsci 13 08118 g007
Figure 8. Trace elements whole-rock geochemical characteristics. (a) Similar trend of some trace elements (Sc, Y and REEs), (b) Different trend of some trace elements (V, Ni, Zn and Sr).
Applsci 13 08118 g008
Figure 9. Chondrite-normalized REE patterns of garnets from TS-10 profile. (a) Grossularite in the Inner skarn. (be) Andradite in the Outer skarn.
Applsci 13 08118 g009
Figure 10. Mapping results of typical garnet in TS-10-8 (Grossularite in the inner skarn) and TS-10-5 (Andradite in the outer skarn). See Figure 6a,d for microscope photos and BSE photos.
Applsci 13 08118 g010
Figure 11. Isocon diagrams of the TS-10 profile from granite to inner skarn. (a) Migration trend of major elements, (b) Migration trend of REEs, (c) Migration trend of LILEs, (d) Migration trend of HFSEs. Normalization and plotting methods refer to Guo et al. (2009) [38]. The original data of the diagrams can be found in Supplementary Table S3a.
Applsci 13 08118 g011
Figure 12. Isocon diagrams of the TS-10 profile from outer skarn to marble. (a) Migration trend of major elements, (b) Migration trend of REEs, (c) Migration trend of LILEs, (d) Migration trend of HFSEs. Plotting methods refer to Guo et al. (2009) [38]. Marble-outer skarn plots are not normalized and are drawn assuming a constant total system mass. Should be noted that this can only reflect the trend information, not an absolute quantitative analysis. The original data of the diagrams can be found in Supplementary Table S3b.
Applsci 13 08118 g012
Figure 13. The relationship between total REE and Mg2+, Fe2+, Fe3+, Al3+, Y in the garnet from TS-10 profile. (a)Al3+ vs. ΣREE diagram, (b) Fe3+ vs. ΣREE diagram, (c) Y vs. ΣREE diagram, (d) Mg2+ vs. ΣREE diagram, (e) Fe2+ vs. ΣREE diagram, (f) U vs. ΣREE diagram. Atoms per formula unit (apfu) calculated based on 12 oxygen atoms as cation number.
Applsci 13 08118 g013
Figure 14. Andradite end member (And) vs. Y/Ho diagram.
Applsci 13 08118 g014
Figure 15. (a) Andradite end member (And) vs. U diagram; (b) δEu vs. U diagram.
Applsci 13 08118 g015
Figure 16. Al2O3 vs. Y, Nd, Dy, Lu diagrams. (a) Al2O3 vs. Y diagram, (b) Al2O3 vs. Nd diagram, (c) Al2O3 vs. Dy diagram, (d) Al2O3 vs. Lu diagram. Refering intrusion, inner skarn, outer skarn and marble data from appendix tables A2 of Mrozek et al. (2020) [8]. Limestone data from Mrozek et al. (2020) and Paz et al. (2015) [8,58].
Applsci 13 08118 g016
Figure 17. Analysis of major and trace elements present in garnets within the TS-10 profile. (ae) Trend of major elements between inner and outer skarn, (fj) Trend of important trace elements between inner and outer skarn. White background represents outer skarn, while gray background represents inner skarn.
Applsci 13 08118 g017
Figure 18. Andradite end member (And) vs. Ti, Zr, Nb diagrams. (a) And vs. Ti diagram, (b) And vs. Zr diagram, (c) And vs. Nb diagram.
Applsci 13 08118 g018
Table 1. Rare earth content of garnet in outer skarn and inner skarn.
SampleBeltMin (∑REE)Max (∑REE)Avg (∑REE)
TS10-8Inner Skarn10.1434.0217.33
TS10-7Outer Skarn10.7120.7116.29
TS10-626.48220.73117.40
TS10-51.96129.1336.84
TS10-414.3568.5033.36
Disclaimer/Publisher’s Note: The statements, opinions and data contained in all publications are solely those of the individual author(s) and contributor(s) and not of MDPI and/or the editor(s). MDPI and/or the editor(s) disclaim responsibility for any injury to people or property resulting from any ideas, methods, instructions or products referred to in the content.

