Article

Long-Term Durability of Cement-Treated Soil Used in Offshore Airport Island Construction

1
Geotechnical Engineering Department, Port and Airport Research Institute, National Institute of Maritime, Port and Aviation Technology, 3-1-1 Nagase, Yokosuka 2390826, Japan
2
Facility Service, Central Japan International Airport Co., Ltd., 1-1 Centrair, Tokoname 4798703, Japan
*
Author to whom correspondence should be addressed.
Appl. Sci. 2023, 13(14), 8081; https://doi.org/10.3390/app13148081
Submission received: 16 June 2023 / Revised: 5 July 2023 / Accepted: 6 July 2023 / Published: 11 July 2023
(This article belongs to the Special Issue Sustainability in Geotechnics)

Abstract

:
In port and harbour areas, soft soils such as dredged soil can be solidified by mixing them with cement and other solidifiers in a pumping pipe. This method is known as pneumatic flow mixing. In this method, the soil and solidifiers are stirred and mixed using the turbulence effect of the plug flow generated in the pipe. The authors investigate the long-term durability of the treated soil on the artificial island where this method was first fully introduced. This paper summarises the results of five investigations on the island immediately after construction and 4, 10, 15, and 20 years after construction. No reduction in the unconfined compressive strength or needle penetration gradient was observed in the treated soil. Some degradation was observed at the top and bottom exposed surfaces of the treated soil, similar to that of soil subjected to other treatments. In addition to needle penetration and chemical tests, elemental mapping using an electron beam microanalysis was performed to determine the degree of degradation. The depth of degradation 20 years after construction was 18–25 mm. Although the amount of cement added in the pneumatic flow mixing method was relatively small, this value was within the range of degradation depths over time investigated in previous studies and did not represent a significant degradation.

1. Introduction

When building civil engineering structures, soft soils are often improved using cement or other solidifiers to increase their stiffness and strength. It is also important to ensure that there is no impact to the environment, as an elevated pore water pH and leaching of hexavalent chromium have been noted in the immediate vicinity of cement-treated soil. In port and harbour areas, in addition to the deep mixing method, in which solidifiers are stirred and mixed into soft subsoil, lightweight mixing methods, in which solidifiers are mixed into soil collected from the field, are used effectively [1]. In the pneumatic flow mixing method, solidifiers are also added to the dredged soft soil in the pumping pipe, where they are pumped by a pneumatic pumping vessel using a dredger, and the dredged soil and solidifier are stirred and mixed using the turbulent effect of the plug flow generated in the pumping pipe [2]. The applications of treated soil include reclamation material, backfill material behind seawalls, and temporary embankments to demarcate reclaimed lands. It is also used directly behind quay walls to reduce the earth pressure and prevent liquefaction. This method was tested at the Port of Nagoya in Japan in 1998 and subsequently used extensively in the reclamation of airport islands at Central Japan International Airport and Tokyo International Airport. This method can continuously improve the quantities of soft soil; thus, it can effectively use large stockpiles of dredged soil in port areas and assist in rapidly constructing large-scale reclamation works such as airport islands. The use of dredged soil rather than soil transported from mountains in the pneumatic flow mixing method contributes to sustainability. Ground improvement with a little cement is also useful in terms of reducing carbon dioxide emissions. In recent years, this method has been adopted in coastal construction projects not only in Japan, but also in North America and other parts of Asia, and its use is progressing worldwide [3].
Cement treatment methods are useful because they can significantly improve the physical properties of soft soils in the short term. However, treated soils deteriorate in the long term, starting from the exposed surface [4,5,6,7,8,9,10,11,12,13]. The pneumatic flow mixing method is no exception; the surface of the treated soil exposed to the untreated soil deteriorates, albeit slowly. The deep mixing method, which was developed in the 1970s as a pioneering solidification method, requires a large amount of cement, and the strength of the treated soil is high, at 1500 kN/m2 or more (when solidifying clayey soil). Even after 50 years, no problematic deterioration has occurred in the field. In contrast, in the pneumatic flow mixing method, the mixing of soil and cement occurs via a plug flow in the pumping pipe, and the strength of the treated soil is not very high, ranging from 100 to 500 kN/m2. In addition, this method has only been applied onsite for approximately 20 years, and there is no track record regarding its degradation characteristics. Therefore, it is important to understand the degree of deterioration from the perspective of the long-term service of structures. If geomaterials in civil engineering structures do not deteriorate, do not require energy or materials for repair, and can remain in service, they can offer many environmental, social, and economic benefits and consequently increase sustainability. Therefore, the condition of the treated soil should be continuously checked, and its long-term durability should be considered.
The authors investigate the long-term durability of cement-treated soil on an artificial island of Central Japan International Airport, where the pneumatic flow mixing method was first fully introduced. This paper summarises the results of four investigations [14,15,16], including those conducted at the time of reclamation (2002), and four (2006), ten (2012), and fifteen (2017) years after the reclamation, as well as the results of a detailed investigation in the 20th year (2022). In 2022, in addition to the strength properties of the treated soil, the degradation characteristics near the surfaces exposed to the untreated soil were also investigated. Needle penetration tests, chemical tests, and surface analyses (elemental mapping) using an electron beam microanalysis (EPMA) were implemented to determine the degree of degradation near the exposed surfaces.

2. Pneumatic Flow Mixing Method and Construction of Airport Island

2.1. Overview of Pneumatic Flow Mixing Method

The pneumatic flow mixing method is a solidification method in which soil is solidified by chemical treatment to increase its shear strength and improve its compressibility, liquefaction resistance, and impermeability. Solidification methods can be divided into those that solidify the ground in situ and those that mix a chemical stabiliser (solidifier) with the soil as a pretreatment for backfill or reclamation materials; the pneumatic flow mixing method is classified as the latter. In this method, the soil and solidifier are stirred and mixed in a pumping pipe. This allows the equipment to be simplified, with a solidifier-adding device connected to the existing pneumatic pumping equipment. There are two methods for adding solidifiers to the pumping pipe: the ‘pumping system’, in which solidifiers are added before compressed air is injected, and the ‘line system’, in which solidifiers are added after compressed air is injected (Figure 1). Depending on the properties of the solidifier, the addition method can be classified as the ‘slurry method’ or the ‘powder method’.
When attempting to pump only soil in a pumping pipe, friction with the pipe wall causes a large pressure reduction and the pressure in the pipe is high, making pumping difficult. Pneumatic pumping is a technology in which compressed air is continuously injected into a pumping pipe to generate a multiphase flow of dredged soil and air to transport the dredged soil to the outlet. Figure 2 shows an image of pneumatic pumping and kneading. In the multiphase flow generated by the compressed air injection, the dredged soil is broken up and forms a plug. During pumping, this plug of dredged soil constantly changes shape owing to friction with the pipe wall and intermittently collapses and reforms. The pneumatic flow mixing method utilises this change in plug shape to mix the dredged soil and solidifier. The pneumatic flow mixing method has been applied to cohesive soils with sand and gravel contents of 50% or less. This method uses pneumatic pumping; thus, clayey soils with sand and gravel contents of less than 30% and water contents of 90–110% (approximately 1.3–1.5 times the liquid limit) are the most suitable.
Soil is not mechanically stirred in the pneumatic flow mixing method; thus, there is concern regarding variations in the strength of the treated soil. It is a common practice to allow for a certain degree of heterogeneity in treated soil based on experience, including the results of field trials. The strength of the soil treated by the pneumatic flow mixing method is set by assuming that the strength in the field follows a normal distribution and considering the variability and failure rate. The failure rate is defined as the percentage of the unconfined compressive strength of the in situ-treated soil that is below the design strength. The failure rate should be set according to the intended use of the treated soil; however, it is generally set at 25%. The actual amount of solidifier added is determined based on the results of laboratory mixing tests, considering the quality required by the design and the need to ensure fluidity during pumping. Variations in the strength of the in situ-treated soil and its ratio to the laboratory mix strength (strength ratio) are also considered. If the strength variation and strength ratio of the in situ-treated soil are not determined by field trails, a coefficient of variation of 0.35 and a strength ratio of 0.5 are used as guides when the amount of solidifier added is approximately 50–100 kg/m3, based on past performance data. When treated soil is used as a landfill material, the amount of solidifier added is usually approximately 50–70 kg/m3 and the design strength is often set at 100–200 kN/m2. For a more detailed description of the pneumatic flow mixing method, please refer to [2].

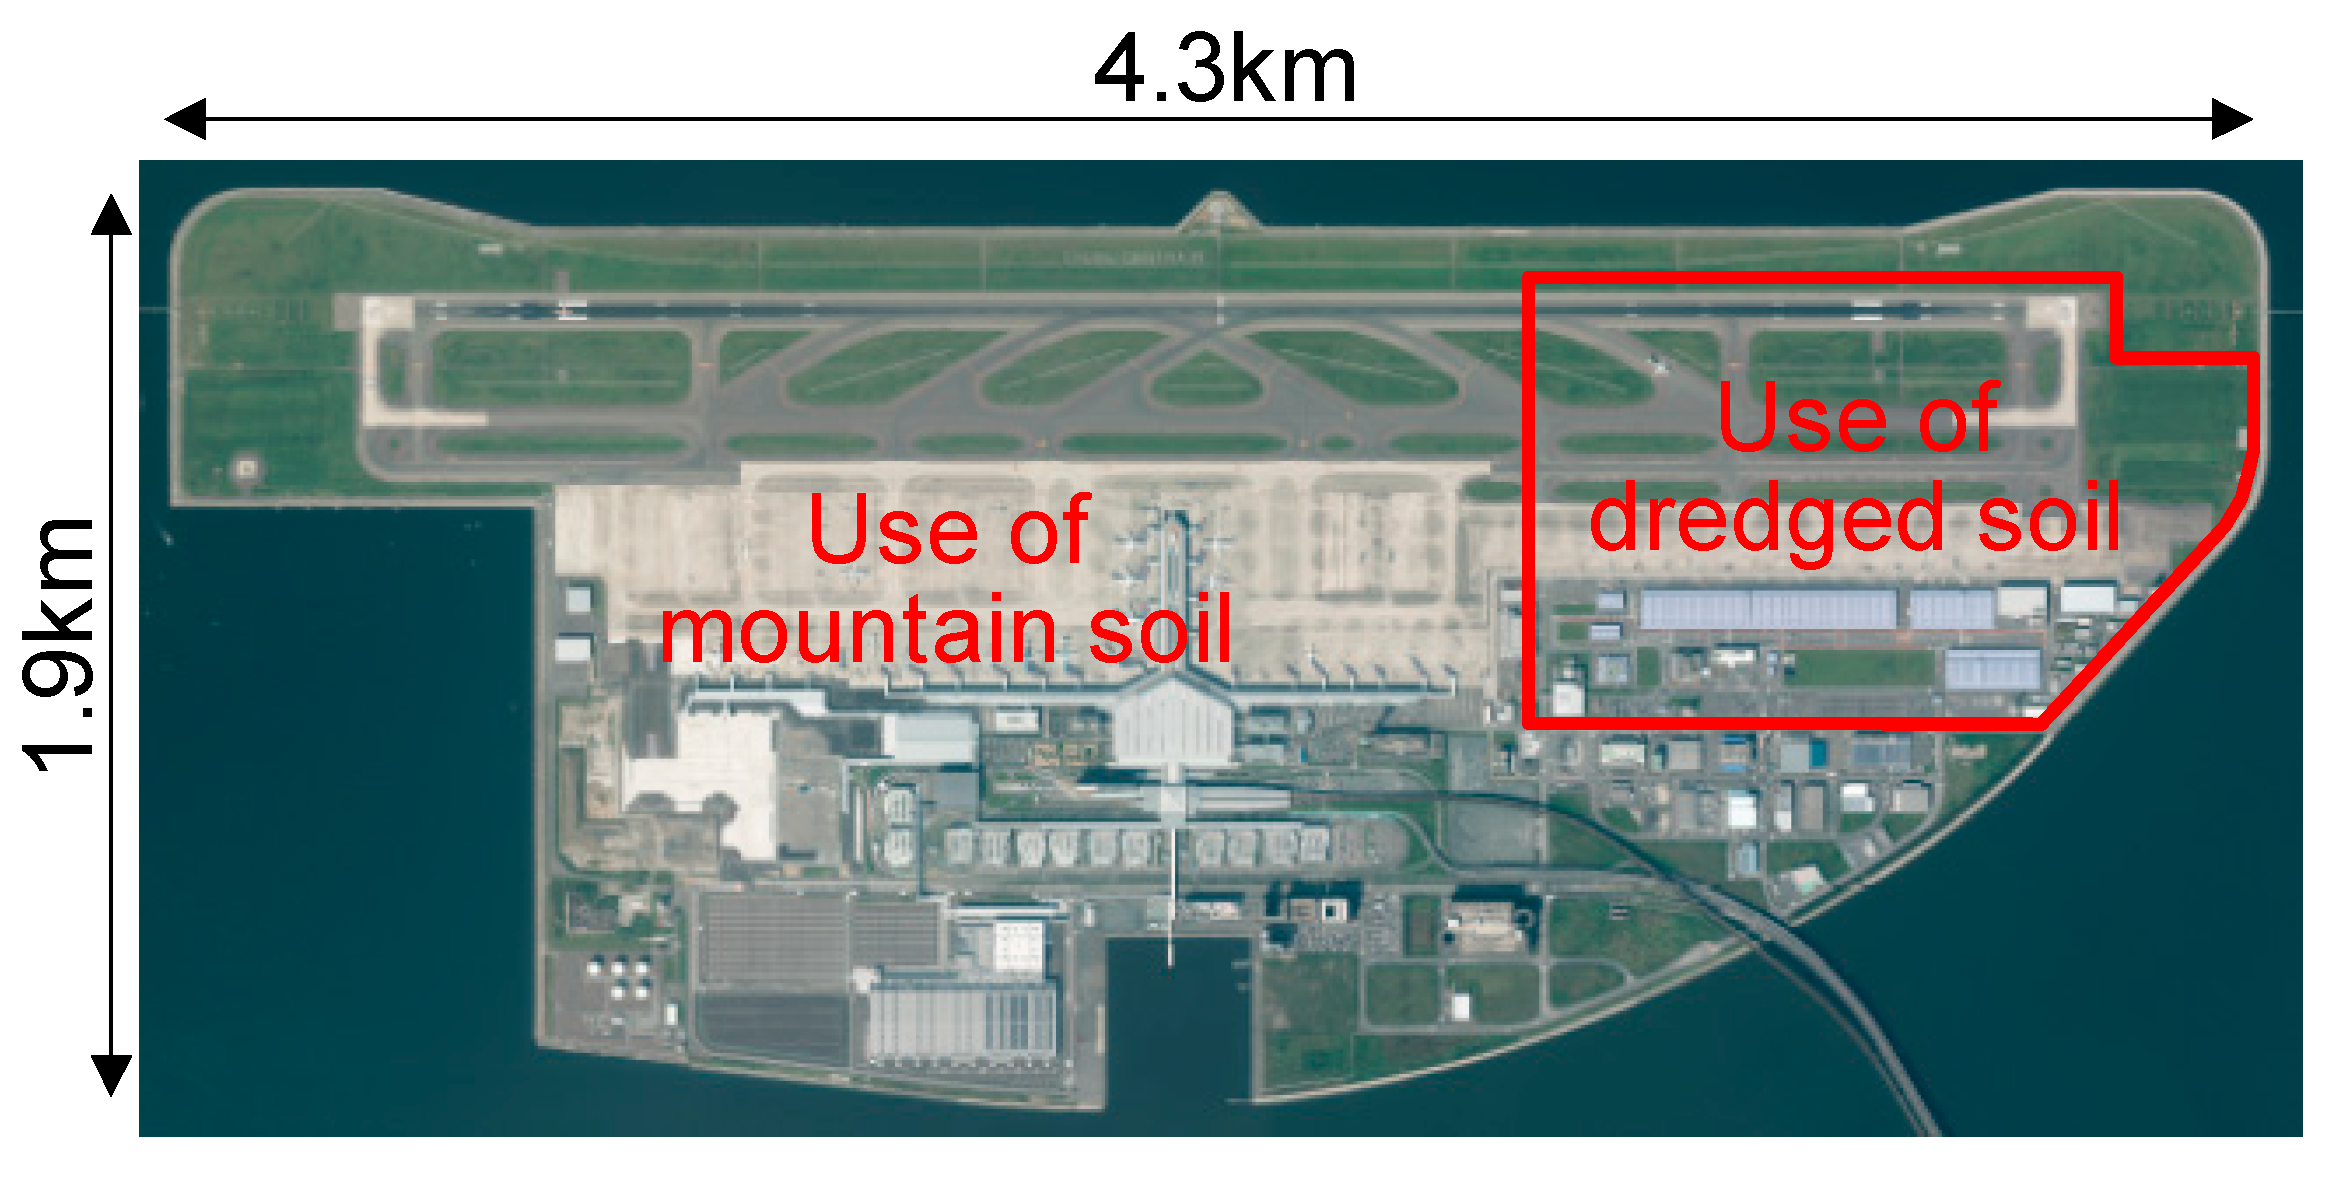
2.2. Construction Work on Airport Island

The area around the city of Nagoya in Japan has a population of 20 million and a thriving automobile and other industries, and a full-fledged international hub airport was desired for both passenger and cargo traffic. The airport is the fourth largest international hub airport after the international airports in Tokyo and Osaka (Haneda, Narita, and Kansai International Airports), and was constructed over a five-year period from 2000 to 2005. Central Japan International Airport (nicknamed Centrair, IATA airport code: NGO) was built as an artificial island 2–3 km off the coast of Tokoname City, Aichi Prefecture. In this area, relatively shallow water (less than 7 m in depth) extends 3–5 km offshore. Although the island construction area includes an alluvial clay layer with a maximum thickness of 20 m, the thickness of this layer is less than 5 m in most areas, and the Tokoname Formation, which has an N value of more than 50 and can be regarded as a good bearing stratum, exists below the alluvial clay layer. By improving the alluvial clay layer using the sand drain method, which is a type of vertical drain method, it was possible to reduce the residual settlement to a few centimetres at the time of the airport opening.
Of the approximately 5,800,000 m2 of the airport island, 4,700,000 m2 is used for the airport, which required approximately 52,000,000 m3 of reclaimed soil to create. Approximately 10,000,000 m3 of dredged soil from the nearby Port of Nagoya was effectively utilised (Figure 3). The physical properties of the dredged soil used in the project were as follows: soil particle density 2.68–2.72 g/cm3, sand and gravel contents 2–18%, fine grain contents 82–98%, liquid limit 55–88%, and ignition loss 5.3–7.8%. It was difficult to promote consolidation at a low cost after reclamation and to put it into service early in the short construction period; therefore, the pneumatic flow mixing method was applied. Some of the basic facilities of the airport are located on the ground formed by the treated soil. Thus, the design strength of the treated soil was set based on the condition that it had the strength required for the subgrade of a roadbed and would not settle under consolidation. Specifically, based on the relationships between the unconfined compressive strength, CBR value, and consolidation yield stress, which were determined in advance by laboratory tests, the design strength was set to satisfy the CBR value based on the Japanese airport pavement structural design guidelines, and to ensure that no consolidation yield stress occurred at the bottom of the improved soil. The design strength was 120 kN/m2. The failure rate, coefficient of variation, and strength ratio were set as 25%, 0.35, and 0.5, respectively. The calculated average in situ strength was 157 kN/m2. The construction of the Central Japan International Airport is described in detail in [17,18,19], and the reader can refer to these works for further details.

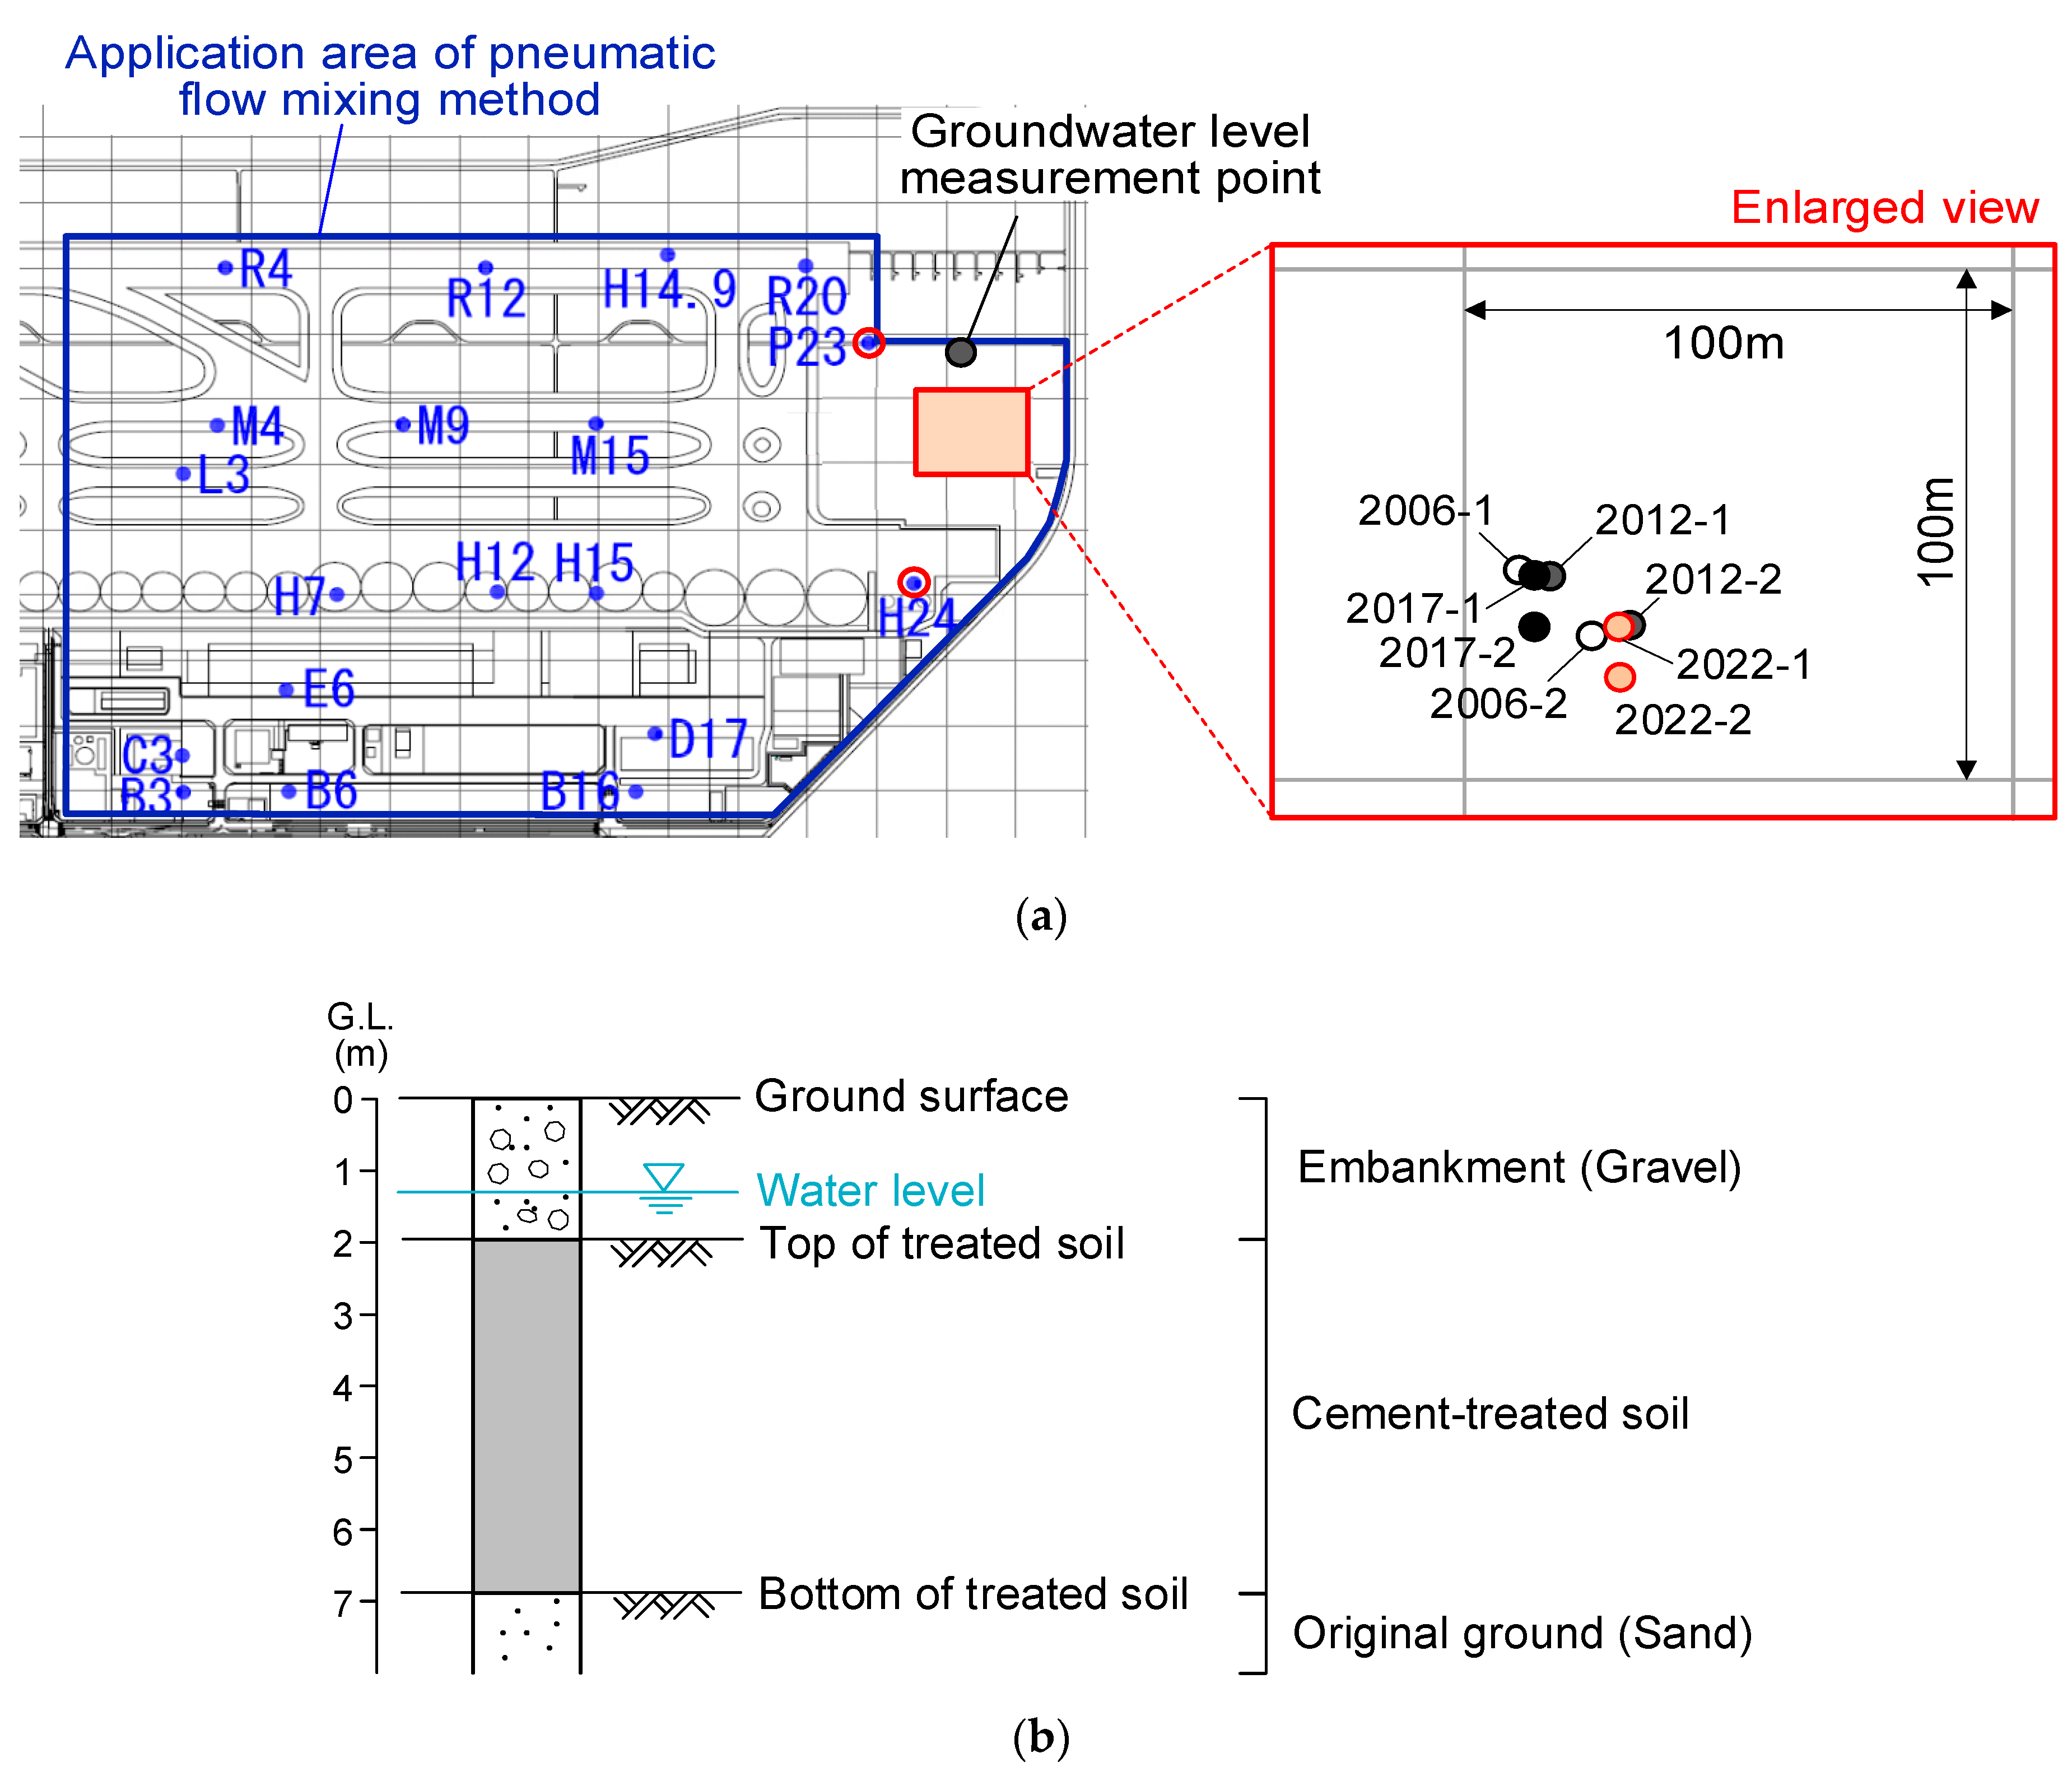
3. Survey Locations and Methods

Five borehole investigations (with 25 boreholes drilled immediately after the reclamation and two drilled in each of the other investigations) were conducted on the improved ground over a period of 20 years (2002, 2006, 2012, 2017, and 2022). A planar survey location map and a schematic of the columnar sections are presented in Figure 4. In 2002, the airport was not in service, which made it possible to survey a wide area. After the airport was put into service, the survey locations were limited owing to the operational constraints of the airport, and the survey locations after 2006 were different from those immediately after the reclamation was completed. The location was an unpaved area adjacent to a taxiway. As shown in the sampling columnar sections, the lower part of the treated soil produced by the pneumatic flow mixing method consisted of fine-to-medium-grained sands, whereas the upper part was a reclaimed soil layer consisting of sand and gravel mixed with cobbles. Although the elevation varied slightly depending on the borehole drilled, the treated soil lay at a depth of approximately 2–7 m, which was below the residual water level (at a depth of approximately 1.4 m). The residual water level is higher than that of the treated soil; thus, it can be said to be in a non-drying condition.
Specimens were collected at each site using double-tube samplers with built-in sleeves and triple samplers at the boundary between the overburden (sand and gravel) layer and treated soil. Examples of the bores and treated soil samples are shown in Figure 5. As shown in the photograph, the sampling caused cracks at several positions, but the number of cracks was small enough to ensure that a 132 mm specimen was obtained for the unconfined compression test. The laboratory tests for the sampled soil are listed in Table 1. Continued tests included water content and wet density tests, as well as unconfined compression tests, with two–three test specimens per metre of sample being taken for compression testing. Needle penetration tests were also conducted up to 2012 on the cut surface inside the treated soil and in 2017 and 2022 on the nearby treated soil exposed to the untreated soil. In addition, chemical tests and areal analyses (elemental mapping) using EPMA were implemented. The location maps of the tests are shown in Figure 6. Groundwater samples were collected in 2012, and chloride ion concentrations were measured using ion chromatography.
Unconfined compression and needle penetration tests were conducted according to the Japanese Geotechnical Society Standards [20,21]. The purpose of these tests was to investigate the continuous changes in strength (strength development and reduction). The specimens used for the unconfined compression tests were approximately 66 mm (diameter) × 132 mm (height). The treated soil samples were hard and difficult to shape into the standard 50 mm diameter for compaction tests; thus, the diameter was taken as sampled (approximately 66 mm), and the height was twice that. In surveys up to 2012, no signs of strength reductions were observed in the treated soil, whereas in the 2017 and 2022 surveys, needle penetration tests were conducted against the surface exposed to the untreated soil. It was difficult to determine the exact exposure surface for the treated soil sampled in the field; however, after lightly removing the surface sand and gravel with a finger, the surface that seemed to be solidified was considered the exposure surface. In some samples, gravel was embedded in the exposed surface of the treated soil and needle penetration tests were conducted on the surface after removing this gravel. Two types of needle penetration tests were conducted near an exposure surface: one in which the needle penetrated the exposure surface perpendicularly and the other in which the needle penetrated the sample from the side at several depths. In the former method, the penetration resistance can be continuously determined from the exposed surface; however, the measurable depth is limited. With the latter method, there is no limit to the depth at which the penetration resistance can be measured; however, the data are discrete in the depth direction. In the 2022 survey, the latter method was also utilised because the former method did not provide a clear degradation depth.
For chemical analyses, soil suspensions were prepared and analysed according to the Japanese Geotechnical Society Standards [22,23]. The four measurement parameters were the pH, calcium ion concentration, sodium ion concentration, and electrical conductivity, which were determined using Horiba compact instruments. The pH and calcium ion concentration decreases with the progressive degradation of the treated soil, and the electrical conductivity decreases accordingly. According to a previous study [13], there is a correlation between these parameters, and chemical analyses were performed to determine the signs of deterioration. The test locations are shown in Figure 7. In the 2017 survey, only one measurement was made near each end of the borehole, whereas in the 2022 survey, the specimen was divided into smaller sections from the exposure surface and analysed. However, the upper and lower ends of core 2022-2 (especially the upper end) contained large amounts of gravel, were brittle, and collapsed during cutting. Therefore, the soil was analysed in batches of a few centimetres.
In the 2022 survey, an EPMA of the surface (elemental mapping) was implemented on samples near the exposed surface. This type of analysis provides a more detailed picture of the calcium concentration, and EPMAs have been used in the concrete engineering field to investigate calcium excursions and determine the state of neutralisation. Calcium, magnesium, silicon, and aluminium were measured. The specimens for photography were cut with a saw, freeze- or vacuum-dried, and then hardened with resin. After dry-polishing, carbon was deposited to provide a surface with conductivity for surface analyses. The instrument used for the analysis was an electron microanalyser manufactured by JEOL. The following settings were used: an acceleration voltage of 15 kV, a sample current of 50 nA, a measurement time of 40 ms/pixel, a beam diameter of 50 μm, and a pixel size of 100 × 100 μm. The concentration was calculated as a mass percentage using the proportionality method based on the X-ray intensity of a standard sample. It should be noted that the upper part of core 2022-2 was brittle, and cutting it did not allow the sampling of the treated soil in blocks; therefore, EPMA imaging could not be performed for that part.

4. Long-Term Properties of the Interior of Cement-Treated Soil

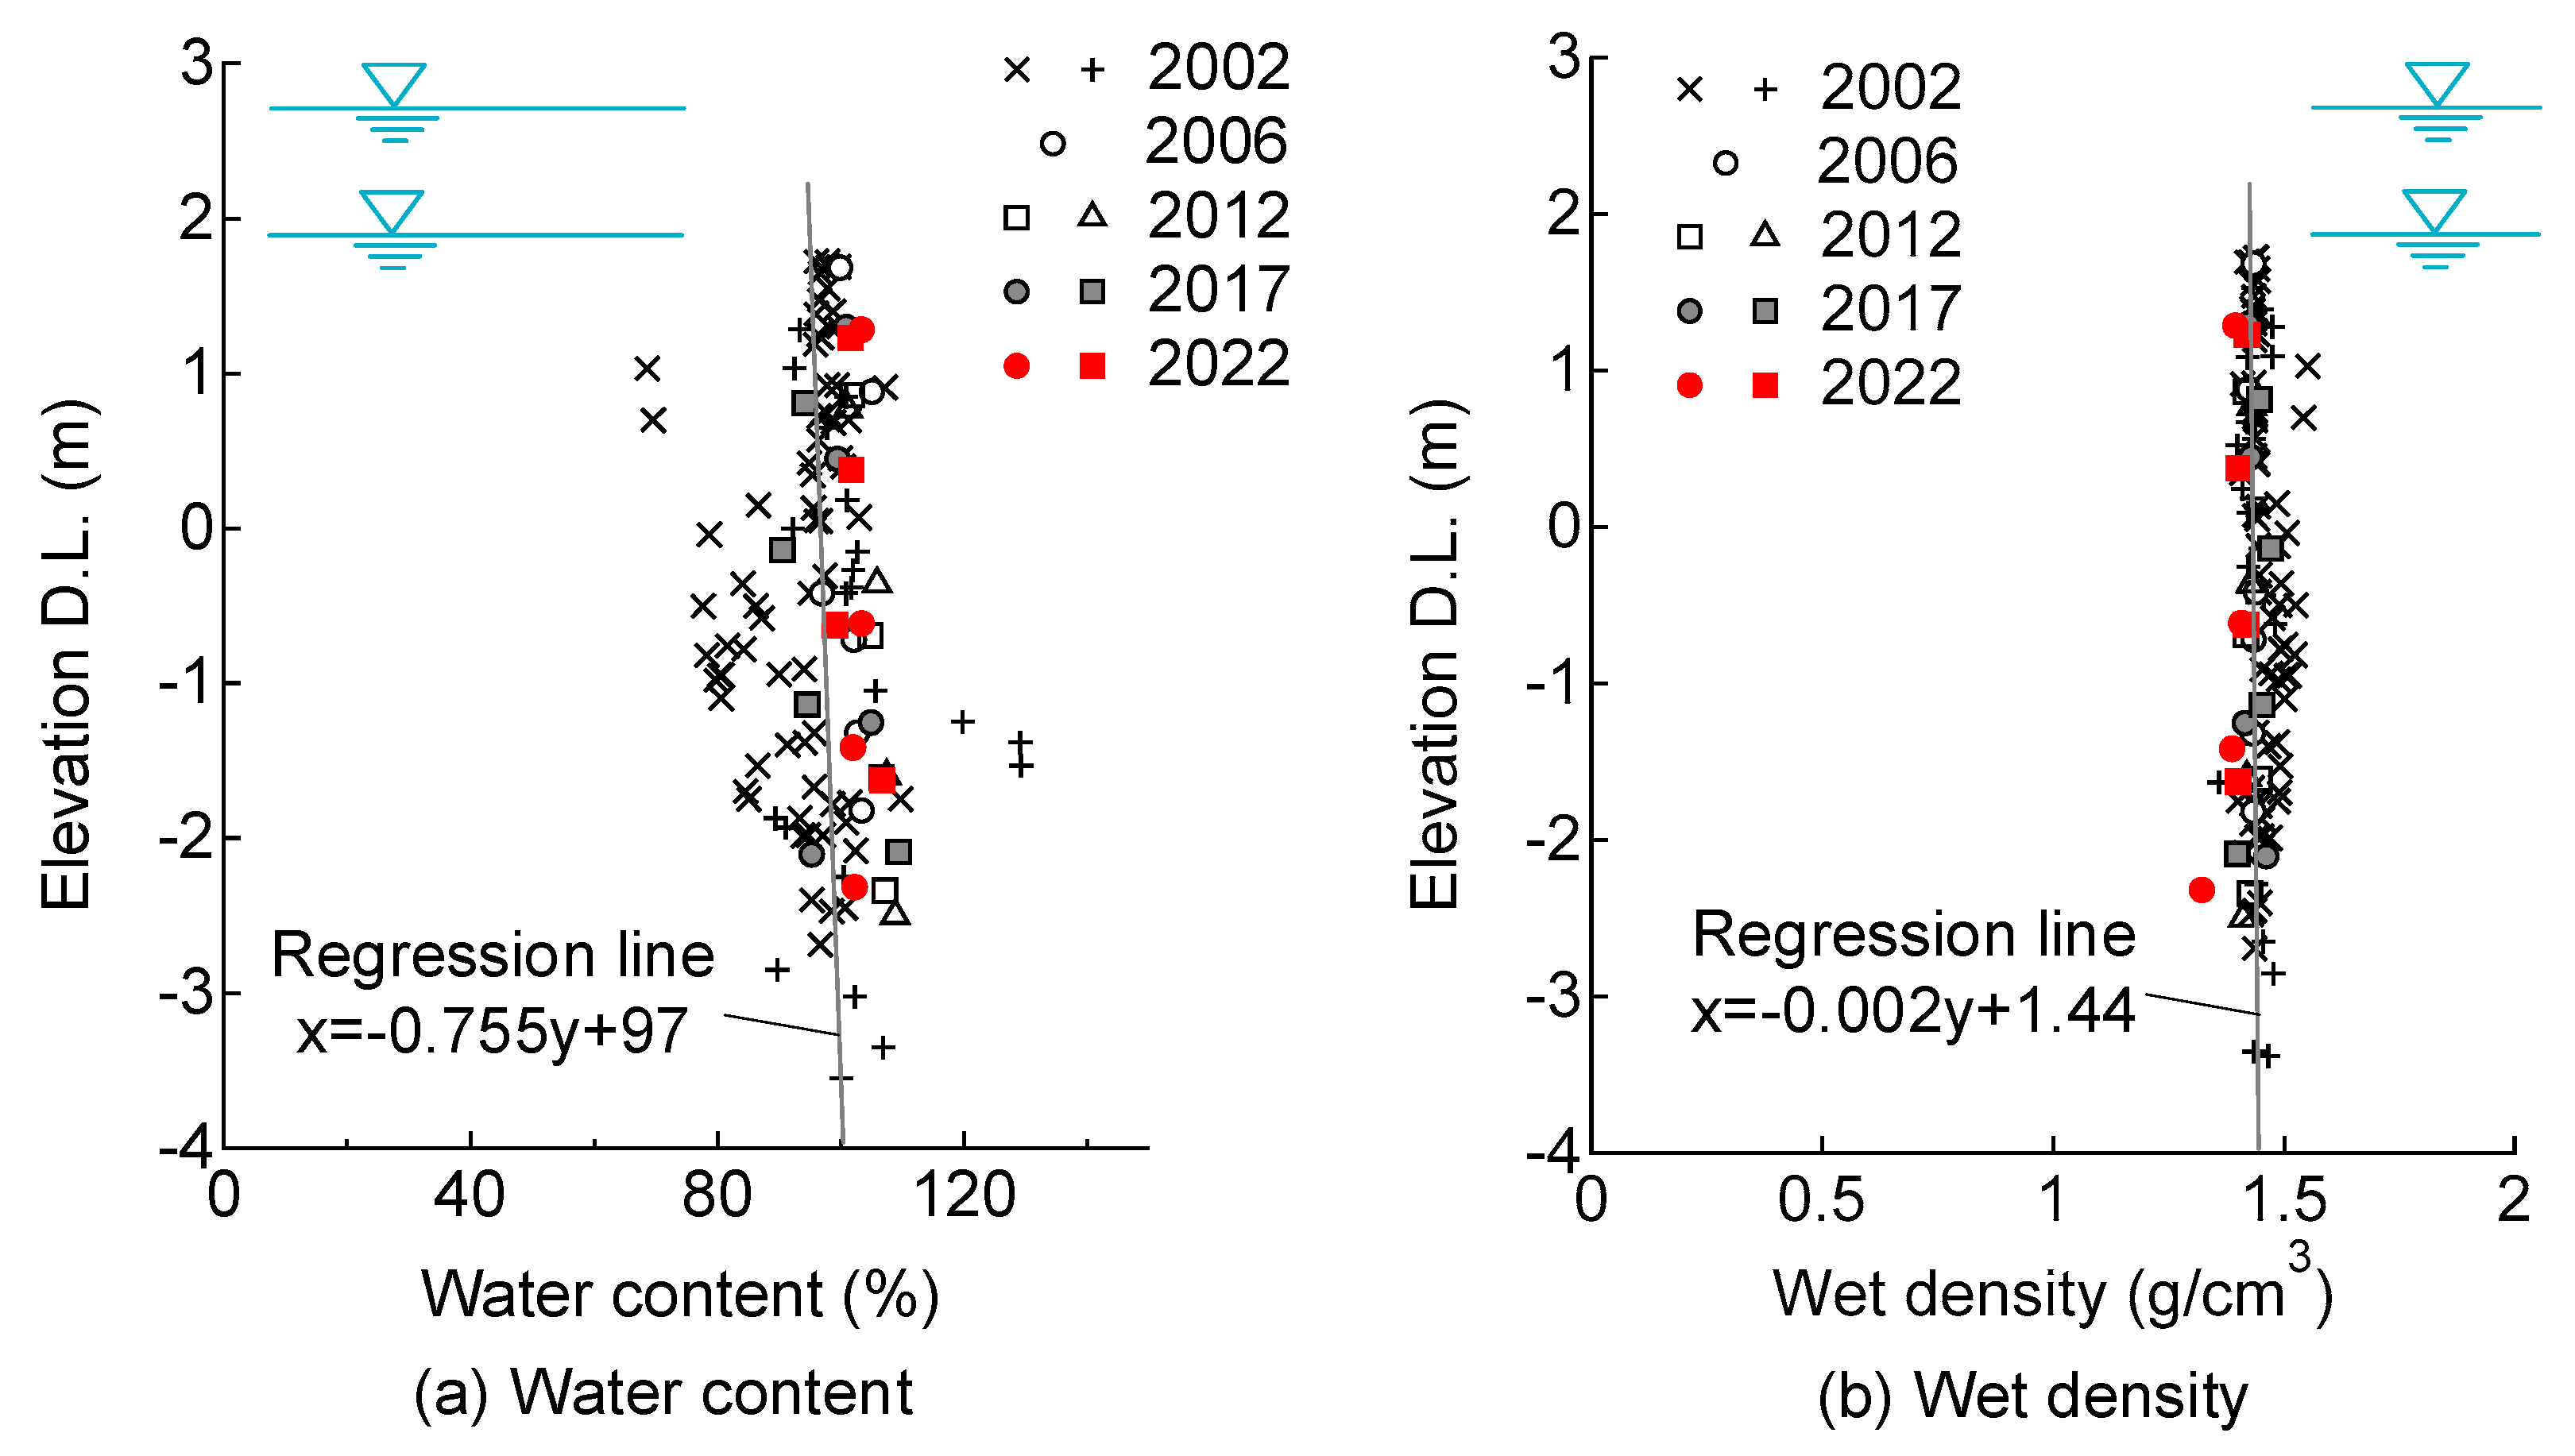
4.1. Groundwater, Water Content, and Wet Density of Soil

The groundwater level was higher than the top of the treated soil, which was submerged in water. Groundwater was collected from the borehole, and the chloride ion concentration was examined. The results indicated that the chloride ion concentration was 98 mg/L. The chloride ion concentration in seawater is generally approximately 19,000 mg/L. Thus, the measured groundwater concentration was considerably lower than that of typical seawater. The groundwater characteristics were different from those of seawater, although the artificial island was located offshore, and the seawall was as close as 150 m. Previous studies [4,8,10,12] have shown that treated soil deteriorates faster when exposed to seawater. Thus, these test results indicated a favourable subsurface environment in terms of the long-term durability of the treated soil.
Figure 8 shows the distributions of the water content and wet density in the depth direction. As a result of the large number of test results immediately after reclamation, only the results for samples collected at sites P23 and H24 are shown, because these sites were close to the survey locations used since 2006. The figures show the changes in groundwater levels (highest and lowest values) measured between April 2011 and January 2012, together with the regression lines of the water content ratio and wet density against the depth. The water content ratio immediately after reclamation had little variation for depths shallower than 1.1 m, but for depths deeper than 1.1 m, the variation was in the range of 70–110%. The water level in the embankment at the time of reclamation was at a depth of 1.1 m, and it is possible that the water content ratio varied because the soil was cast into the water at depths deeper than this. Uniform values were obtained at depths shallower than 1.1 m, where casting was implemented in air, and the quality control in the field was considered successful to a certain extent. The difference in water content in the depth direction was slightly higher at deeper depths; however, this difference was not significant. The wet density of the samples was approximately 1.44 g/cm3, with little variation and almost no difference in the depth direction. These results show that the properties of the improved soil were uniform and stable, with no differences between the investigations conducted in different years.

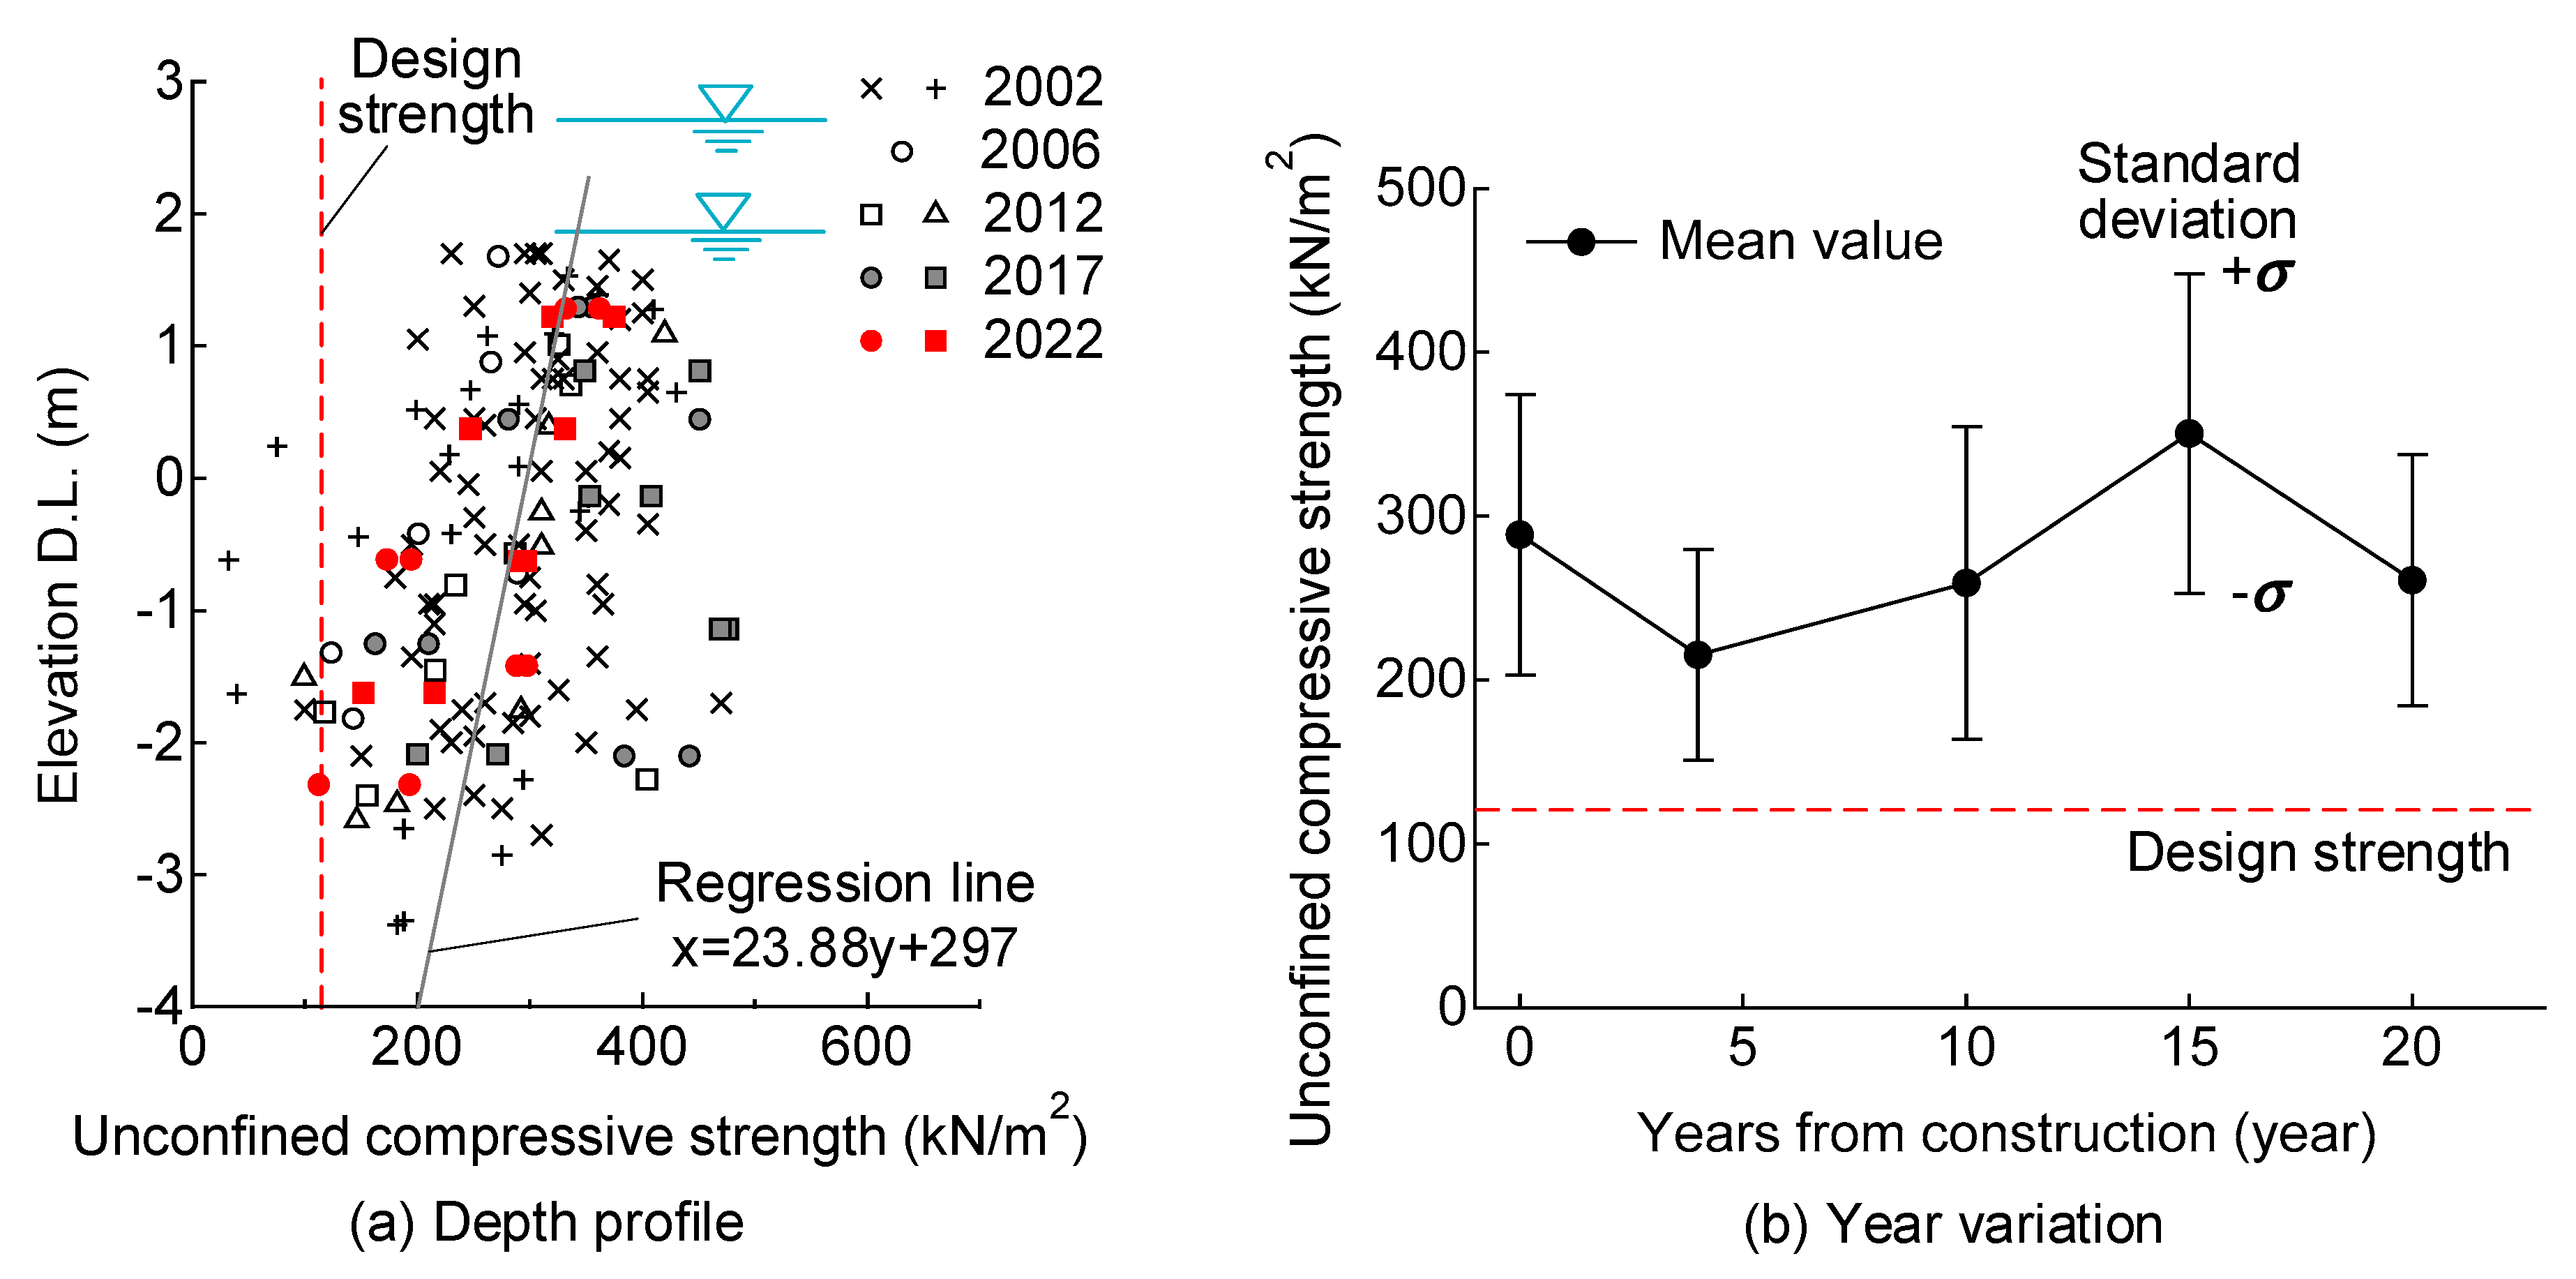
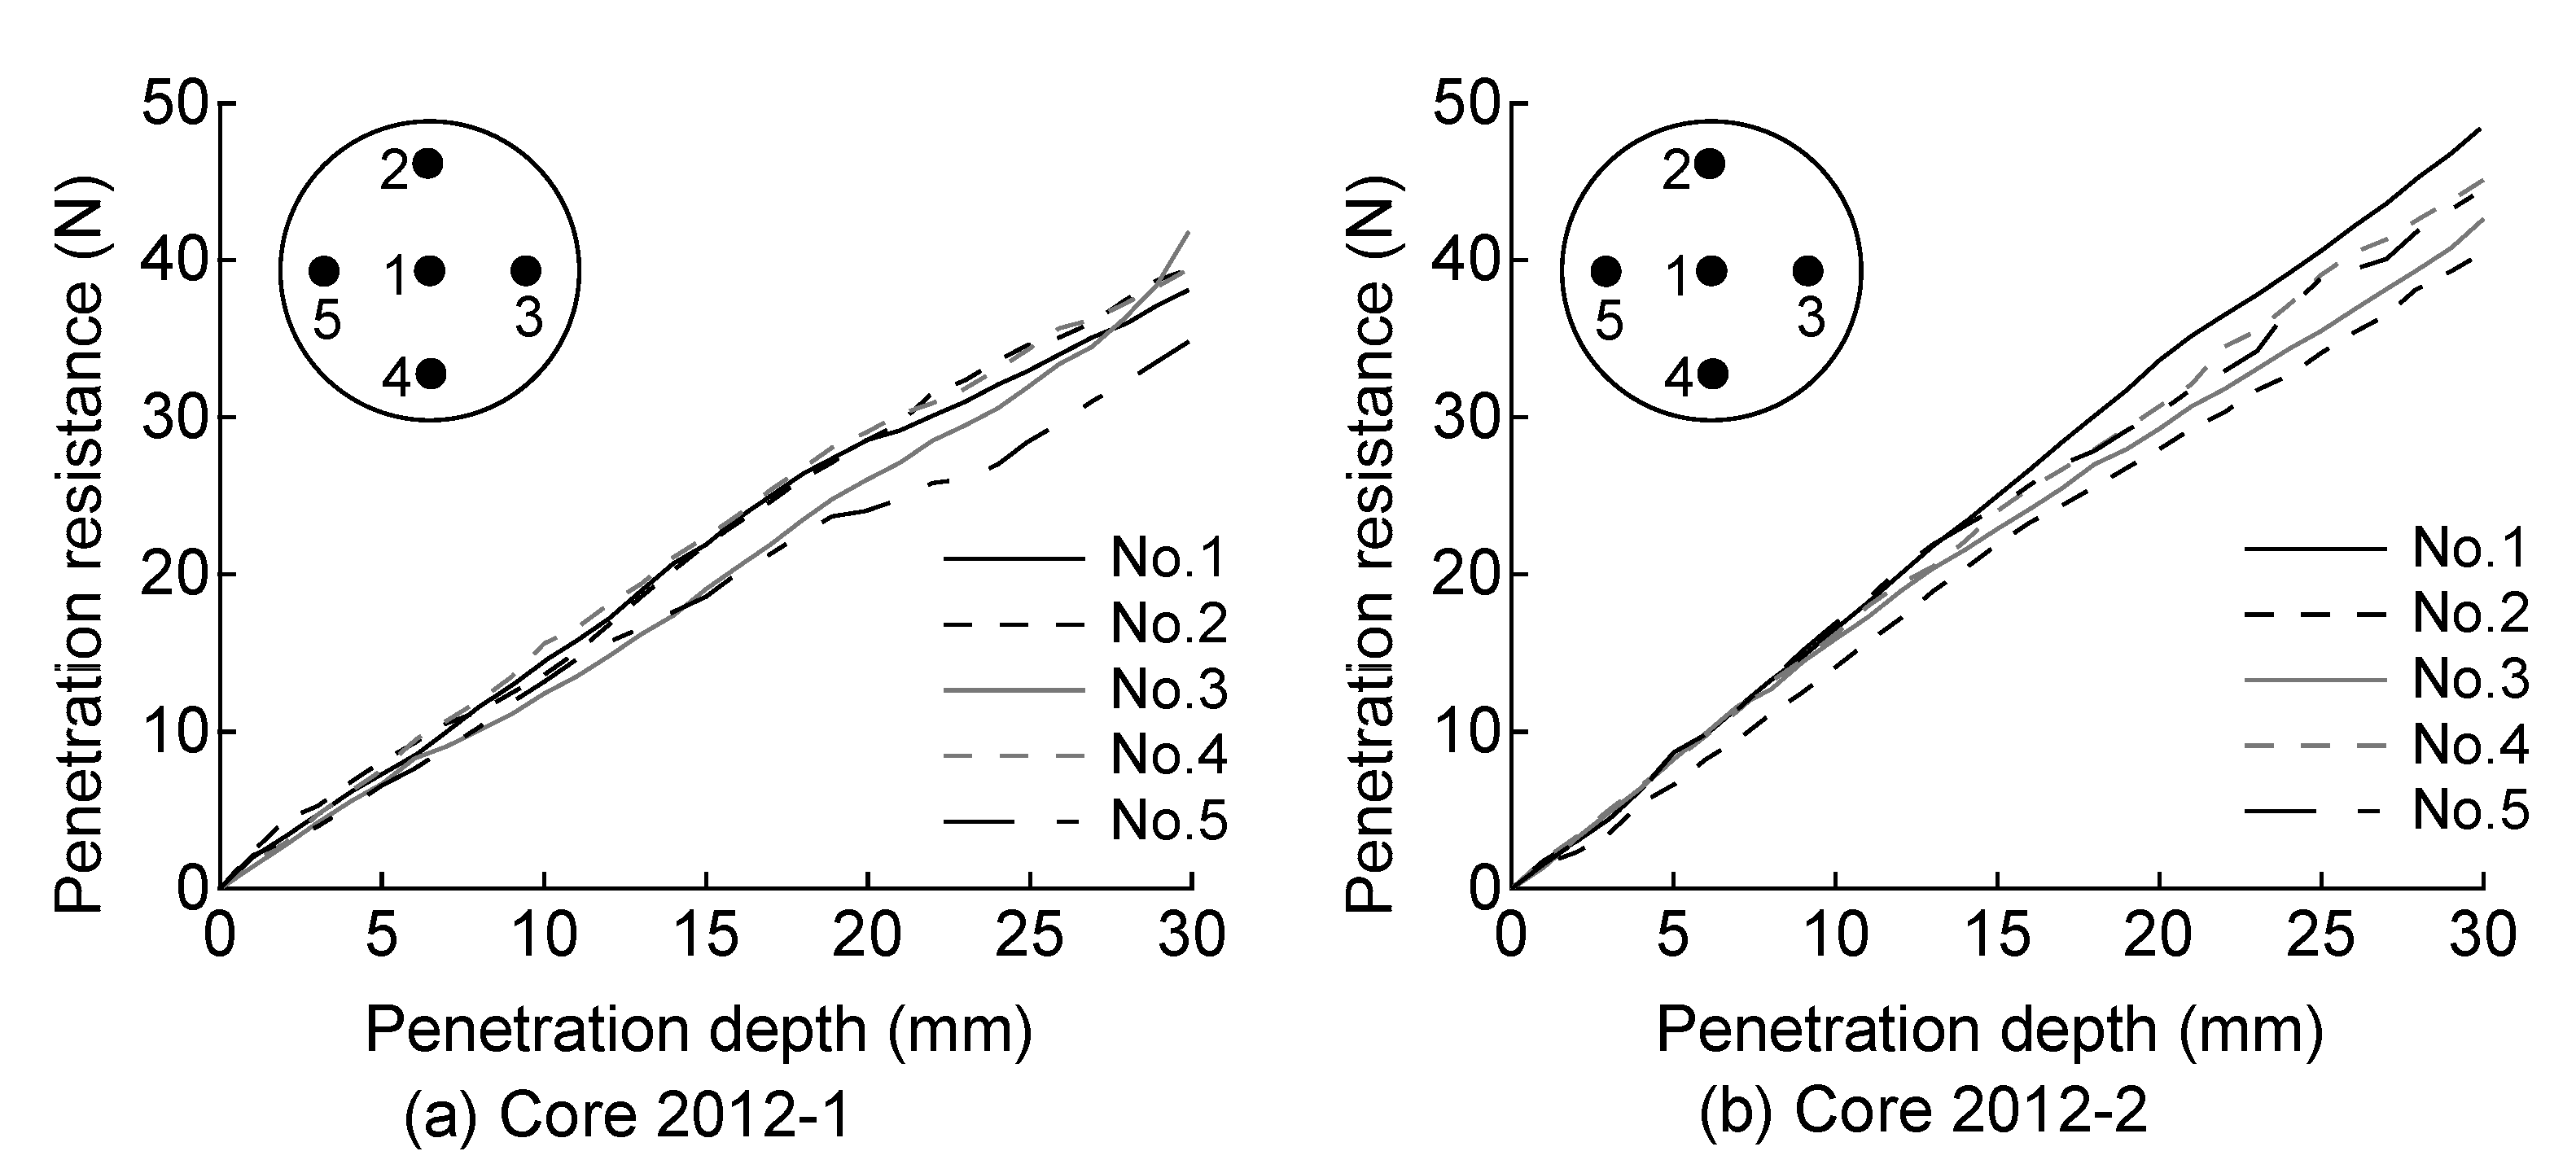
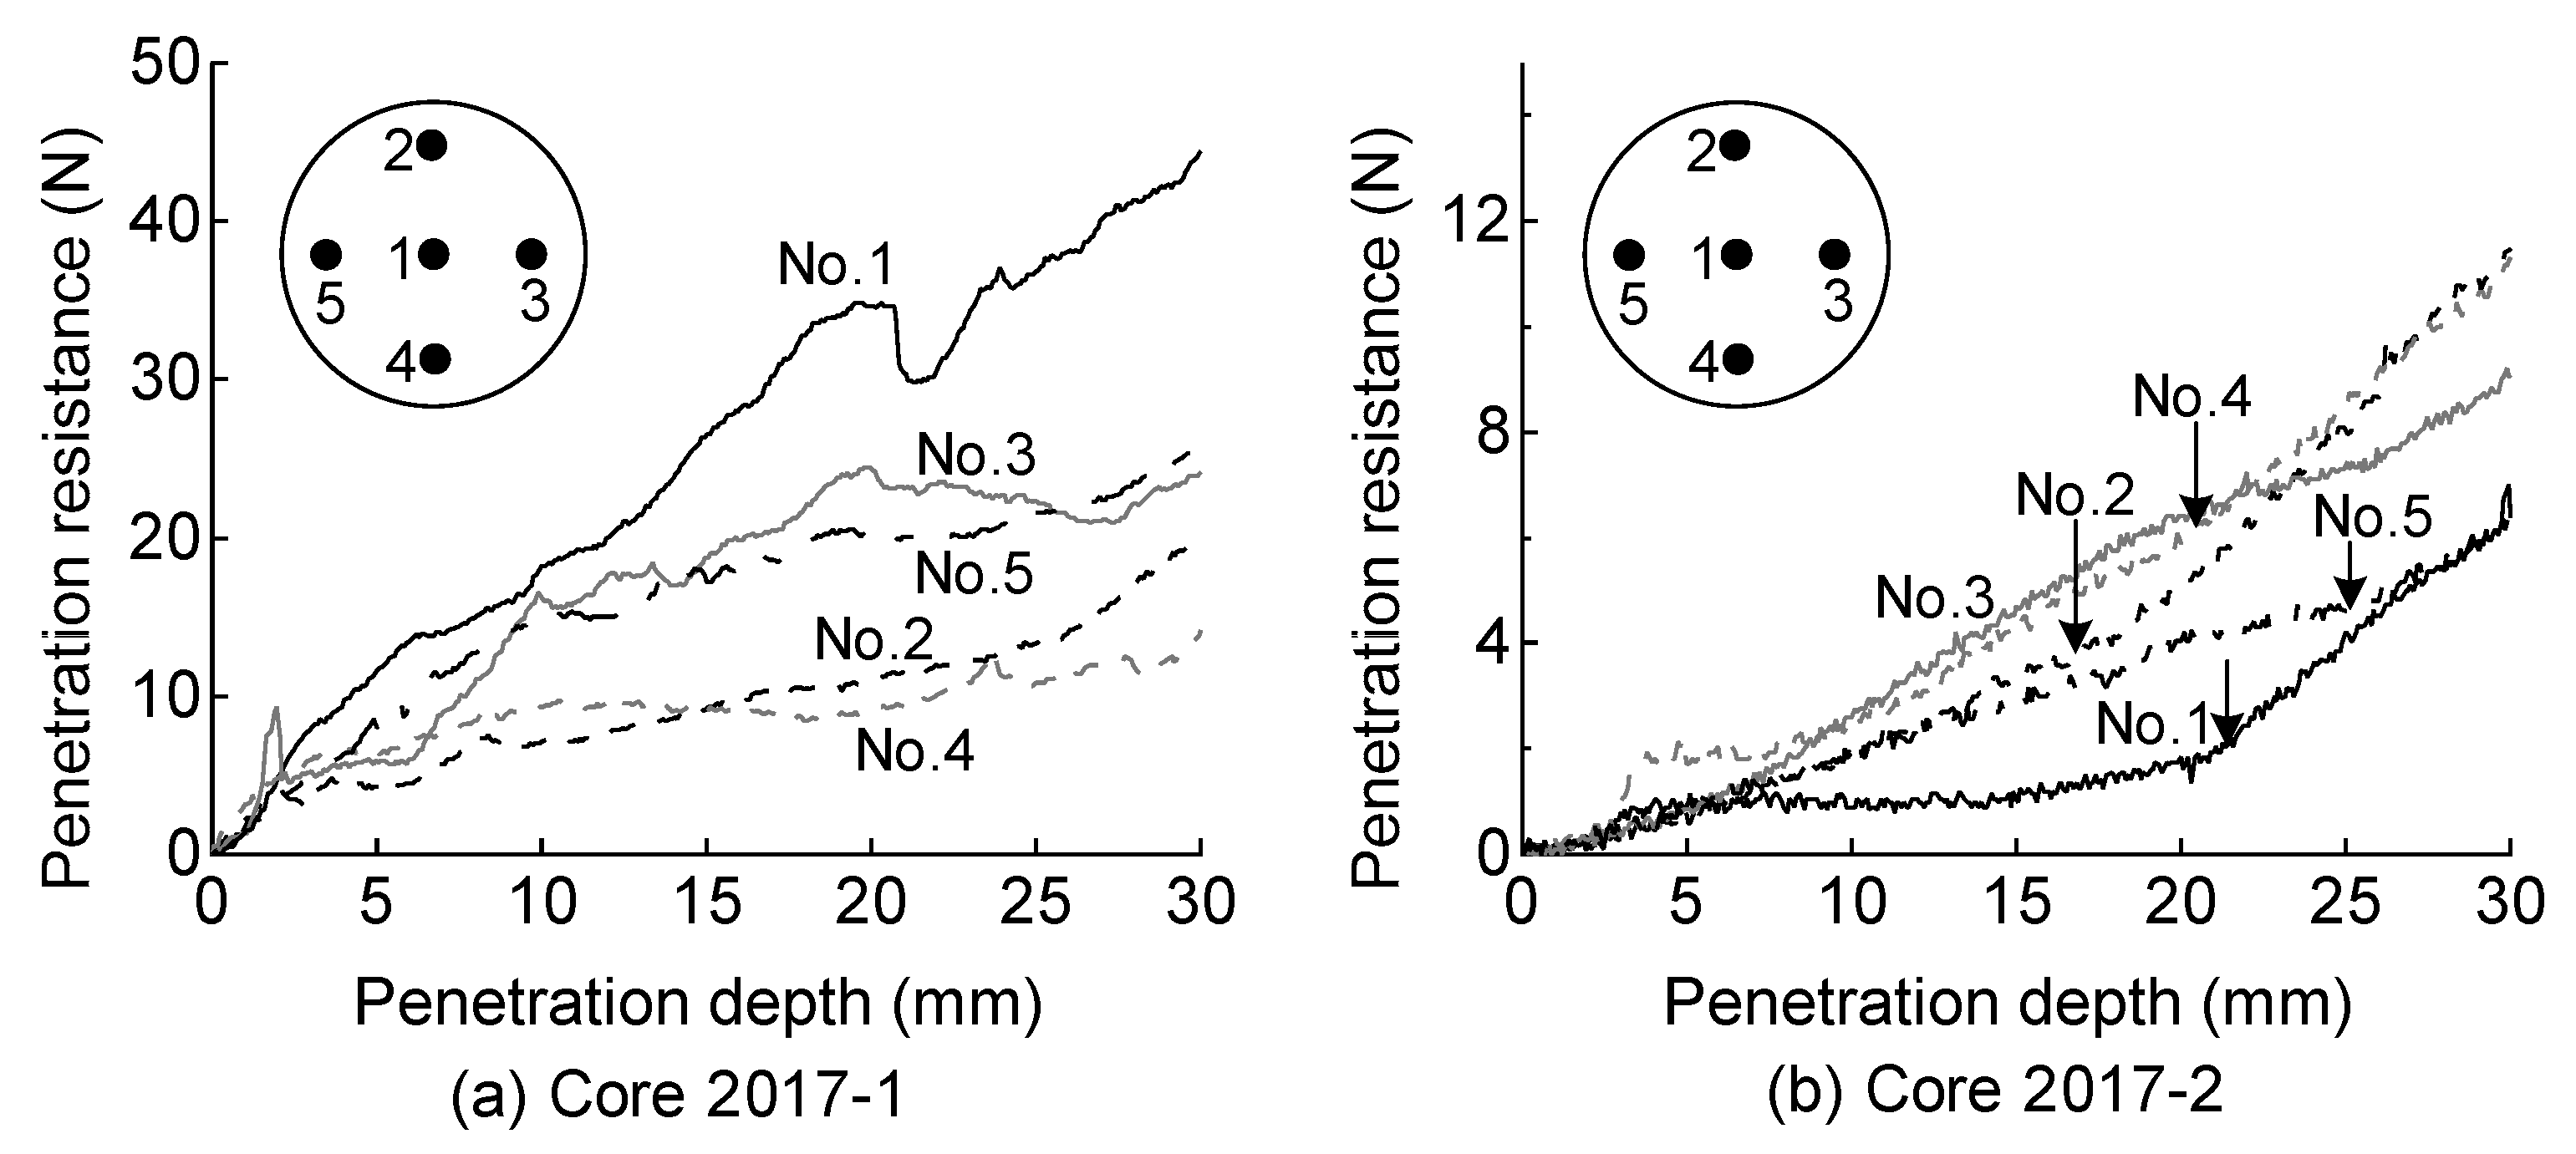
4.2. Unconfined Compressive Strength and Needle Penetration Resistance

The distributions of the unconfined compressive strength of the treated soil in the depth direction obtained from the five surveys are shown in Figure 9, along with the mean variation over time. For the 2002 survey, only the results for the samples collected at sites P23 and H24 are shown. Figure 9a shows that although the results varied, they were generally distributed in the range of 100–500 kN/m2, with most of the data exceeding the design strength of 120 kN/m2. The average value of the variation was also higher than the average value of 157 kN/m2 estimated at the time of the design. The figure shows the regression line of the unconfined compressive strength in relation to the depth. According to the regression line, the strength tended to decrease with an increase in depth. The above-mentioned distribution of water content showed that the water content tended to be slightly higher at deeper depths, suggesting that some water may have been taken in by the submerged casting. However, considering the design strength, the difference in strength in the depth direction was not a problem. Figure 9b, which shows the change in strength over time, indicates that there was no long-term decrease in strength, although small and large values were observed depending on the year of investigation. The range of standard deviations (1σ) from the mean value is shown by error bars, and it can be seen that the mean value minus the standard deviation was larger than the design strength for all the survey years. From these results, it can be concluded that overall, the strength properties of the treated soil were almost stable.
In the 2006 and 2012 surveys, needle penetration tests were conducted on cuttings from the interiors of the treated soil samples. As representative examples, Figure 10 shows the results of the 2012 survey, which was conducted ten years after construction. These results demonstrate the relationship between the penetration depth and penetration resistance. For the uniformly treated soil, the relationship is proportional, as shown in the figure, and this gradient represents the stiffness and strength of the treated soil. If the strength had been reduced by deterioration, the gradient would be smaller. Conversely, in areas where the strength was higher, the gradient would be larger. No changes in these gradients were observed in the results presented in the examples, indicating that the strength of the treated soil was uniform. According to the Japanese Geotechnical Society Standards [21], a gradient up to a penetration of 10 mm is referred to as the needle penetration gradient. The relationship between this value and the unconfined compressive strength of a specimen in the vicinity of the needle penetration test is shown in Figure 11. This figure also shows the correlation between the two obtained in previous studies [24]. The plotted data show that the correlations did not deviate significantly from those obtained in a previous study and were typical of cement-treated soils.

5. Long-Term Properties of the Surface of Cement-Treated Soil

5.1. 15 Year Survey Results

No signs of strength reductions were observed in the interiors of the treated soil samples during the investigations up to 2012, needle penetration tests were conducted on the surfaces exposed to the untreated soil from the 2017 survey onwards. The results of the 2017 survey, 15 years after construction, are shown in Figure 12. The test results were obtained from vertical needle penetration tests against the exposed top surfaces of two cores (2017-1 and 2017-2). The results for core 2017-1 showed that penetration resistance was encountered immediately after penetration, with a large variation in values. The results varied depending on the penetration point. Visual observations of the specimens suggested that this was because the treated soil contained gravel. On the other hand, the results for core 2017-2 showed that the penetration resistance values were relatively stable, and it was possible to identify areas with a constant gradient. With the exception of penetration no. 3, points of change in the gradient can be seen, and their locations are indicated by arrows in the figure. The slope is smaller in the shallow section and larger in the deeper section. In other words, the strength of the shallow part was low, and this part was considered to have deteriorated. Consequently, the strength was considered to have decreased in the range from the boundary to a depth of approximately 16–25 mm.
In the 2017 survey, suspensions were prepared from samples subjected to needle penetration tests, which were then chemically analysed. The results are summarised in Table 2. The suspension was prepared from soil obtained at a depth of approximately 80–100 mm below the exposure surface, where the cement-treated soil was not considered to be degraded. As shown in the table, the cement-treated soil had a low pH. However, an alkaline atmosphere was maintained and calcium remained, which was consistent with the fact that the strength of the soil did not deteriorate.

5.2. 20 Year Survey Results

The results of the needle penetration tests conducted in 2022, 20 years after construction, are shown in Figure 13. The results were obtained by vertically penetrating the exposed surfaces at the tops and bottoms of cores 2022-1 and 2022-2. In the upper part of core 2022-1, the gradient was relatively large; however, there were differences in the gradients between penetrations. The arrows in the figure may be seen as points of change in the gradients at 8 and 25 mm, although these were difficult to determine because of the large variation. In the upper part of core 2022-2, there was a sudden increase in the penetration resistance, possibly due to the needle hitting gravel. In addition, the gradient was small and it was difficult to determine the point of change. Similarly, in the lower part of core 2022-1, the gradient was small and there was no point of change, except where the needle struck gravel. Constant gradients were identified in the lower part of core 2022-2, and the points of change were at approximately 18 mm. However, the point of change of the gradient in these tests was unclear and, with the exception of the upper part of core 2022-1, the gradients were small, and the possibility could not be ruled out that the degradation had progressed deeper than the 30 mm penetration of the needle. Therefore, it was decided to implement lateral needle penetration tests at several depths in the sample, elemental mapping by EPMA, and a chemical analysis to investigate the degradation at a deeper depth.
The results of needle penetration tests on the lateral side of a sample are shown in Figure 14. These are the needle penetration gradients for each depth from the exposure surface and are the average gradients up to a penetration depth of 10 mm. In the upper part of core 2022-1, the gradients were generally large; however, in the range of 10–20 mm near the exposure surface, the penetration gradients tended to decrease. On the other exposure surfaces, the gradients were generally small, and no tendency for the gradient to decrease was observed in the vicinity of the exposure surface. However, there was no sudden change in the needle penetration gradient up to a depth of 70–100 mm. It is unlikely that the treated soil had deteriorated at this depth. It can be concluded that the deterioration did not progress deeper than 30 mm, and the strength of the soil was low from the time it was cast. The results of the elemental mapping by EPMA are shown in Figure 15. An examination of the calcium content, which is correlated with the strength of the cement-treated soil, shows that the calcium content in the upper part of core 2022-1 was high, which was consistent with the high needle penetration gradient at that location. However, the calcium content was low in the lower parts of cores 2022-1 and 2022-2, which was consistent with the small needle penetration gradients at these locations. These analyses also suggested that the cement-treated soil did not deteriorate at any depth, but that there was an overall variation in the strength of the treated soil from the beginning of construction, with localised areas of low strength.
In the 2022 survey, the treated soil taken from several points on the exposed surface was ground and used to make suspensions, which were chemically analysed. The amount of soil collected in this survey was small, and the prescribed soil volume indicated by the Japanese Geotechnical Society Standards [23,24] could not be ensured. Therefore, the suspensions were prepared by maintaining a fixed ratio between the amount of soil and water. In core 2022-1, suspensions were made using soil collected at 1 cm intervals, whereas in core 2022-2, the amount of soil available for making the suspension was small, owing to gravel and other reasons, and the soil collected from an area of a few centimetres had to be used. The results of the chemical tests are presented in Table 3. An alkaline atmosphere was maintained and calcium remained, albeit at a lower pH, in the treated soil. In the upper and lower parts of core 2022-1, there was a trend towards lower calcium contents within several centimetres of the exposed surface, which may indicate degradation from the exposed surface. The overall results for the specimens indicated that the lower parts of cores 2022-1 and 2022-2 contained more sodium and therefore had higher electrical conductivity values. The calcium and sodium contents were low in the upper part of core 2022-2, where there was more gravel, and the treated soil was more brittle, suggesting that the treated soil had different characteristics from the rest of the specimen. Thus, the change in the depth direction from the exposed surface was small; however, the values differed significantly from specimen to specimen. It is reasonable to assume that the low calcium contents in some specimens did not indicate degradation but that the chemical properties were different from the beginning. In other words, the results of the chemical analyses did not indicate that the treated soil had deteriorated at any depth. Signs of deterioration were only observed within several centimetres of the exposed surface.
Based on the results of the needle penetration tests from the side of the sample described above, along with the EPMA images and chemical analysis results, only the area around the exposed surface of the treated soil was degraded. Based on the results of the needle penetration tests perpendicular to the exposed surface, a depth of approximately 18–25 mm could be considered as the depth of degradation.

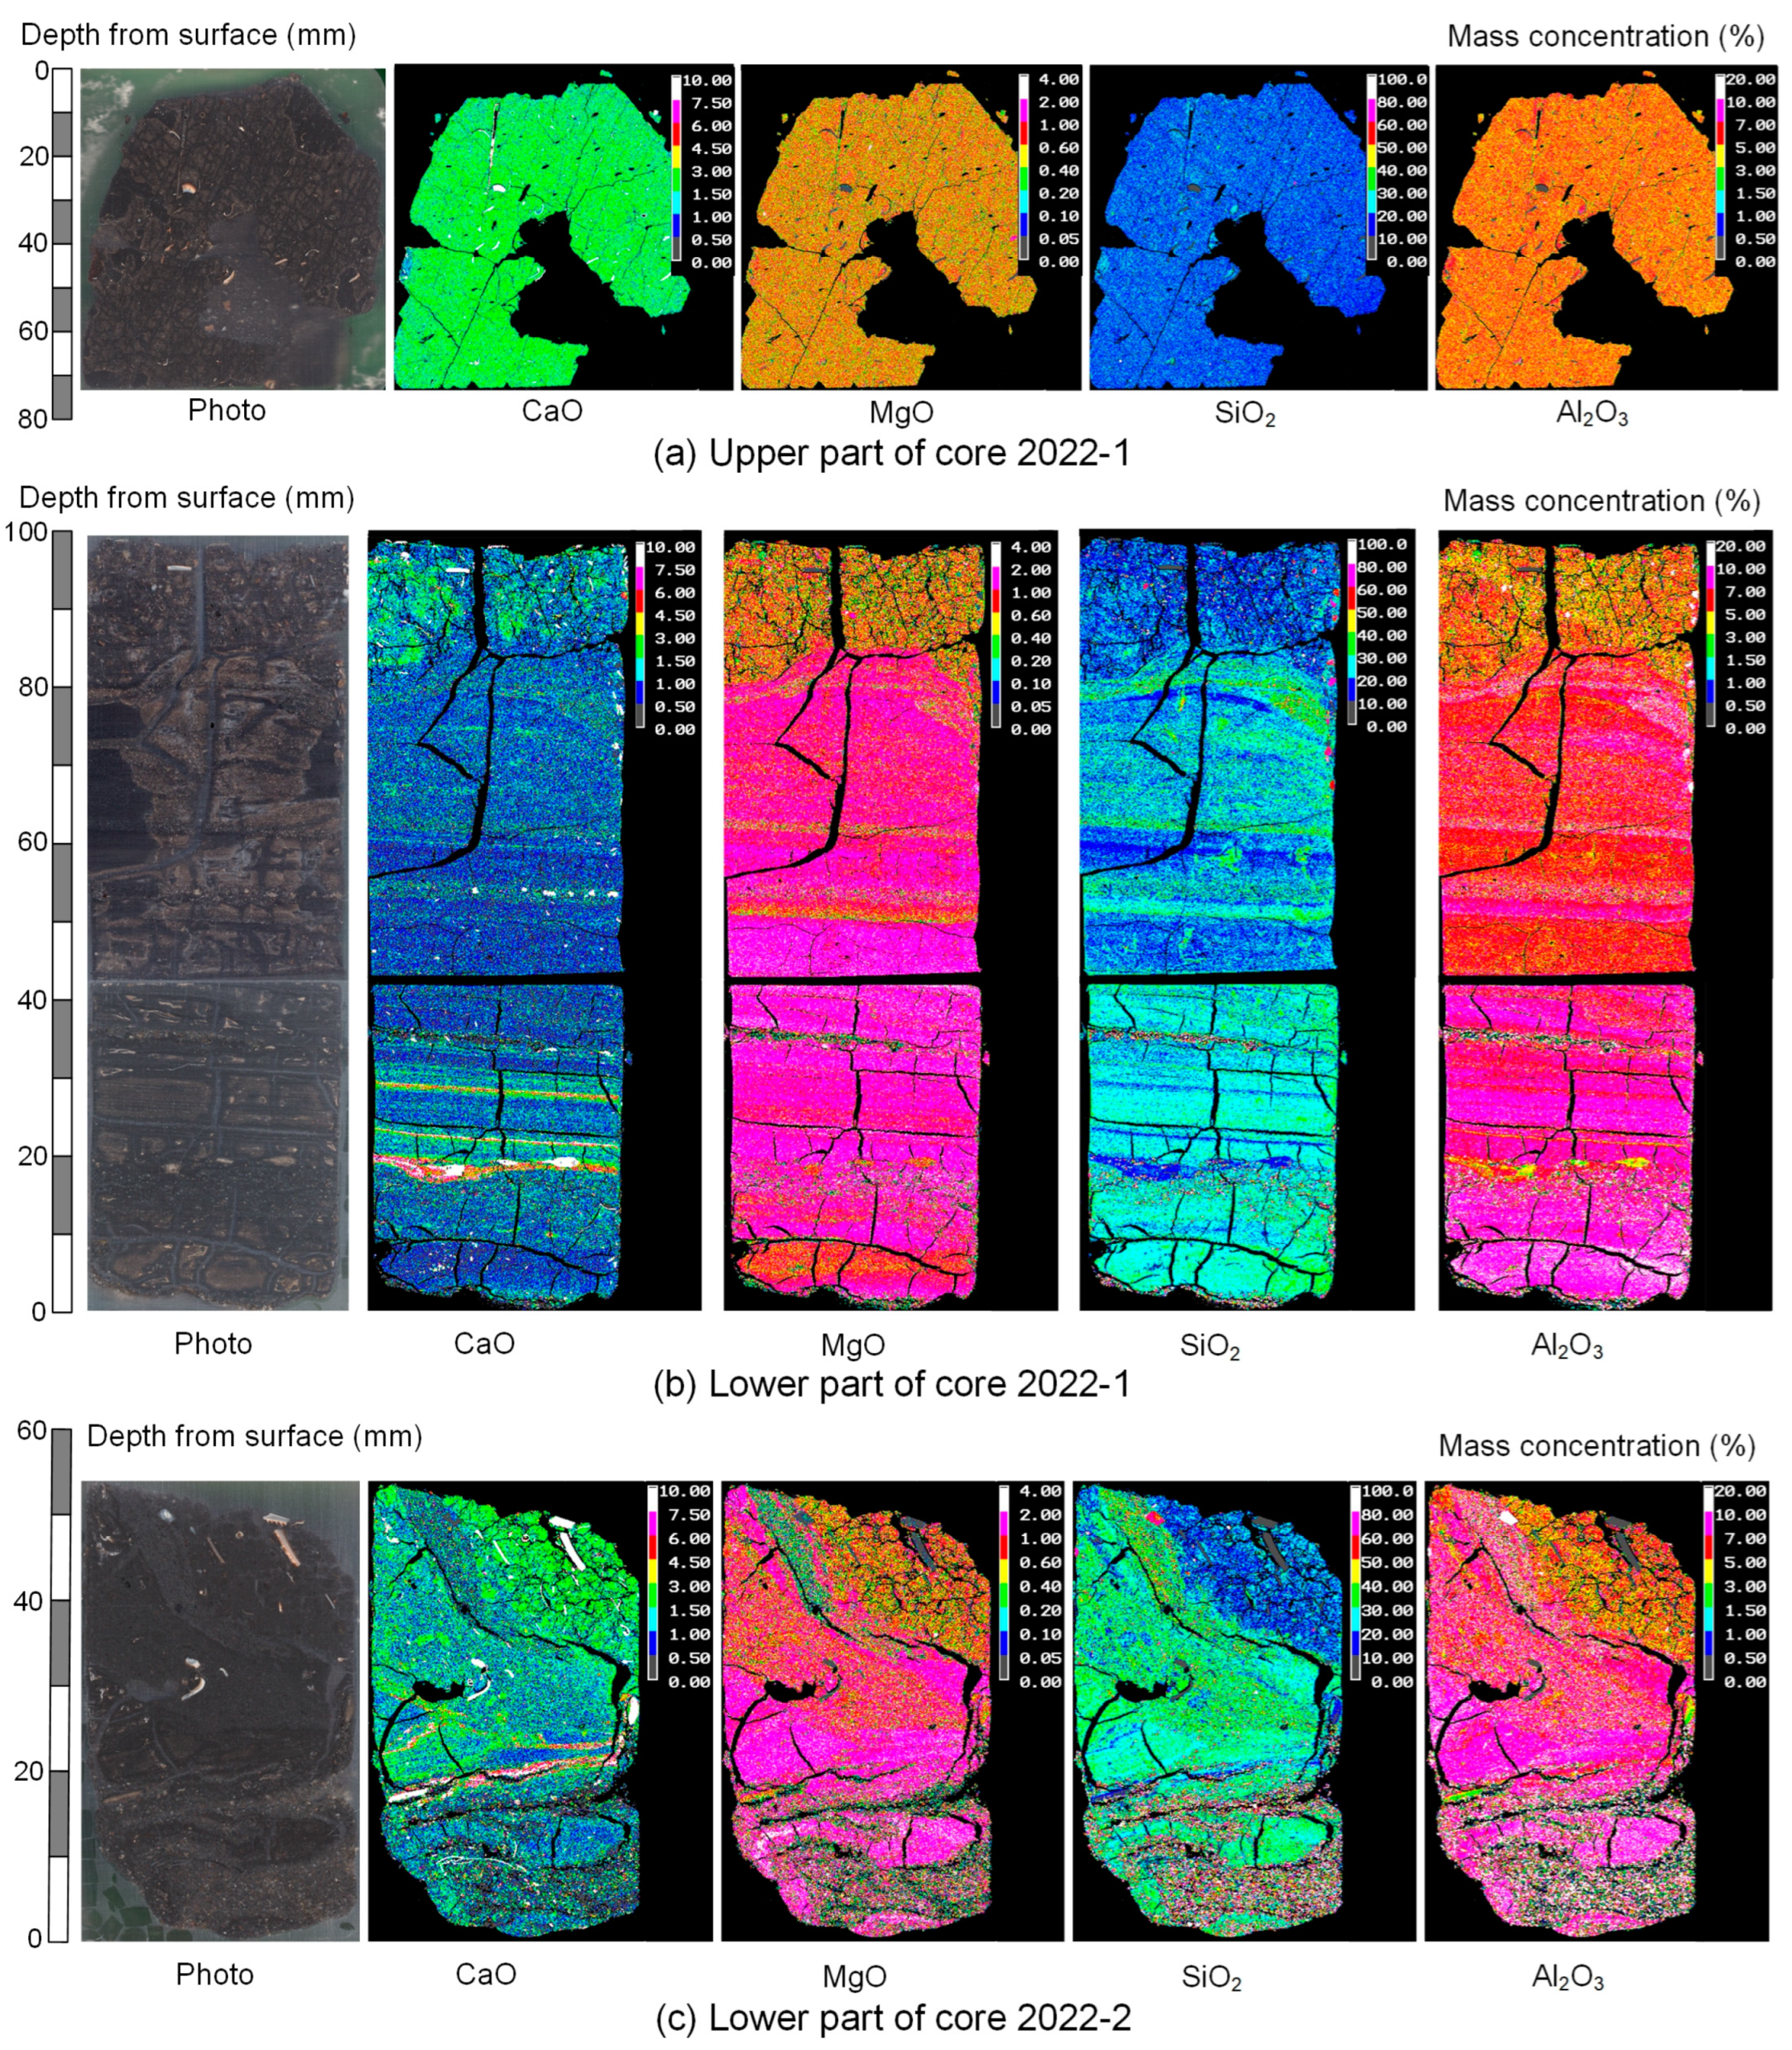
5.3. Deterioration from the Surface of Treated Soil

The treated soils deteriorated from the exposed surface over the long term. The deterioration of treated soils from exposed surfaces has been demonstrated in previous studies [4,5,6,7,8,9,10,11,12,13]. The mechanism of this degradation is thought to be as shown in Figure 16. The calcium ion concentration in the pore water decreases owing to diffusion from the exposed surface. Calcium is supplied spontaneously to the pore water from the cement hydrates and other materials to increase the calcium ion concentration in the pore water. This supply breaks down the hydrates. The hydrates reinforce the structural framework; thus, the breakdown of the hydrates leads to a reduction in the strength of the treated soil. Previous studies have confirmed that the calcium concentration near the exposed surface decreases, and a correlation between the decrease in strength and calcium concentration has been obtained. However, this degradation is slow and takes years. The authors confirmed that the calcium ion concentration was reduced by forcibly replacing the pore water, which degraded the treated soil [25]. It has also been found that when treated soil is exposed to seawater, the magnesium salts in the seawater react with the cement hydrates, resulting in faster deterioration of the treated soil [4,8,10,12].
Takahashi et al. [13] graphically summarised the relationship between the duration of the exposure and the depth of the degradation, which was linear in a double logarithmic graph, as shown in Figure 17. This figure shows the results of the present study, which fall within the range of variation of the results of previous studies. Although the figure includes the results for both specimens of treated soil cured in laboratories and those produced by the deep mixing method in situ, the differences in the depth of degradation owing to different soils, cements, and improvement methods are within the range of variability. In practice, the rate of degradation should vary depending on the properties of the treated soil and the exposure conditions; however, within a realistic range of conditions, the rate of degradation is likely to fall within the range of variation. The treated soil in the pumping pipe at the site did not deteriorate rapidly, although its strength was not high.

6. Conclusions

The long-term durability of treated soil was investigated on an artificial island at Central Japan International Airport, where the pneumatic flow mixing method was first fully introduced. The results of five investigations conducted immediately after construction and 4, 10, 15, and 20 years after construction were summarised. The results obtained and conclusions are as follows:
(1)
No reduction in the unconfined compressive strength or needle penetration gradient was observed in the interiors of treated soil samples, and there was no sign of deterioration.
(2)
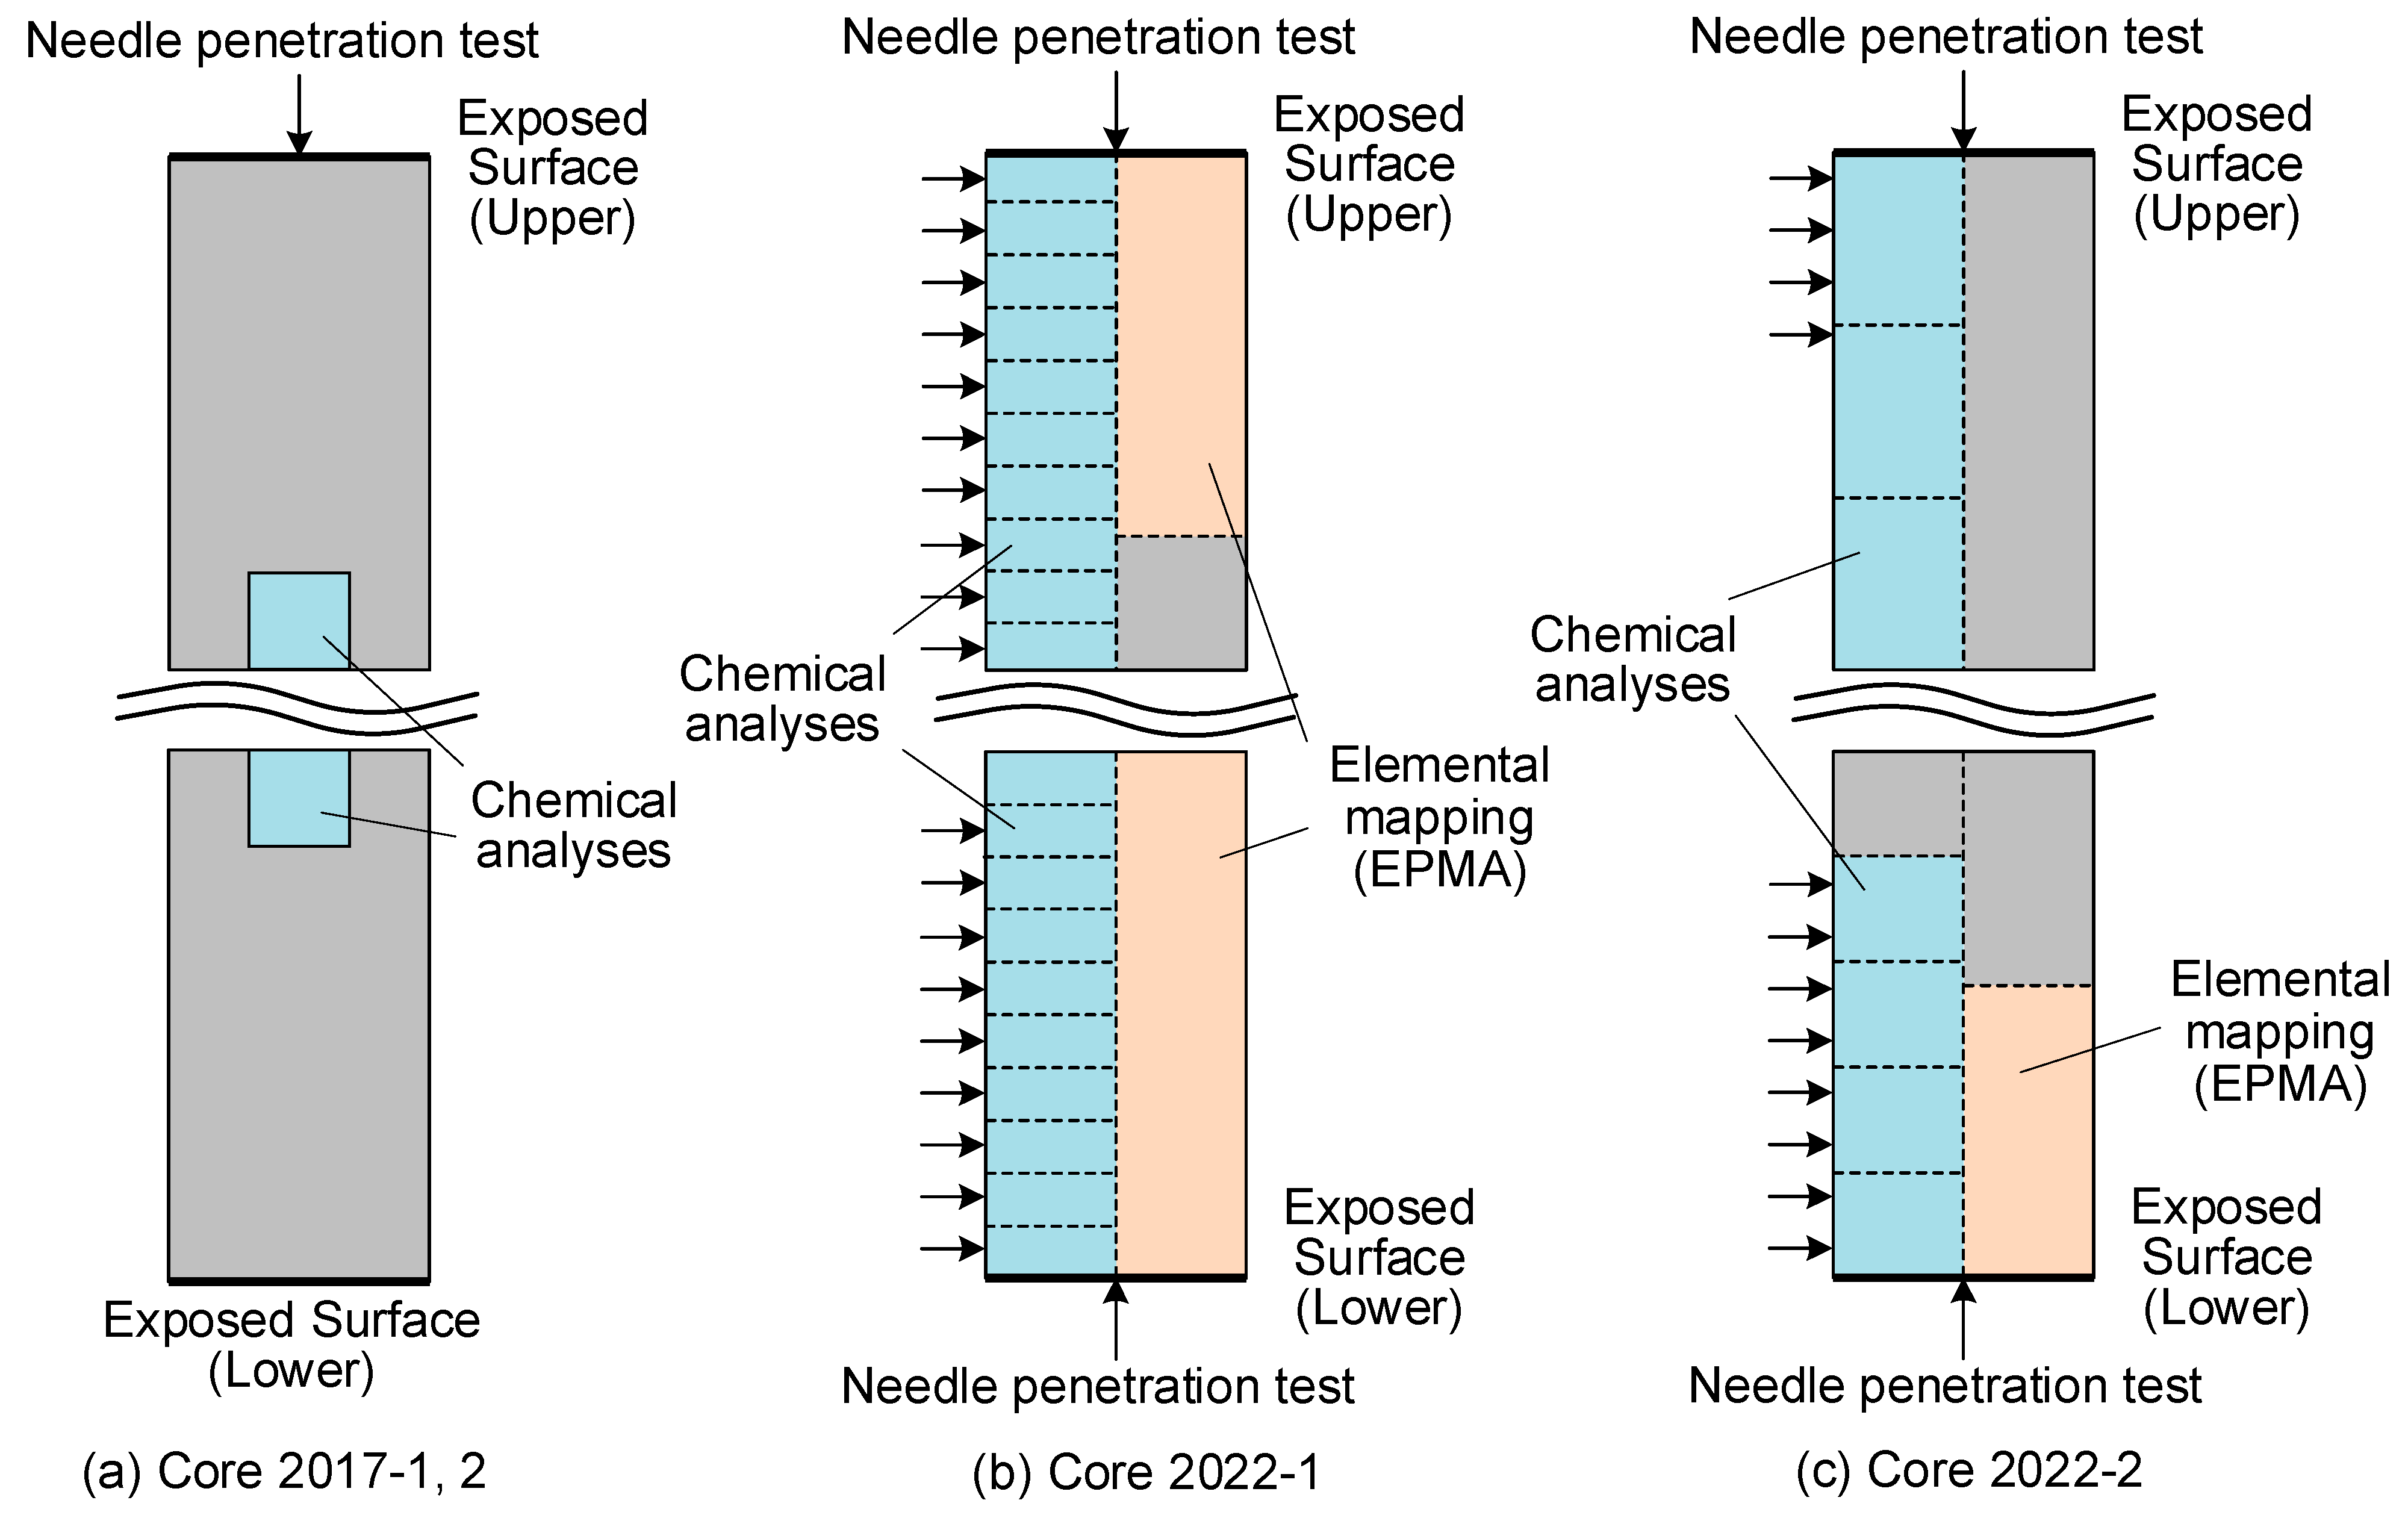
Some degradation was observed on the top and bottom exposed surfaces of the treated soil, similar to that of soil after other treatments. In addition to needle penetration and chemical tests, elemental mapping using an EPMA was performed to determine the degree of degradation. The depth of degradation 20 years after construction was approximately 18–25 mm.
(3)
Although the amount of cement added in the pneumatic flow mixing method was relatively small, the degradation depth was within the range of the degradation depth over time investigated in previous studies and was not significant.
(4)
The artificial island at Central Japan International Airport has a 2 m thick soil cover on top of the improved soil, and a reduction in strength of this magnitude would not affect the stability of the ground as a whole. In other words, it was confirmed to be durable at least during the first 20 years of construction.
(5)
Based on the results to date, it is unlikely that the degree or extent of strength reductions of the treated soil will change abruptly; however, from the perspective of the long-term maintenance of the airport facilities, it is important to continuously investigate the long-term behaviour of the improved ground. Airport facilities demand high performance from the ground, and if there is an accelerated deterioration trend, measures need to be taken.
(6)
There are only a few examples and reports on the long-term strength and durability of treated soils in the field; therefore, this study provides valuable data. The test results are particularly important for understanding the durability of the pneumatic flow mixing method. This method contributes to sustainability in terms of the effective use of dredged soil and less cement addition, and it would be more sustainable if it has long-term durability.

Author Contributions

Investigation, I.S. and A.O.; project administration, H.T.; validation, Y.M.; writing—original draft preparation, H.T. All authors have read and agreed to the published version of the manuscript.

Funding

This research received no external funding.

Institutional Review Board Statement

Not applicable.

Informed Consent Statement

Not applicable.

Data Availability Statement

Data is contained within the article.

Acknowledgments

Kawasaki Geological Engineering Co., Ltd. cooperated with the field investigations and tests. The authors would also like to acknowledge the persons in charge of Central Japan International Airport and Masaki Kitazume of the Tokyo Institute of Technology (formerly the Port and Airport Research Institute), who initiated the ongoing investigations from the time of the airport’s construction.

Conflicts of Interest

The authors declare no conflict of interest.

References

  1. Takahashi, H. Ground Improvement for Coastal Engineering; CRC Press: Boca Raton, FL, USA, 2023; pp. 1–196. [Google Scholar]
  2. Kitazume, M. The Pneumatic Flow Mixing Method; CRC Press/Balkema: London, UK, 2017; pp. 1–233. [Google Scholar] [CrossRef]
  3. Maher, A.; Kitazume, M.; Janbaz, M.; Miskewitz, R.; Douglas, S.; Yang, D. Utilization of pneumatic flow tube mixing technique (PFTM) for processing and stabilization of contaminated harbor sediment. Mar. Georesources Geotechnol. 2016, 36, 271–279. [Google Scholar] [CrossRef]
  4. Shihata, S.A.; Baghdadi, Z.A. Long-term strength and durability of soil cement. J. Mater. Civ. Eng. 2001, 13, 161–165. [Google Scholar] [CrossRef]
  5. Kitazume, M.; Nakamura, T.; Terashi, M.; Ohishi, K. Laboratory tests on long-term strength of cement treated soil. In Proceedings of the 3rd International Conference on Grouting and Ground Treatment, New Orleans, LA, USA, 10–12 February 2003; pp. 586–597. [Google Scholar]
  6. Hayashi, H.; Nishikawa, J.; Ohishi, K.; Terashi, M. Field observation of long-term strength of cement treated soil. In Proceedings of the 3rd International Conference on Grouting and Ground Treatment, New Orleans, LA, USA, 10–12 February 2003; pp. 598–609. [Google Scholar]
  7. Ikegami, M.; Ichiba, T.; Ohishi, K.; Terashi, M. Long-term strength change of cement treated soil at Daikoku Pier. In Proceedings of the Soft Ground Engineering in Coastal Areas, Yokosuka, Japan, 28–29 November 2002; pp. 241–246. [Google Scholar]
  8. Rajasekaran, G. Sulphate attack and ettringite formation in the lime and cement stabilized marine clays. Ocean Engineering 2005, 32, 1133–1159. [Google Scholar] [CrossRef]
  9. Nakamura, T.; Kitazume, M. Laboratory tests on durability of cement treated soils. In Technical Note of the Port and Airport Research Institute; No. 1128; Port and Airport Research Institute: Yokosuka, Japan, 2006; pp. 1–13. (In Japanese) [Google Scholar]
  10. Hara, H.; Suetsugu, D.; Hayashi, S.; Matsuda, H. Deterioration mechanism of cement-treated soil under seawater. J. Jpn. Soc. Civ. Eng. Ser. C (Geosph. Eng.) 2013, 69, 469–479. (In Japanese) [Google Scholar]
  11. Committee on Geocement. A study on long term stability of soil–cement columns improved by geocement, cement and concrete. Cem. Concr. 2014, 804, 9–14. (In Japanese) [Google Scholar]
  12. Cui, X.; Zhang, N.; Li, S.; Zhang, J.; Tang, W. Deterioration of soil-cement piles in a saltwater region and its influence on the settlement of composite foundations. J. Perform. Constr. Facil. 2016, 30, 04014195. [Google Scholar] [CrossRef]
  13. Takahashi, H.; Morikawa, Y.; Fujii, N.; Kitazume, M. Thirty-seven-year investigation of quicklime-treated soil produced by deep mixing method. Ground Improv. 2018, 171, 135–147. [Google Scholar] [CrossRef] [Green Version]
  14. Kitazume, M.; Joyo, T.; Mizoguchi, M. Characteristics of soil improved by pneumatic flow mixing method after 4 years (translated by authors). In Proceedings of the 61st Annual Conference of the Japan Society of Civil Engineers, Kusatsu, Japan, 20–22 September 2006; pp. 305–306. (In Japanese). [Google Scholar]
  15. Morikawa, Y.; Yokoe, S.; Kito, J. Characteristics of soil improved by pneumatic flow mixing method after 10 years (translated by authors). In Proceedings of the 67th Annual Conference of the Japan Society of Civil Engineers, Nagoya, Japan, 5–7 September 2012; pp. 451–452. (In Japanese). [Google Scholar]
  16. Morikawa, Y.; Takahashi, H.; Yokoe, S.; Kito, J. Characteristics of soil improved by pneumatic flow mixing method after 15 years (translated by authors). In Proceedings of the 73rd Annual Conference of the Japan Society of Civil Engineers, Sapporo, Japan, 29–31 August 2018; pp. 451–452. (In Japanese). [Google Scholar]
  17. Sato, T.; Kato, H. Application of the pneumatic flow mixing method to land development for Central Japan International Airport. In Proceedings of the 2002 International Symposium on Underwater Technology, Tokyo, Japan, 16–19 April 2002; pp. 93–98. [Google Scholar] [CrossRef]
  18. Kitazume, M.; Satoh, T. Development of a pneumatic flow mixing method and its application to Central Japan International Airport construction. Ground Improv. 2003, 7, 39–148. [Google Scholar] [CrossRef]
  19. Sato, T. Development and application of pneumatic flow mixing method to reclamation for offshore airport. In Technical Note of the Port and Airport Research Institute; No. 1076; Port and Airport Research Institute: Yokosuka, Japan, 2004; pp. 1–81. (In Japanese) [Google Scholar]
  20. Japanese Geotechnical Society. Method For Unconfined Compression Test of Soils (JIS A1216). In Japanese Geotechnical Society Standards—Laboratory Testing Standards of Geomaterials; JGS 0511; Japanese Geotechnical Society: Tokyo, Japan, 2015; pp. 1–6. [Google Scholar]
  21. Japanese Geotechnical Society. Method For Needle Penetration Test. In Japanese Geotechnical Society Standards–Geotechnical and Geoenvironmental Investigation Methods; JGS 3431; Japanese Geotechnical Society: Tokyo, Japan, 2018; pp. 1–5. [Google Scholar]
  22. Japanese Geotechnical Society. Test Method for Ph of Suspended Soils. In Japanese Geotechnical Society Standards–Laboratory Testing Standards of Geomaterials; JGS 0211; Japanese Geotechnical Society: Tokyo, Japan, 2018; pp. 1–5. [Google Scholar]
  23. Japanese Geotechnical Society. Test Method for Electric Conductivity of Suspended Soils. In Japanese Geotechnical Society Standards–Laboratory Testing Standards of Geomaterials; JGS 0212; Japanese Geotechnical Society: Tokyo, Japan, 2018; pp. 1–4. [Google Scholar]
  24. Maruto Co., Ltd. Penetrometer for Soft Rock: Model SH-70 Instruction Manual; Maruto Co., Ltd.: Tokyo, Japan, 2006; pp. 1–3. (In Japanese) [Google Scholar]
  25. Takahashi, H.; Morikawa, Y.; Uemura, T. Trial tests to promote degradation of cement treated soil by percolation technique. In Proceedings of the Deep Mixing, Online, 1–17 June 2021; pp. 15–17. [Google Scholar]
Figure 1. System used to implement the pneumatic flow mixing method.
Applsci 13 08081 g001
Figure 2. Schematic view of mixing in a pneumatic pipe.
Applsci 13 08081 g002
Figure 3. Central Japan International Airport and areas where dredged soil was used.
Applsci 13 08081 g003
Figure 4. Survey points and schematic columnar sections: (a) survey points (left: immediately after construction; right: second and subsequent surveys); (b) schematic of columnar section.
Applsci 13 08081 g004
Figure 5. Boring and sampling: (a) boring operation; (b) core sample.
Applsci 13 08081 g005
Figure 6. Tested parts of cores.
Applsci 13 08081 g006
Figure 7. Testing near exposed surfaces.
Applsci 13 08081 g007
Figure 8. Distributions of water content and wet density in the depth direction.
Applsci 13 08081 g008
Figure 9. Depth distribution and ageing of unconfined compressive strength.
Applsci 13 08081 g009
Figure 10. Needle penetration resistance at the inner surface of cement-treated soil (10 year survey).
Applsci 13 08081 g010
Figure 11. Relationship between unconfined compressive strength and needle penetration gradient.
Applsci 13 08081 g011
Figure 12. Needle penetration resistances at the surface of cement-treated soil samples (15 year survey).
Applsci 13 08081 g012
Figure 13. Needle penetration resistances at the surface of cement-treated soil samples (20 year survey).
Applsci 13 08081 g013
Figure 14. Needle penetration gradients near the surface of samples (20 year survey).
Applsci 13 08081 g014
Figure 15. Elemental mapping results from an EPMA.
Applsci 13 08081 g015
Figure 16. Deterioration mechanism of treated soil due to calcium dissolution and diffusion.
Applsci 13 08081 g016
Figure 17. Relationship between duration of exposure and depth of degradation (Addendum to [13]).
Applsci 13 08081 g017
Table 1. List of tests conducted on samples.
TestPart20022006201220172022
Water content testInteriorxxxxx
Test for bulk density of soilInteriorxxxxx
Unconfined compression testInteriorxxxxx
Needle penetration testInterior xx
Surface xx
Near surface x
Chemical analysis of suspensionNear surface xx
EPMANear surface x
Analysis of groundwaterBoring hole x
x: test implemented.
Table 2. Results of the chemical analysis of suspensions (15 year survey).
CorePartpHCa2+ (ppm)EC (mS/cm)
2017-1Upper9.01602.7
Lower8.92004.2
2017-2Upper8.91902.0
Lower8.71302.6
Table 3. Results of a chemical analysis of suspensions (20 year survey).
Core and PartDepth from Exposed Surface (cm)pHCa2+ (ppm)Na+ (ppm)EC (mS/cm)
2022-1 (Upper)0–19.1150791.0
1–29.1170801.0
2–39.4190901.1
3–49.4190901.1
4–59.5190881.1
5–69.4190831.1
6–79.4190861.1
7–89.4190851.1
8–99.4190861.1
9–109.7200871.1
2022-1 (Lower)0–18.31306604.3
1–28.11206404.4
2–38.31507305.0
3–48.21607705.2
4–58.11507204.8
5–68.21608305.3
6–78.31105003.5
7–88.21507304.8
8–98.41707704.9
9–108.41808605.1
2022-2 (Upper)0–3.39.245400.46
3.3–6.69.239280.30
6.6–109.331190.22
2022-2 (Lower)0–28.432014008.4
2–48.934014008.2
4–68.332014008.0
6–88.533015007.7
Disclaimer/Publisher’s Note: The statements, opinions and data contained in all publications are solely those of the individual author(s) and contributor(s) and not of MDPI and/or the editor(s). MDPI and/or the editor(s) disclaim responsibility for any injury to people or property resulting from any ideas, methods, instructions or products referred to in the content.

