Article

Defining Breast Tumor Location Using a Four-Element Wearable Circular UWB MIMO Antenna Array

by
Tamer G. Abouelnaga
1,*,
Ehab K. I. Hamad
2,*,
Sherif A. Khaleel
3 and
Behrokh Beiranvand
4,*
1
Microstrip Circuits Department, Electronics Research Institute (ERI), Elnozha, Cairo 11843, Egypt
2
Electrical Engineering Department, Faculty of Engineering, Aswan University, Aswan 81542, Egypt
3
College of Engineering and Technology, Arab Academy for Science, Technology and Maritime Transport, Aswan 81511, Egypt
4
Electrical and Computer Engineering Department, University of Alberta, Edmonton, AB T6G 1H9, Canada
*
Authors to whom correspondence should be addressed.
Appl. Sci. 2023, 13(14), 8067; https://doi.org/10.3390/app13148067
Submission received: 23 May 2023 / Revised: 6 July 2023 / Accepted: 7 July 2023 / Published: 10 July 2023

Abstract

:
The objective of this paper is to develop a wearable circular UWB MIMO antenna array, consisting of four elements, that is capable of detecting and locating tumor cells within a heterogeneous breast phantom. The antenna element operates within a bandwidth from 2.4 GHz to 10.6 GHz when FR4 is used as the substrate, and extends from 2.57 GHz to 12.6 GHz when a Dacron fabric is used instead. The antenna is fabricated and measured, yielding highly similar results to the simulated outcomes. In the suggested detection system, one antenna is used for transmission, while the other antennas receive the transmitted signal. The employed antenna demonstrates gains of 5.49 dBi, 9.87 dBi, 11.9 dBi, and 14.7 dBi at resonant frequencies of 2.84 GHz, 3.87 GHz, 5.83 GHz, and 8.24 GHz, respectively, when a Dacron fabric is used as the substrate. Moreover, the proposed antenna exhibits a flexible shape with minimal vertical and horizontal bending effects across the entire operating frequency band. The antenna has a compact size of 42.85 × 42.85 mm2 and is printed on an FR4 substrate with a dielectric constant of 4.5 and a thickness of 1.6 mm for testing purposes. The S-parameters of the suggested system can effectively identify and precisely locate small tumors. Furthermore, the SAR findings indicate that the amount of power absorbed by the breast phantom tissues complies with the IEEE standards, thus confirming the suitability of the recommended antenna for the early detection and localization of breast cancer.

1. Introduction

The International Agency for Research on Cancer (IARC) announced in December 2020 that breast cancer has surpassed lung cancer as the most common form of cancer worldwide [1]. According to the World Health Organization (WHO), breast cancer accounted for 12% of all new cases of cancer globally in 2021, making it the most prevalent type of cancer [1]. Breast cancer is classified as “in situ” when it initially appears in the glandular tissue of the breast, specifically the ducts (85%) and lobules (15%) [2]. At this stage, there is a low possibility of metastasis. However, if left untreated, it can progress to spread to the surrounding tissues, lymph nodes, or distant organs [2]. The size of the tumor is strongly correlated with long-term mortality, and it is crucial to identify breast cancer when it is at or below 2 cm [3,4]. Microwave breast imaging (MWI) and image reconstruction algorithms have been described in the literature as methods for breast cancer detection [5]. Various approaches have been employed for MWI, using different UWB antennas. Table 1 presents an examination of UWB antennas for breast cancer detection, considering parameters such as antenna dimensions, substrate properties, bandwidth, and fractional bandwidth [5].
Several studies have proposed different types of UWB antennas for breast cancer detection. One study developed a small, single-polarization, flexible UWB antenna array designed to resemble a bra [6]. Another study presented flexible conformal 4 × 4 ultra-wideband antenna arrays, resembling a bra, to improve electromagnetic wave propagation [7]. A clinical prototype utilizing a microwave time domain technique, housed in a wearable bra interface, was developed for breast cancer diagnosis [8]. In another study, four 1.5 GHz meander line microstrip patch antennas were used to detect and locate tumors across the human breast [9]. A UWB microstrip patch antenna with an increased bandwidth was developed using a 100% cotton substrate for breast cancer detection [10]. Furthermore, a low-cost flexible antenna utilizing a thin film substrate was developed for MWI and early stage tumor identification [11]. A small flexible UWB monopole antenna, utilizing MEMS technology and an inhomogeneous breast phantom, was proposed for breast cancer detection [12]. In this paper, the suggested approach involves a wearable circular UWB four-element MIMO antenna array for examining a breast phantom to detect cancerous tumor tissues [13,14]. The proposed detection system is tested using both tumor and tumor-free tissues. The simulation results of the proposed detection system, obtained using 2020 CST Microwave Studio, are compared with the measurements from a vector network analyzer (VNA) and show good agreement. The presence of cancerous cells is identified by analyzing the reflection coefficient and coupling coefficient with frequency shifts. The localization stage involves examining the coupling coefficients to determine the tumor position. The proposed system is capable of the early identification and localization of 10 mm cancerous tissues within the human breast.
Compared to previously reported antennas [6,7,8,9,10,11,12,13,14,15,16,17], the proposed antenna has the largest fractional bandwidth among flexible antennas and maintains performance even when subjected to bending. The antenna also exhibits a high antenna gain, reaching 14.77 dBi at 11 GHz. The contributions of this research paper include the development of a modified antipodal Vivaldi UWB antenna on a Dacron substrate, and the development of a 2D scanning system for tumor detection and localization that maintains SAR levels below the allowable values. By implementing this system, a non-invasive, comfortable, and cost-effective method for breast cancer detection and localization can be achieved, encouraging regular check-ups that may save lives.

2. The Proposed Antenna Design

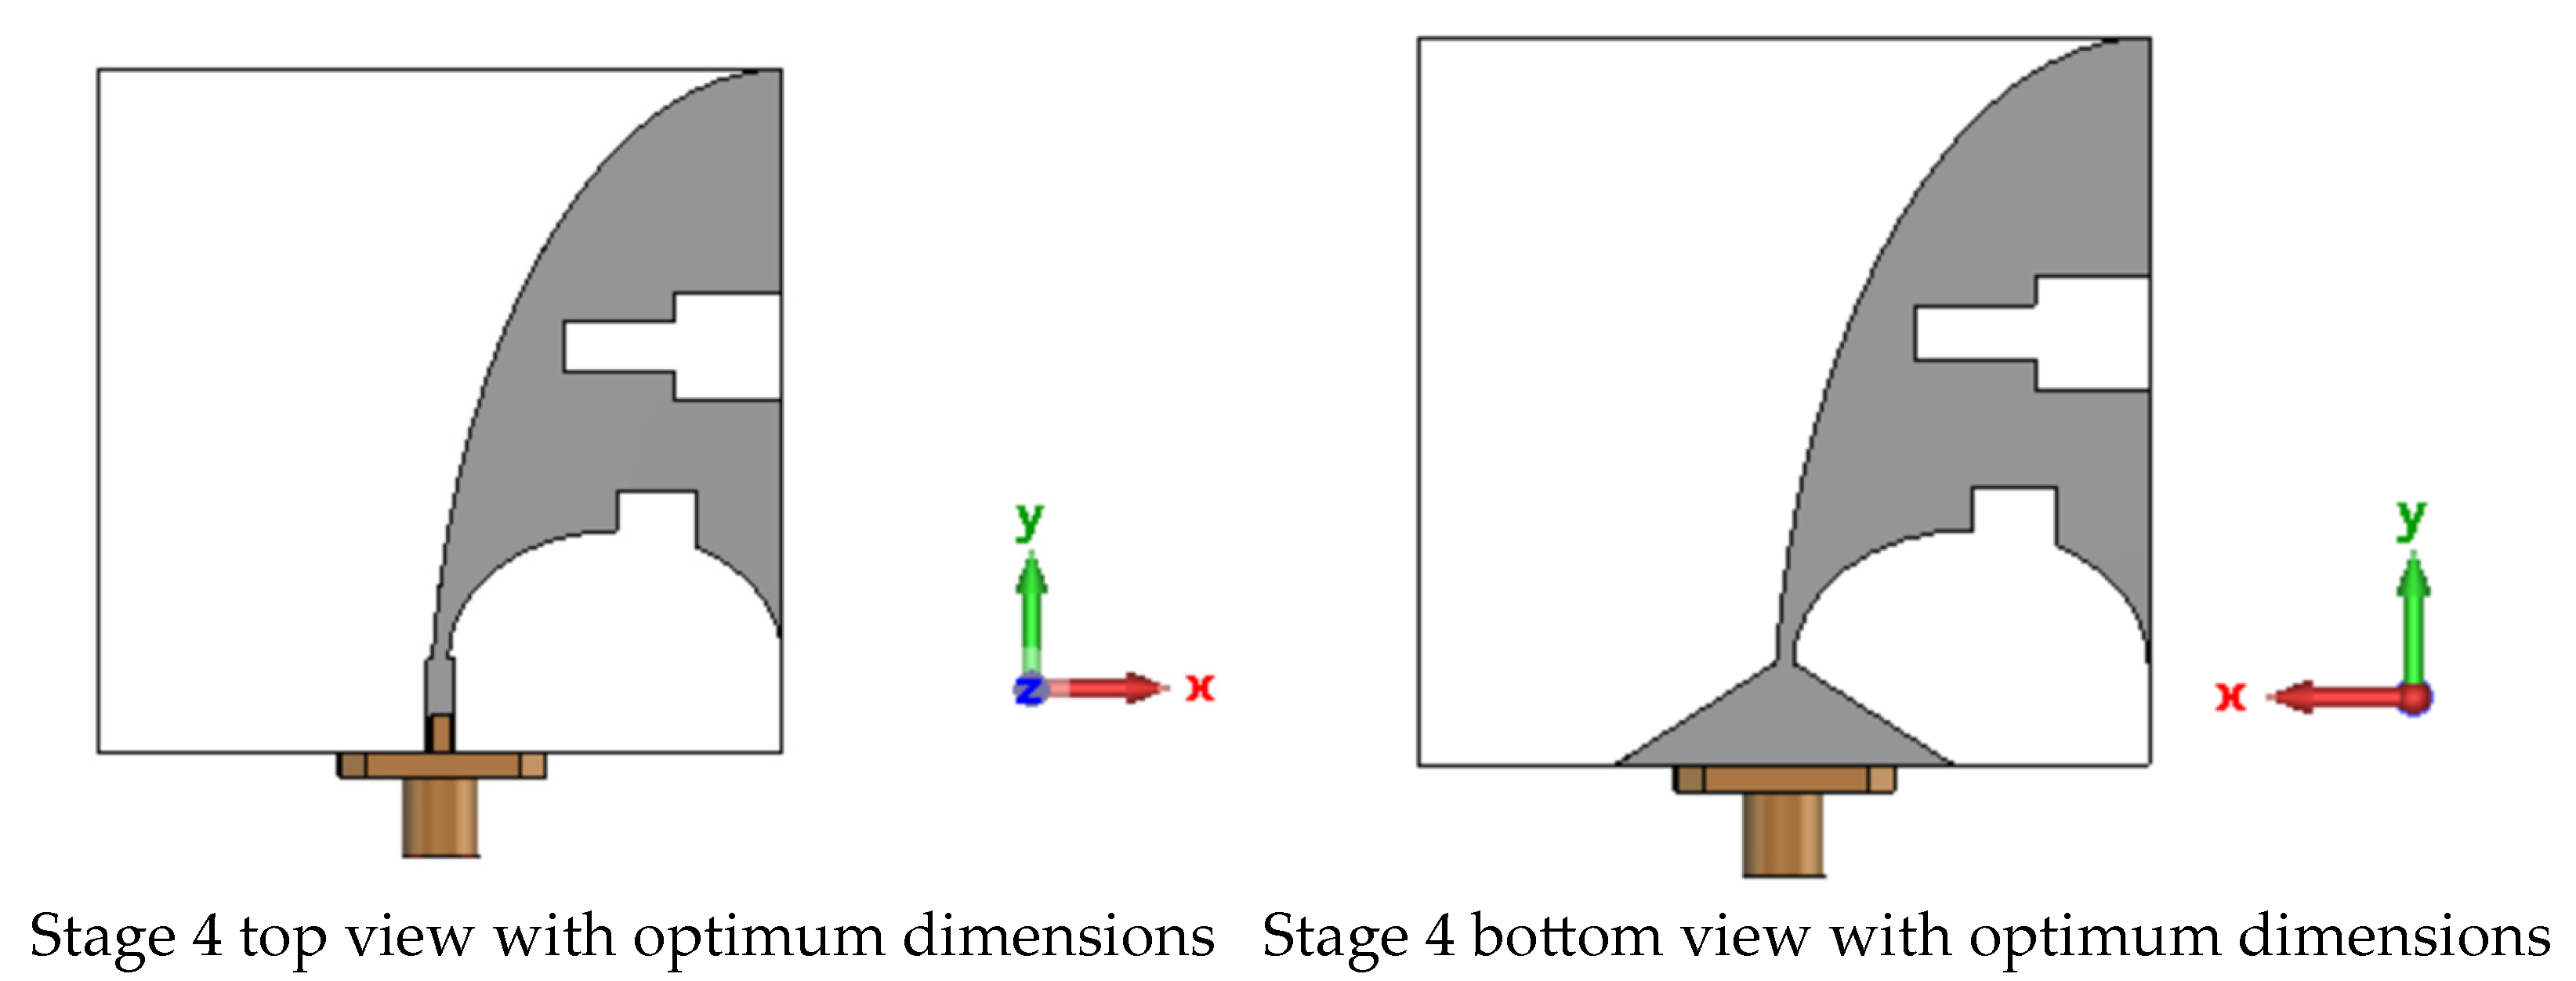
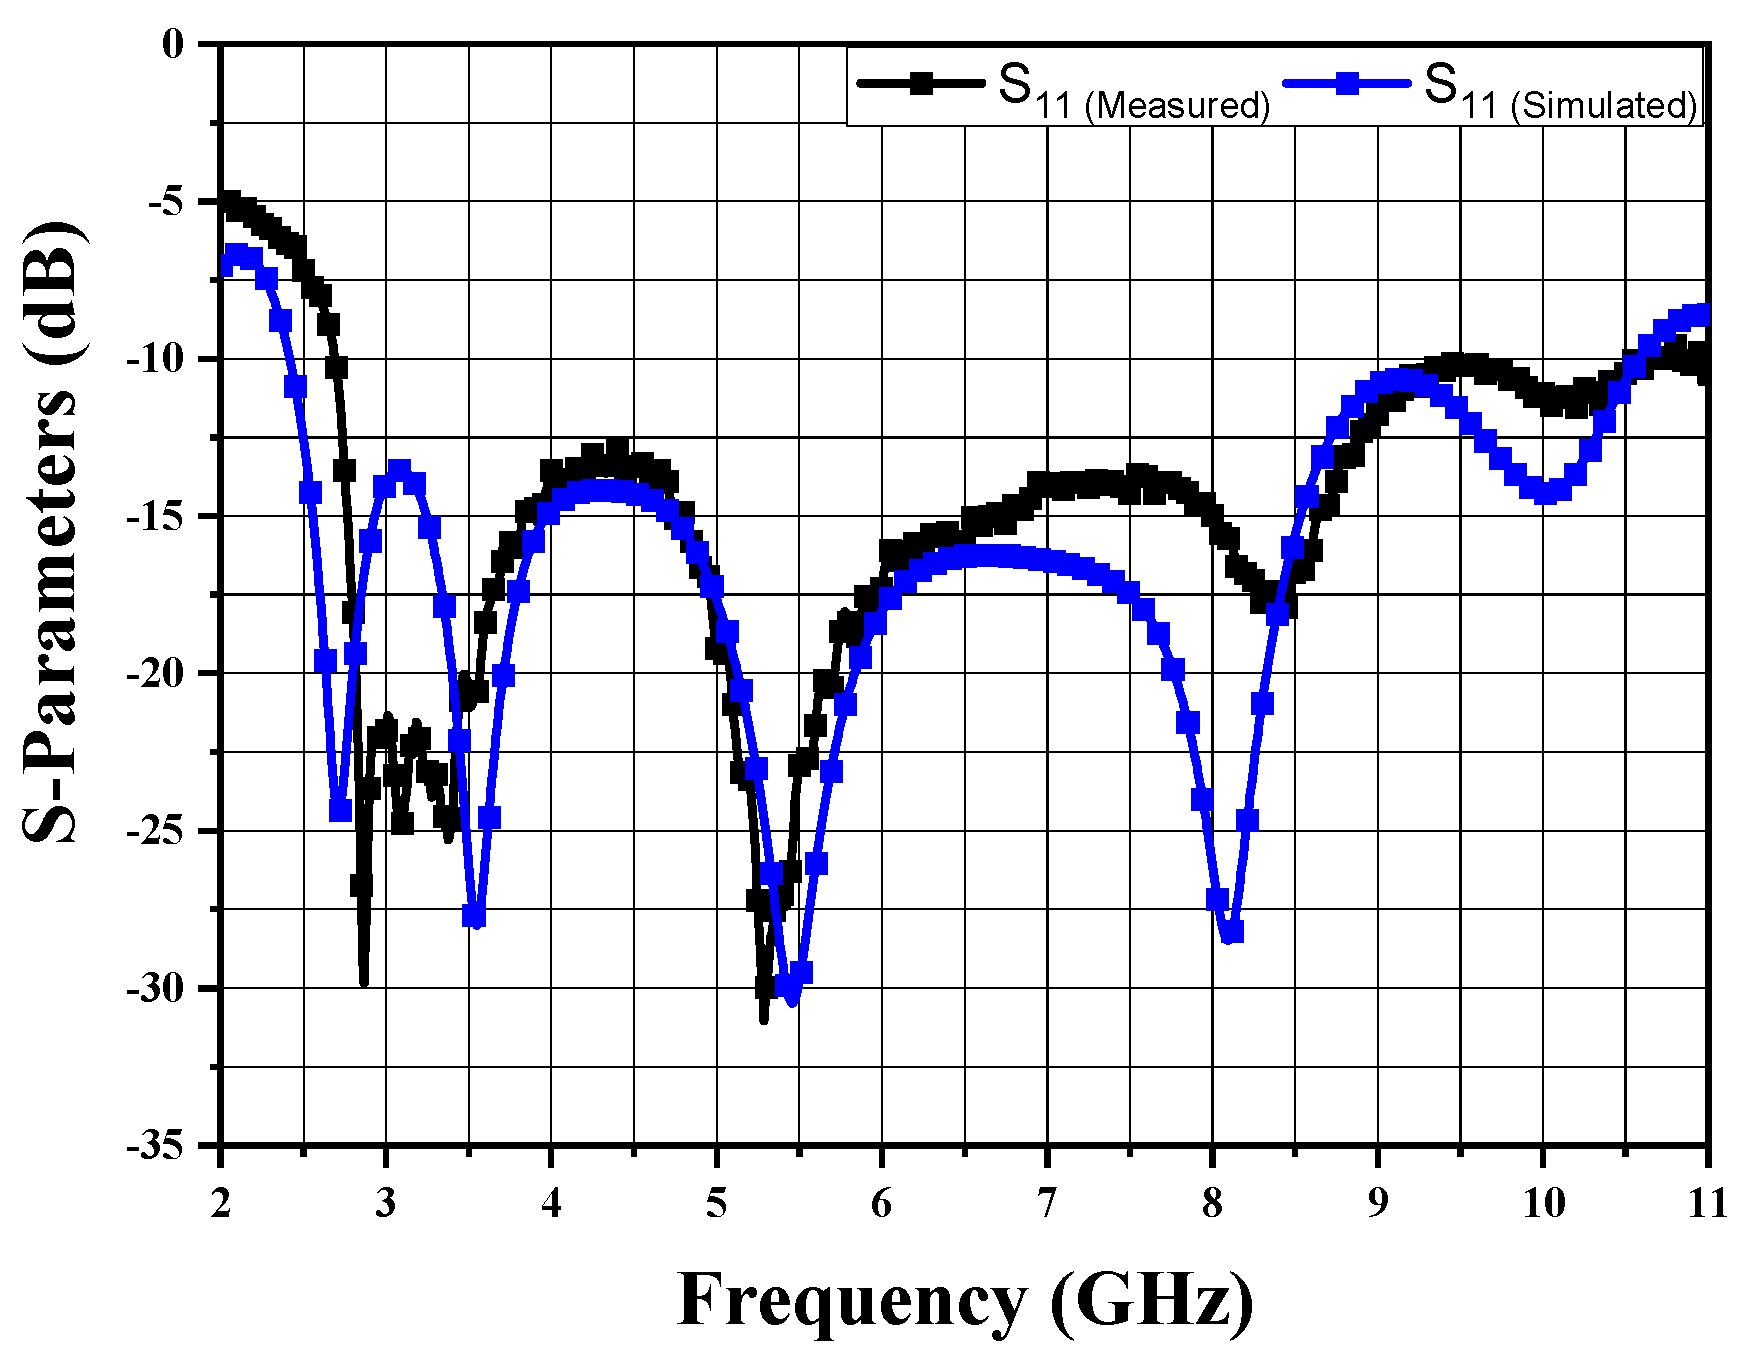
2.1. Antenna Elements

An antenna element capable of emitting pulses across a wide spectrum within the UWB frequency band is crucial for breast microwave imaging systems [18]. Figure 1 provides an overview of the four stages involved in developing the proposed antenna configuration. The initial stage (stage 1) focuses on constructing the antipodal Vivaldi antenna element to achieve the required operational bandwidth, employing traditional antenna construction techniques [19]. The antenna’s construction is depicted in Figure 1. For the antenna substrate, FR4 material with a dielectric constant of 4.65 and a height of 1.6 mm is utilized.
To determine the antenna’s width (Wsub) and length (Lsub), the following equation can be used:
W s u b = L s u b = C f l 2 E r + 1
where c represents the speed of light in a vacuum.
The antenna construction is based on the intersection of two quarter-ellipses, with their major radii (Ru1 and RL1) and minor radii (Ru2 and RL2) depicted in Figure 1. The choice of ellipses is determined using the following equations [20]:
R u 2 = W s u b 2 + W f 2 R L 1 = W s u b 2 + W f 2 R u 1 = L s u b R L 2 = 0.5 R L 1
To calculate the width of the microstrip transmission feeder (Wf) for a characteristic impedance of Zo = 50 Ω, the following equations [21] are utilized:
Z o = 60 E r e f f l n 8 h W 1 + W 1 4 h , W 1 / h 1 Z o = 120 π E r e f f   W 1 h + 1.393 + 0.667   l n W 1 h + 1.444   , W 1 / h > 1
where the effective dielectric constant for the transmission line E r e f f is given by the following:
E r e f f = E r + 1 2   + E r 1 2   1 + 12 h W 1 0.5
In the transition from stage 1 to stage 2, the antenna element’s bottom feed structure is modified by incorporating a triangle stub. In stage 3, multiple slots are introduced to enhance the impedance matching, while in stage 4, the FR4 material is replaced with Dacron fabric. The return loss findings of the development process depicted in Figure 1 are presented in Figure 2. The return loss of the initial traditional Vivaldi antenna element in stage 1 is ≤−10 dB within the frequency range from 1.8 GHz to 2.27 GHz and from 9 GHz to 10.27 GHz, indicating the need for further matching enhancement. In stage 2, the −10 dB return loss extends from 2.77 GHz to 3.91 GHz and from 4.54 GHz to 11 GHz, resulting in an improved ultra-wideband coverage between 4.54 GHz and 11 GHz. However, the gap in the UWB frequency range (3.91 GHz–4.54 GHz) still requires inclusion within the −10 dB operating band. Through the incorporation of multiple slots in stage 3, the bandwidth extends from 2.4 GHz to 10.6 GHz. Subsequently, in stage 4, the FR4 substrate is replaced with a Dacron fabric substrate, expanding the working frequency from 2.57 GHz to 12.6 GHz to cover the entire UWB frequency range (3.1 GHz to 11.6 GHz).
The suggested antenna has an optimal dimension of 42.85 × 42.85 mm2 and is arranged on FR4 and Dacron fabric substrates with thicknesses of 1.6 mm and 1.524 mm, and relative dielectric constants of 4.5 and 3, respectively. These optimal dimensions are summarized in Table 2. The top and bottom views of the constructed antenna are depicted in Figure 3a,b, respectively. The reflection coefficient of the suggested antenna is measured using the Rohde & Schwarz ZVB 20 model for the vector network analyzer. The calibration of the VNA is performed for the open, short, and matching conditions within the target frequency range using a mechanically calibrated kit. Subsequently, as indicated in Figure 3, the antenna is connected to the VNA male cable, and the reflection coefficient is measured and recorded. Figure 4 presents a comparison between the measured and simulated return loss of the antenna. The outcomes demonstrate a good agreement, with slight discrepancies in the higher frequency bands, which could be attributed to factors such as manufacturing faults, accuracy parameters, soldering technique, and the effect of SMA connections.
The performance of the antenna is simulated and evaluated using CST Studio Suite 2022 in terms of the bandwidth, gain, directivity, efficiency, and other radiation characteristics. For clarity, the development stages of the proposed UWB antenna are compared in Table 3. As anticipated, the proposed antenna achieves an efficiency of nearly 91.3%. This indicates a strong matching between the antenna and the 50 Ω port, achieved through the utilization of slits and the triangle stub at the feed, as shown in Figure 2b Furthermore, it is important to note that the simulation assumes a perfect copper annealed antenna conductor surface with a conductivity of 5.8 × 10⁷ S/m.

2.2. Effect of Antenna Bending

The proposed wearable UWB antenna is subjected to bending in both the horizontal and vertical directions around cylinders with varying radii (50, 60, 70, 80, 90, and 100 mm) positioned around the center of the breast phantom to investigate the bending effect [22]. Figure 5 provides a visualization of the 3D antenna considering different bending radii. The reflection coefficient results for the different bending radii, considering both vertical and horizontal bending, are presented in Figure 6.
In the flat case, the antenna demonstrates a bandwidth ranging from 2.57 to 12.6 GHz. When bent with a radius of 50 mm, a slight mismatch is observed within the frequency band from 3 GHz to 3.37 GHz for horizontal bending, and from 3.05 GHz to 3.47 GHz for vertical bending. Within these frequency bands, the reflection coefficient remains below 8.6 dB for horizontal bending, and below 7.6 dB for vertical bending. The suggested antenna exhibits only minor variations in the bandwidth before and after bending, indicating its robustness to bending effects.

3. The Proposed Detection System
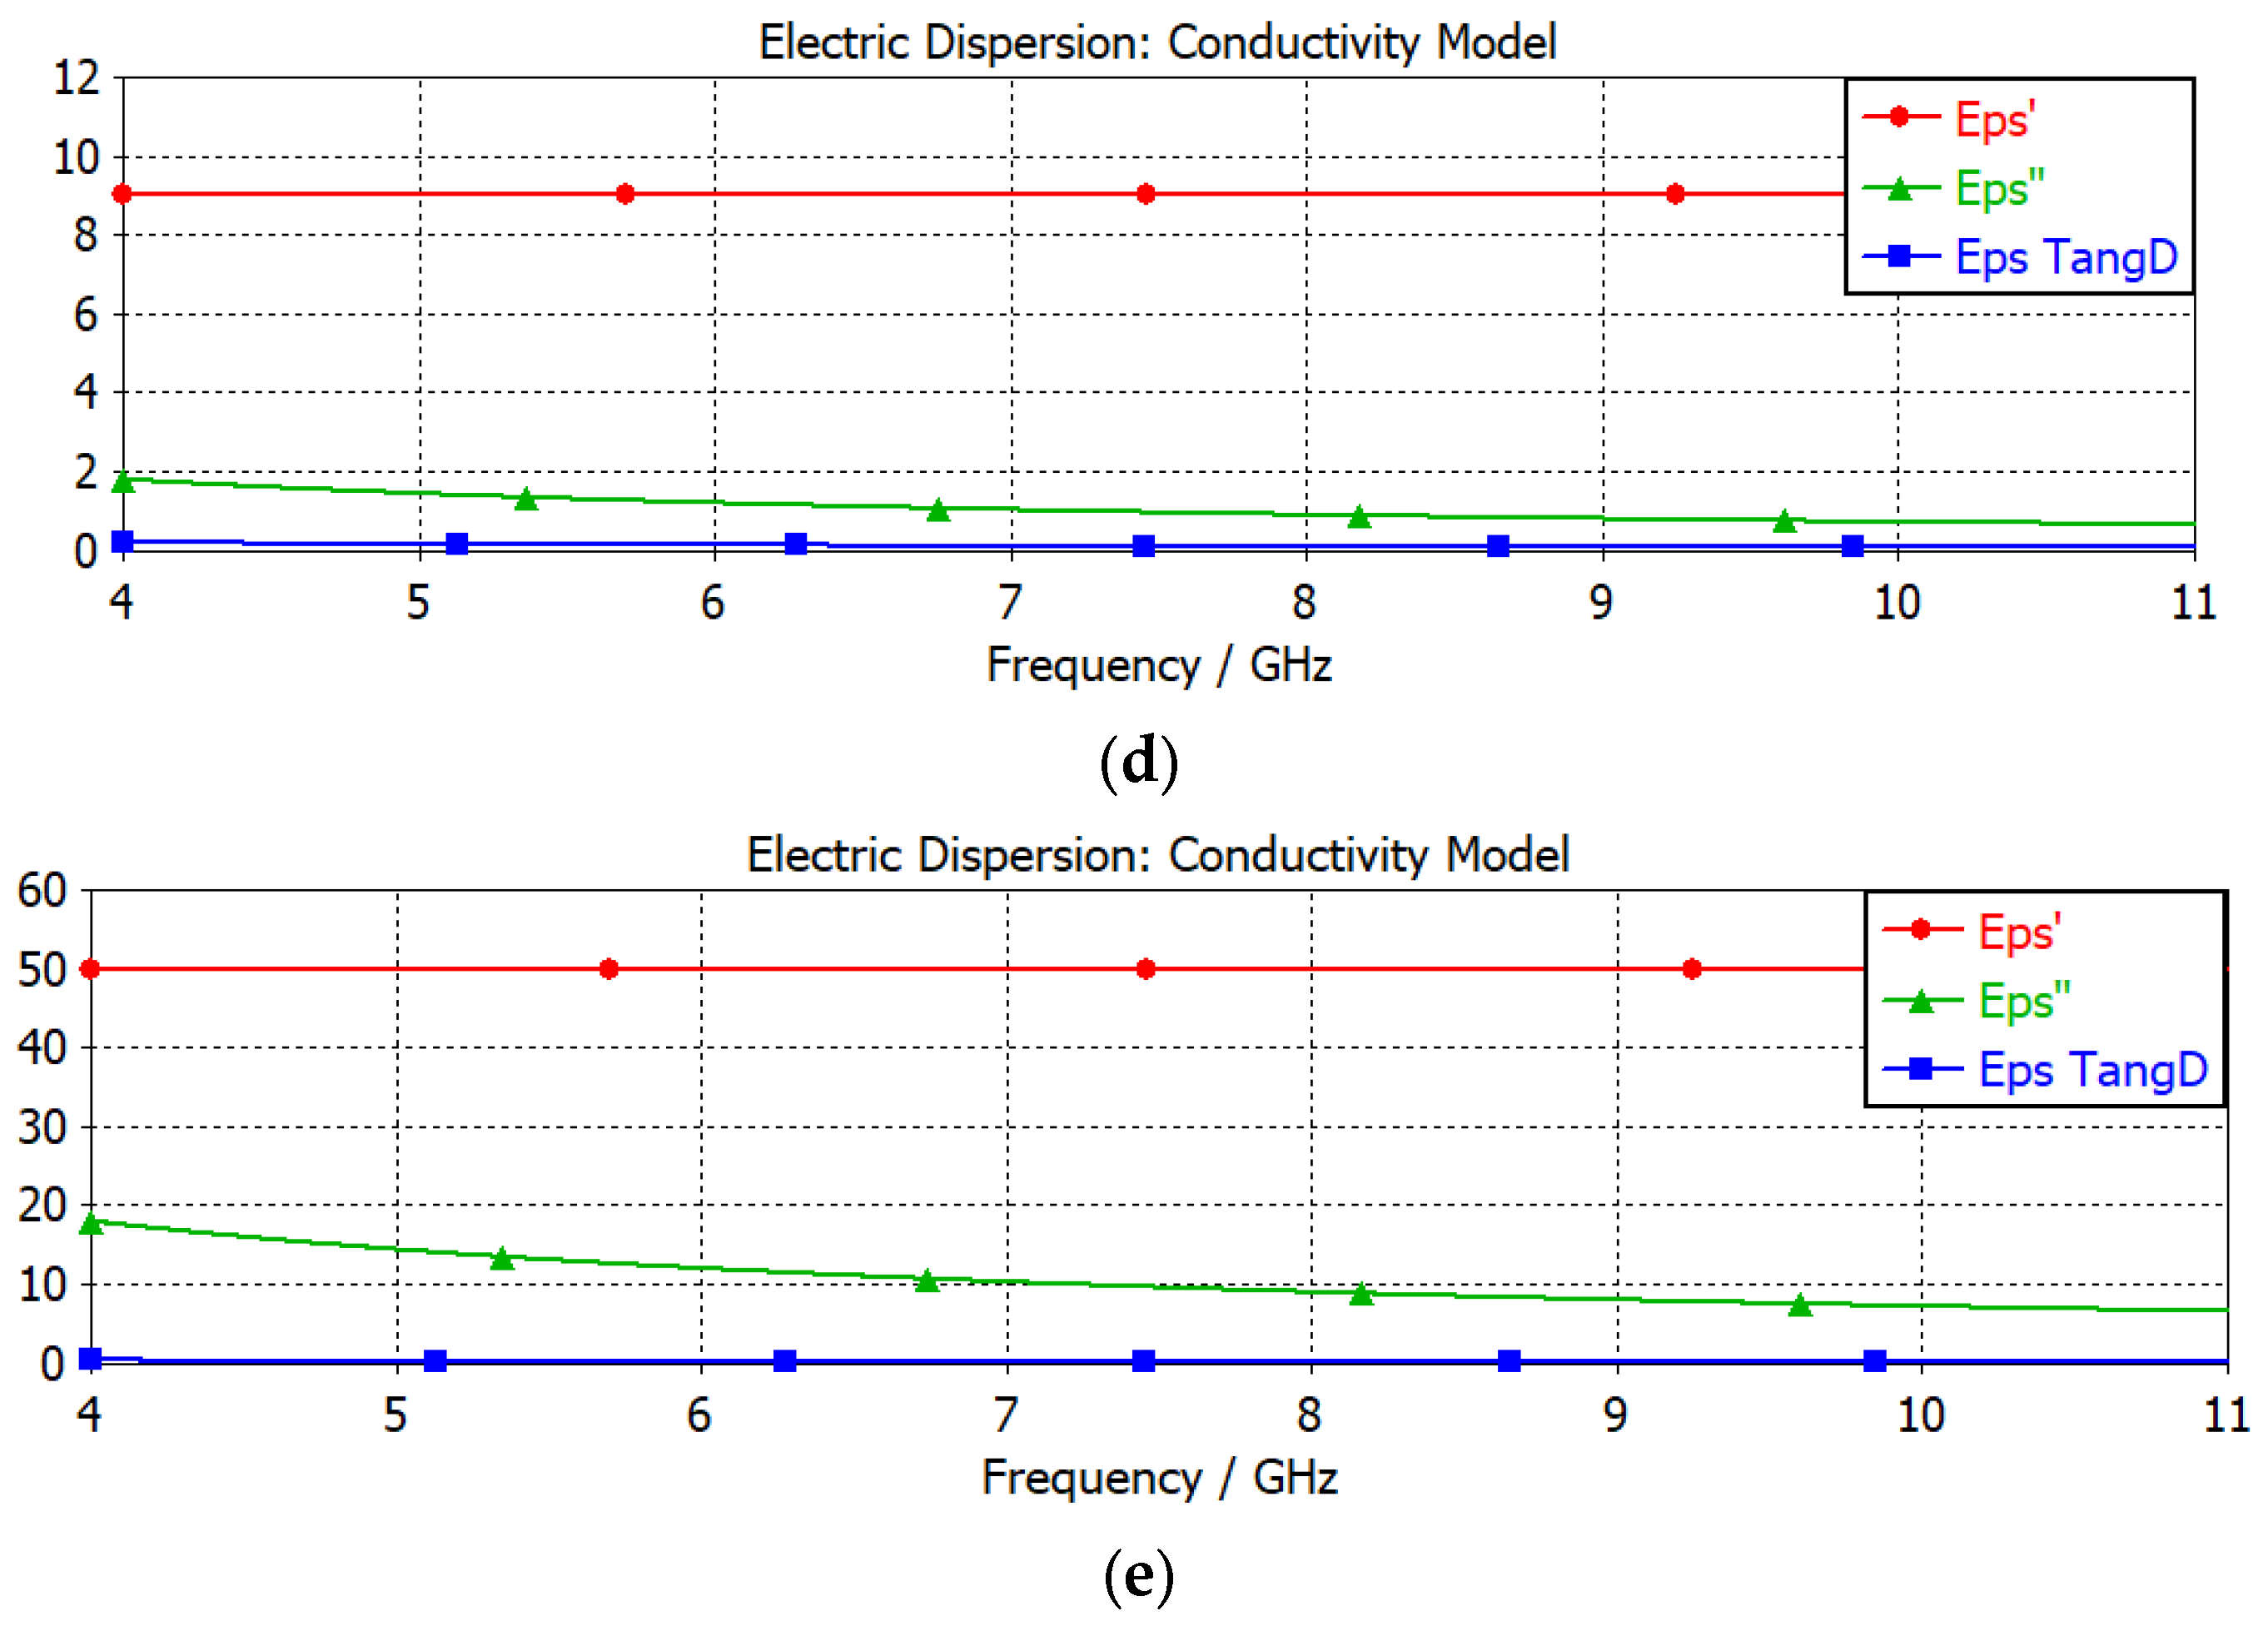
3.1. Breast Phantom

The breast phantom used in this study possesses a three-dimensional hemispheric structure and employs a heterogeneous composition to accurately represent the various layers of breast tissue, including the skin, fat, glandular tissues, and tumors. This heterogeneous phantom consists of multiple layers, as depicted in Figure 7 The dimensions of each layer, including the thickness (T), outer radius (Rout in mm), and inner radius (Rin in mm), are presented in Table 4. Additionally, Table 5 provides the electromagnetic parameters for each breast layer, including the relative permittivity (εr), conductivity (σ), density (ρ), specific heat capacity (cp), and thermal conductivity (k) [23,24].
Figure 7 illustrates the dispersive properties of each phantom layer in terms of complex permittivity. The real part of the permittivity (Eps′) and the imaginary part (Eps″) are shown, along with the loss tangent (Eps D), which indicates the frequency dependency of the imaginary part. These parameters are crucial in the simulation process to ensure that the breast phantom closely resembles the real-life scenario, capturing the frequency-dependent behavior of the breast tissue layers.

3.2. Antenna Array Setup

In this study, the human breast is surrounded by four antenna elements, with each antenna positioned at a distance of 8.6 mm from the breast skin. The bending radius of the antennas is not considered, and antennas 1 and 3 are positioned opposite to each other, while antennas 2 and 4 are also placed in opposition. Figure 8 provides a visual representation of the proposed detection scheme, showing the perspective and top-side placements of the antennas in relation to the breast phantom.
To facilitate the detection process, a mechanical system is proposed, resembling a rotating bed with a hollow semi-spherical Dacron cavity positioned appropriately to align with the patient’s breast. As illustrated in Figure 8c,d, the proposed system is securely fixed within the Dacron cavity, while the bed is prepared for rotation. Once the tumor detection is confirmed, the system halts the rotation and begins to move longitudinally until the precise position of the tumor is identified. This mechanism allows for the accurate localization of the tumor within the breast.

4. Results and Discussion

4.1. Tumor Detection Results

The primary objective of this section is to detect and localize tumors within the glandular tissue of the human breast, as this is where breast cancer typically originates, and early detection in this region can help to prevent its spread. The following steps were taken to achieve this goal.
Step 1 involved operating the proposed system on healthy breast tissues without tumors and measuring the scattering coefficients of the four suggested antennas. These coefficients were then compared with the scattering coefficients obtained from unhealthy tissues containing tumors.
In Step 2, the glandular layer of the hypothetical breast was divided into four quadrants (I, II, III, and IV). A tumor was simulated only in the first quadrant of the proposed system, and the S-parameters were recorded for analysis.
Step 3 focused on moving the tumor from the first quadrant to the second quadrant, simulating the system accordingly, and recording the outcomes. Four simulations were conducted for each of the four tumor sites (P1 in quadrant I, P2 in quadrant II, P3 in quadrant III, and P4 in quadrant IV). Figure 9 illustrates the locations of the tumors and the phantom quadrants.
Table 6 and Figure 10 present the reflection coefficient and coupling coefficients (S11, S21, S31, and S41) for healthy breast tissue and the four tumor locations in unhealthy tissue, respectively. It is important to note that the proposed scenario always searches for the first minimum in the reflection and coupling coefficients.
The frequencies F1 and F2 of the first minimum are determined and compared using the detection parameter ℵ = F1/F2. If ℵ < 1, it indicates the absence of a tumor, as depicted in Figure 10a, where F1 = 2.81 GHz, F2 = 2.88 GHz, and < 1. If ≥ 1, the presence of a tumor is confirmed, and the localization stage follows.
In the localization stage, antenna 1 transmits signals, while the other three antennas receive signals. By examining the coupling coefficients S21 and S41 for the first minimum and considering the 45 dB line as a reference, the position of the tumor can be determined. When the tumor aligns with antennas 1 and 3 and crosses the reference line, as shown in Figure 10b,d, the antenna system is rotated around the breast until this alignment occurs.
Once the alignment is achieved, antennas 1 and 3 stop transmitting or receiving signals, and antenna 2 begins transmitting, while antenna 4 receives. By assessing the coupling coefficients between antennas 2 and 4 and observing their alignment with the tumor, along with the 50 dB line as a reference, the tumor position is detected. If the reference line is never crossed, the tumor is aligned with antennas 2 and 4, as seen in Figure 11h.
By following this detection and localization approach, the proposed system can effectively identify the presence and position of tumors within the glandular tissue of the human breast. A flow chart of the detection scenario is shown in Figure 12.

4.2. SAR Results

According to Faraday’s law, when a coil’s magnetic field interacts with tissues in the body, it induces radio frequency energy, leading to the generation of an electric field within the tissues. This radio frequency energy is absorbed by the tissues and converted into heat [25]. Exposure to radiofrequency radiation can potentially have health impacts due to tissue heating, and these effects can be monitored and managed using a parameter called the specific absorption rate (SAR) [26,27].
The SAR is a measurement of how quickly biological tissues absorb radio frequency power when exposed to RF radiation. To calculate the SAR value, the IEEE Standard 1528 [28] requires the consideration of a volume, either 1 g or 10 g in mass, which is cubical in shape and includes the peak electric field. The local SAR, denoted as S A R l o c a l   r , ω represents the SAR value at each position inside the phantom tissues and is expressed in units of watts per kilogram (W/kg) [29,30]. It can be defined as follows:
S A R l o c a l   r , ω = σ r , ω E r , ω 2 2 ρ r
Here, σ(r,ω) represents the conductivity of the phantom material in siemens per meter (S/m), ρ(r) is the mass density of the tissue in kilograms per cubic meter (kg/m3), r is the position vector, ω is the frequency, and E(r,ω) represents the electric field in volts per meter (V/m).
The average SAR denoted as S A R a v e r a g e   r , ω is obtained by dividing the mass of the cube by the integral of the local SAR at each point on the cube. It can be calculated using the following equation:
S A R a v e r a g e   r , ω = 1 v σ r , ω E r , ω 2 2 ρ r d r
In Equation (6), v represents the volume of the cube.
To analyze the SAR in the heterogeneous phantom, the CST software is employed in the biomedical context. At a frequency of 2.8 GHz, an input power of 0.5 watts is considered at the antenna input. The spatial average SAR values for volumetric samples of 1 g and 10 g in the heterogeneous phantoms are investigated at this frequency. The results depicted in Figure 13 demonstrate that at 2.8 GHz and a 0.5-watt input power, the highest spatial average SAR values for the 1 g and 10 g samples in the phantom are 0.804 W/kg and 1.75 W/kg, respectively.
Regulatory bodies such as the Federal Communications Commission (FCC) have established maximum restrictions for the SAR. In the United States, the limit is set at a maximum average SAR of 1.6 W/kg over a 1 g volume, while in Europe, the standard is 2 W/kg averaged over a 10 g volume. The obtained SAR values in the study remain below these regulatory restrictions.

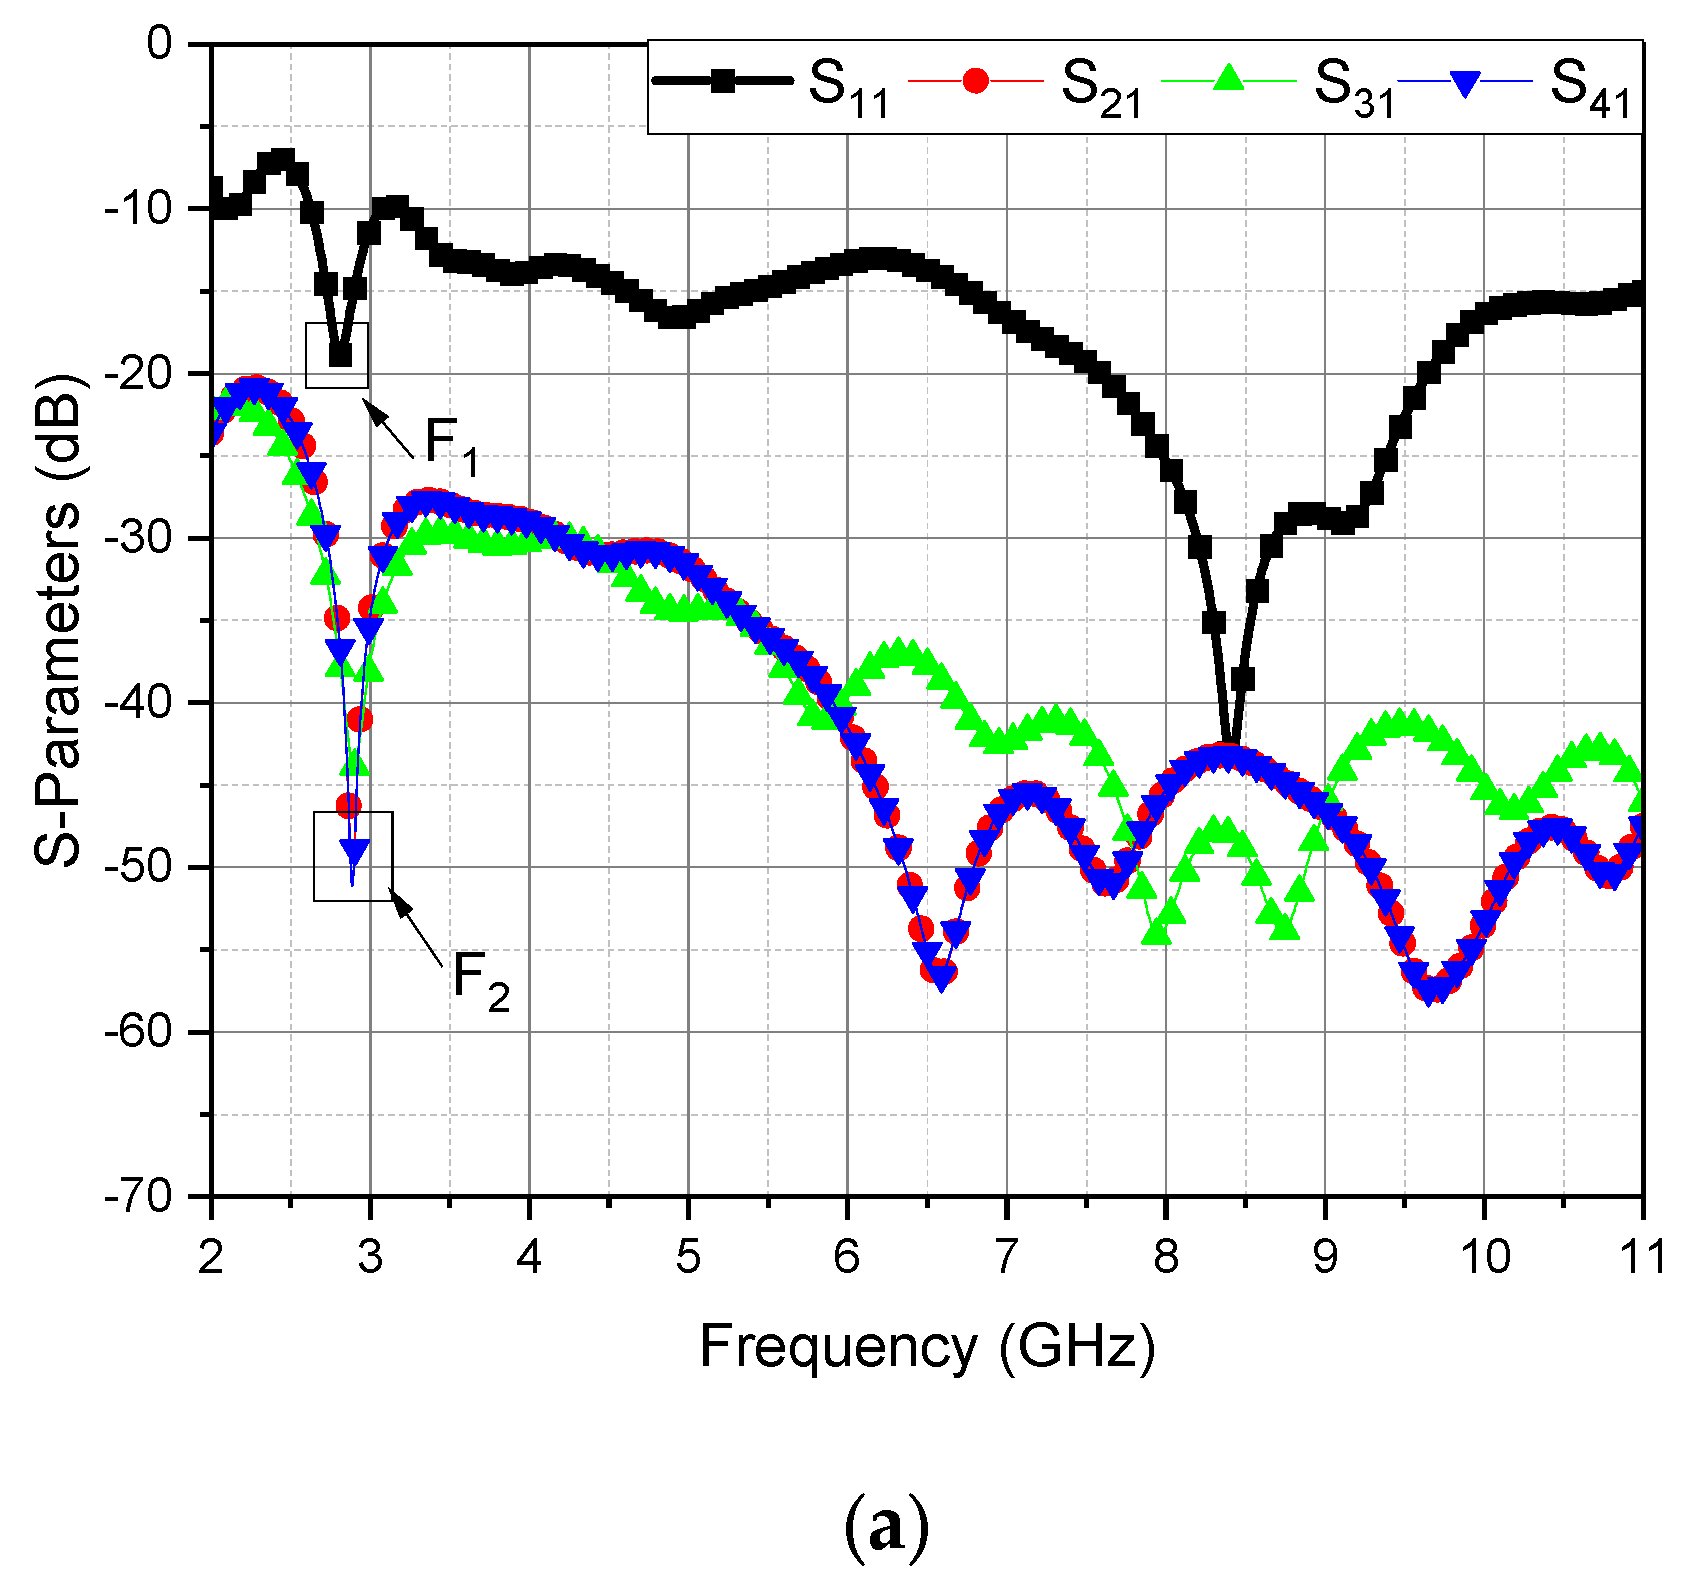
4.3. Diversity Performance

The MIMO performance of the suggested antenna is justified by calculating the diversity performance parameters (ECC, DG) [31,32]. Based on the S-parameters calculation, the ECC can be obtained using Equation (7).
E C C = S n n * S n m + S m n * S m m 2 1 ( S n n 2 + S m n 2 1 S m m 2 + S n m 2 )
Also, the ECC can be calculated from the following:
E C C = 4 π G i θ , ϕ × G j θ , ϕ d Ω 2 4 π G i θ , ϕ 2 d Ω   4 π G j θ , ϕ 2 d Ω
where G i θ ,   φ denotes the radiation pattern in three dimensions that results from the excitation of the ith antenna, G j θ ,   φ denotes the radiation pattern in three dimensions that results from the excitation of the jth antenna, and denotes the solid angle. To obtain a good MIMO performance, the E C C value of the antenna should be less than 0.5 as per the International Telecommunication Union (ITU) standard. For the proposed MIMO antenna, the value of correlation is less than 0.00375 for the entire operating frequency bands, as demonstrated in Figure 14a, which makes it a suitable MIMO antenna under the designated bands. The diversity gain is also calculated using Equation (9). The accepted diversity gain value is very close to 10. From Figure 14b, it is observed that the proposed MIMO antenna has a diversity gain of almost 10 for the operating frequency bands.
D G = 10 1 E C C 2

5. Conclusions

This paper presents a comprehensive study on the design, implementation, and evaluation of a wearable UWB antenna array for the detection of cancerous tissues in the human breast. The proposed antenna configuration consists of a four-element wearable circular UWB MIMO antenna array with reflector cavities. The frequency range of the antenna spans from 2.57 GHz to 12.6 GHz. The performance of the developed antenna is validated through simulations and measurements, showing good agreement. The suggested antenna design exhibits several favorable characteristics, including a well-defined beamwidth, high gain, and high directivity. These features contribute to the accurate identification and localization of tumors within the breast. To evaluate the detection capabilities, a heterogeneous breast phantom with a 10 mm tumor radius is utilized. The proposed antenna array demonstrates promising results in terms of tumor identification and localization. Furthermore, the paper investigates the specific absorption rate (SAR) associated with the antenna system. The SAR analyses are conducted using 1 g and 10 g standards, which assess the absorption of radio frequency power by biological tissues. The results indicate that the suggested antennas comply with the SAR standards, highlighting their suitability for the early detection and localization of breast cancer. It is important to note that the proposed detection scenario in this study focuses on the presence of a single tumor. Future work will involve adapting the proposed working principle to detect multiple tumors, expanding the applicability and potential impact of the antenna array in breast cancer diagnosis.

Author Contributions

T.G.A. raised the idea, performed the numerical simulations, and wrote the manuscript draft; T.G.A., E.K.I.H., S.A.K. and B.B. revised the manuscript, performed the theoretical analysis, discussed the numerical results in the main manuscript, contributed to the simulation results and the validation, and improved the revised version. All authors have read and agreed to the published version of the manuscript.

Funding

This research received no external funding.

Institutional Review Board Statement

Not applicable.

Informed Consent Statement

Not applicable.

Data Availability Statement

All the data are included in the study.

Conflicts of Interest

The authors declare no conflict of interest.

References

  1. World Health Organization. WHO Report on Cancer: Setting Priorities, Investing Wisely and Providing Care for All; World Health Organization: Geneva, Switzerland, 2020.
  2. DeSantis, C.; Ma, J.; Gaudet, M.M.; Newman, L.A.; Miller, K.D.; Goding Sauer, A.; Jemal, A.; Siegel, R.L. Breast cancer statistics. CA Cancer J. Clin. 2019, 69, 438–451. [Google Scholar] [CrossRef] [PubMed] [Green Version]
  3. Narod, S.A. Tumour size predicts long-term survival among women with lymph node-positive breast cancer. Curr. Oncol. 2012, 19, 249–253. [Google Scholar] [CrossRef] [PubMed] [Green Version]
  4. Miller, A.B.; Wall, C.; Baines, C.J.; Sun, P.; To, T.; Narod, S.A. Twenty five year follow-up for breast cancer incidence and mortality of the Canadian National Breast Screening Study: Randomised screening trial. BMJ 2014, 348, g366. [Google Scholar] [CrossRef] [Green Version]
  5. El Misilmani, H.M.; Naous, T.; Al Khatib, S.K.; Kabalan, K.Y. A Survey on Antenna Designs for Breast Cancer Detection Using Microwave Imaging. IEEE Access 2020, 8, 102570–102594. [Google Scholar] [CrossRef]
  6. Bahrami, H.; Porter, E.; Santorelli, A.; Gosselin, B.; Popovic, M.; Rusch, L.A. Flexible Sixteen Monopole Antenna Array for Microwave Breast Cancer Detection. In Proceedings of the 36th Annual International Conference of the IEEE Engineering in Medicine and Biology Society, Chicago, IL, USA, 26–30 August 2014; pp. 3775–3778. [Google Scholar]
  7. Bahramiabarghouei, H.; Porter, E.; Santorelli, A.; Gosselin, B.; Popovic, M.; Rusch, L.A. Flexible 16 Antenna Array for Microwave Breast Cancer Detection. IEEE Trans. Biomed. Eng. 2015, 62, 2516–2525. [Google Scholar] [CrossRef]
  8. Porter, E.; Bahrami, H.; Santorelli, A.; Gosselin, B.; Rusch, L.A.; Popovic, M. A Wearable Microwave Antenna Array for Time-Domain Breast Tumor Screening. IEEE Trans. Med Imaging 2016, 35, 1501–1509. [Google Scholar] [CrossRef] [Green Version]
  9. Rashid, M.U.M.; Rahman, A.; Paul, L.C.; Rafa, J.; Podder, B.; Sarkar, A.K. Breast Cancer Detection & Tumor Localization Using Four Flexible Microstrip patch antennas. In Proceedings of the International Conference on Computer, Communication, Chemical, Materials, and Electronic Engineering (IC4ME2), Rajshahi, Bangladesh, 11–12 July 2019. [Google Scholar]
  10. Fawzy, A.; Cetin, K. Wearable Microstrip Patch Ultra-Wide Band Antenna for Breast Cancer Detection. In Proceedings of the 41st International Conference on Telecommunications and Signal Processing (TSP), Athens, Greece, 4–6 July 2018. [Google Scholar]
  11. Afyf, A.; Bellarbi, L.; Achour, A.; Yaakoubi, N.; Errachid, A.; Sennouni, M.A. UWB Thin Film Flexible Antenna for Microwave Thermography for Breast Cancer. In Proceedings of the International Conference on Electrical and Information Technologies (ICEIT), Tangiers, Morocco, 4–7 May 2016. [Google Scholar]
  12. Afyf, A.; Elouerghi, A.; Afyf, M.; Sennouni, M.A.; Bellarbi, L. Flexible Wearable Antenna for Body Centric Wireless Communication in S-Band. In Proceedings of the International Conference on Electrical and Information Technologies (ICEIT), Rabat, Morocco, 4–7 March 2020. [Google Scholar]
  13. El Vadel, L.A.; Konditi, D.B.; Mbango, F.M. A Miniaturized Antenna for Breast Cancer Detection at the 5.72–5.82 GHz ISM Band Based on the DGS Technique. Prog. Electromagn. Res. B 2023, 98, 87–105. [Google Scholar] [CrossRef]
  14. Alsaidosh, Y.; Fiebich, M.; Mohammed, H.; Haji, A. Early detection of breast cancer using microwave imaging. Proc. Autom. Med. Eng. 2023, 2, 761. [Google Scholar]
  15. Elsheakh, D.M.; Alsherif, S.A.; Eldamak, A.R. Textile monopole sensors for breast cancer detection. Telecommun. Syst. 2023, 82, 363–379. [Google Scholar] [CrossRef]
  16. Çalışkan, R.; Sinan Gültekin, S.; Uzer, D.; Dündar, Ö. A microstrip patch antenna design for breast cancer detection. Procedia-Soc. Behav. Sci. 2015, 195, 2905–2911. [Google Scholar] [CrossRef] [Green Version]
  17. Wang, L. Microwave Sensors for Breast Cancer Detection. Sensors 2018, 18, 655. [Google Scholar] [CrossRef] [PubMed] [Green Version]
  18. Wang, X.; Yang, L.T.; Meng, D.; Dong, M.; Ota, K.; Wang, H. Multi-UAV Cooperative Localization for Marine Targets Based on Weighted Subspace Fitting in SAGIN Environment. IEEE Internet Things J. 2022, 9, 5708–5718. [Google Scholar] [CrossRef]
  19. Abbosh, A.M.; Kan, H.K.; Bialkowski, M.E. Compact ultra-wideband planar tapered slot antenna for use in a microwave imaging system. Microw. Opt. Technol. Lett. 2006, 48, 2212–2216. [Google Scholar] [CrossRef]
  20. Abbosh, A.M. Directive Antenna for Ultrawideband Medical Imaging Systems. Int. J. Antennas Propag. 2008, 2008, 854012. [Google Scholar] [CrossRef]
  21. Pozar, D.M. Microwave Engineering, 4th ed.; John Wiley & Sons: New York, NY, USA, 2011. [Google Scholar]
  22. Chen, S.J.; Chivers, B.; Shepherd, R.; Fumeaux, C. Bending Impact on A Flexible Ultra-Wideband Conductive Polymer Antenna. In Proceedings of the International Conference on Electromagnetics in Advanced Applications (ICEAA), Turin, Italy, 7–11 September 2015. [Google Scholar]
  23. Wen, F.; Shi, J.; Gui, G.; Gacanin, H.; Dobre, O.A. 3-D Positioning Method for Anonymous UAV Based on Bistatic Polarized MIMO Radar. IEEE Internet Things J. 2023, 10, 815–827. [Google Scholar] [CrossRef]
  24. Tayel, M.B.; Abouelnaga, T.G.; Badran, N.M. Localization of Breast Tumor Using Four Elements UWB Wearable Antenna. Appl. Comput. Electromagn. Soc. J. 2022, 37, 1021–1030. [Google Scholar] [CrossRef]
  25. Fiedler, T.M.; Ladd, M.E.; Bitz, A.K. SAR Simulations & Safety. Neuroimage 2017, 168, 33–58. [Google Scholar]
  26. Abdel-Haleem, M.R.; Abouelnaga, T.; Abo-Zahhad, M.; Ahmed, S.M. Enhancing microwave breast cancer hyperthermia therapy efficiency utilizing fat grafting with horn antenna. Int. J. RF Microw. Comput. Aided Eng. 2021, 31, e22651. [Google Scholar] [CrossRef]
  27. Nguyen, P.T.; Abbosh, A.M.; Crozier, S. Thermo-Dielectric Breast Phantom for Experimental Studies of Microwave Hyperthermia. IEEE Antennas Wirel. Propag. Lett. 2015, 15, 476–479. [Google Scholar] [CrossRef]
  28. IEC/IEEE 62704-2:2017; Determining the Peak Spatial-Average Specific Absorption Rate (SAR) in the Human Body from Wireless Communications Devices, 30 MHz to 6 GHz—Part 1: General Requirements for Using the Finite-Difference Time-Domain (FDTD) Method for SAR Calculations. IEC: Geneva, Switzerland, 2017.
  29. Abouelnaga, T.G.; Zewail, I.; Shokair, M. Design of 10 × 10 Massive MIMO Array in Sub-6GHz Smart Phone for 5G Applications. Prog. Electromagn. Res. B 2021, 91, 97–114. [Google Scholar] [CrossRef]
  30. Zaki, A.Z.; Hamad, E.K.; Abouelnaga, T.G.; Elsadek, H.A. Design of ultra-compact ISM band implantable patch antenna for biomedical applications. Int. J. Microw. Wirel. Technol. 2022, 14, 1279–1288. [Google Scholar] [CrossRef]
  31. Altaf, A.; Iqbal, A.; Smida, A.; Smida, J.; Althuwayb, A.A.; Hassan Kiani, S.; Alibakhshikenari, M.; Falcone, F.; Limiti, E. Isolation Improvement in UWB-MIMO Antenna System Using Slotted Stub. Electronics 2020, 9, 1582. [Google Scholar] [CrossRef]
  32. Abouelnaga, T.; Abdallah, E. Isolation Enhancement of UWB MIMO rDRA for 5G Outdoor Applications. Int. J. Commun. Antenna Propag. 2022, 12, 302. [Google Scholar] [CrossRef]
Figure 1. Development steps of the suggested modified antipodal Vivaldi UWB antenna.
Applsci 13 08067 g001aApplsci 13 08067 g001b
Figure 2. (a) Reflection coefficient S 11 of the four developed antenna stages and (b) input impedance of the fourth antenna stage.
Applsci 13 08067 g002
Figure 3. The fabricated modified antipodal Vivaldi UWB antenna; (a) top view and (b) bottom view.
Applsci 13 08067 g003
Figure 4. The measured and simulated reflection coefficients S 11 of the modified UWB antipodal Vivaldi antenna.
Applsci 13 08067 g004
Figure 5. The 2D flat antenna bends with 50, 60, 70, 80, 90, and 100 mm radii. (a) Horizontal bending; (b) vertical bending.
Applsci 13 08067 g005
Figure 6. The reflection coefficient results of different bending radii with (a) horizontal bending and (b) vertical bending.
Applsci 13 08067 g006
Figure 7. (a) Phantom schematic, and dispersive properties of (b) glandular, (c) skin, (d) fat, and (e) tumor tissues.
Applsci 13 08067 g007aApplsci 13 08067 g007b
Figure 8. (a) Perspective view without a cavity, (b) top view without a cavity, (c) top view with Dacron cavity, and (d) side view with Dacron cavity of the detection system.
Applsci 13 08067 g008aApplsci 13 08067 g008b
Figure 9. The phantom splitting and the positions of the tumor.
Applsci 13 08067 g009
Figure 10. S-parameters at (a) no tumor and tumor at (b) P1, (c) P2, (d) P3, and (e) P4.
Applsci 13 08067 g010aApplsci 13 08067 g010b
Figure 11. The coupling coefficients S22 and S42 for the proposed detection system. (a) Antennas at phantom center; (b) antennas at 35 mm from the phantom center; (c) S-parameters of antennas at phantom center; (d) S-parameters of antennas at 35 mm from the phantom center; (e) antennas at 20 mm from the phantom center; (f) antennas at 28 mm from the phantom center; (g) S-parameters of antennas at 20 mm from the phantom center; (h) S-parameters of antennas at 28 mm from the phantom center.
Applsci 13 08067 g011
Figure 12. Detection scenario flow chart of the proposed system.
Applsci 13 08067 g012
Figure 13. The maximum spatial average SAR value using 1 g at 2.8 GHz; (a) 1 g, (b) 10 g.
Applsci 13 08067 g013
Figure 14. (a) ECC and (b) DG characteristics of the proposed MIMO antenna.
Applsci 13 08067 g014
Table 1. Comparison of several antennas that facilitate early breast tumor detection.
Ref. L × W   mm 2 n ε r h   m m L / λ BW (GHz) f / f 0
[6] 18 × 18 16 3.5 0.10.2502–50.86
[7] 20 × 20 16 3.5 0.10.2802–40.67
[8] 20 × 20 16 3.5 0.10.2802–40.67
[9] 58.43 × 26.45 4 2.64 2.20.4701.45–1.540.06
[10] 70 × 60 2 1.6 1.60.7401.6–11.21.5
[11] 22 × 20 1 3.5 0.050.4102–40.67
[12] 25 × 36 1 3.4 0.160.7302–40.67
[13] 12 × 12 14.410.235.6–5.880.05
[14] 52 × 26 14.31.60.621.86–17.774.6
[15] 50 × 50 11.422.42–82.4
[16] 65.4 ×   88.99 14.41.5880.73--
[17] 51.5 × 46.2 163.380.8130.392–51.36
This work 42.85 × 42.85 4 3 1.5240.4052.57–12.63.53
L is the antenna length, W is the antenna width, n is the number of elements, ε r is the relative dielectric constant, h is the substrate height, L / λ is the ratio of the physical antenna length to the resonance wavelength, BW is the bandwidth, and f / f 0 is the fractional bandwidth.
Table 2. Suggested antenna dimensions.
P a r . W s u b W 1 W 2 W 3 W 4 W 5
D i m .   mm 42.85 5 7 5 1.8 30
P a r . L s u b L 1 L 2 L 3 L 4
D i m .   mm 42.85177 14 3
Table 3. The comparison of the planned wearable UWB antenna’s developmental stages.
Step 1Step 2Step 3Step 4
Antenna ShapeApplsci 13 08067 i001Applsci 13 08067 i002Applsci 13 08067 i003Applsci 13 08067 i004
Resonant Frequencies (GHz)23.192.722.84
5.75.273.553.87
-7.375.485.83
9.558.78.128.24
Bandwidth (GHz)1.68–2.5, 8.9–10.22.8–3.9, 4.54–112.4–10.62.57–12.6
Gain (dBi)3.77.064.745.49
11.811.89.049.87
-13.311.1411.9
12.414.5514.514.7
Directivity (dBi)4.147.476.87.3
12.212.349.4810.3
-14.111.712.3
13.315.615.515.4
3 dB BW (degree) of XY Plane80.976.762.667.5
68.376.876
58.751.787.679.2
70.246.84343.3
Radiation
Efficiency (%)
90.439162.1765.9
9088.990.3791.3
-83.988.5289.6
80.979.380.5385.4
Total Efficiency
(%)
85.790.1261.8965.8
81.788.490.1990.2
-83.888.4789.6
80.879.380.3785.4
XY—Plane1st Resonant FrequencyApplsci 13 08067 i005Applsci 13 08067 i006Applsci 13 08067 i007Applsci 13 08067 i008
2nd Resonant FrequencyApplsci 13 08067 i009Applsci 13 08067 i010Applsci 13 08067 i011Applsci 13 08067 i012
3rd Resonant Frequency-Applsci 13 08067 i013Applsci 13 08067 i014Applsci 13 08067 i015
4th Resonant FrequencyApplsci 13 08067 i016Applsci 13 08067 i017Applsci 13 08067 i018Applsci 13 08067 i019
YZ—Plane1st Resonant FrequencyApplsci 13 08067 i020Applsci 13 08067 i021Applsci 13 08067 i022Applsci 13 08067 i023
2nd Resonant FrequencyApplsci 13 08067 i024Applsci 13 08067 i025Applsci 13 08067 i026Applsci 13 08067 i027
3rd Resonant Frequency-Applsci 13 08067 i028Applsci 13 08067 i029Applsci 13 08067 i030
4th Resonant FrequencyApplsci 13 08067 i031Applsci 13 08067 i032Applsci 13 08067 i033Applsci 13 08067 i034
3D1st Resonant FrequencyApplsci 13 08067 i035Applsci 13 08067 i036Applsci 13 08067 i037Applsci 13 08067 i038
2nd Resonant FrequencyApplsci 13 08067 i039Applsci 13 08067 i040Applsci 13 08067 i041Applsci 13 08067 i042
3rd Resonant Frequency-Applsci 13 08067 i043Applsci 13 08067 i044Applsci 13 08067 i045
4th Resonant FrequencyApplsci 13 08067 i046Applsci 13 08067 i047Applsci 13 08067 i048Applsci 13 08067 i049
Table 4. Dimensions of the various layers of the breast.
Tissues T   mm R o u t mm R i n   mm
Skin 5 60 55
Fat 15 55 40
Glandular 40 40 0
Table 5. The suggested phantom’s electromagnetic parameters.
TissuesDielectric Properties𝜌 (kg/m3)𝑐𝑝 (J/K/kg)𝑘 (W/K/m)
ε r σ   S / m
Skin364108537650.4
Fat90.4106922790.3
Glandular11–150.4–0.5105036000.5
Tumor504105036000.5
Table 6. The five cases’ reflection coefficients.
No
Tumor
Tumor Positions
P1P2P3P4
Detection   parameter   = F 1 / F 2 < 1 > 1 > 1 > 1 > 1
S11 (dB @ GHz)18.8 @ 2.817.47 @ 2.82 15 @ 2.8317.55 @ 2.8213.7 @ 2.83
S21 (dB)48.8 @ 2.954.56 @ 2.7840 @ 2.7854.8 @ 2.7840 @ 2.78
S31 (dB)43.8 @ 2.941.5 @ 2.7835 @ 2.7841.5 @ 2.7835 @ 2.78
S41 (dB)48.8 @ 2.954.56 @ 2.7840 @ 2.7854.8 @ 2.7840 @ 2.78
Disclaimer/Publisher’s Note: The statements, opinions and data contained in all publications are solely those of the individual author(s) and contributor(s) and not of MDPI and/or the editor(s). MDPI and/or the editor(s) disclaim responsibility for any injury to people or property resulting from any ideas, methods, instructions or products referred to in the content.

