Article

Numerical and Experimental Investigation of Flow Characteristics in a Fluid Self-Lubricating Centrifugal Pump with R134a Refrigerant

1
School of Energy and Power Engineering, Xi’an Jiaotong University, Xi’an 710049, China
2
MOE Key Laboratory of Cryogenic Technology and Equipment, Xi’an Jiaotong University, Xi’an 710049, China
*
Author to whom correspondence should be addressed.
Appl. Sci. 2023, 13(14), 8062; https://doi.org/10.3390/app13148062
Submission received: 13 June 2023 / Revised: 5 July 2023 / Accepted: 7 July 2023 / Published: 10 July 2023
(This article belongs to the Special Issue Computational Fluid Dynamics and Its Engineering Applications)

Abstract

:
With the rapid development of information technology, researchers have paid attention to the pump-driven two-phase cooling loop technology for data centers, which imposes requirements on the efficiency and size of the pump. A fluid self-lubricating centrifugal pump with R134a refrigerant was developed to reach a higher rotation speed and oil-free system, resulting in a more diminutive size. Due to the high rotation speed and refrigerant pressure approaching saturated vapor pressure, the internal flow characteristics and cavitating characteristics are critical and complex. This paper focuses on the prototype’s head and cavitation performance based on experimental and numerical data. The experiments indicated that the head coefficient of the pump under design conditions is 0.9881, and the pump’s critical cavitation number and breakdown number are 0.551 and 0.412, respectively. The numerical results can predict the head and cavitation with deviations less than 2.6%. To study changing patterns in flow characteristics under the different operating conditions in the refrigerant centrifugal pump, the numerical model based on a modified Sauer-Schnerr cavitation model was built to analyze the distributions of pressure, temperature, relative velocity, and bubble volume across every hydraulic component and different degrees of cavitation, and proposed the influence of the thermal effect on refrigerant cavitating. The cavitating flow characteristics were obtained with the aim of providing guidance for the hydraulic design of a refrigerant centrifugal pump.

1. Introduction

The two-phase cooling system is one of the significant prospects for natural cooling technology in data centers [1,2,3]. As the driving equipment in the two-phase system of data centers, the centrifugal pumps play a vital role. Depending on the application of the hydrodynamic bearings in high-speed rotating machinery areas [4,5,6], the pump proposed in the present study is a centrifugal pump that uses working fluid self-lubricating hydrodynamic bearings for support. It directly utilizes the refrigerant from the two-phase cooling system as the lubricating medium, thereby avoiding the contamination of closed systems caused by conventional centrifugal pumps that use oil bearings. Moreover, the centrifugal pump with working fluid self-lubricating bearings can operate at higher speeds, resulting in a higher pump head and significantly reduced volume and mass of the pump [7,8]. However, increasing the rotational speed bring issues such as turbulent flow, higher net positive suction head requirement, and decreased operational stability [9]. In a two-phase cooling system, the centrifugal pump is typically installed in the low-pressure region where the incoming refrigerant pressure is close to the saturation pressure. This proximity to saturation pressure increases the risk of cavitation, resulting in diminished hydraulic performance [10] and operation reliability [11].
Presently, significant progress has been made in the numerical simulation research of centrifugal pump characteristics. Using the energy loss model and CFD method, Xue et al. conducted a numerical simulation of a centrifugal water pump with a low specific speed and accurately predicted the pump’s performance [12,13]. Bai et al. investigated pressure fluctuations theory using a numerical method and studied the intensity of pressure fluctuation in diffuser vanes and impeller blades [14]. Lin et al. introduced a coupling calculation based on a CFD and MATLAB to obtain the flow field distribution and hydraulic performance of high-speed centrifugal pumps [15]. In our previous research [16], we proposed an oil-free pump with water hydrodynamic lubrication and established its numerical model to predict its hydraulic performance and flow characteristics. While the hydraulic performance of a refrigerant pump can be estimated using the empirical parameters of a water pump of the same specifications through the principle of similarity, there is a lack of relevant experimental data validation. Due to the complexity of blade structure and flow within pumps, numerical studies on cavitation flow mostly employ RANS turbulence models for simulation research [17,18]. Medvitz et al. analyzed the energy characteristics of a centrifugal pump during the cavitation development stage using the CFD method [19]. They captured the rapid decrease in head curves under various flow conditions at low cavitation numbers. Fukaya et al. employed a “bubble flow model” to predict the extent of cavitation development by analyzing the pressure and vapor nuclei distribution of bubbles inside the pump, establishing a new numerical simulation criterion [20]. Wang et al. established a computational cavitating flow model to predict the cavitating flow in centrifugal pumps, and the results showed that cavitation influences the pump head drop and bubble structure [21]. Stopa et al. proposed a mathematical tool for detecting the cavitation process in centrifugal pumps using the Load Torque Signature Analysis method [22]. A numerical analysis of the unsteady cavitating flow of a low-specific centrifugal pump was carried out by Cui et al., and the influence of installing an inducer and a jetting device was argued [23]. Franc et al. conducted visualization experiments on cavitation, using Freon-114 and cold water as working fluids, respectively, and confirmed the thermal effects on cavitation [24,25]. Rapposelli et al., based on the Brennen equation, proposed a computational model incorporating cavitation nuclei and conducted cavitation experiments using water as the working fluid in both the FIP inducer and MK1 inducer, studying the influence of thermodynamic effects at different water temperatures on cavitation bubbles [26,27]. In addition, Palgrave and Cooper’s study divided the internal cavitation process of centrifugal pumps into three cavitation states and considered visualization research as one of the necessary methods for exploring cavitation flow [28]. Following their study, numerous researchers have conducted studies on the cavitation performance within pumps using various experimental methods, such as vibration signal monitoring [29,30,31], high-speed shooting techniques [32,33,34,35], and Particle Image Velocimetry (PIV) technology [36,37].
In general, research on pump cavitation performance has mainly focused on cavitating turbulent flows and cavitation characteristics under room temperature conditions, typically using water as the working fluid. However, there are certain differences in the thermal physical properties between refrigerants and water. Studies concerning the internal flow characteristics and cavitation behavior of refrigerant centrifugal pumps under different operating conditions have been very few. This paper focuses on analyzing the distributions of pressure, temperature, relative velocity, and bubble volume in a fluid self-lubricating centrifugal pump with R134a refrigerant under different operating conditions. The objective is to obtain insights into the changing patterns of flow characteristics and the cavitation process in refrigerant centrifugal pumps. The feasibility and stability of the prototype were validated, and the research results can provide guidance for the future design of refrigerant pumps.

2. Centrifugal Pump Structure Design and Testing Experiments

2.1. Pump Structure

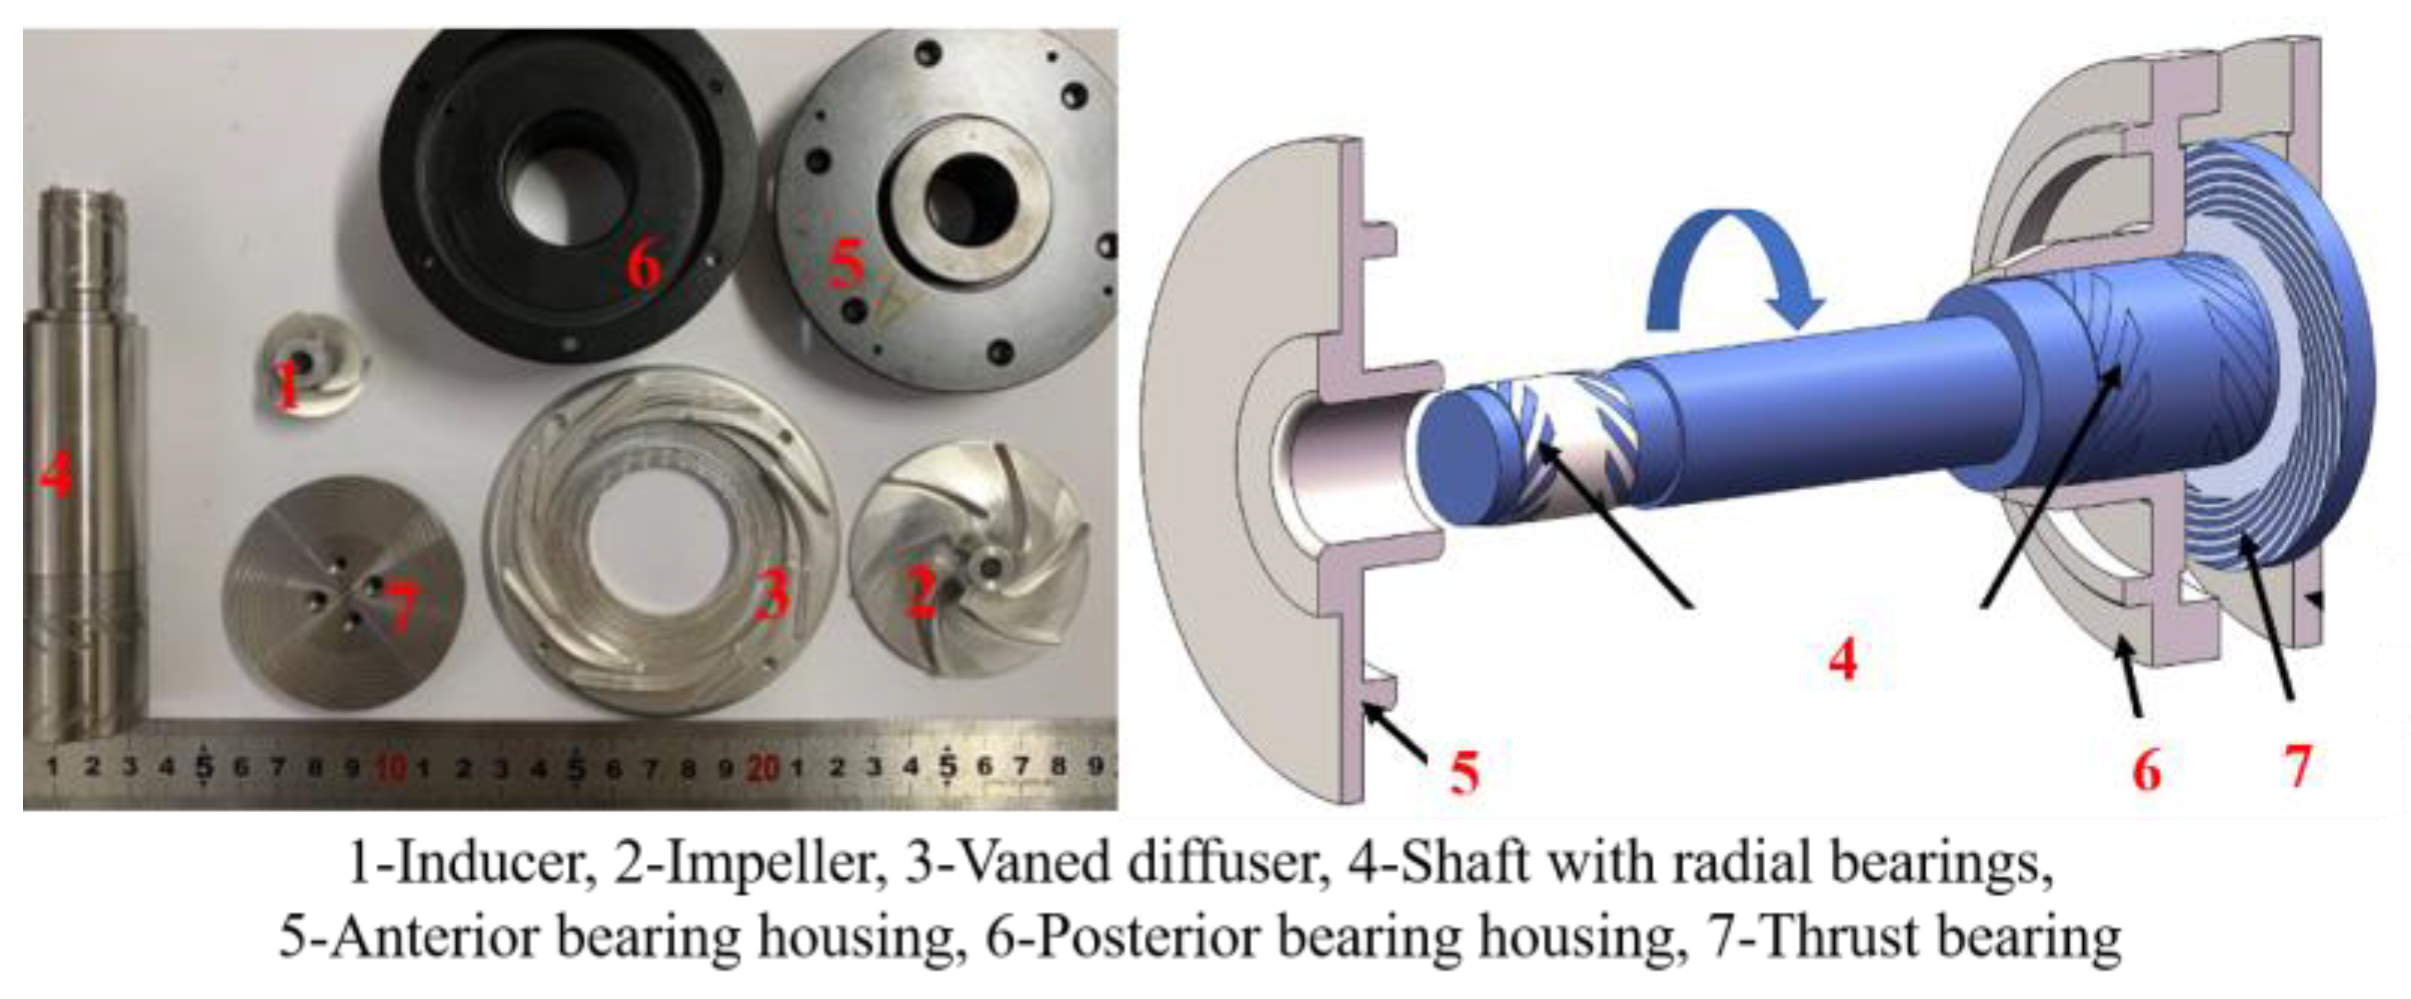
Figure 1 depicts the structure of the centrifugal pump with R134a refrigerant. The pump mainly comprises an inducer, an impeller, a vaned diffuser, hydrodynamic bearings, a high-speed motor, and external shells (as shown in Figure 2). To achieve oil-free rotation at high speeds, a couple of radial hydrodynamic bearings support the shaft that etched herringbone grooves. The thrust bearing used in the working fluid self-lubricating centrifugal pump is a spiral groove bearing. The pumping refrigerant R134a is the lubricant. When the shaft rotates at high speed, the working fluid is sucked into herringbone grooves and is blocked by the dam region. A micron-level high-pressure liquid film is formed between the radial bearing and the bearing housing, and the dynamic fluid pressure provides the bearing capacity of the rotating shaft. Meanwhile, the spiral groove inhales the refrigerant, and the formed liquid film provides axial bearing capacity.
The investigated pump is a single-stage centrifugal pump with an axial flow direction of the working fluid. The refrigerant enters the inducer vertically and is pressurized slightly. Speeded up by the high rotating inducer and impeller, the pressure and the flow velocity of refrigerant increased rapidly. Then, the working fluid enters the vaned diffuser, and the bulk of kinetic energy converts into hydrostatic pressure. The part of the pumping refrigerant flows through the diversion channels of the motor stator and controls the motor temperature. The other part of the refrigerant flows into the bearing housing from the clearance between the impeller and the diffuser as the lubricant to support the main shaft system.
The investigated pump is designed for a volume flow rate of Qd = 3.5 m3/h (the subscript character “d” represents the design condition), pump head Hd = 35 m, and the revolution speed n = 7500 rpm. Table 1 shows the detailed dimensions of the pump’s hydraulic components.

2.2. Testing Experiment

2.2.1. Test Rig

Figure 3 illustrates a closed test rig established to investigate the hydraulic and dynamic pump performance. During testing, the refrigerant tank provides the liquid fluid for the investigated pump. An air-cooled chiller with a water loop system maintains the system’s refrigerant temperature. The vortex flowmeter measures the flow rate (the range is 0.417~4.17 L/s, and the error is ±0.2 FS%). The drifted refrigerant reservoir provides different net positive suction heads (NPSHA) by lifting. The pressure transmitters are positioned at both the inlet and outlet of the prototype pump. The pressure measurement range and error are 0~1.6 MPa and ±0.25 FS%, respectively. The calibrated T-type thermocouple measures the refrigerant temperature, and the error is ±0.15 K.
The pump head can be calculated by the following equation:
P 1 ρ g + V 1 2 2 g + Z 1 + H 1 = P 2 ρ g + V 2 2 2 g + Z 2 + H 2
where H2 is the head loss along the internal flow passage and the outlet pipe. The pipeline pump features an inlet and outlet with identical heights (Zin = Zout) and inner diameters (Vin = Vout), the total head of the test pump can be calculated using Equation (2).
H t = H 2 H 1 = P o u t P i n ρ g
The following equation calculates the uncertainties based on the experimental data.
ω A = i = 1 j A Z i ω Z i 2 0.5
where Zi is the independent variable that could influence the dependent variable A, ω Z i is the uncertainty associated with an independent variable Zi, and ωA is the total uncertainty. The flow rate, pressure, and head uncertainties are approximately 0.2%, 0.25%, and 0.35%, respectively.

2.2.2. Test Results

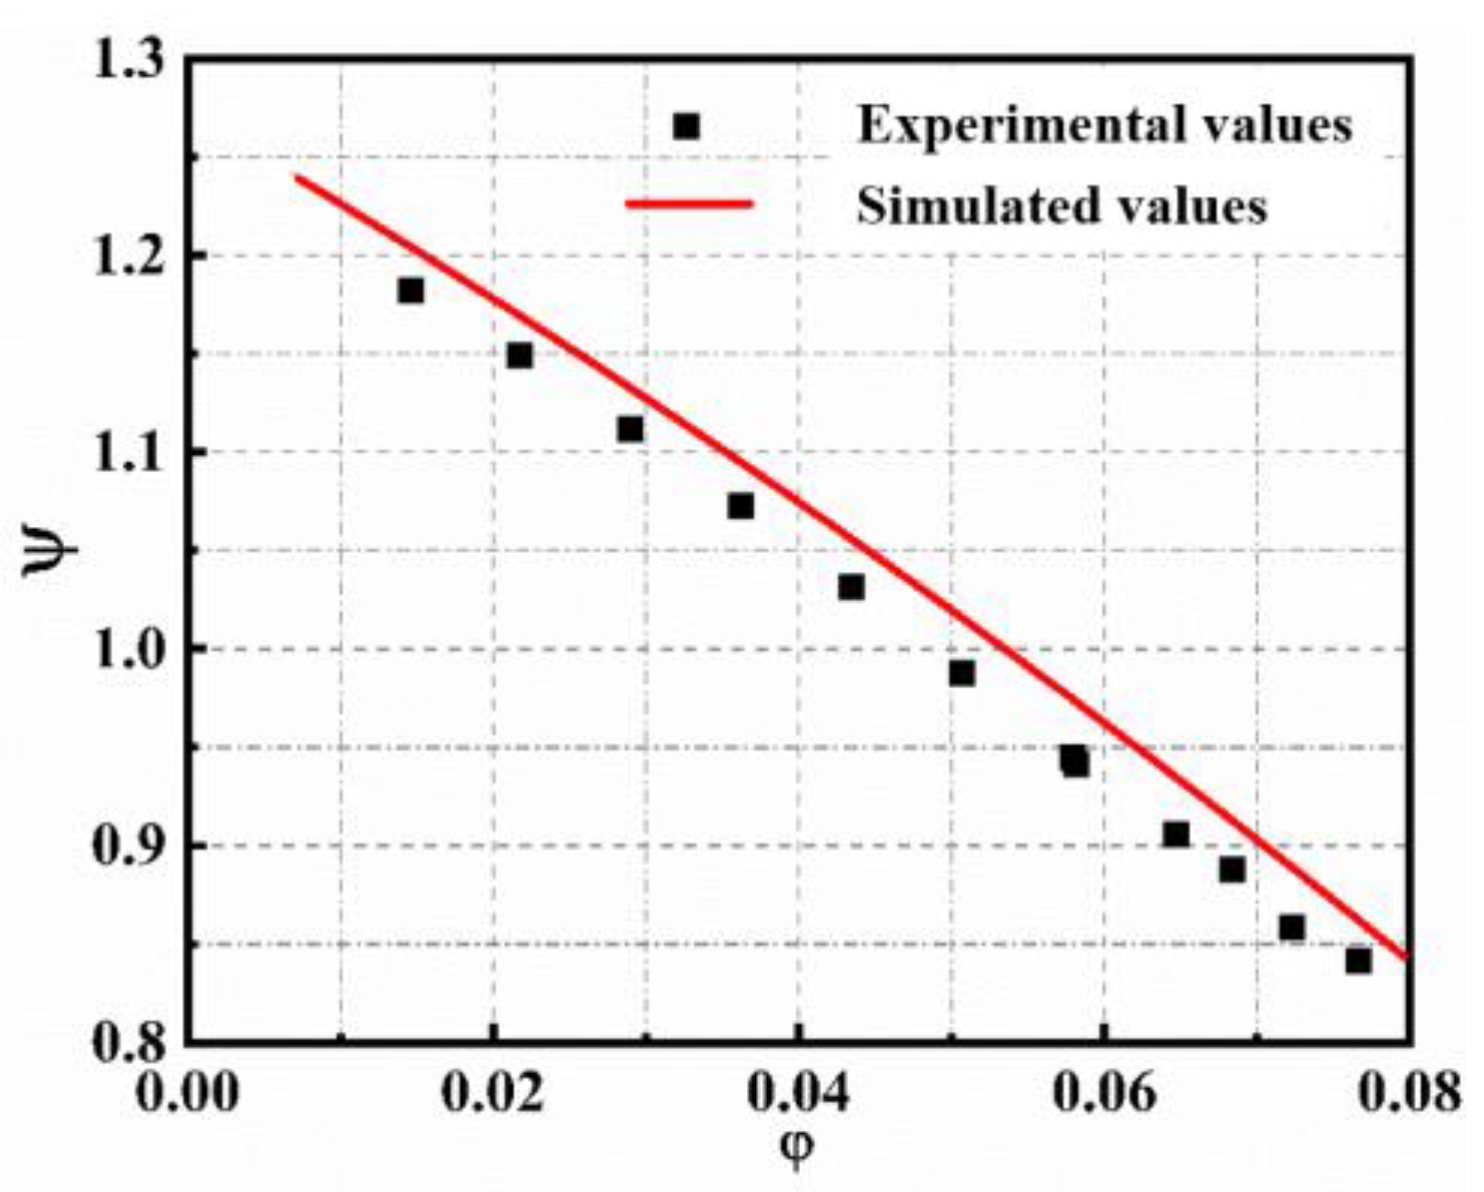
The hydraulic performance of a self-lubricating centrifugal pump with a flow rate range of 0.25 Qd to 1.6 Qd was tested at the design speed. Figure 4 depicts the comparison between numerical and experimental results, including dimensionless head ψ, which is calculated by the following equation:
ψ = 2 g H u 2 2
and dimensionless flow rate is defined as Equation (5):
φ = c 2 m u 2
where u2 is the circular velocity of the impeller diameter and c2m is the meridional component at the impeller outlet.
Figure 4 shows a good agreement between numerical and experimental results, even in part load and overload regions. At the designed flow meter point (φ = 0.0506), the dimensionless head of the numerical result and the experimental data are 1.0135 and 0.9881, respectively. The head error obtained from these two ways is within 2.6%. The pump head gradually decreases as the flow rate increases and maintains smooth variation within the tested range of flow rates. The hydraulic performance of the oil-free pump with R134a refrigerant agrees with that of a general centrifugal pump [16,38].
Cavitation number is involved in testing cavitation characteristics of the refrigerant pump to estimate the working state. The following equation defines the cavitation number σ:
σ = P i n P s 0.5 ρ u i 2
where ui is the flow velocity in the working section (ui = πωdi/60), Pin is the pressure at the inlet pipe, and Ps is the saturation pressure of refrigerant for the given temperature.
In the operation process, it is difficult to determine whether cavitation occurs in the pump directly. A general method is to regard the working condition in which the test head reaches 97% of the non-cavitation head under the same flow rate as the cavitation inception, and the cavitation number corresponding to this working condition is the critical cavitation number. As the cavitation number decreases, the head of the pump further decreases to 70% of the non-cavitation head, and the cavitation number corresponding to this working condition is the breakdown cavitation number σb.
Figure 5 compares the cavitation performance curves of the prototype obtained from the numerical simulation and the experimental test at the designed condition. The critical cavitation numbers obtained by numerical simulation and experimental test are 0.546 and 0.551, and the breakdown cavitation numbers are 0.347 and 0.412, respectively. Compared with the water pump, test and simulation results for a pump with refrigerant show good agreement with the cavitation performance curve [38]. Therefore, the revised Schnerr-Sauer calculation model can effectively predict the cavitation performance of the prototype.

3. Numerical Model

3.1. Numerical Method

The commercial computational fluid dynamics code ANSYS CFX 18.0 is used to study the pump’s internal flow characteristics. Considering the high curvature and complex flow in the pump, this paper chooses the Reynolds-averaged Navier–Stokes (RANS) equations of the shear stress transport (SST) k-ω turbulence model to simulate the flow in the pump. The turbulent viscosity equations of the SST model, k equations, ω equations, and weighting functions are provided as follows:
v t = a 1 k max a 1 ω , S F 2
k t + u j k x j = x j v + σ k v t k x j + ρ p k β k ω
ω t + u j ω x j = ω x j v + σ ω v t ω x j + γ ω k ρ p k β ω 2 + 2 ( 1 F 1 ) σ ω 2 1 ω k x j ω x j
F 1 = tanh ( a r g 1 4 )
F 2 = tanh ( a r g 2 2 )
a r g 1 = min max k β ω y , 500 v y 2 ω , 4 ρ k C D k ω σ ω 2 y 2
a r g 2 = max 2 k β ω y , 500 v y 2 ω
C D k ω = max 2 ρ 1 σ ω 2 ω k x j ω x j ,   1.0 × 10 - 10
where S and y denote the value of vortices and the first layer grid from the wall.
ψ = F 1 ψ 1 + 1 F 1 ψ 2
γ 1 = β 1 / β σ ω 1 κ 2 / β
where the model constants are a1 = 0.31, σ k 1 = 0.85, σ ω 1 = 0.5,   β 1   = 0.075,   β = 0.09, and κ = 0.41.
γ 2 = β 2 / β σ ω 2 κ 2 / β
where the model constants are a2 = 0.31, σ k 2 = 1.0, σ ω 2 = 0.856,   β 2 = 0.0828,   β = 0.09, and κ = 0.41.
The flow was assumed to be at a steady state and incompressible and isothermal. The wall boundary conditions are adiabatic. A no-slip wall with a smooth surface is utilized for all physical barriers in this model. The frozen rotor is applied at the interface between the rotating and stationary components. R134a refrigerant is the working fluid. The inlet and outlet boundary conditions are mass flow and pressure boundaries, respectively. The root mean square residual error is employed for calculations, and the convergence criterion is set to a value below 10−5 to ensure accuracy.
In this study, the Sauer-Schnerr cavitation model is used to conduct numerical simulation research on the cavitation flow process of the working fluid pump. The Sauer-Schnerr model is a cavitation model based on the mass transport equation. This model approximates the liquid cavitation and bubble collapse during the cavitation process as the mass equation’s pressure-driven mass change term, as shown in Equation (7).
m + ˙ = ρ v ρ l ρ m 3 α 1 α R b 2 3 p p s a t ρ l       p > p s a t m ˙ = ρ v ρ l ρ m 3 α 1 α R b 2 3 p s a t p ρ l       p < p s a t
In the above equation, ρv is the gas phase density, ρl is the liquid phase density, ρm is the mixture density, α is the gas phase volume fraction, and Rb is the bubbles’ radius. The bubble volume fraction α can be described by the volume of bubbles:
α = n b 4 3 π R b 3 1 + n b 4 3 π R b 3
The nb is the number of gas nuclei per unit volume of liquid; the value 1013 has been widely validated in water cavitation studies [39]. However, R134a refrigerant exhibits significant differences in thermal properties, such as viscosity and surface tension, compared to water and low-temperature fluids. This study selects a modified gas nucleus density of 109 for applying the Sauer-Schnerr cavitation model to R134a refrigerant flow. Table 2 shows the specific simulated working conditions.

3.2. Meshing

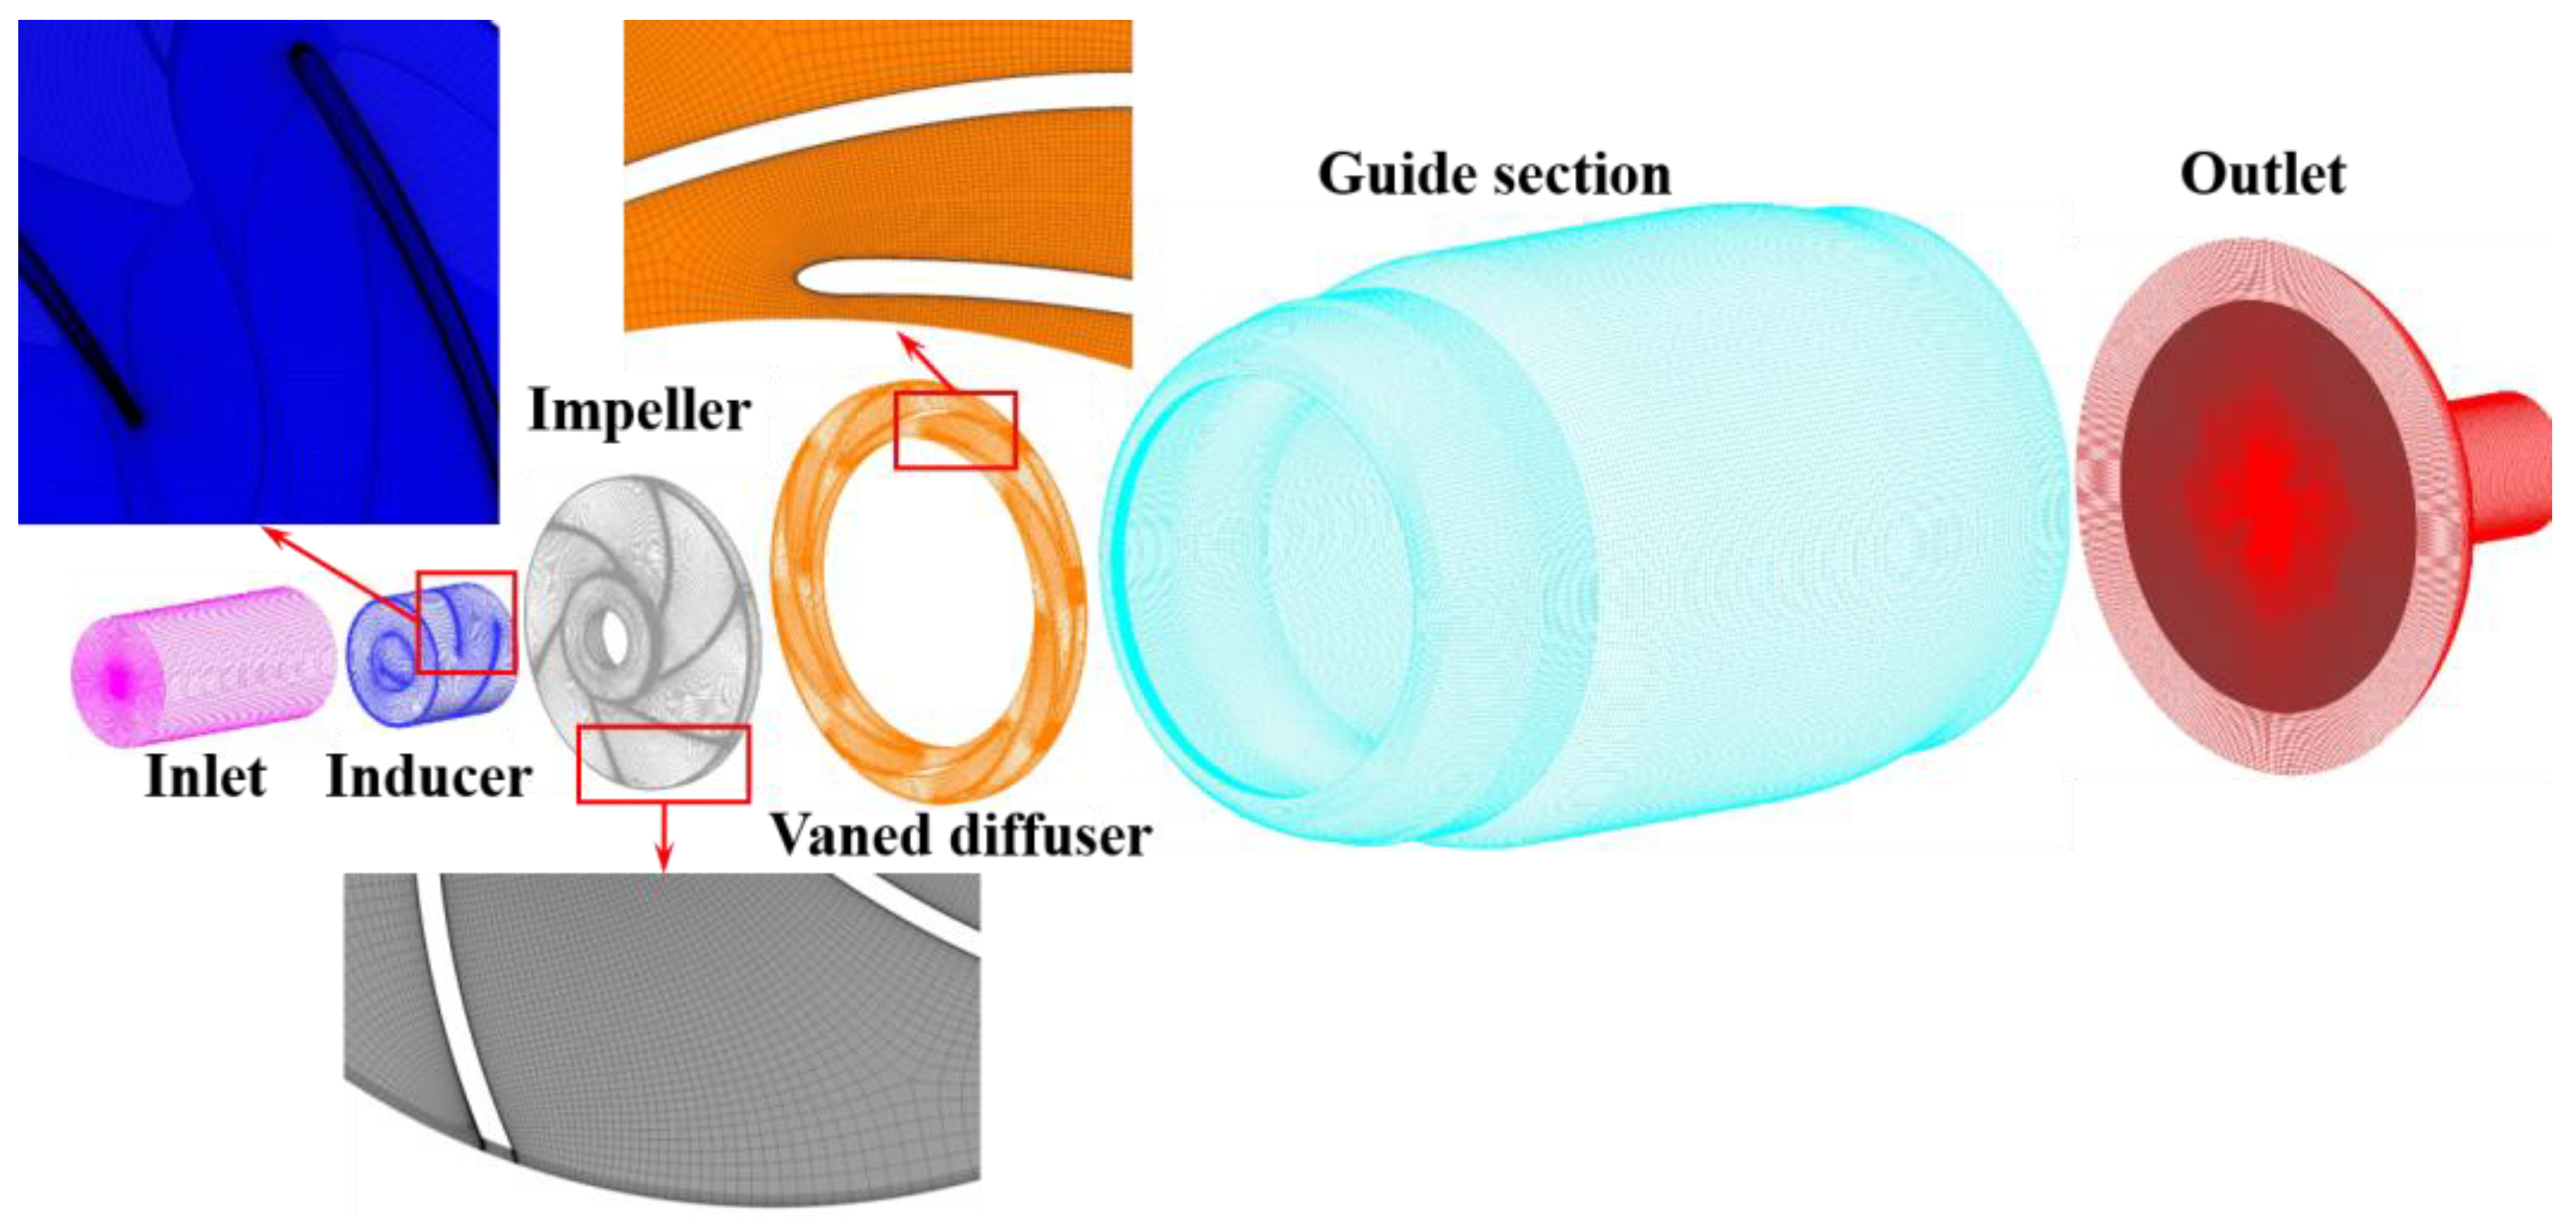
Figure 6 shows the numerical computational grid model of the high-speed centrifugal pump. The computational model consists of six parts: inducer, impeller, vaned diffuser, guide section, inlet, and outlet pipes. The computational model considers the clearances present in actual operation, with a clearance of 0.5 mm set for the inducer tip gap and 0.35 mm for the impeller tip gap. To generate the structured hexahedral mesh for the fluid domains, the commercial software Turbo-Grid and ICEM CFD are employed, respectively, as shown in Figure 6. The quality of the mesh is rigorously assessed to ensure the reliability of numerical calculation. A grid independence verification was performed using the pump head as a reference. Figure 7 indicates that the computational model with a total grid count of 18.46 million satisfies the computational requirements.
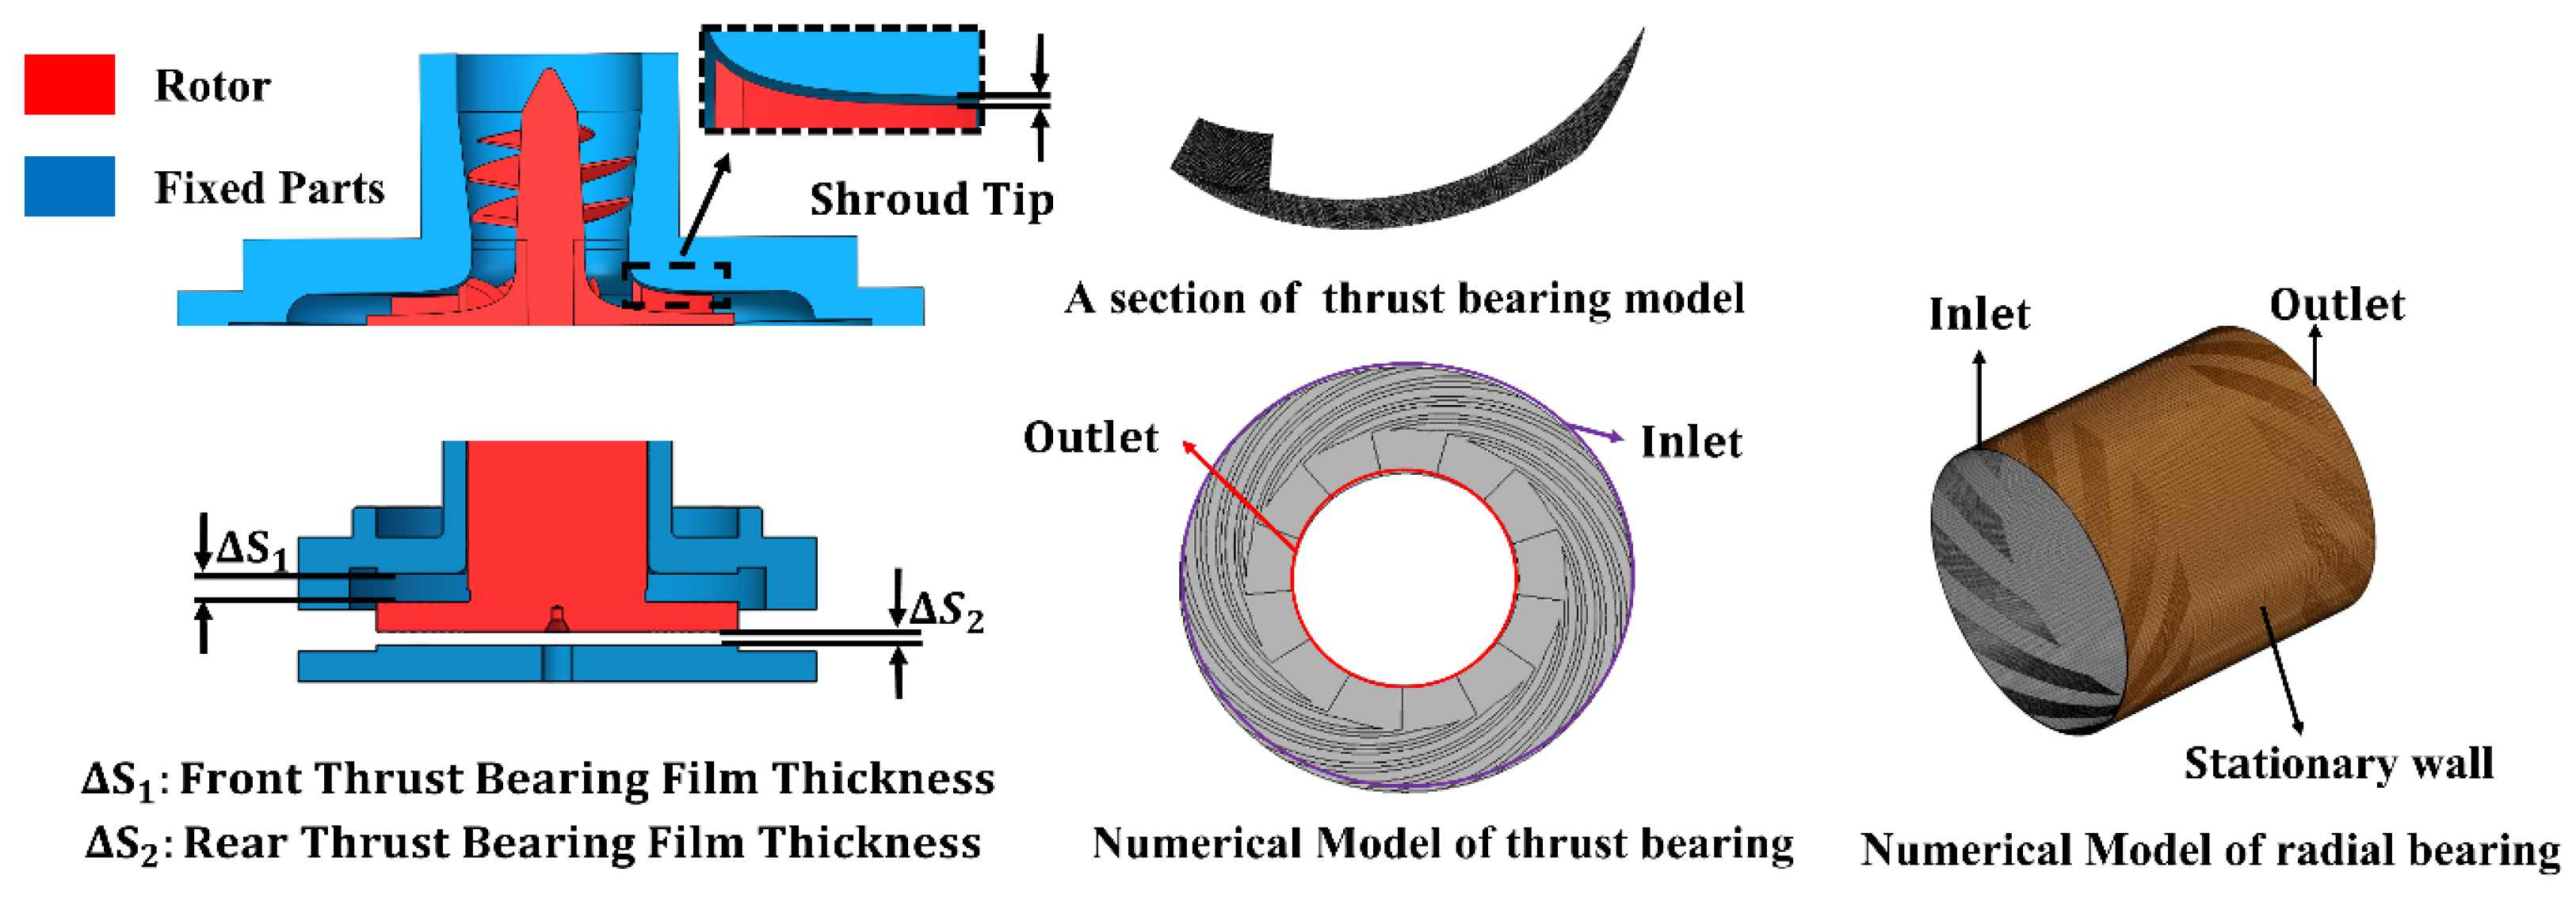
Figure 8 illustrates the numerical computational model and boundary conditions for the flow domains of the radial and thrust hydrodynamic bearings used in the prototype. The bearings’ inlet and outlet pressure boundary values are set by the results from the impeller outlet. In actual operation, the rotor system consisting of the impeller, main shaft, and thrust bearing remains in a dynamic equilibrium process in both the radial and axial directions. Therefore, this study conducted numerical simulations for the thrust bearings with different film thicknesses and the radial bearings with various eccentricities at the designed rotating speed.

4. Results and Discussion

4.1. Single-Phase Flow Characteristics and Internal Flow Characteristics

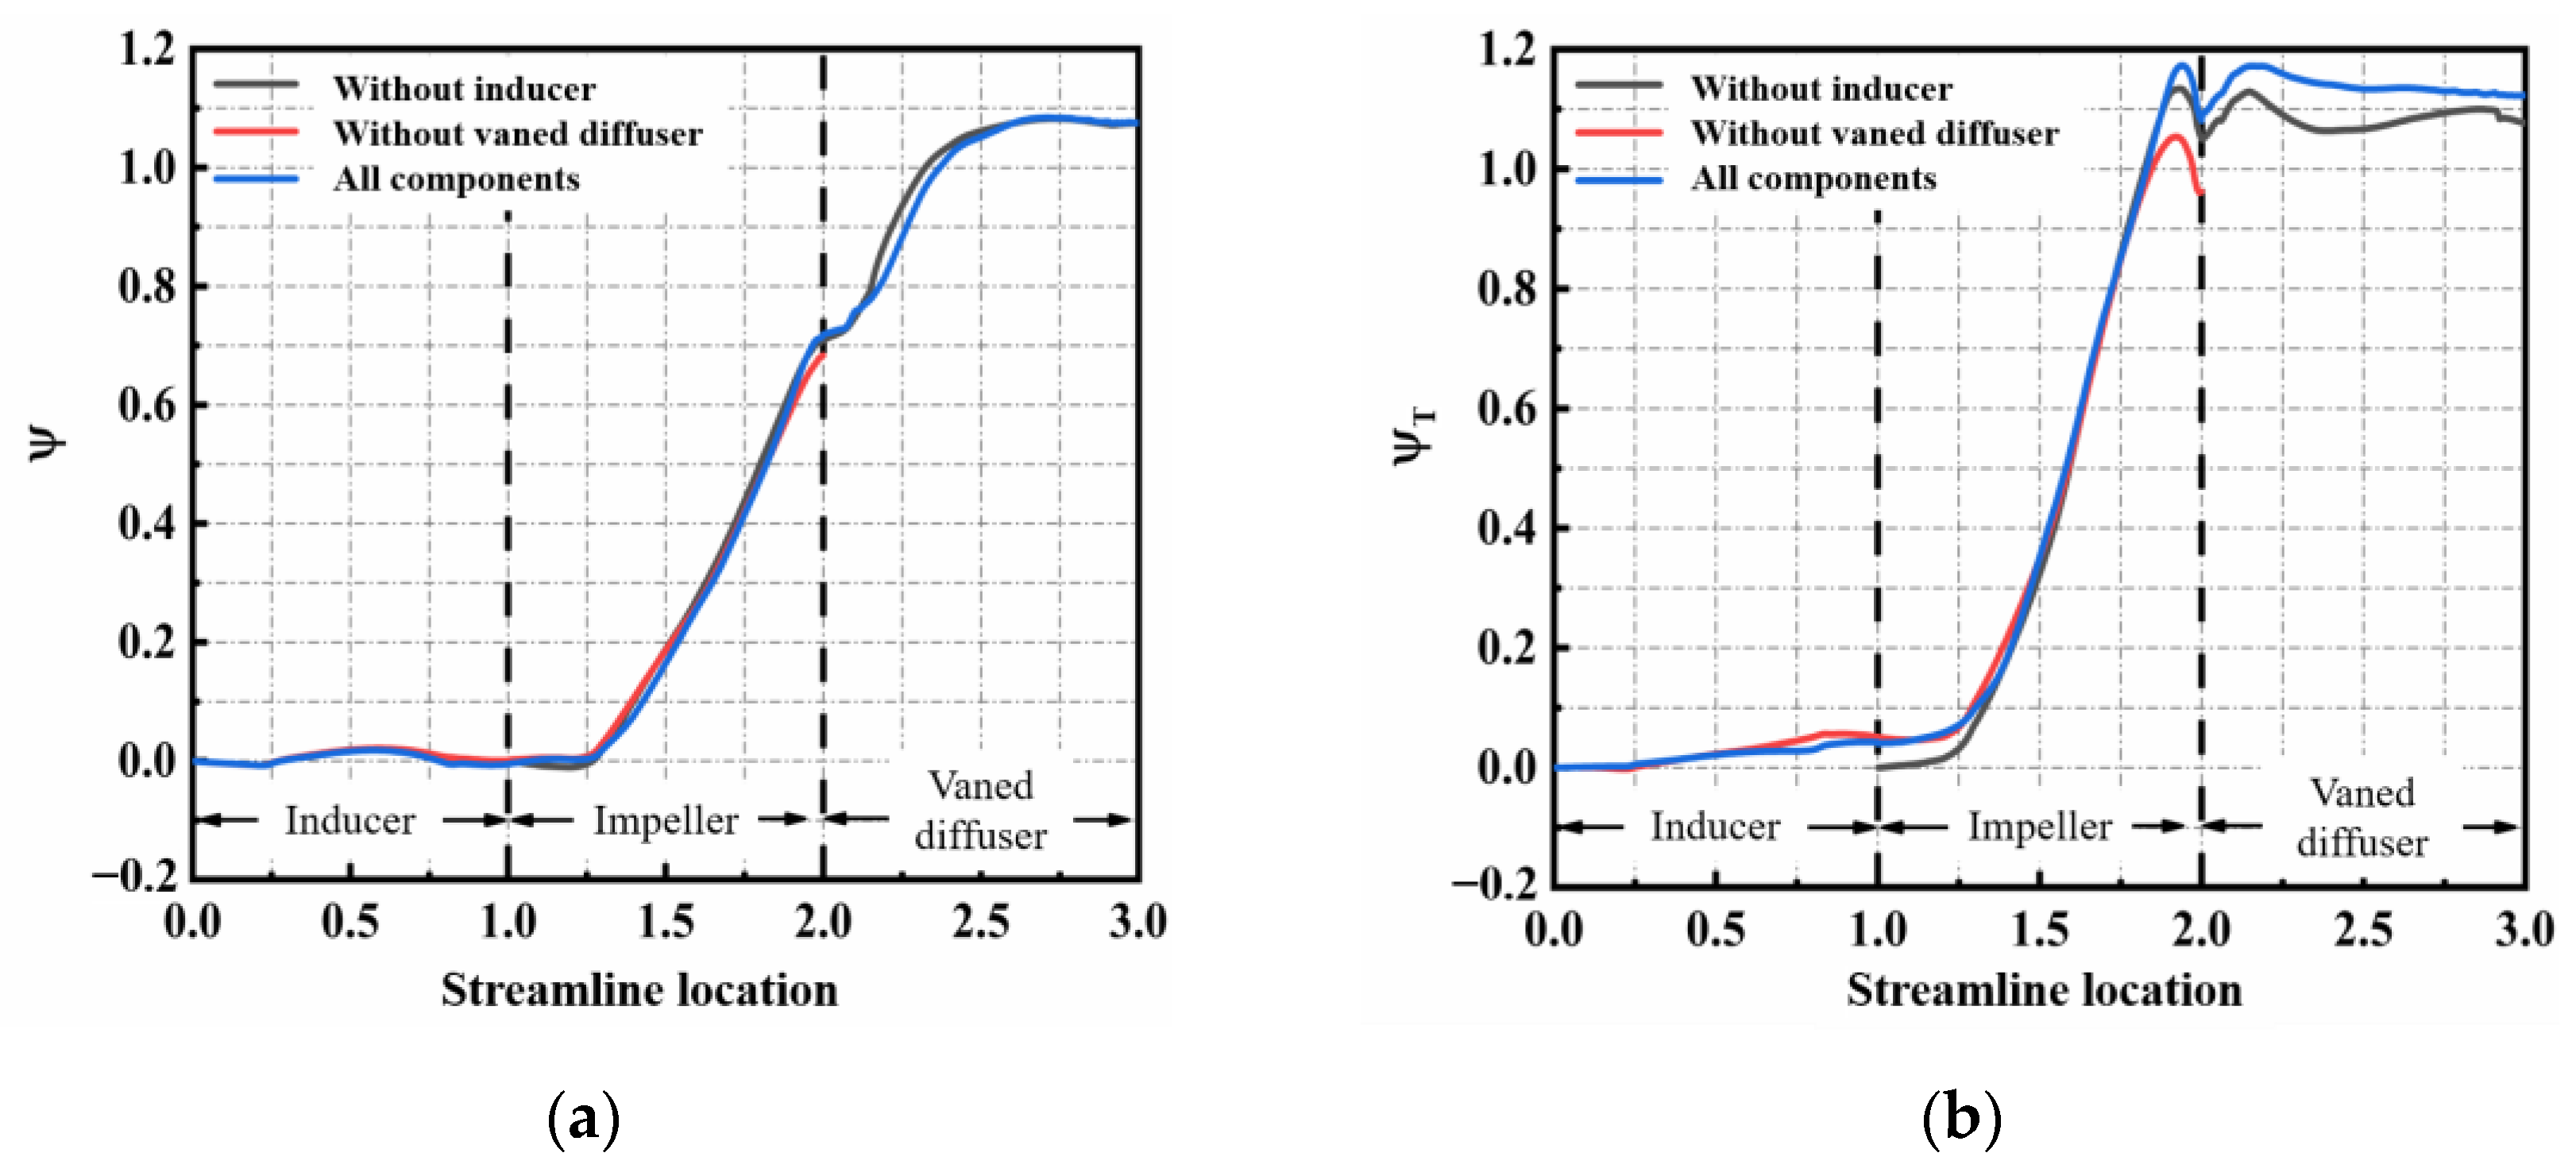
Figure 9 illustrates the influence of the inducer and the vaned diffuser on the hydraulic performance. Figure 9a shows that an inducer’s presence or absence affects the impeller inlet’s static pressure distribution. The inducer provides a specific static pressure rise to the impeller, ensuring that the leading edge of the impeller blades has sufficient static pressure rise to prevent cavitation. As shown in Figure 9b, the total pressure coefficients for the cases with and without the inducer are 1.112 and 1.077, respectively. For the pump without a vaned diffuser, the total pressure coefficient at the impeller outlet is 0.962, while for the pump without the inducer and with all components, the total pressure coefficients at the impeller outlet are 1.051 and 1.081, respectively.

4.1.1. Internal Flow under Different Flow Rates

Figure 10 presents the effects of three different flow rates on various parameters within the hydraulic components (inducer, impeller, and vaned diffuser) at the designed rotating speed. As shown in Figure 10a, the static pressure coefficient (φ = 0.0506) increases from 0 at the inlet of the inducer to 0.0118 at the trailing edge of the inducer blades. Due to the suction effect of the impeller, the static pressure coefficient decreases to 0.00274 in the gap between the inducer outlet and the impeller inlet. It slightly reduces to 0.00156 at the leading edge of the impeller blades. Subsequently, the pressure rapidly rises to 0.635 under the boosting effect of the rotating blades. The static pressure in the gap between the impeller blades and the vaned diffuser blades slightly increases due to the sudden increase in flow cross-sectional area. After the fluid flows into the vaned diffuser, as the cross-sectional area rapidly decreases from the inlet to the throat, part of the kinetic energy converts into static pressure, and the static pressure coefficient reaches 1.01 at the throat. Under different flow coefficient conditions, the static and total pressure coefficient trends along the streamlines are generally consistent. The variations in static pressure coefficient remain similar under other flow coefficient conditions, with higher static pressure coefficients along the central streamline at lower flow coefficients. Equal to the static pressure coefficient, As shown in Figure 10b, the fluid total pressure coefficient increases with the rotation of the inducer and the impeller. The average liquid temperature gradually increases along the central streamline, as presented in Figure 10c, with a rapid increase in temperature within the impeller due to the viscous dissipation of the working fluid. The maximum temperature appears at the throat of the vaned diffuser. The temperature rises at the three flow coefficient conditions with increasing flow coefficient, 0.606 K, 0.326 K, and 0.284 K, respectively.
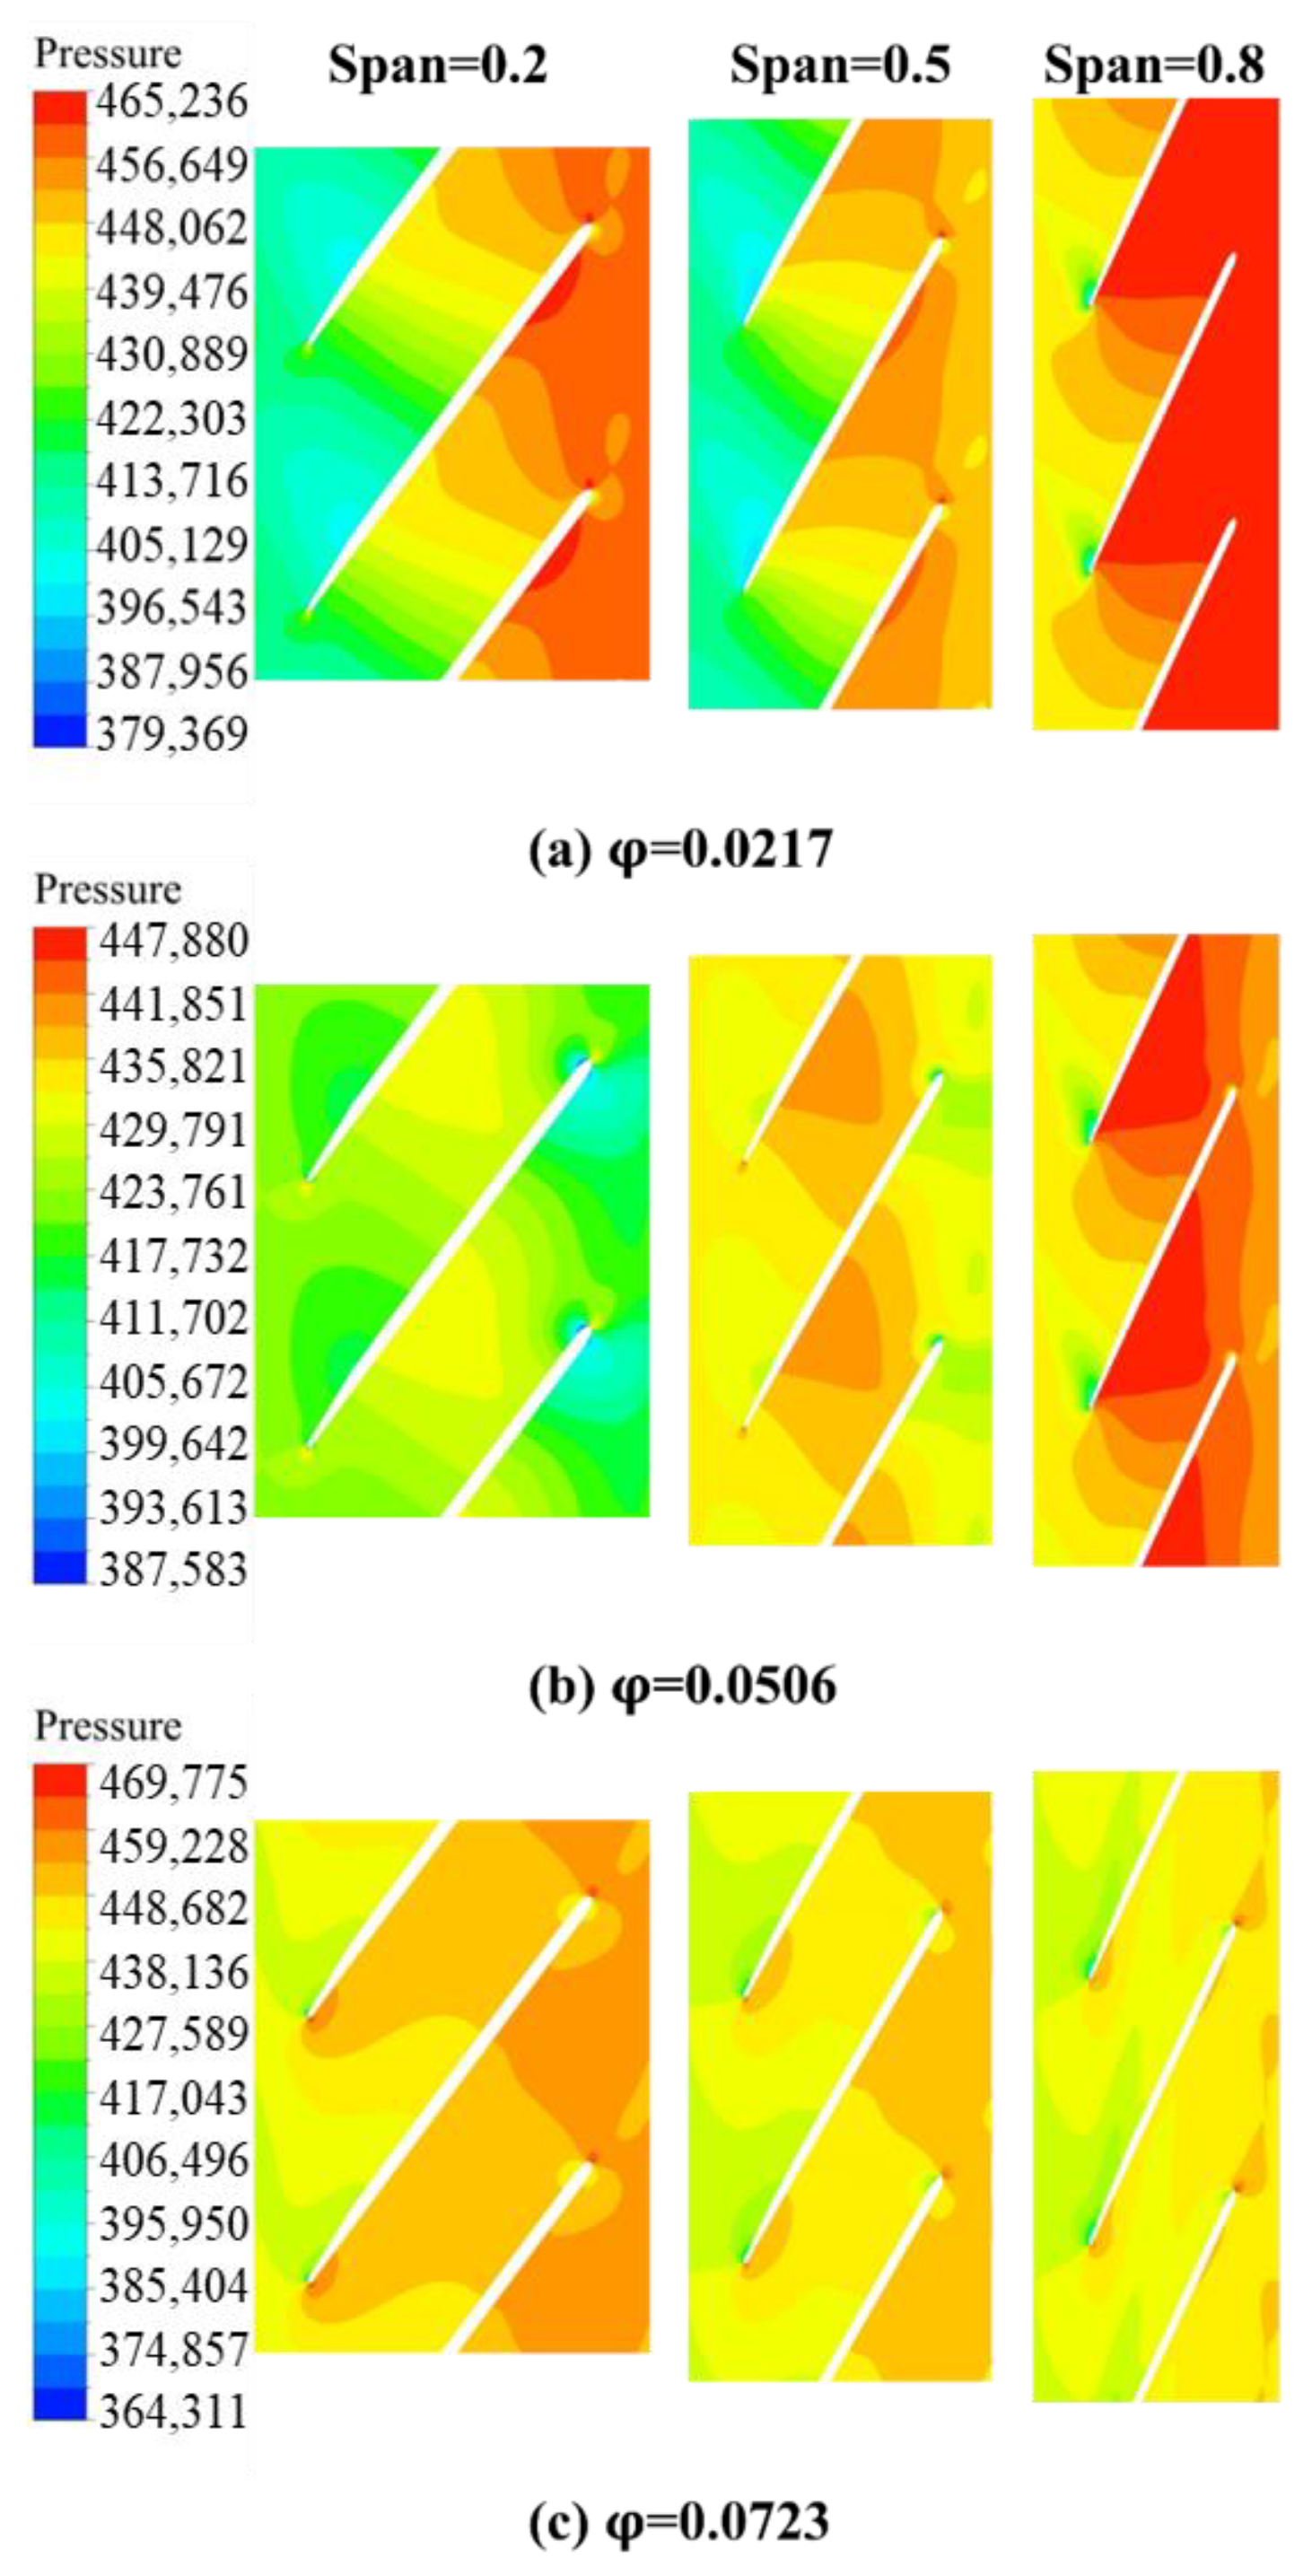
Figure 11 depicts the pressure distribution of single-phase R134a refrigerant at different flow coefficient conditions. As the inducer rotates at high speed, a low-pressure region attaches to the leading edge of the inducer blade on the suction side. This low-pressure region gradually diminishes from the hub to the shroud direction and decreases when the flow rate increases. When the value of the low-pressure area, generated by the rapid flow, falls below the saturation pressure corresponding to the local temperature of the liquid-phase R134a refrigerant, cavitation starts to occur in the region. The cavitation part will be discussed in Section 4.2. In conjunction with Figure 10a, the boosting pressure effect of the inducer decreases with increasing flow rate. Under low flow rate conditions (φ = 0.0217), the inducer provides a static pressure rise of approximately 50 kPa for R134a refrigerant. However, as the flow rate increases, the static pressure rise supplied by the inducer decreases to 31 kPa and 16 kPa, respectively.
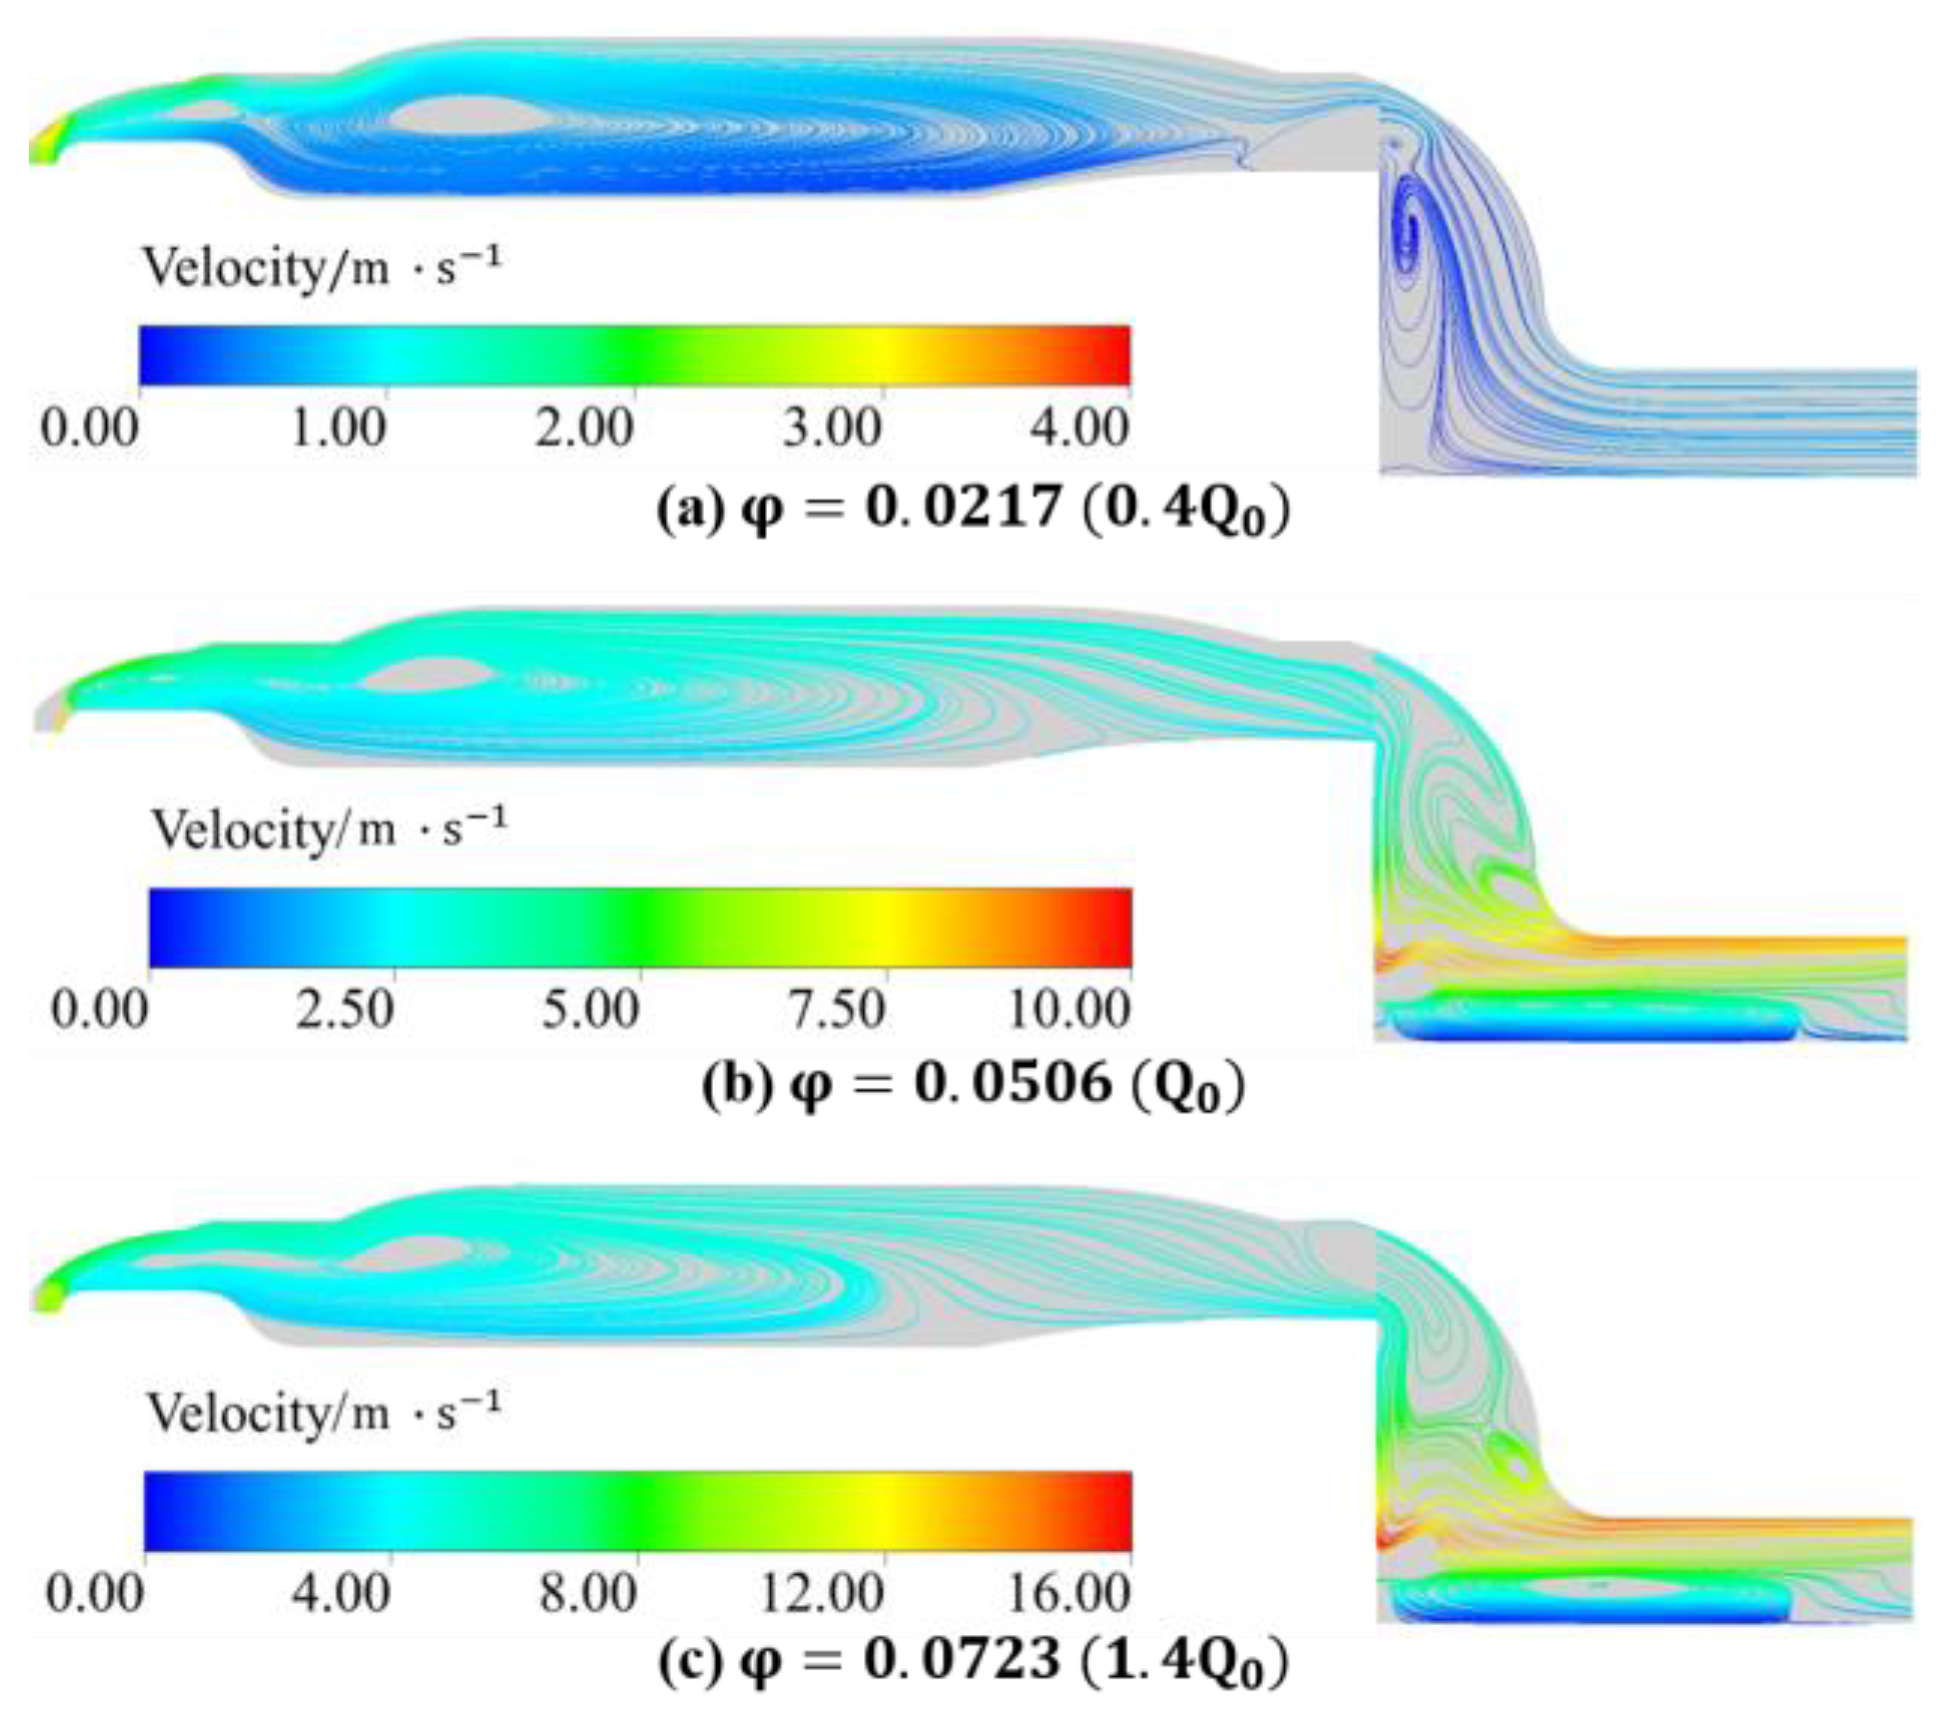
Figure 12 presents the streamlined chart of relative velocity at the designed rotating speed. Figure 12a shows that when the flow rate is below the design condition, the deviation between the fluid velocity and the inlet blade angle is too large. A pronounced vortex and flow separation occur in the middle region between the pressure and suction sides of the impeller blades. The strong flow separation phenomenon is due to the significant deviation between the flow angle on the impeller outlet and the vaned diffuser inlet blade angle. After being accelerated by the blades, the fluid impacts and rebounds on the blade surface at the vaned diffuser blades. As a result, the liquid separates into two parts under the influence of the leading edge structure of the vaned diffuser. A portion of the fluid separated from the main flow impacts the blade’s leading edge of the vaned diffuser, forming a strong backflow between the vaned diffuser and the blade outlet gap. The other part of the fluid flows downstream along the vaned diffuser blades’ suction side, exhibiting significant velocity separation. A distinct stagnation vortex forms at the throat region of the vaned diffuser, reducing its flow capacity. As the flow rate increases, the velocity flow angle in the impeller approaches the designed inlet angle, and the flow separation phenomenon within the impeller passage gradually weakens. The fluid at the impeller outlet enters the throat of the vaned diffuser along the blade pressure side, and the backflow phenomenon in the impeller outlet disappears.
The refrigerant flows through the divergent guide section formed by the pump casing and motor housing, transforming part velocity energy into pressure energy. Due to the sudden expansion and contraction of the structure in this section, distinct flow vortices occur at the front position and the outlet, as shown in Figure 13. It can be observed that with increasing flow rate, the vortex at the front of the passage gradually moves toward the inlet of the path, and the subsequent streamlines approach uniformity. Under the same working condition, the fluid velocity does not change significantly in this section. The friction loss between the fluid and the wall surface is the primary part of energy loss. At the posterior passage, the cross-sectional flow area forms a pattern of “constriction-expansion-constriction”, resulting in continuous variation of the fluid velocity. Therefore, the morphology and quantity of the stepped flow vortices in this section exhibit noticeable changes with increasing flow rates. The losses in this section are mainly composed of fluid friction and bend losses.

4.1.2. Hydrodynamic Bearing Performance with R134a Refrigerant

As shown in Figure 14, the results indicate that the radial capacity increases with the enhancement in rotating speed. Moreover, a larger eccentricity corresponds to a greater radial capacity at the same rotating speed.
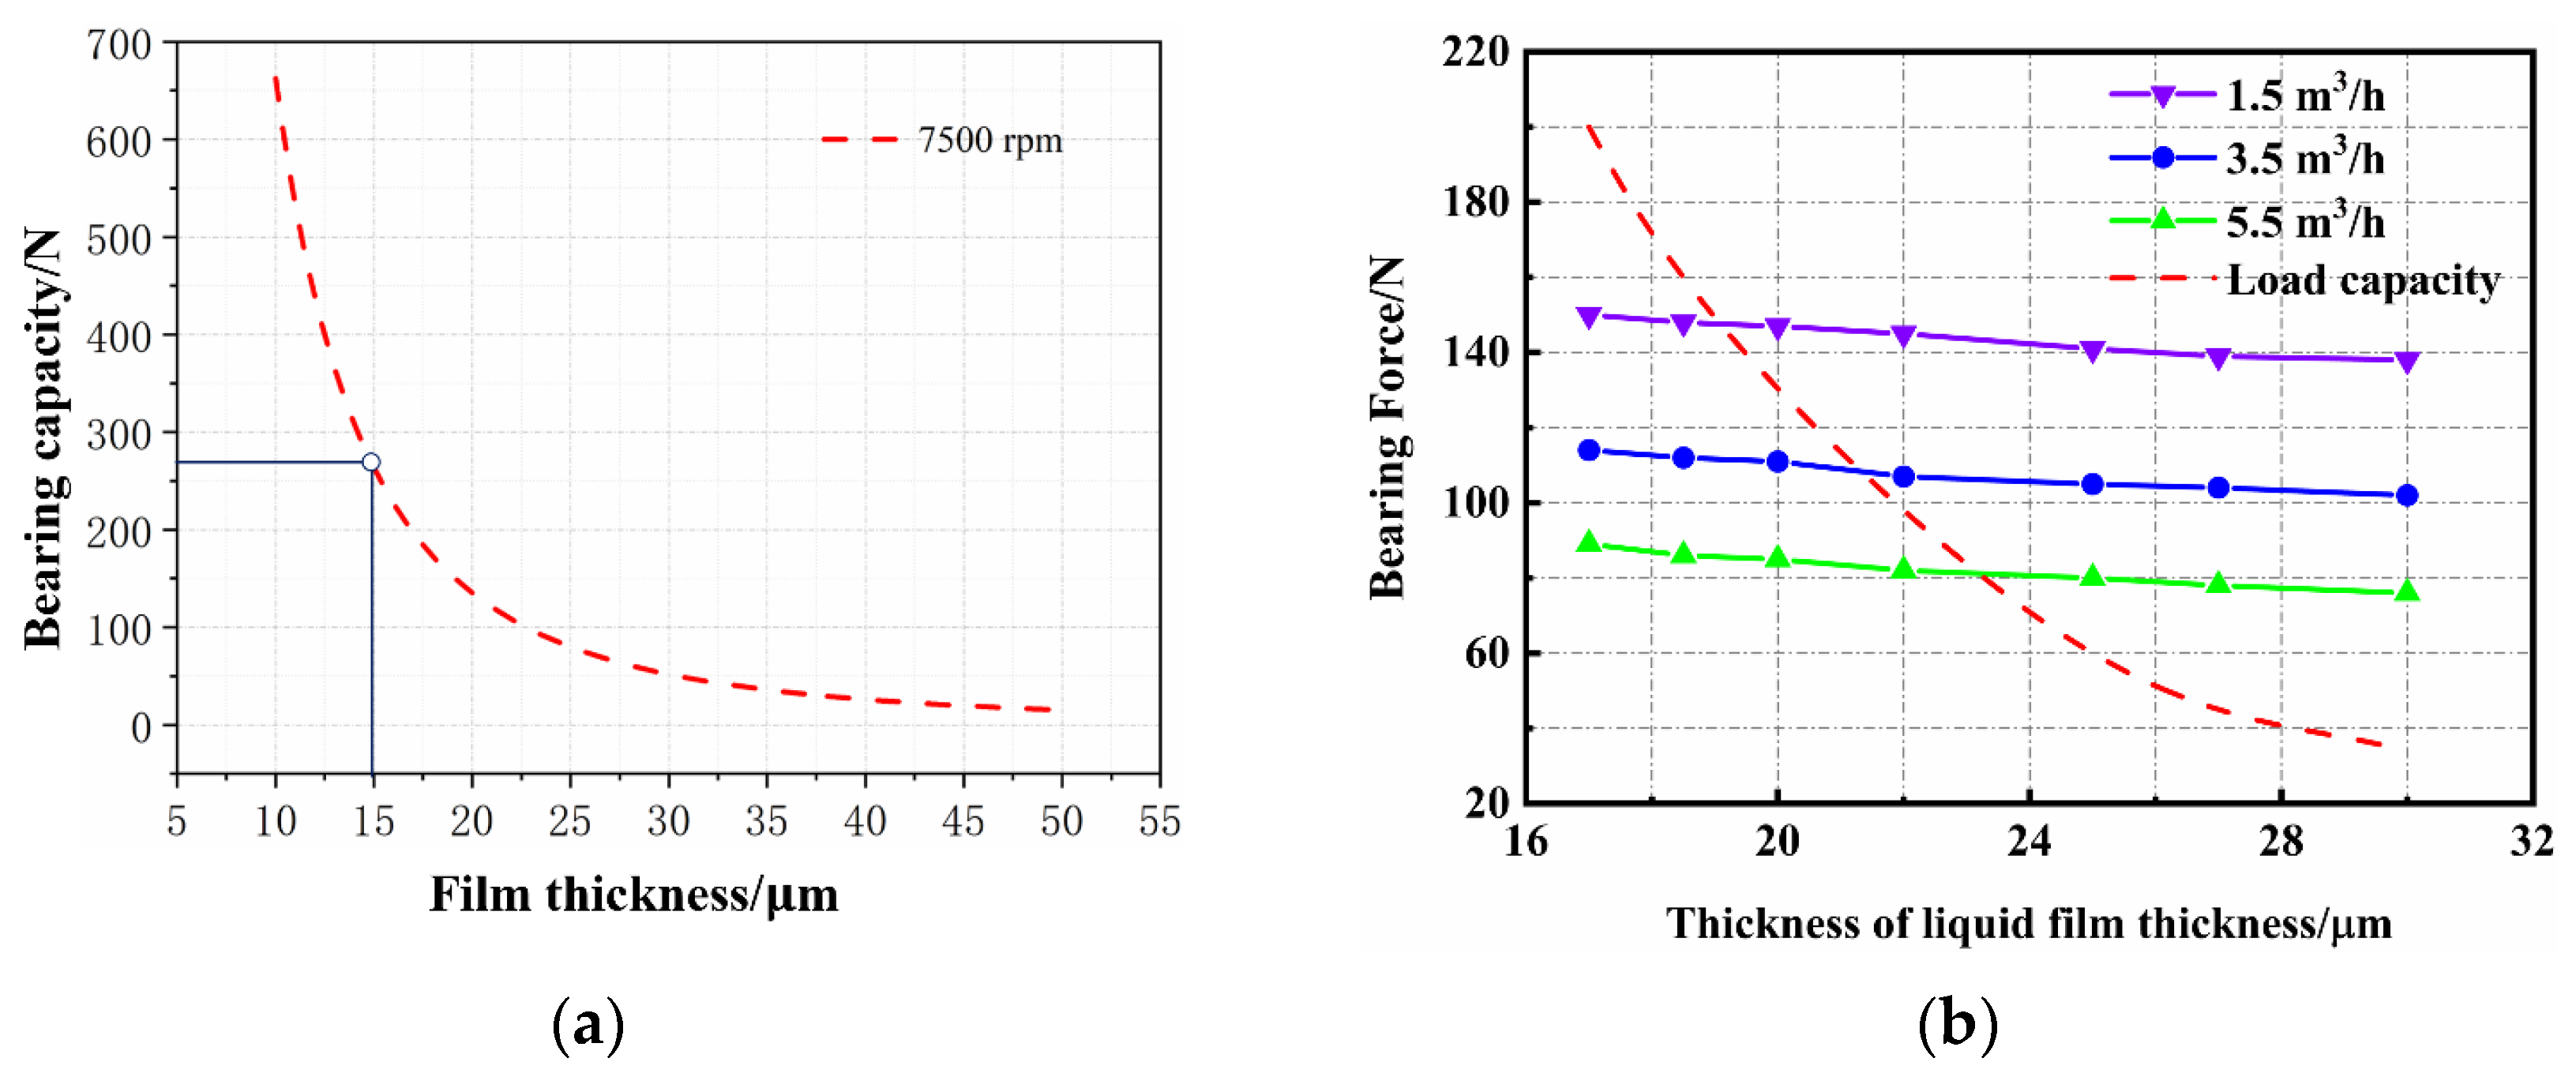
Figure 15 displays the thrust bearings capacity distribution at 7500 rpm. The results show that under the designed condition, the one-side thrust bearing can provide a capacity of approximately 265 N with a liquid film thickness of 15 μm. Meanwhile, the load capacity on the other side decreases almost to zero. Figure 15b demonstrates that the axial force of the pump decreases with the increase in the thickness of the thrust liquid film and the flow rates. Combined with the thrust bearings capacity curve, there is the intersection point on different flow rates. It is indicated that the hydrodynamic thrust bearing can be applied in the prototype under different conditions.

4.2. Cavitation Characteristics

4.2.1. The Effect of Inducer

Figure 16 and Figure 17 show the numerical cavitation performance of the centrifugal pump with and without the inducer. Installing an inducer ahead of the main impeller significantly reduces the prototype’s critical and breakdown cavitation numbers. After installing the inducer, the critical cavitation number decreased from 0.783 to 0.566, and the breakdown cavitation number decreased from 0.718 to 0.372. After reaching the critical cavitation number, the total pressure difference (pump head) without the inducer exhibits a steeper decline curve. It indicates a rapid deterioration of the pump’s hydraulic performance with decreasing inlet pressure.
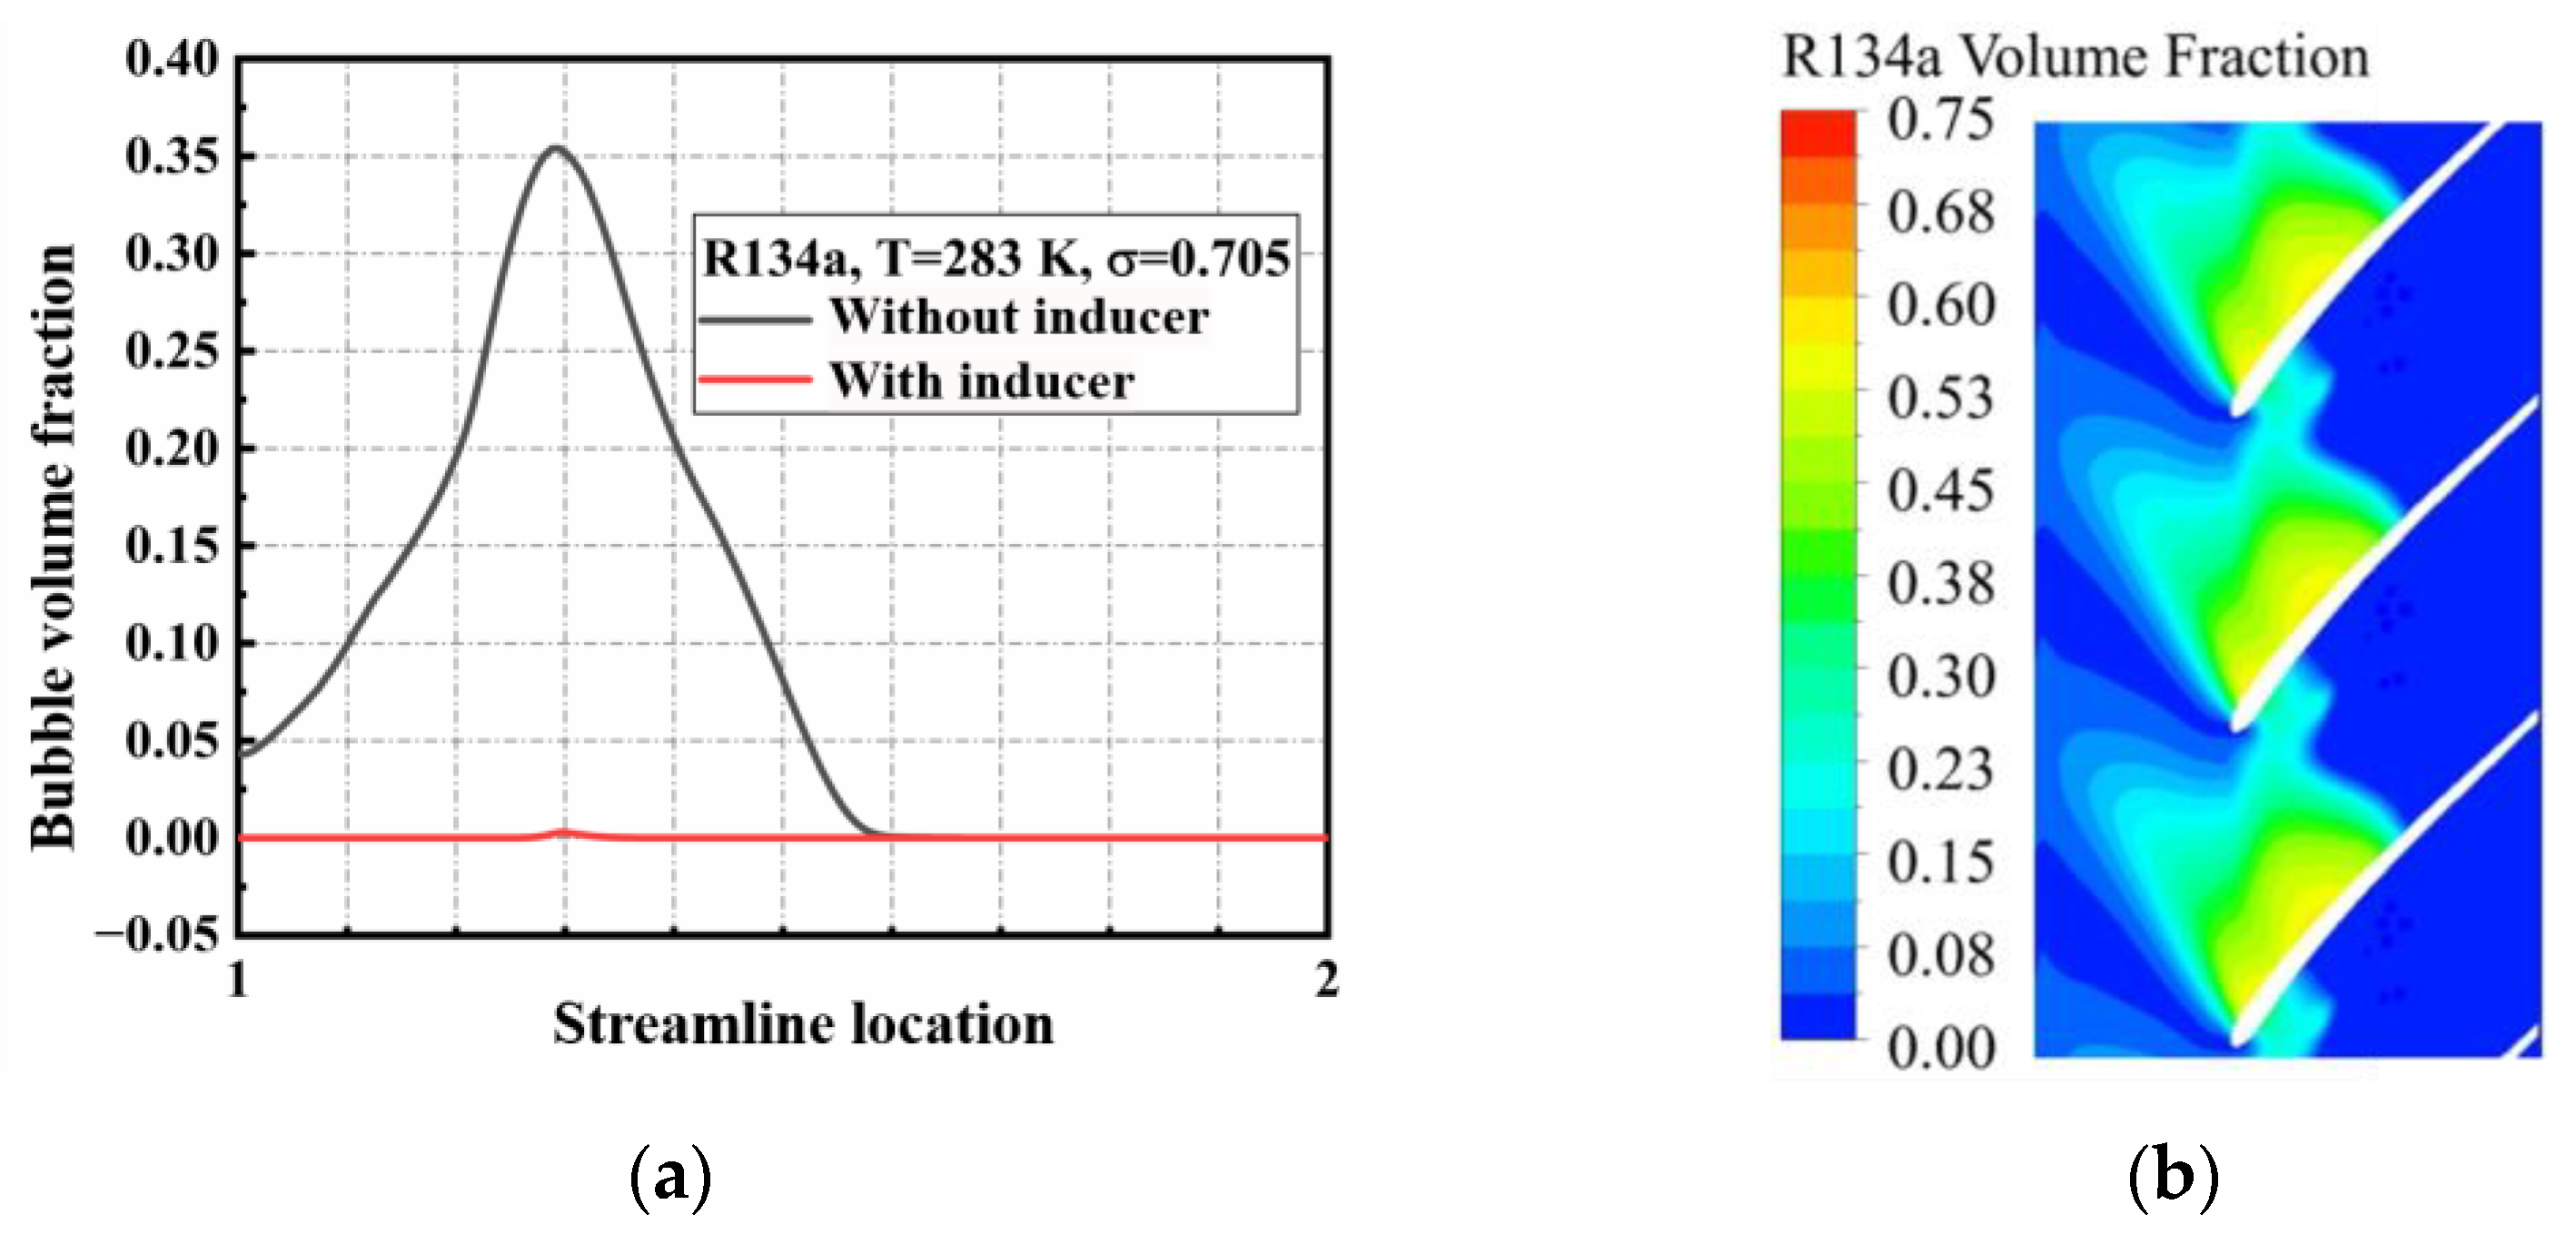
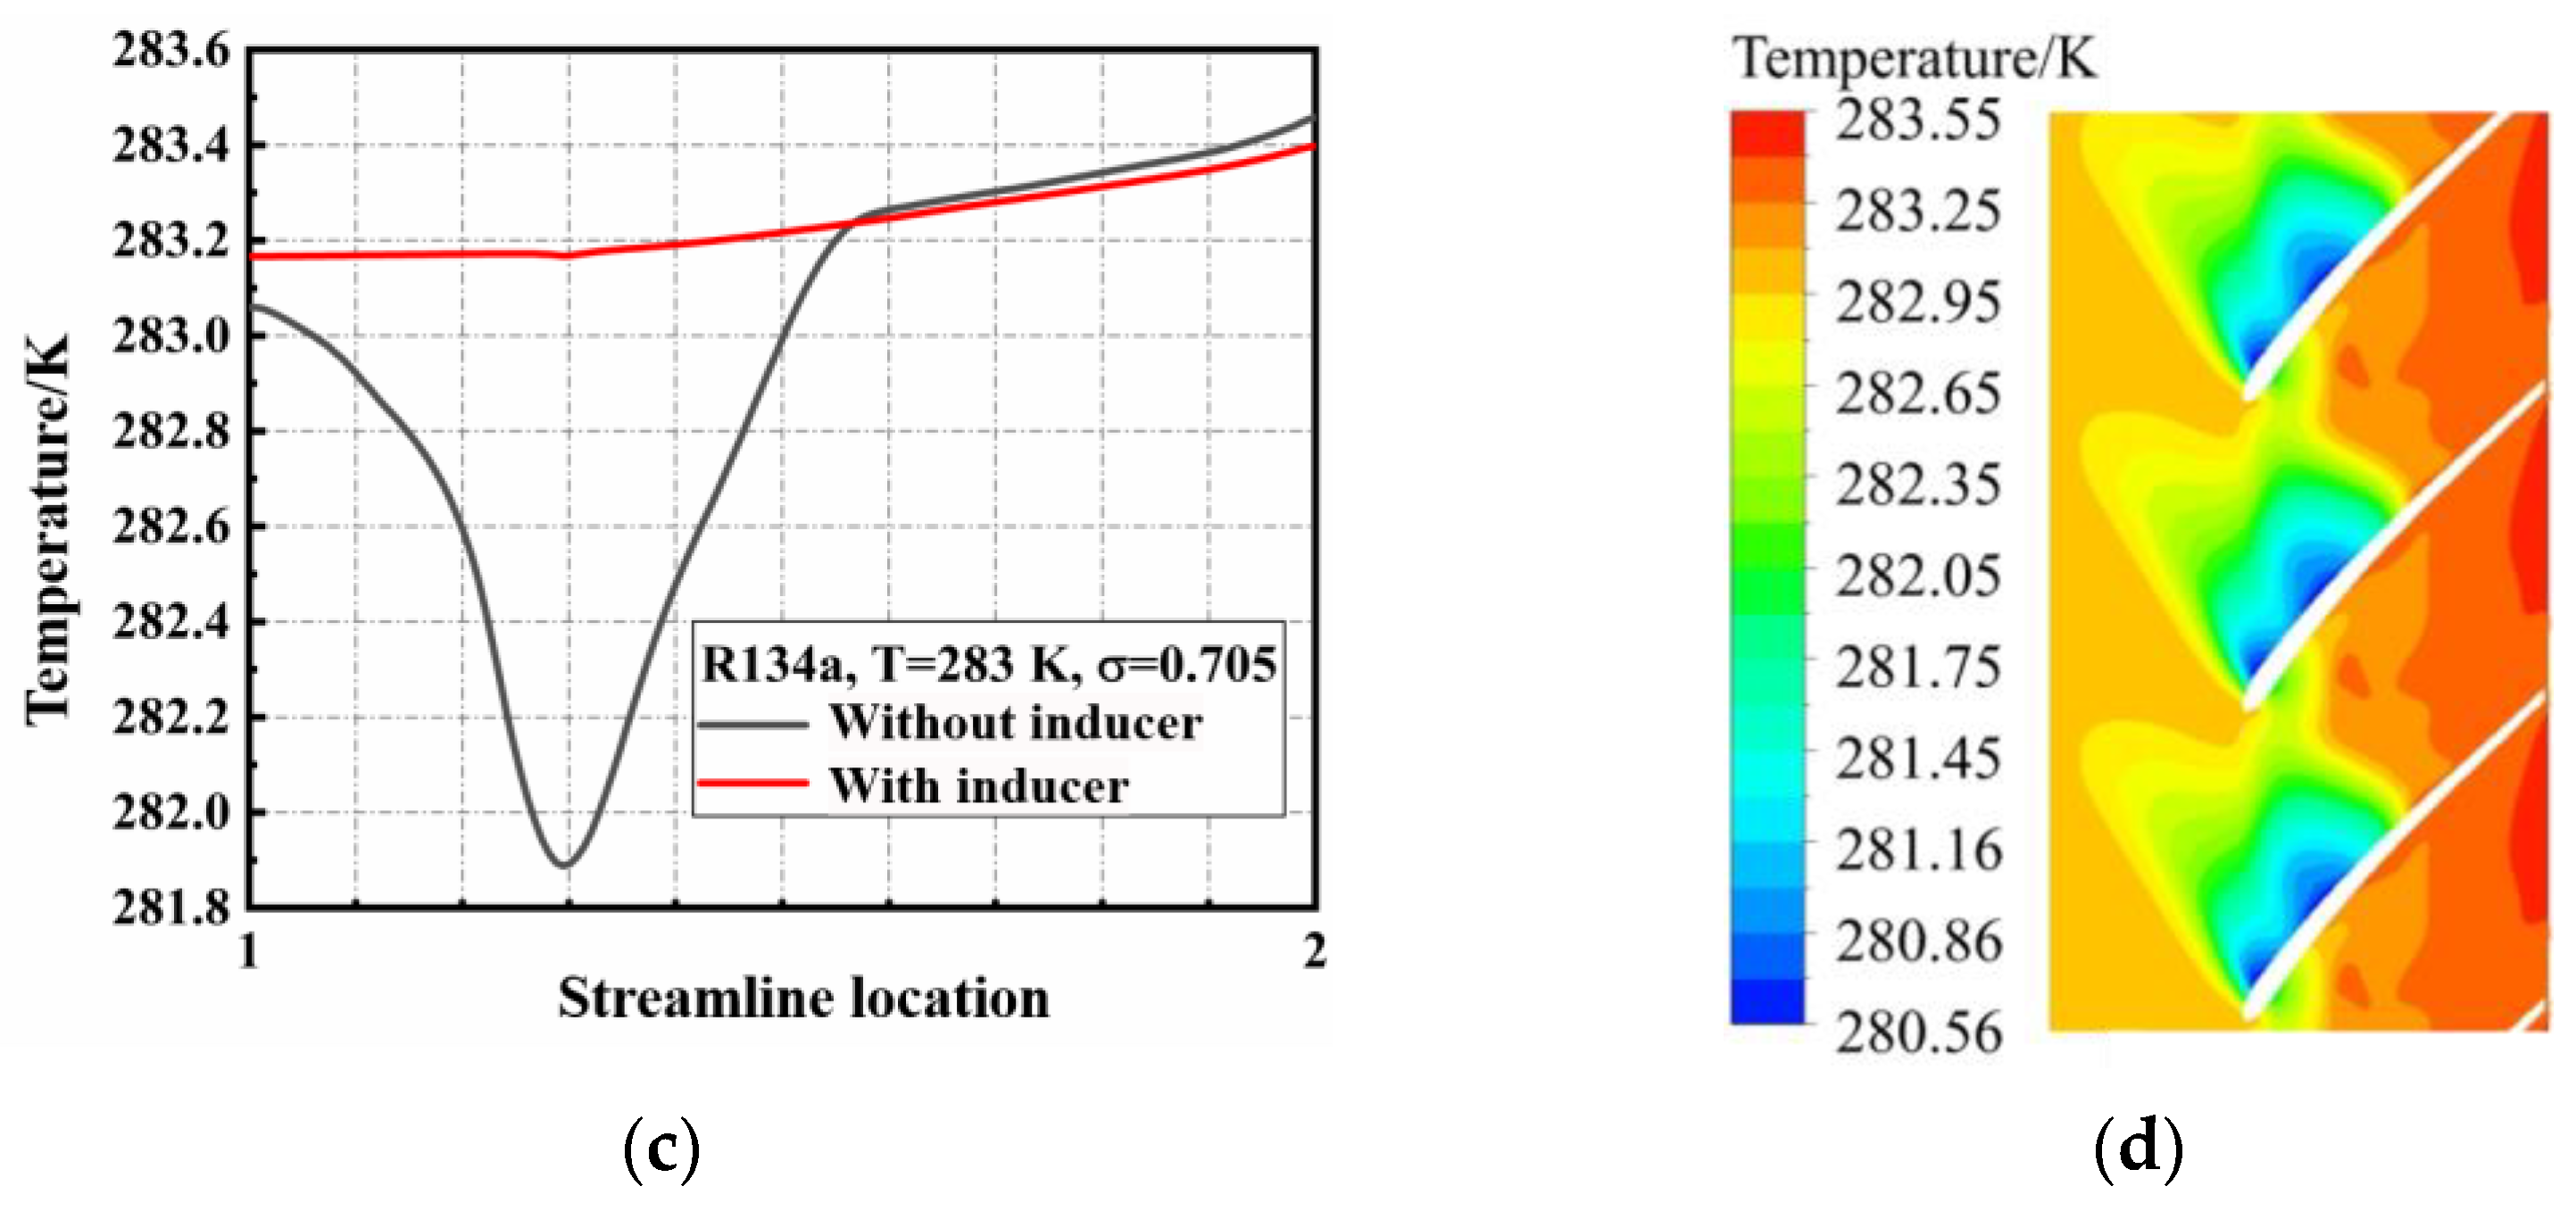
Figure 18 shows the variation of the bubble volume fraction and temperature in the impeller for the cases with or without an inducer under the inlet cavitation number of 0.705. Figure 16 shows that when σ equals 0.705, which exceeds the critical cavitation number of the pump with an inducer, the bubble volume fraction of refrigerant is approximated as zero in the impeller. When the cavitation number is lower than the breakdown cavitation number of the pump without an inducer, the cavitation cloud develops from the impeller’s leading edge downstream and blocks the impeller passage. In this working condition, as shown in Figure 18c,d, the refrigerant temperature of the cavitation cloud near the leading edge of the impeller suction side dropped by about 3 K without installing the inducer.

4.2.2. Internal Flow Characteristics under Different Cavitation Numbers

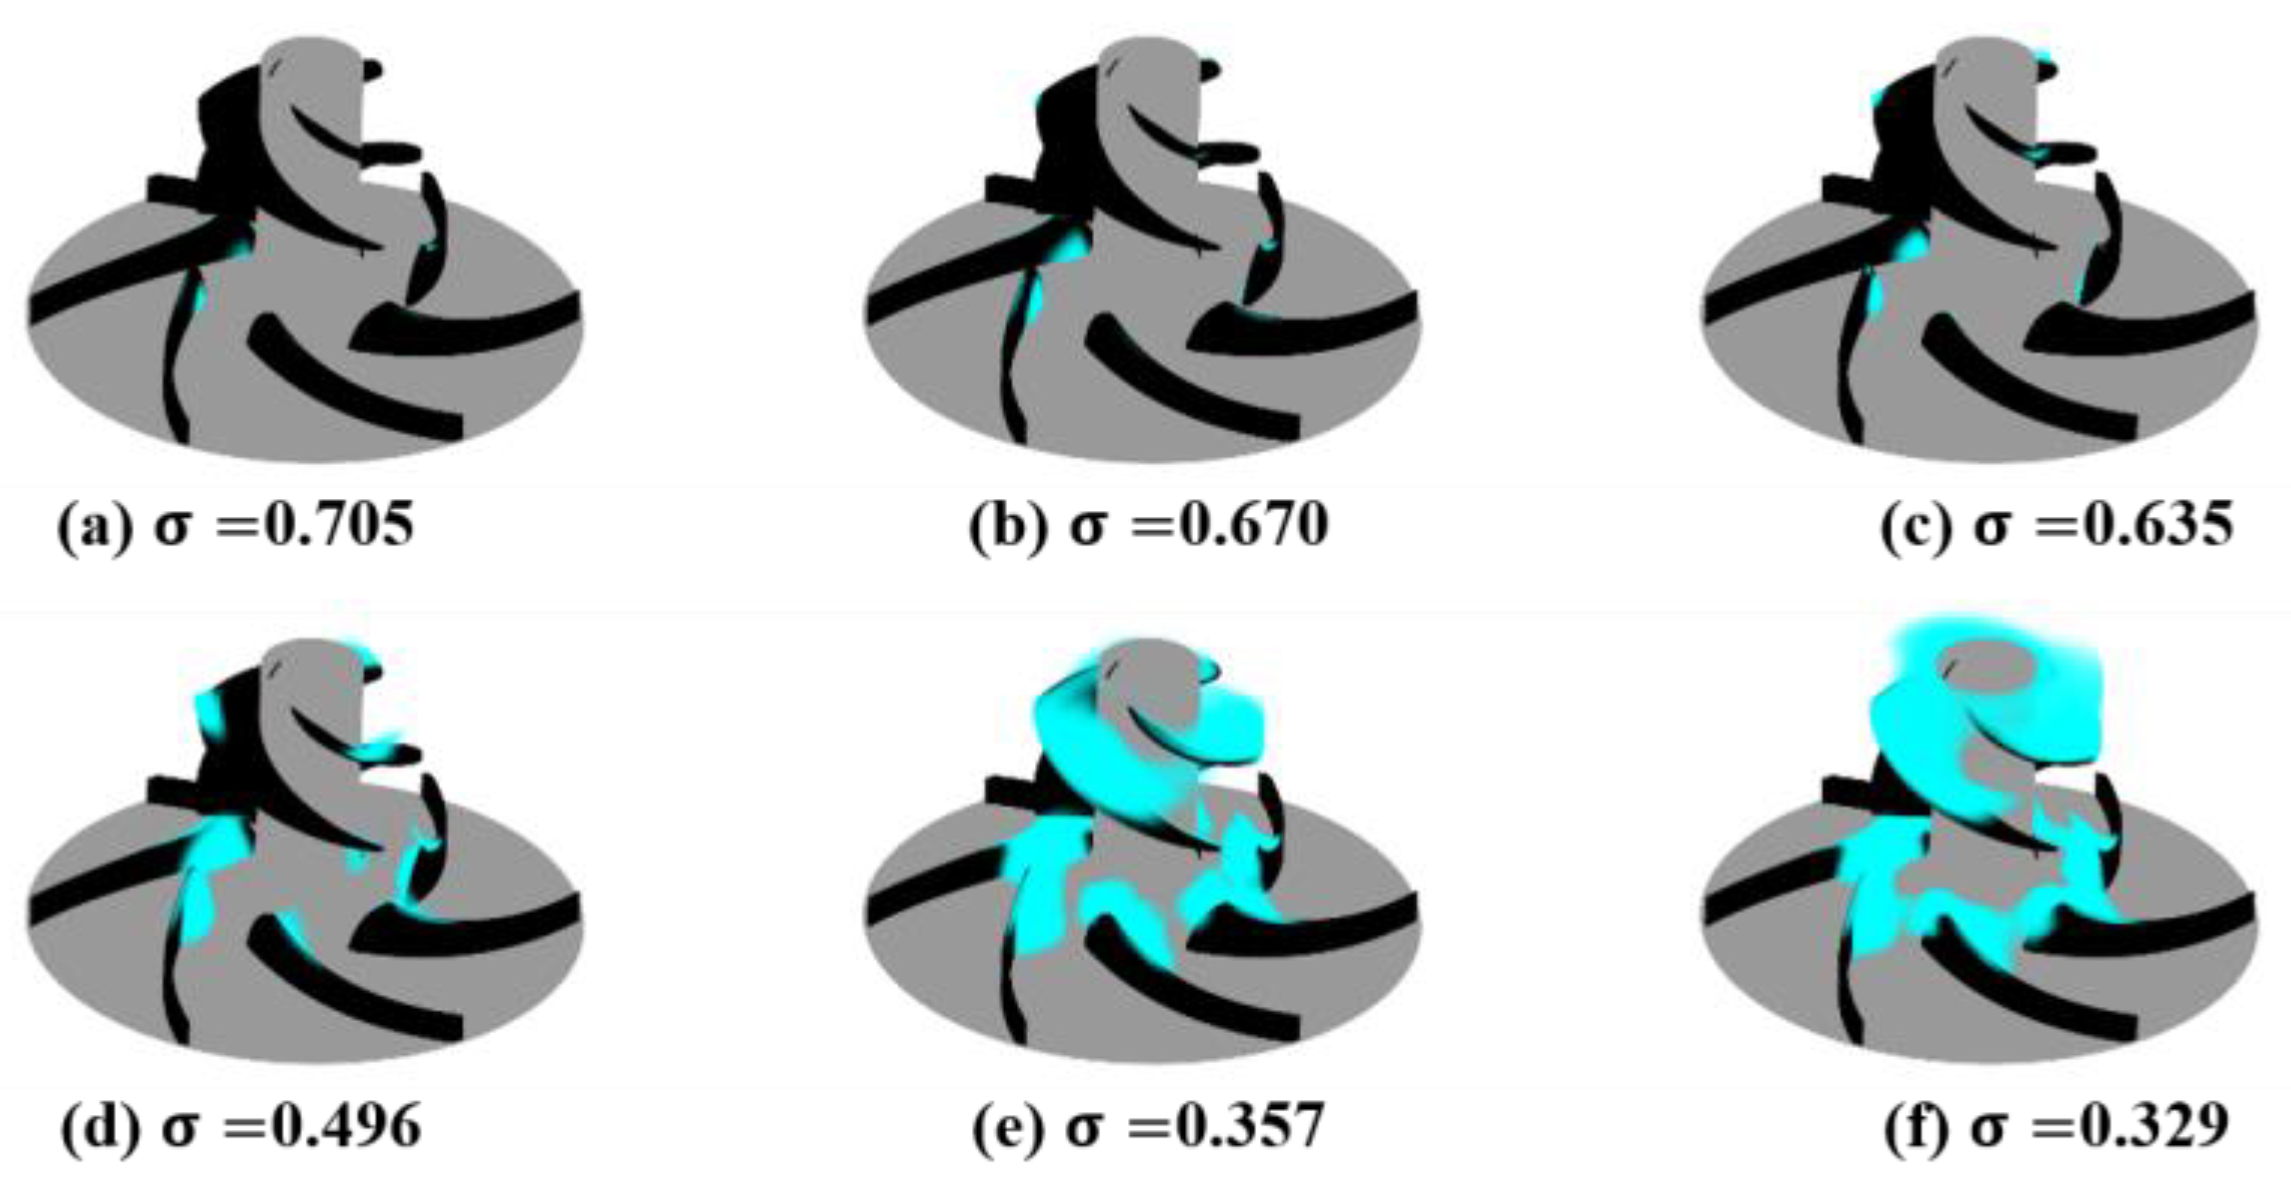
Figure 19 presents the distribution of the refrigerant bubble volume fraction within the inducer and the impeller for different cavitation numbers under the designed condition. It can be observed that as the cavitation number decreases to 0.705, a small amount of cavitation cloud appears near the hub of the impeller on the suction side, and according to Figure 20b, a temperature drop of less than 0.1 K is observed at the center of the cavitation cloud. As the cavitation number decreases to 0.67, the cavitation cloud develops downstream along the suction side of the impeller, and a small amount of cavitation cloud starts to appear in the tip clearance region. When the cavitation number reaches 0.635, a vapor cloud appears on the outer side of the leading edge of the inducer suction side blade. As shown in Figure 19d, when the cavitation number drops below the critical cavitation number of 0.496, the cavitation cloud at the inducer leading edge merges with the one at the tip clearance region and then develops downstream along the inducer blade. After integrating, bubbles appear at the trailing edge of the inducer. Still, these cavitation clouds collapse quickly before entering the impeller blade due to the pressure rise in the low-pressure region. Figure 20b shows the refrigerant temperature rise detaching from the inducer blades. As the cavitation number further decreases, rapidly developing cavitation clouds block most of the inducer passages, and a small amount of cloud separates from the inducer trailing edge and enters the impeller.
The low-pressure region formed at the leading edge of the impeller due to high-speed rotation, and an intense cavitation cloud of the working fluid generated a “horseshoe-shaped”, as shown in Figure 18b. Meanwhile, the cavitation clouds have not entirely blocked the impeller passages, and the core region of the cavitation cloud appears to have a temperature drop of approximately 0.3 K. At this cavitation number, it is noteworthy that the maximum temperature drop occurs in the front section of the inducer blades, at about 0.9 K.

4.2.3. Thermal Effect

During the cavitation process, the gas generated by cavitation extracts heat from the fluid around the cavitation area, resulting in a specific temperature gradient between the liquid temperature in the surrounding area and the interface of the cavitation area. The decrease in liquid temperature in the surrounding area reduces its corresponding saturation pressure, further suppressing the phase transition process. This process of suppressing phase transition caused by the temperature drop of phase transition is called the cavitation thermal effect.
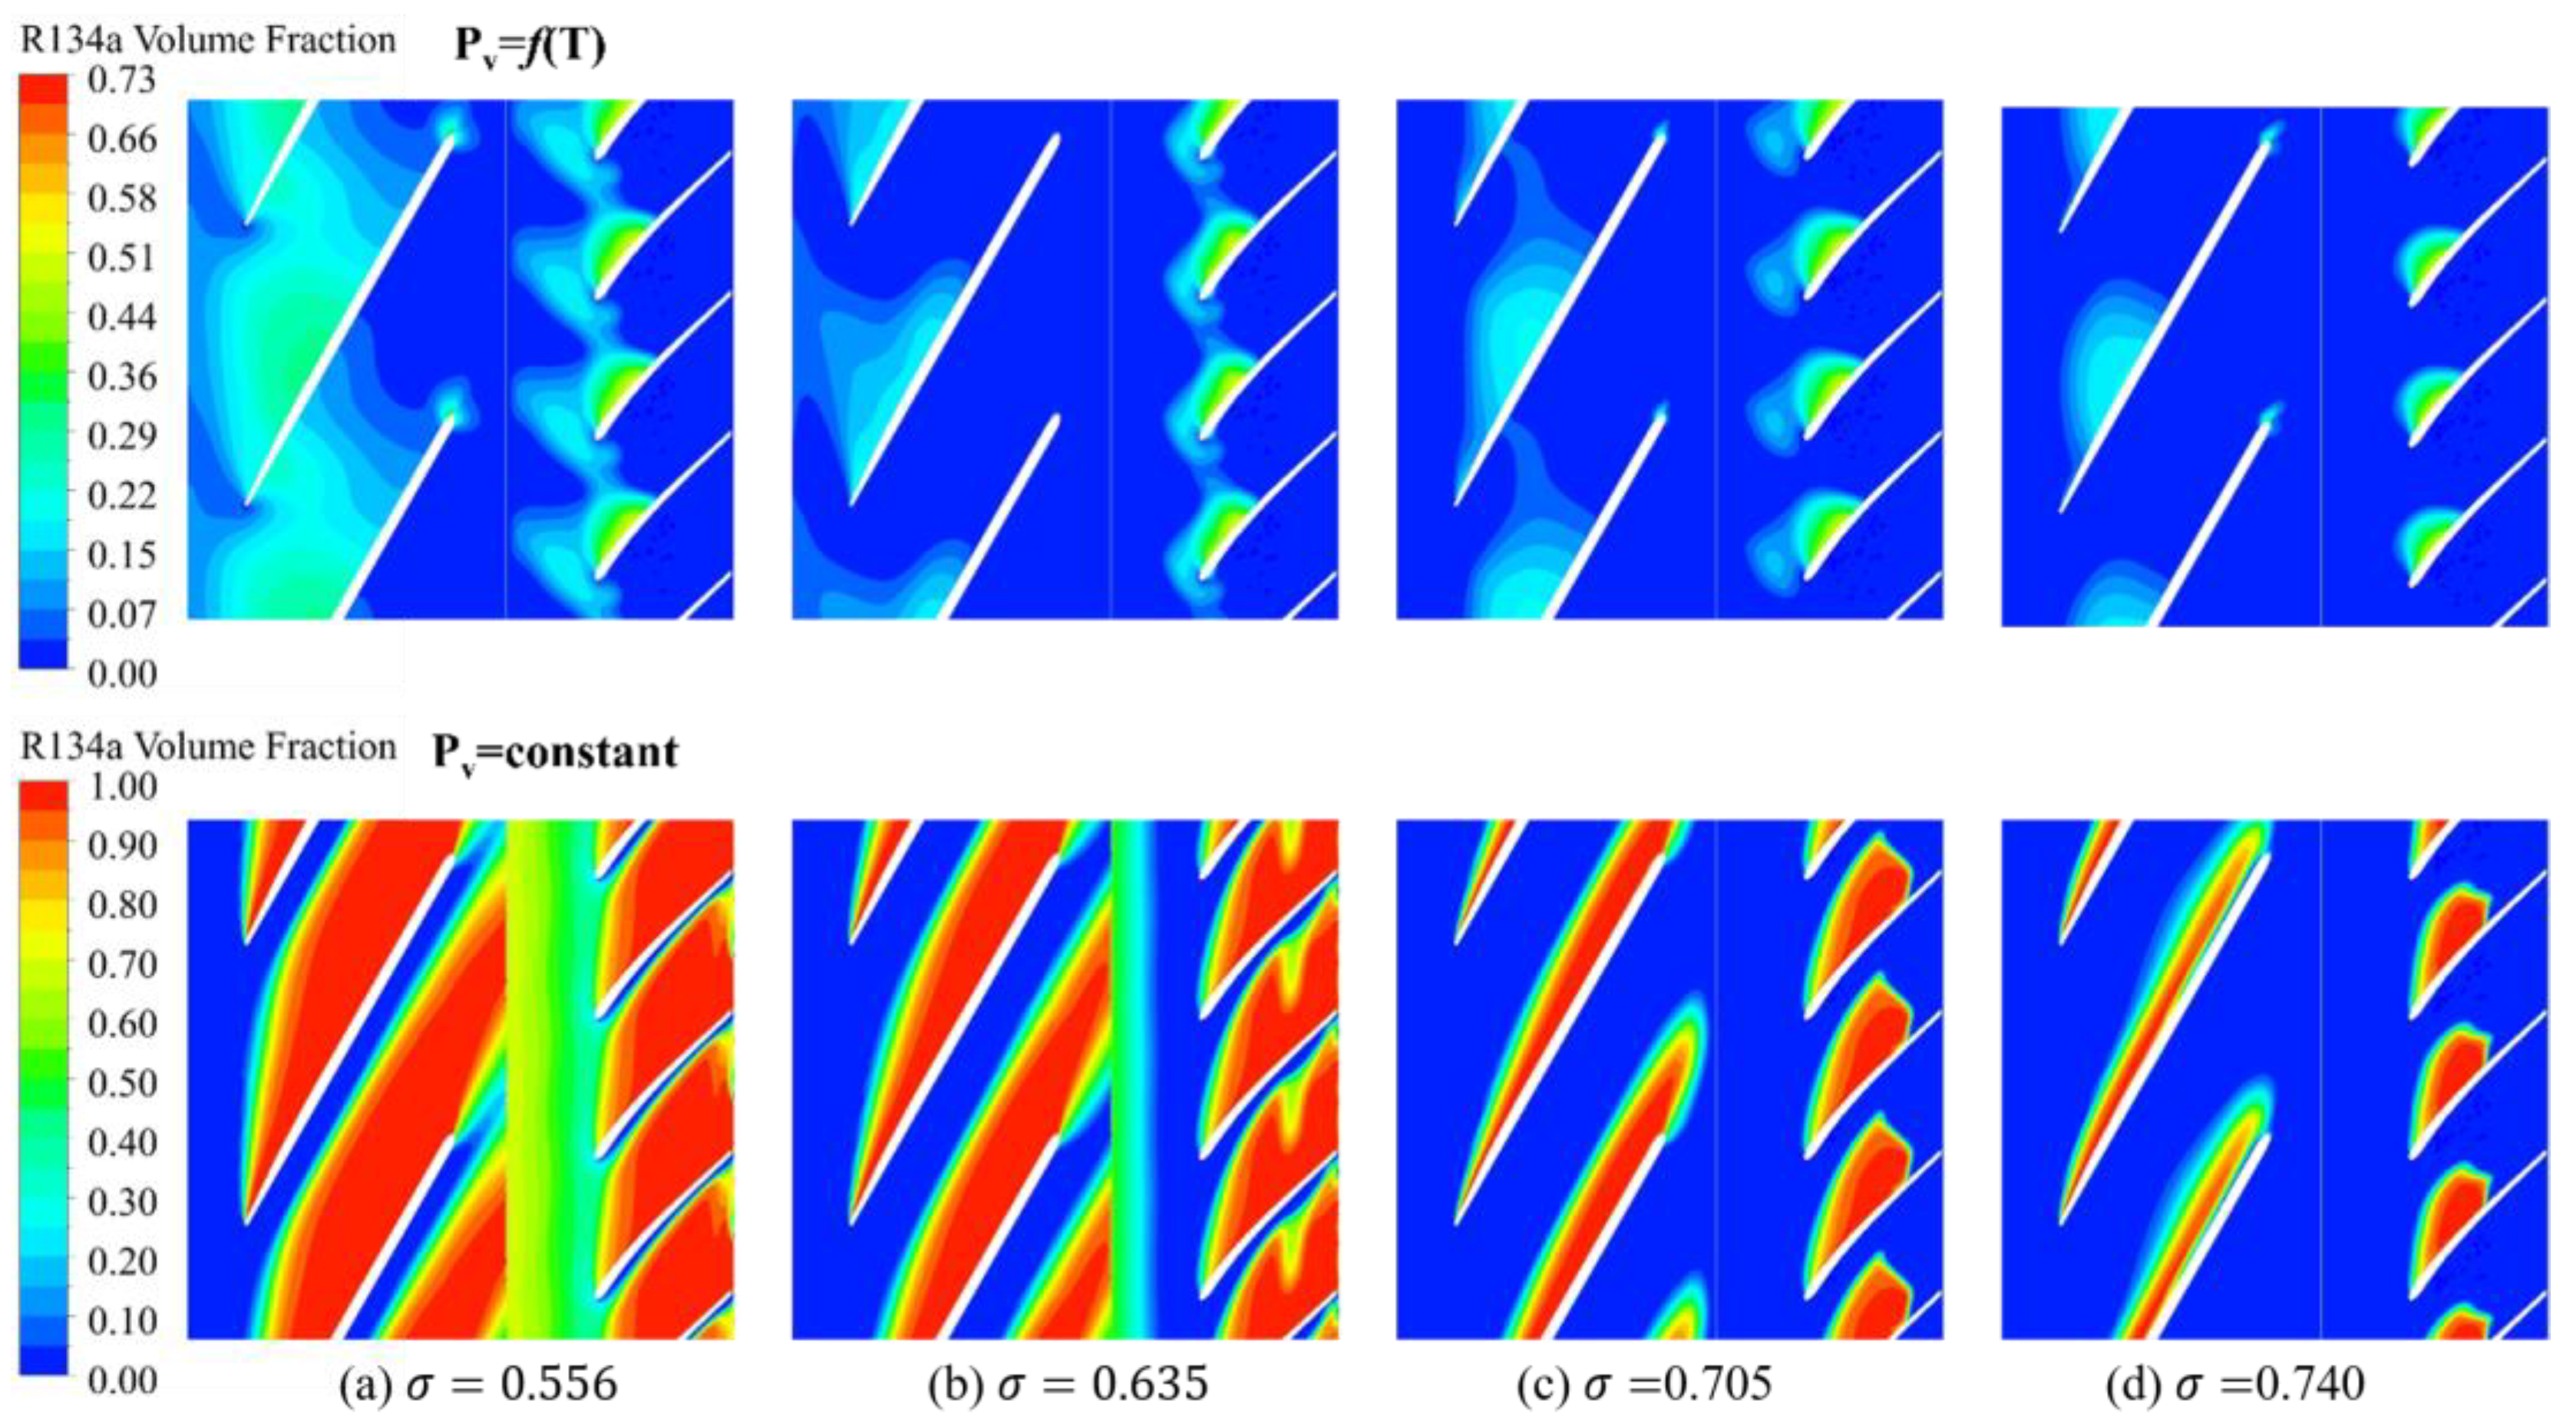
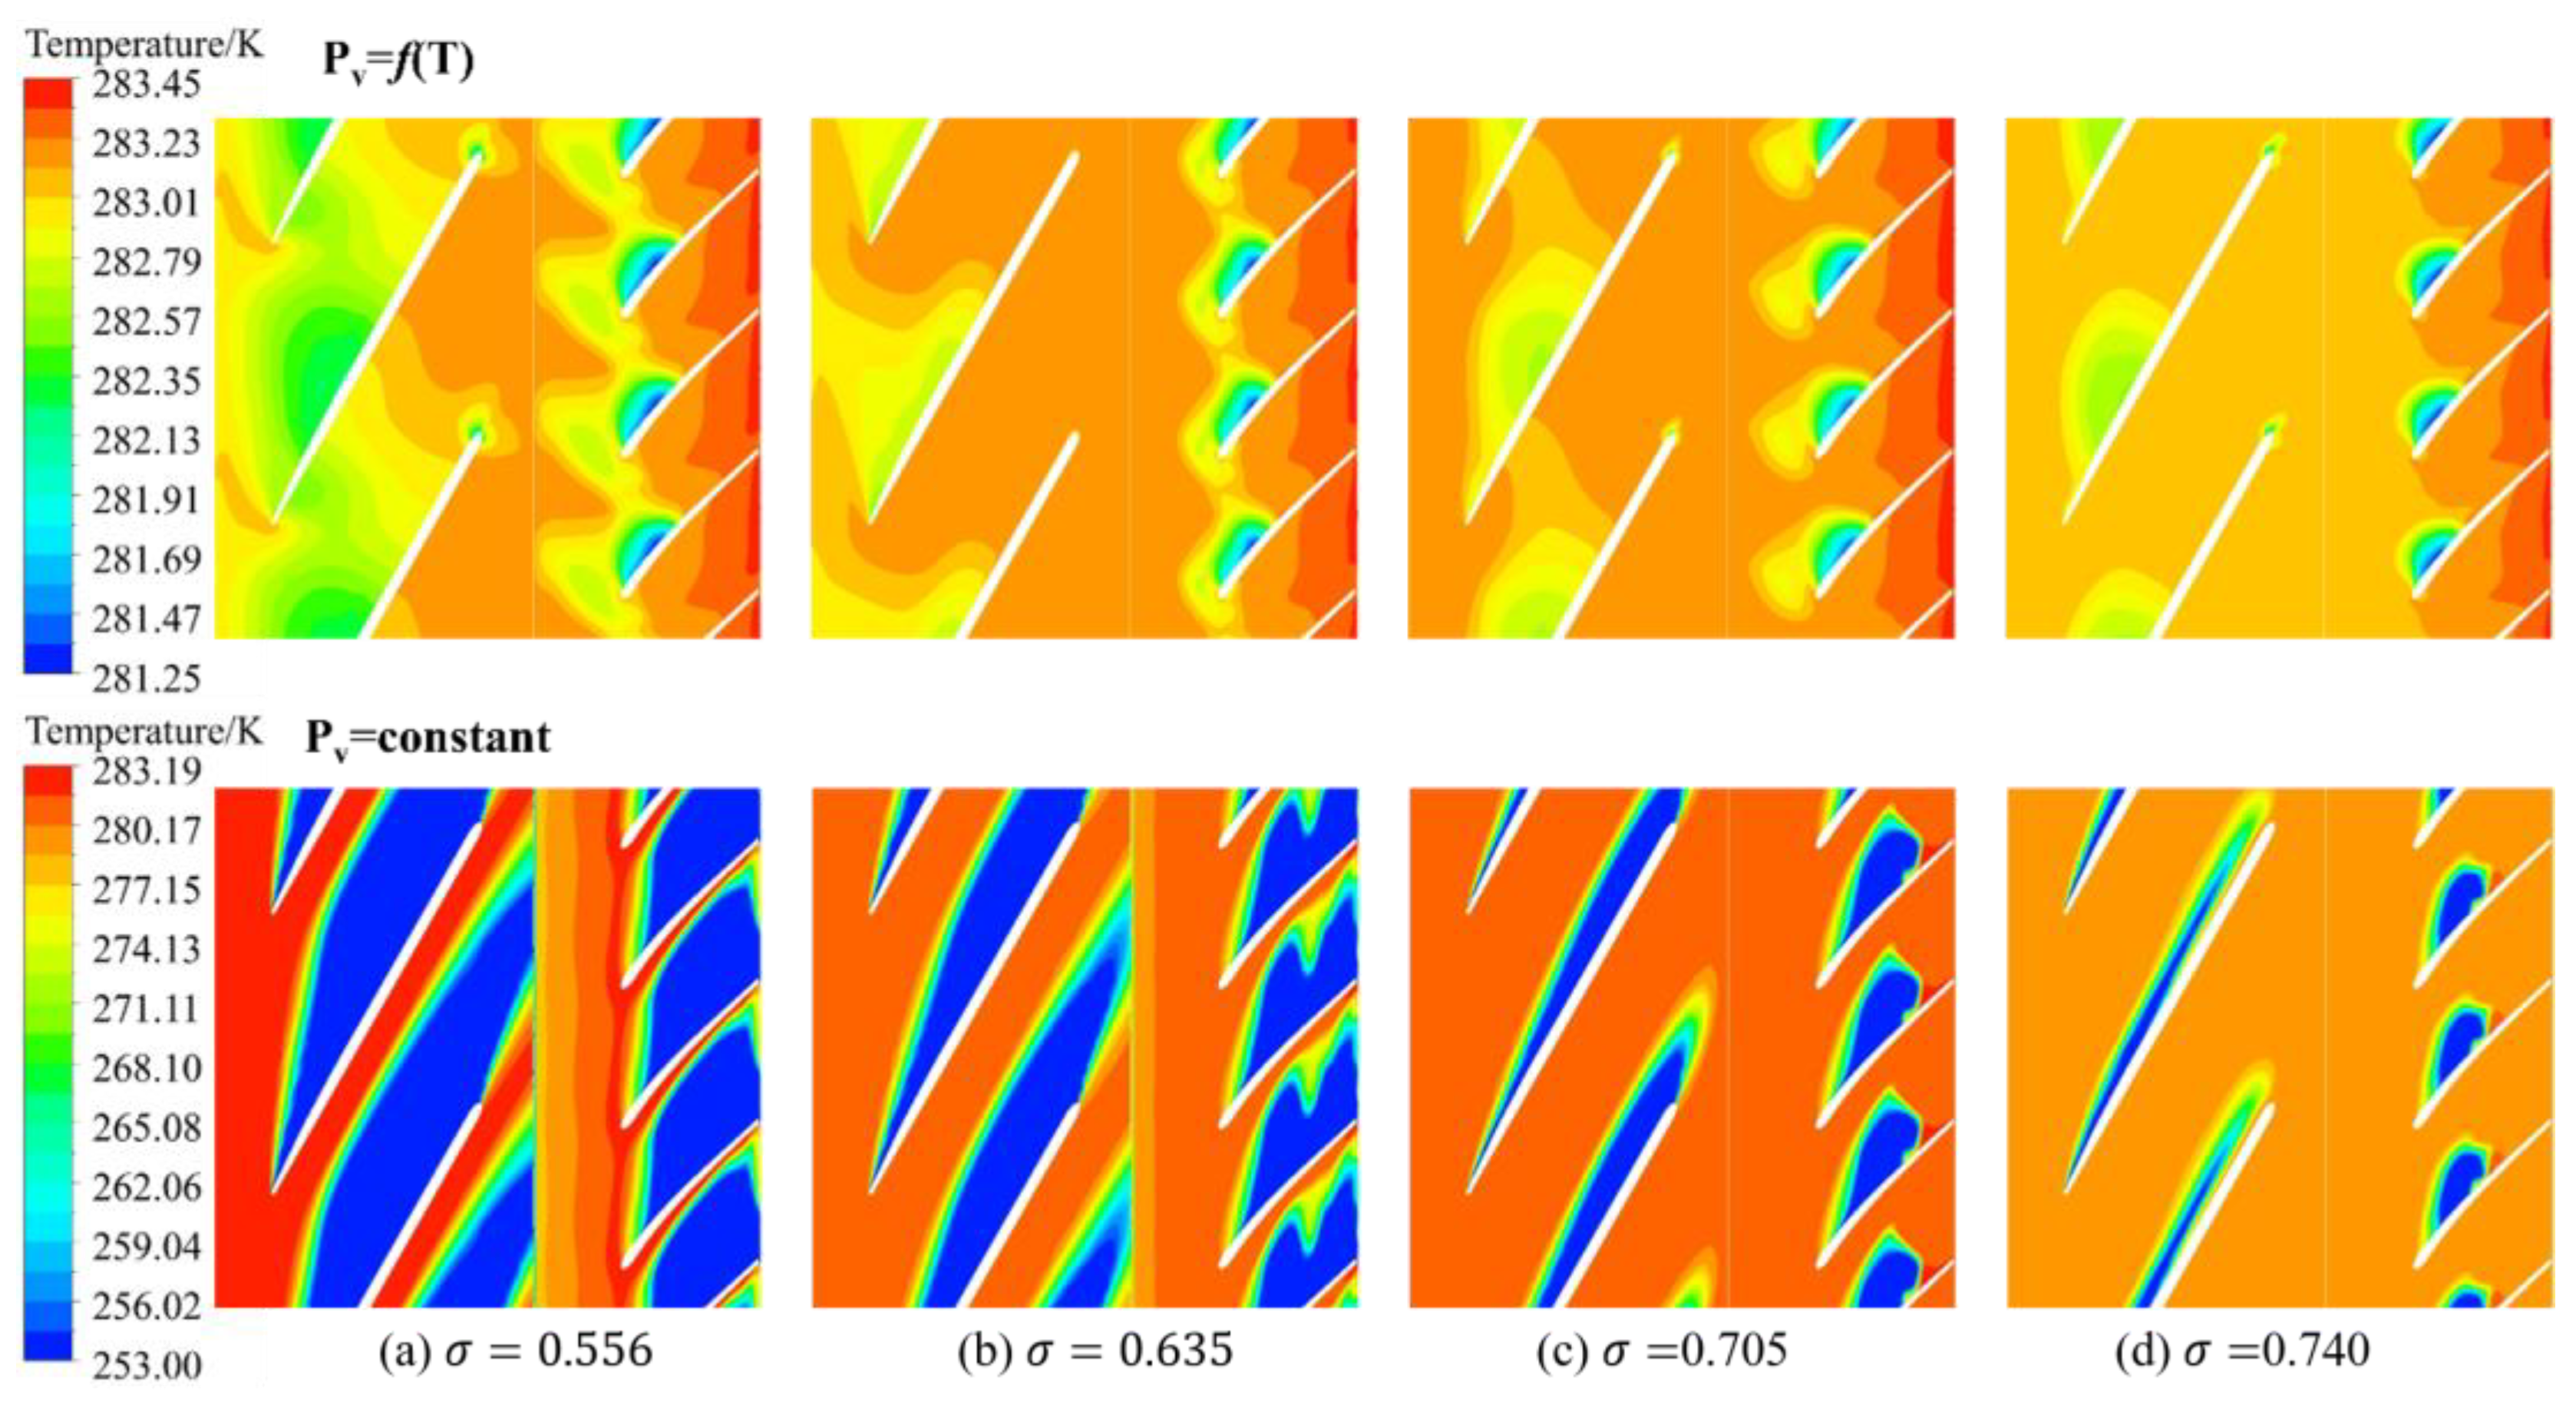
The cavitation thermal effect varies for different working fluids. Table 3 compares the thermophysical properties of water and refrigerant. Due to the enormous difference in thermophysical properties, the influence of the thermal effect of the working fluid on cavitation is also very different. The cavitation thermal effect can be ignored for the water cavitation process at 288 K. The thermal effect has a more substantial influence on the cavitation process for the refrigerant than water, which also complicates the cavitation mechanism of the refrigerant. To further investigate the impact of thermal effects on the cavitation process within the prototype, the numerical simulation modifies the saturation pressure of the refrigerant from a non-isothermal model, represented by a polynomial function of temperature, to an isothermal model.
Figure 21 shows that the thermal effects of the R134a refrigerant have significant impacts on the local distribution and flow characteristics of cavitation clouds. When ignoring the thermal effects, cavitation clouds generated at the inducer and impeller leading edges propagate downstream along the suction surface of the blades as the cavitation number decreases. The length and thickness of the clouds gradually increase, and there is a clear distinction between the gas and liquid phases of R134a refrigerant within the cavitation region. The gaseous refrigerant nearly fills the area. However, in the case of the non-isothermal model, the gas phase volume fraction of refrigerant within the cavitation region is mostly below 50%, exhibiting a mist-like appearance. The cavitation clouds within the inducer passages appear thicker and shorter by the influence of rotational effects. Additionally, the cavitation clouds are more prone to fill the entire flow passage, leading to blockage.
Figure 22 illustrates the impact of thermal effects on the variation of fluid temperature during the cavitation process in the prototype. It can be observed that the simulations using the isothermal model significantly overestimate the temperature drop during cavitation, reaching as high as 30 K. In contrast, when the non-isothermal model is employed, the temperature drop in the core region of the cavitation cloud is only around 2 K.
Figure 23 depicts the distribution of the refrigerant bubble volume fraction, which varies from the temperature in the inducer-installed pump. As the temperature increases, the thermal effects of R134a refrigerant intensify, rapidly suppressing cavitation clouds’ development. When the temperature rises from 273 K to 293 K, the cavitation cloud, which would nearly block the entire inducer flow passage, diminishes to small-scale cavitation clouds adhering to the leading edge of the inducer blades on the suction side.

5. Conclusions

In this paper, a fluid self-lubricating centrifugal pump utilizing R134a refrigerant was proposed to investigate the distribution regularities of pressure, temperature, relative velocity, and bubble volume under different operating conditions. The main conclusions of this study are as follows:
  • The numerical model of the centrifugal pump, which utilizes R134a refrigerant and incorporates a self-lubricating mechanism, demonstrates excellent predictive capability for hydraulic performance. By employing a modified Sauer-Schnerr cavitation numerical model, the cavitating performance was accurately predicted. The head coefficient value at design conditions was 0.9981, with a calculation error of 2.6%. The numerical calculations yielded a critical cavitation number of 0.546, which closely matched the experimental value of 0.551, and a breakdown number of 0.347, compared to the experimental value of 0.412.
  • With the cavitation number decreases, a significant change occurs to the pump head, and cavitation clouds originate from the leading edge of the inducer and develop downstream along the suction side of the inducer blades. When the cavitation number falls below the critical value, cavitation clouds begin to emerge at the trailing edge of the inducer. The bubbles gradually expand within the flow passage, leading to a sudden decrease in the impeller blades’ pressure capacity and a rapid drop of the pump head.
  • The installation of an inducer at the impeller’s upstream reduces effectively the pump’s critical and breakdown numbers. After installing the inducer, the critical cavitation number decreases from 0.783 to 0.566, and the breakdown number decreases from 0.718 to 0.372. Different from the pump with an inducer, the pump head curve drops more steeply after reaching the critical cavitation number, indicating that the cavitation condition in the flow passages deteriorates rapidly with decreasing inlet pressure.
  • With the occurrence of cavitation, the thermal effect of refrigerant impacts the cavitating process of the pump. In the case of the isothermal model, the bubble fraction and temperature drop were overestimated, reaching 100% and 30 K, respectively. However, in the non-isothermal model, these values were less than 50% and 2 K, respectively. The thermal effect of the refrigerant suppresses the development of cavitation clouds due to the temperature increase.
As for the refrigerant centrifugal pump, the internal flow characteristics and thermal physical properties of refrigerants are crucial to its performance. The results obtained from this study can provide valuable guidance for the hydraulic design of refrigerant centrifugal pumps.

Author Contributions

Software, X.F.; validation, X.F. and B.Z.; formal analysis, X.F.; investigation, H.Z.; resources, Y.H.; data curation, X.L.; writing—original draft preparation, X.F. and B.Z.; writing—review and editing, S.C.; visualization, R.X.; supervision, Z.Z.; project administration, Z.Z. All authors have read and agreed to the published version of the manuscript.

Funding

This research was funded by the China Postdoctoral Science Foundation (No. 2021M692533) and the Youth Innovation Team of Shaanxi Universities.

Institutional Review Board Statement

Not applicable.

Informed Consent Statement

Not applicable.

Data Availability Statement

Not applicable.

Conflicts of Interest

The authors declare no conflict of interest.

References

  1. Marcinichen, J.B.; Olivier, J.A.; Thome, J.R. On-Chip Two-Phase Cooling of Datacenters: Cooling System and Energy Recovery Evaluation. Appl. Therm. Eng. 2012, 41, 36–51. [Google Scholar] [CrossRef] [Green Version]
  2. Zhou, F.; Wei, C.; Ma, G. Development and Analysis of a Pump-Driven Loop Heat Pipe Unit for Cooling a Small Data Center. Appl. Therm. Eng. 2017, 124, 1169–1175. [Google Scholar] [CrossRef]
  3. Chen, X.; Ding, T.; Cao, H.; Ding, H.; Li, Z. Flow Boiling Heat Transfer Mechanisms and Flow Characteristics of Pump-Driven Two-Phase Flow Systems Used in Data Center Cooling. Appl. Therm. Eng. 2023, 220, 119642. [Google Scholar] [CrossRef]
  4. Nakano, S.; Kishibe, T.; Inoue, T.; Shiraiwa, H. An Advanced Microturbine System with Water-Lubricated Bearings. Int. J. Rotating Mach. 2009, 2009, 718107. [Google Scholar] [CrossRef] [Green Version]
  5. Yuan, X.; Zhang, G.; Zhao, W.; Li, Z.; Yang, S. Theoretical and Experimental Approach for the Characteristics of Water-Lubricated, High-Speed Double Spiral-Groove Face Seals. In International Joint Tribology Conference; American Society of Mechanical Engineers Digital Collection: New York, NY, USA, 2008; pp. 399–407. [Google Scholar]
  6. Yuan, X.; Zhang, G.; Li, B.; Miao, X. Theoretical and Experimental Results of Water-Lubricated, High-Speed, Short-Capillary-Compensated Hybrid Journal Bearings. In International Joint Tribology Conference; American Society of Mechanical Engineers Digital Collection: New York, NY, USA, 2008; pp. 391–398. [Google Scholar]
  7. Kumar, V.; Sharma, S.C.; Jain, S.C. On the Restrictor Design Parameter of Hybrid Journal Bearing for Optimum Rotordynamic Coefficients. Tribol. Int. 2006, 39, 356–368. [Google Scholar] [CrossRef]
  8. Prehn, R.; Haupert, F.; Friedrich, K. Sliding Wear Performance of Polymer Composites under Abrasive and Water Lubricated Conditions for Pump Applications. Wear 2005, 259, 693–696. [Google Scholar] [CrossRef]
  9. Soyama, H.; Li, S.R.; Tonosaki, M.; Uranishi, K.; Kato, H.; Oba, R. High-Speed Observations of Severe Cavitation Erosion in a High-Specific-Speed Centrifugal Pump. Trans. Jpn. Soc. Mech. Eng. Part B 1995, 61, 3945–3951. [Google Scholar] [CrossRef]
  10. Arndt, R.E.A. Cavitation in Fluid Machinery and Hydraulic Structures. Annu. Rev. Fluid Mech. 1981, 13, 273–326. [Google Scholar] [CrossRef]
  11. Horiguchi, H.; Watanabe, S.; Tsujimoto, Y. A Linear Stability Analysis of Cavitation in a Finite Blade Count Impeller. J. Fluids Eng. 2000, 122, 798–805. [Google Scholar] [CrossRef]
  12. Xue, R.; Lin, X.; Zhang, B.; Zhou, H.; Lai, T.; Hou, Y. CFD and Energy Loss Model Analysis of High-Speed Centrifugal Pump with Low Specific Speed. Appl. Sci. 2022, 12, 7435. [Google Scholar] [CrossRef]
  13. Xue, R.; Cai, Y.; Fang, X.; Chen, L.; Zhang, X.; Hou, Y. Optimization Study on a Novel High-Speed Oil-Free Centrifugal Water Pump with Hydrodynamic Bearings. Appl. Sci. 2019, 16, 3050. [Google Scholar] [CrossRef] [Green Version]
  14. Bai, L.; Zhou, L.; Han, C.; Zhu, Y.; Shi, W. Numerical Study of Pressure Fluctuation and Unsteady Flow in a Centrifugal Pump. Processes 2019, 7, 354. [Google Scholar] [CrossRef] [Green Version]
  15. Lin, X.; Zhang, B.; Zhang, M.; Zhao, Y.; Lai, T.; Chen, L.; Xue, R. Influence of Internal Flow on the Performance of High-Speed Centrifugal Pumps with a Fully Sealed Structure. Appl. Sci. 2022, 12, 5263. [Google Scholar] [CrossRef]
  16. Fang, X.; Hou, Y.; Cai, Y.; Chen, L.; Lai, T.; Chen, S. Study on a High-Speed Oil-Free Pump with Fluid Hydrodynamic Lubrication. Adv. Mech. Eng. 2020, 12, 1687814020945463. [Google Scholar] [CrossRef]
  17. Kobayashi, K.; Chiba, Y. Computational Fluid Dynamics of Cavitating Flow in Mixed Flow Pump with Closed Type Impeller. Int. J. Fluid Mach. Syst. 2010, 3, 113–121. [Google Scholar] [CrossRef]
  18. Xu, Y.; Tan, L.; Liu, Y.; Cao, S. Pressure Fluctuation and Flow Pattern of a Mixed-Flow Pump with Different Blade Tip Clearances under Cavitation Condition. Adv. Mech. Eng. 2017, 9, 1687814017696227. [Google Scholar] [CrossRef] [Green Version]
  19. Medvitz, R.B.; Kunz, R.F.; Boger, D.A.; Lindau, J.W.; Yocum, A.M.; Pauley, L.L. Performance Analysis of Cavitating Flow in Centrifugal Pumps Using Multiphase CFD. J. Fluids Eng. 2002, 124, 377–383. [Google Scholar] [CrossRef]
  20. Fukaya, M.; Tamura, Y.; Matsumoto, Y. Prediction of Cavitation Intensity and Erosion Area in Centrifugal Pump by Using Cavitating Flow Simulation with Bubble Flow Model. J. Fluid Sci. Technol. 2010, 5, 305–316. [Google Scholar] [CrossRef] [Green Version]
  21. Wang, Y.; Liu, H.; Liu, D.; Yuan, S.; Wang, J.; Jiang, L. Application of the Two-Phase Three-Component Computational Model to Predict Cavitating Flow in a Centrifugal Pump and Its Validation. Comput. Fluids 2016, 131, 142–150. [Google Scholar] [CrossRef]
  22. Stopa, M.M.; Cardoso Filho, B.J.; Martinez, C.B. Incipient Detection of Cavitation Phenomenon in Centrifugal Pumps. IEEE Trans. Ind. Applicat. 2014, 50, 120–126. [Google Scholar] [CrossRef]
  23. Cui, B.; Han, X.; An, Y. Numerical Simulation of Unsteady Cavitation Flow in a Low-Specific-Speed Centrifugal Pump with an Inducer. JMSE 2022, 10, 630. [Google Scholar] [CrossRef]
  24. Franc, J.-P.; Rebattet, C.; Coulon, A. An Experimental Investigation of Thermal Effects in a Cavitating Inducer. J. Fluids Eng. 2004, 126, 716–723. [Google Scholar] [CrossRef] [Green Version]
  25. Franc, J.-P.; Janson, E.; Morel, P.; Rebattet, C.; Riondet, M. Visualizations of Leading Edge Cavitation in an Inducer at Different Temperatures. In Proceedings of the 4th International Symposium on Cavitation, Pasadena, CA, USA, 20–23 June 2001. [Google Scholar]
  26. Cervone, A.; Testa, R.; Bramanti, C.; Rapposelli, E.; d’Agostino, L. Thermal Effects on Cavitation Instabilities in Helical Inducers. J. Propuls. Power 2005, 21, 893–899. [Google Scholar] [CrossRef]
  27. Rapposelli, E. A barotropic cavitation model with thermodynamic effects. In Proceedings of the 5th International Symposium on Cavitation CAV2003, Osaka, Japan, 1–4 November 2003. [Google Scholar]
  28. Palgrave, R.; Cooper, P. Visual Studies of Cavitation in Pumping Machinery. In Proceedings of the 3rd International Pump Symposium, College Station, TX, USA, 1 May 1986. [Google Scholar] [CrossRef]
  29. Lu, J.; Yuan, S.; Parameswaran, S.; Yuan, J.; Ren, X.; Si, Q. Investigation on the Vibration and Flow Instabilities Induced by Cavitation in a Centrifugal Pump. Adv. Mech. Eng. 2017, 9, 168781401769622. [Google Scholar] [CrossRef] [Green Version]
  30. Gao, B.; Guo, P.; Zhang, N.; Li, Z.; Yang, M. Experimental Investigation on Cavitating Flow Induced Vibration Characteristics of a Low Specific Speed Centrifugal Pump. Shock Vib. 2017, 2017, 6568930. [Google Scholar] [CrossRef] [Green Version]
  31. Zhang, N.; Gao, B.; Li, Z.; Jiang, Q. Cavitating Flow-Induced Unsteady Pressure Pulsations in a Low Specific Speed Centrifugal Pump. R. Soc. Open Sci. 2018, 5, 180408. [Google Scholar] [CrossRef] [Green Version]
  32. Friedrichs, J.; Kosyna, G. Rotating Cavitation in a Centrifugal Pump Impeller of Low Specific Speed. J. Fluids Eng. 2002, 124, 356–362. [Google Scholar] [CrossRef]
  33. Duplaa, S.; Coutier-Delgosha, O.; Dazin, A.; Roussette, O.; Bois, G.; Caignaert, G. Experimental Study of a Cavitating Centrifugal Pump during Fast Startups. J. Fluids Eng. 2010, 132, 021301. [Google Scholar] [CrossRef]
  34. Shervani-Tabar, N.; Sedaaghi, R.; Mohajerin, R.; Shervani-Tabar, M.T.; Bourisli, R.I. Experimental and Computational Investigation on the Cavitation Phenomenon in a Centrifugal Pump. In Proceedings of the 8th International Symposium on Cavitation, Singapore, 13–16 August 2012; Research Publishing Services: Singapore, 2012; pp. 489–497. [Google Scholar]
  35. Zuo, Z.; Li, S.; Liu, S.; Li, S.; Chen, H. An Attribution of Cavitation Resonance: Volumetric Oscillations of Cloud. J. Hydrodyn. Ser. B 2009, 21, 152–158. [Google Scholar] [CrossRef]
  36. Foeth, E.J.; Van Doorne, C.W.H.; Van Terwisga, T.; Wieneke, B. Time Resolved PIV and Flow Visualization of 3D Sheet Cavitation. Exp. Fluids 2006, 40, 503–513. [Google Scholar] [CrossRef]
  37. Atif, A.; Benmansour, S.; Bois, G.; Dupont, P. Numerical and Experimental Comparison of the Vaned Diffuser Interaction inside the Impeller Velocity Field of a Centrifugal Pump. Sci. China Technol. Sci. 2011, 54, 286–294. [Google Scholar] [CrossRef]
  38. Jia, X.; Zhang, Y.; Lv, H.; Zhu, Z. Study on External Performance and Internal Flow Characteristics in a Centrifugal Pump under Different Degrees of Cavitation. Phys. Fluids 2023, 35, 014104. [Google Scholar] [CrossRef]
  39. Chatterjee, D.; Arakeri, V.H. Towards the Concept of Hydrodynamic Cavitation Control. J. Fluid Mech. 1997, 332, 377–394. [Google Scholar] [CrossRef]
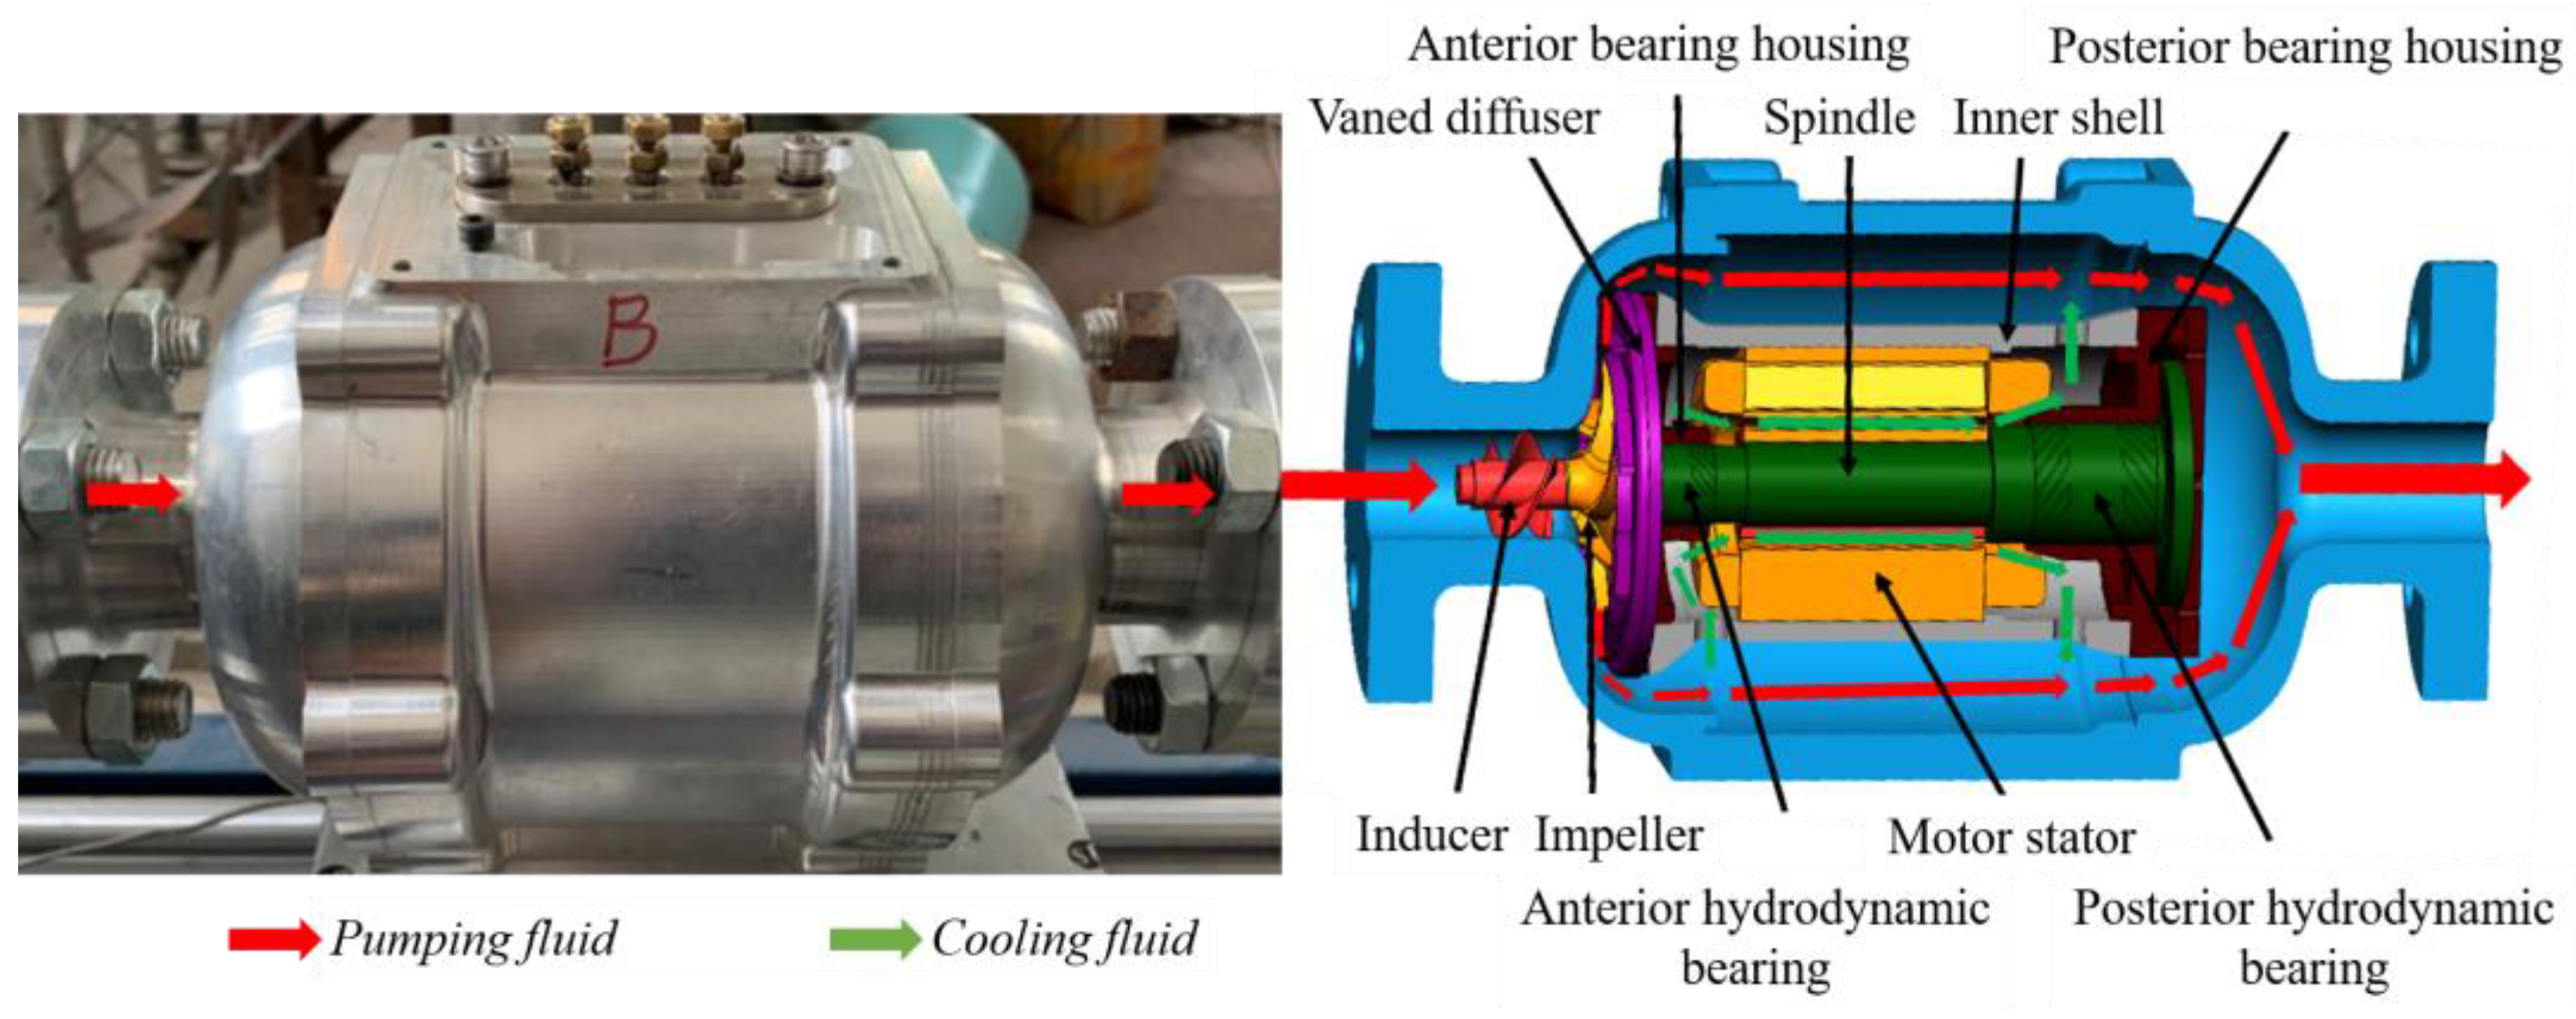
Figure 1. Structure of the centrifugal pump with R134a refrigerant.
Applsci 13 08062 g001
Figure 2. Main hydraulic components and hydrodynamic bearings.
Applsci 13 08062 g002
Figure 3. Test rig for refrigerant pump.
Applsci 13 08062 g003
Figure 4. H-Q curve under designed speed (n = 7500 rpm).
Applsci 13 08062 g004
Figure 5. Cavitation performance curve.
Applsci 13 08062 g005
Figure 6. Calculated domain grid schematic.
Applsci 13 08062 g006
Figure 7. Analysis of mesh independence.
Applsci 13 08062 g007
Figure 8. Numerical model details of hydrodynamic bearing.
Applsci 13 08062 g008
Figure 9. (a) Static pressure and (b) total pressure distributions of hydraulic components in the designed conditions.
Applsci 13 08062 g009
Figure 10. Effects of different degrees of flow rate on (a) static pressure, (b) total pressure, and (c) temperature along the direction of streamline (n = 7500 rpm).
Applsci 13 08062 g010
Figure 11. The nephogram of pressure on the blade-to-blade surface of the inducer under different degrees of flow rates (n = 7500 rpm).
Applsci 13 08062 g011
Figure 12. The relative velocity on the midsection of the impeller and vaned diffuser.
Applsci 13 08062 g012
Figure 13. The relative velocity on the cross-section of the flow guide channel.
Applsci 13 08062 g013
Figure 14. Effect of the eccentricity of radial bearings on the radial capacity for different rotating speeds.
Applsci 13 08062 g014
Figure 15. (a) Thrust bearings capacity and (b) axial force under different flow rates.
Applsci 13 08062 g015
Figure 16. Cavitation performance at the designed condition.
Applsci 13 08062 g016
Figure 17. Effect of inducer under different flow rates.
Applsci 13 08062 g017
Figure 18. (a) Bubble volume fractions along the direction of streamline, (b) bubble volume fractions in the impeller, (c) temperature distributions along the direction of streamline and (d) temperature distributions in the impeller.
Applsci 13 08062 g018aApplsci 13 08062 g018b
Figure 19. Diagram of changes in bubble volume fractions at different degrees of cavitation.
Applsci 13 08062 g019
Figure 20. (a) Bubble volume fractions and (b) temperature distributions under different cavitation numbers.
Applsci 13 08062 g020
Figure 21. The influence of thermal effect on bubble volume fractions under different cavitation.
Applsci 13 08062 g021
Figure 22. The influence of thermal effect on temperature distributions under different cavitation.
Applsci 13 08062 g022
Figure 23. Effect of inlet temperature on bubble volume fractions under the critical cavitation number σ = 0.556.
Applsci 13 08062 g023
Table 1. Main parameters of the prototype.
ParameterSymbolValue
InducerNumber of bladesZla, ind3
Inlet diameterdi127.2 mm
Inlet blade angle α i 1 43°
Wrap angleΔφ160.3°
Outlet diameterdi227.2 mm
ImpellerNumber of bladesZla, imp6
Inlet diameterd327.2 mm
Blade outlet widthb33.8 mm
Outlet blade angle β 2 14.8°
Outlet diameterd464.0 mm
Vaned diffuserNumber of bladesZ38
Inlet diameterd565.0 mm
Outlet angle β 3 5.8°
Outlet diameterd682.0 mm
Table 2. Calculation ranges of numerical model.
Computational DomainRotating Speed/rpm Flow   Rate / m 3 · h 1 Temperature/KCavitation Number
All components3000, 4500, 6000, and 75001~5.5278, 283, and 2880.3~1.0
Without inducer
Without vaned diffuser
Table 3. Comparison of Thermal Properties Between Water and Refrigerant.
Working FluidWaterR134a Refrigerant
Temperature288 K288 K
Saturation pressure1.69 kPa486.03 kPa
Liquid-gas density ratio78519.352.6
Heat of vapor2465.7 kJ/kg186.7 kJ/kg
Liquid thermal conductivity588.45 mW/(m∙K)85.51 mW/(m∙K)
Disclaimer/Publisher’s Note: The statements, opinions and data contained in all publications are solely those of the individual author(s) and contributor(s) and not of MDPI and/or the editor(s). MDPI and/or the editor(s) disclaim responsibility for any injury to people or property resulting from any ideas, methods, instructions or products referred to in the content.