

Water Quality Evaluation, Spatial Distribution Characteristics, and Source Analysis of Pollutants in Wanquan River, China


Abstract
:1. Introduction
2. Data and Methods
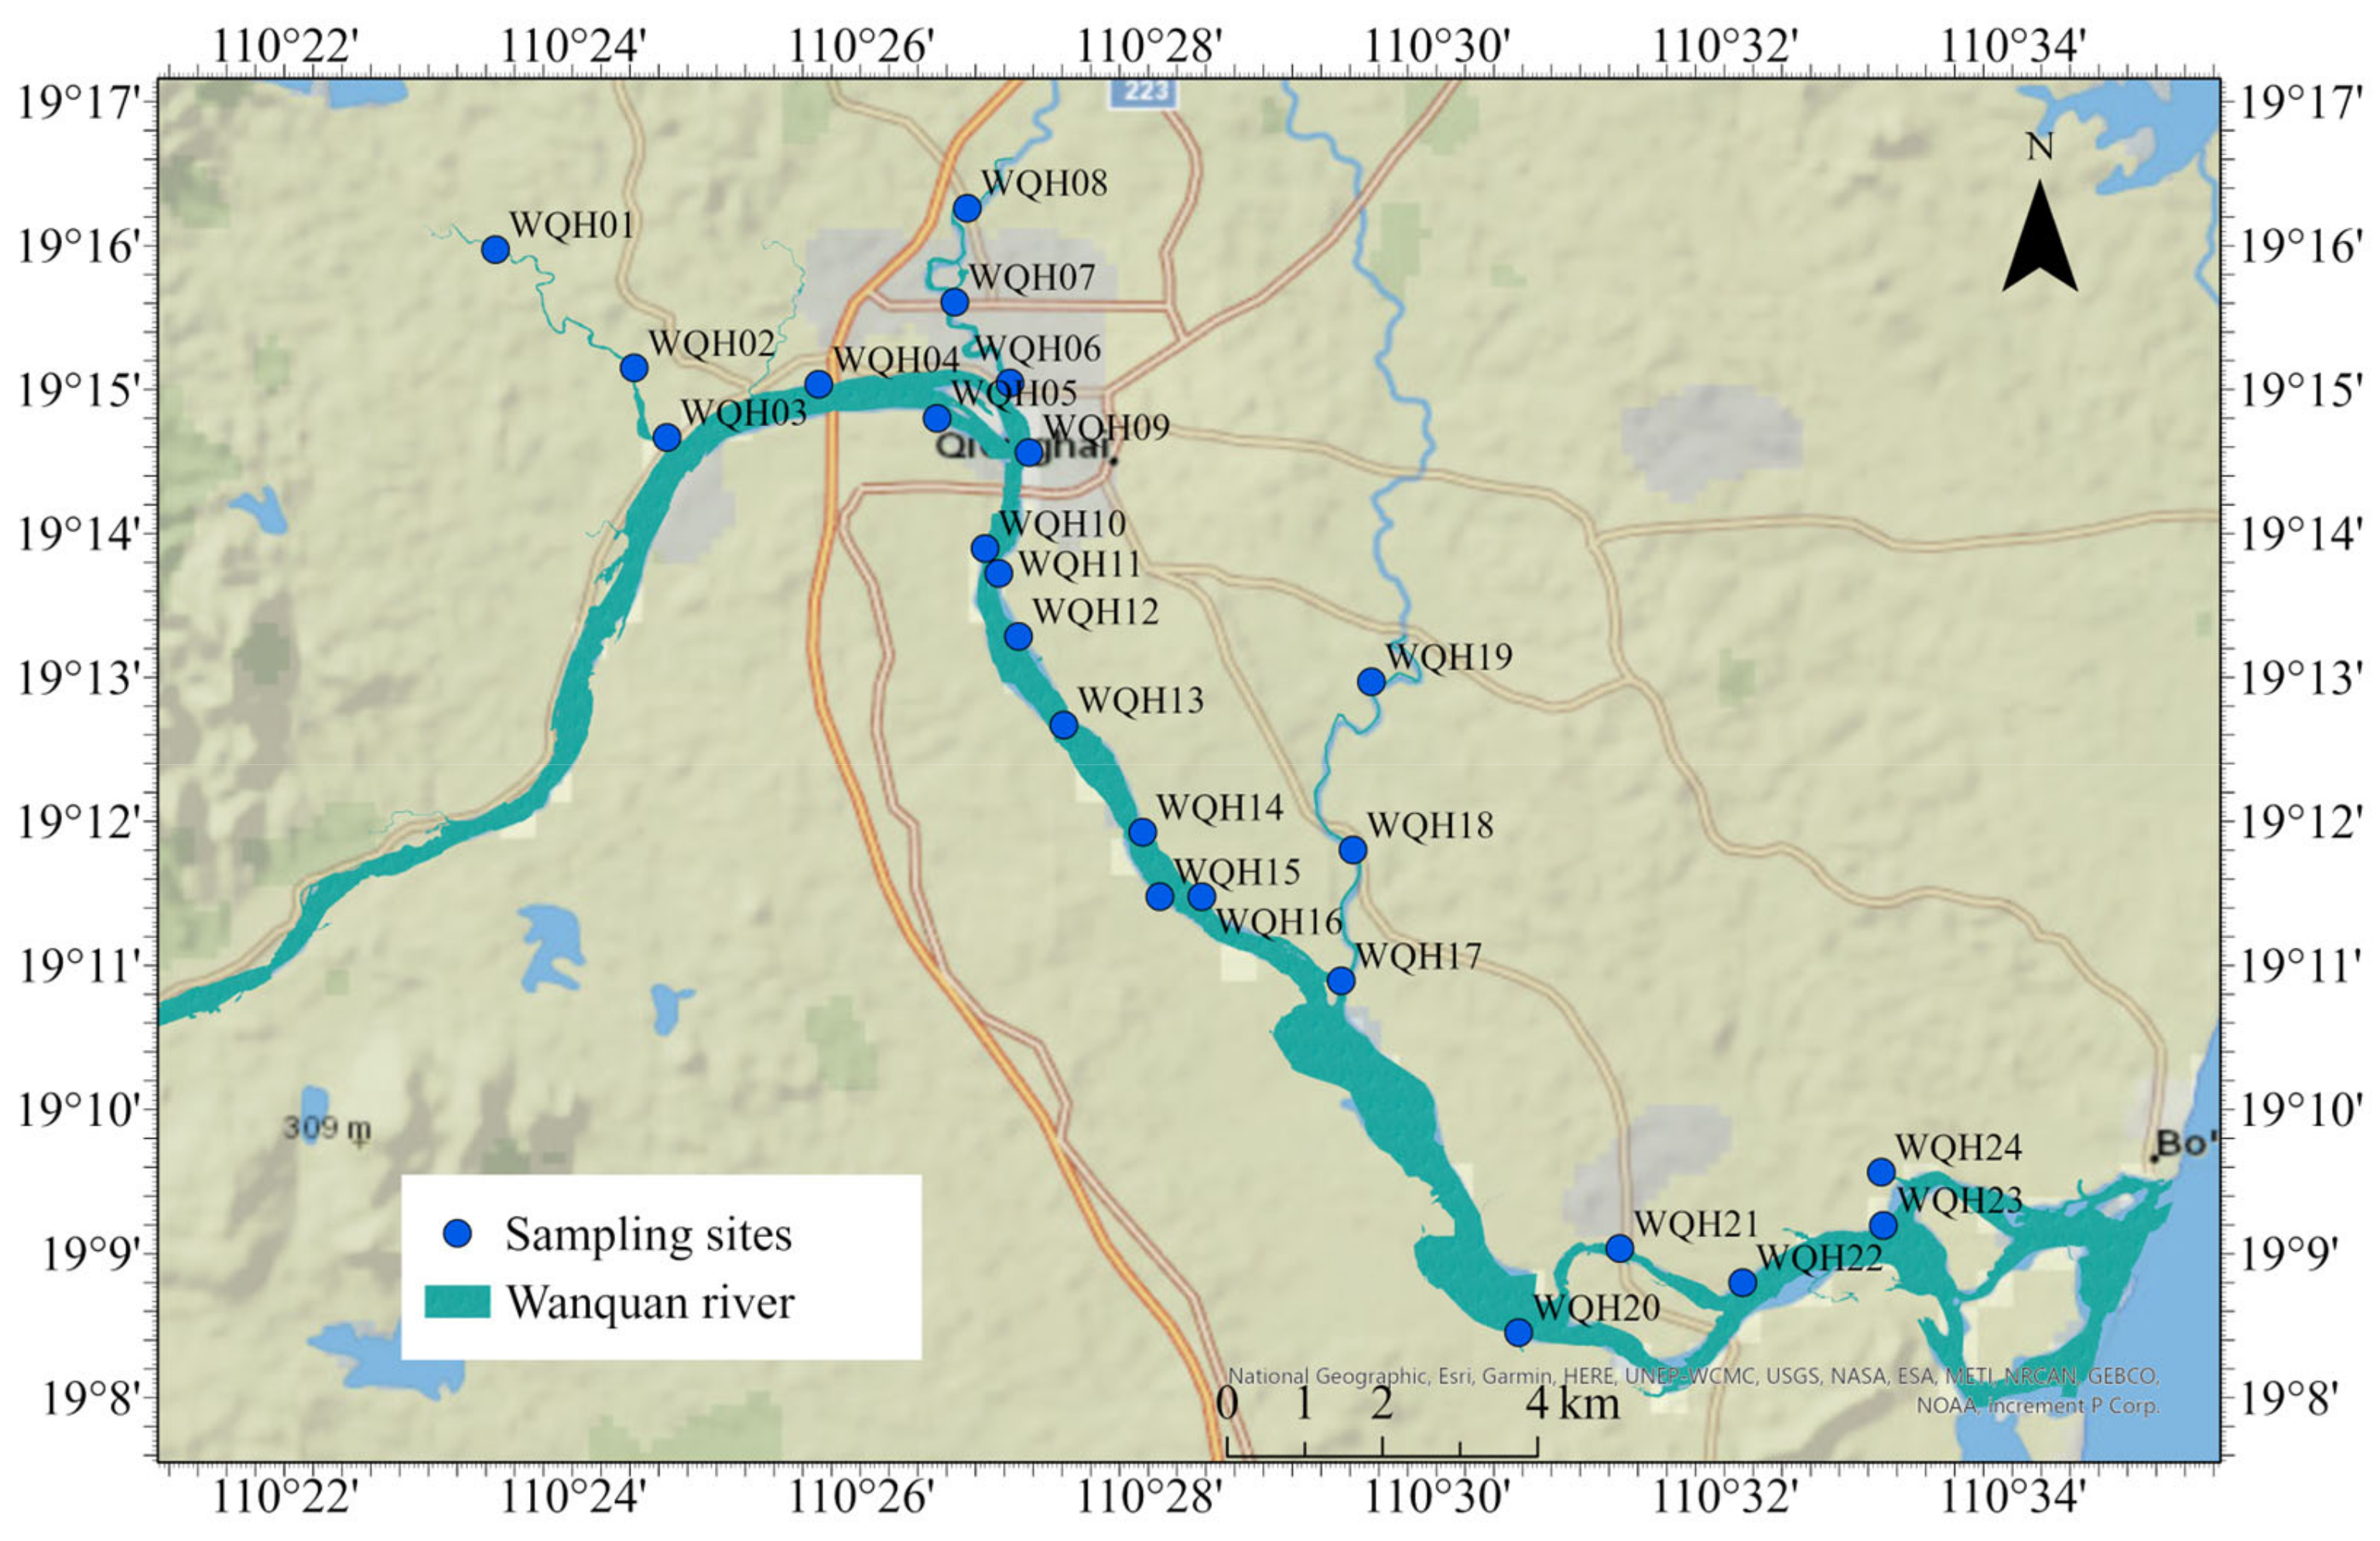
2.1. Overview of the Study Area
2.2. Sample Collection
2.3. Chemical Analysis and Quality Assurance of the Data
2.4. Spatial Interpolation Methods
2.5. Water Quality Assessment Methods
2.5.1. Single Factor Pollution Index Method
2.5.2. Nemerow Pollution Index Method
2.6. Source Analysis Methods
- 1.
- Min-max normalization: eliminate the effects of dimensions and orders of magnitude by subtracting the mean of all variables and dividing by the standard deviation of each variable;
- 2.
- Calculate the correlation coefficient matrix: use the standardized data matrix to calculate its corresponding correlation coefficient matrix, R, and calculate the eigenvalue and eigenvector of R;
- 3.
- Determine the number of principal components: determine the number of principal components m according to the principle that the eigenvalue is greater than 1 or the cumulative contribution rate of principal component variance is greater than 85%;
- 4.
- Calculate the factor score: calculate the score of the top m principal components of each sample and plot the spatial distribution of the factor score.
3. Results and Discussion
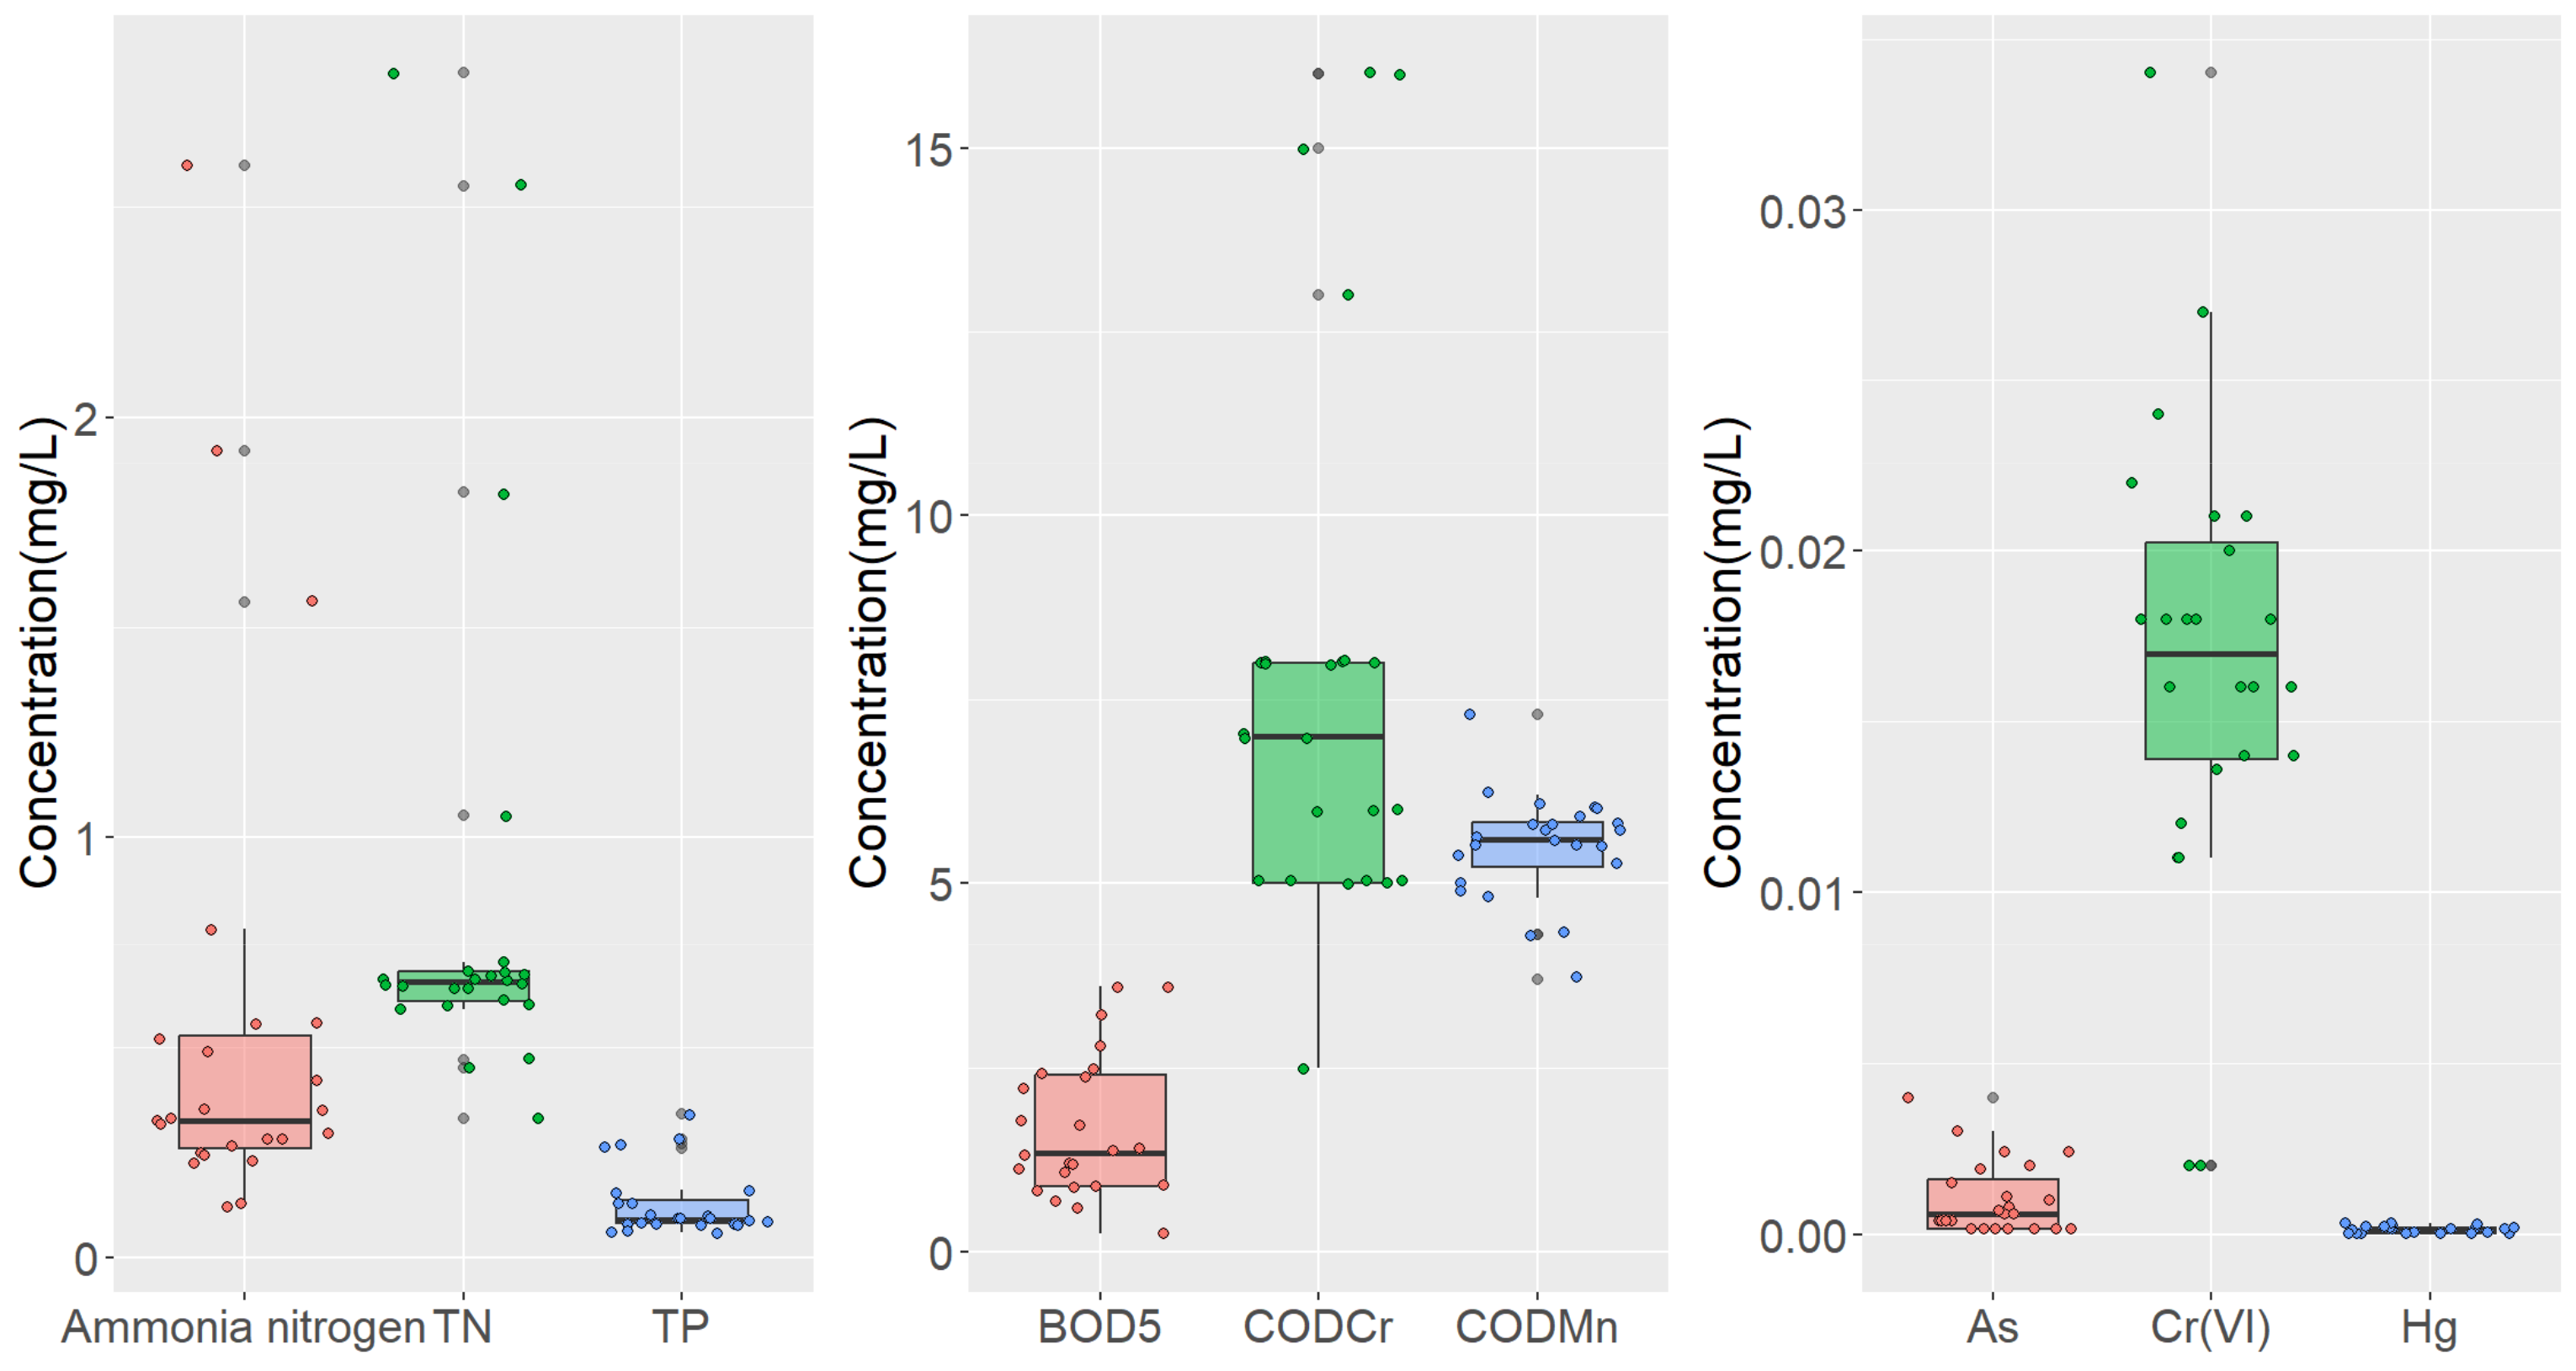
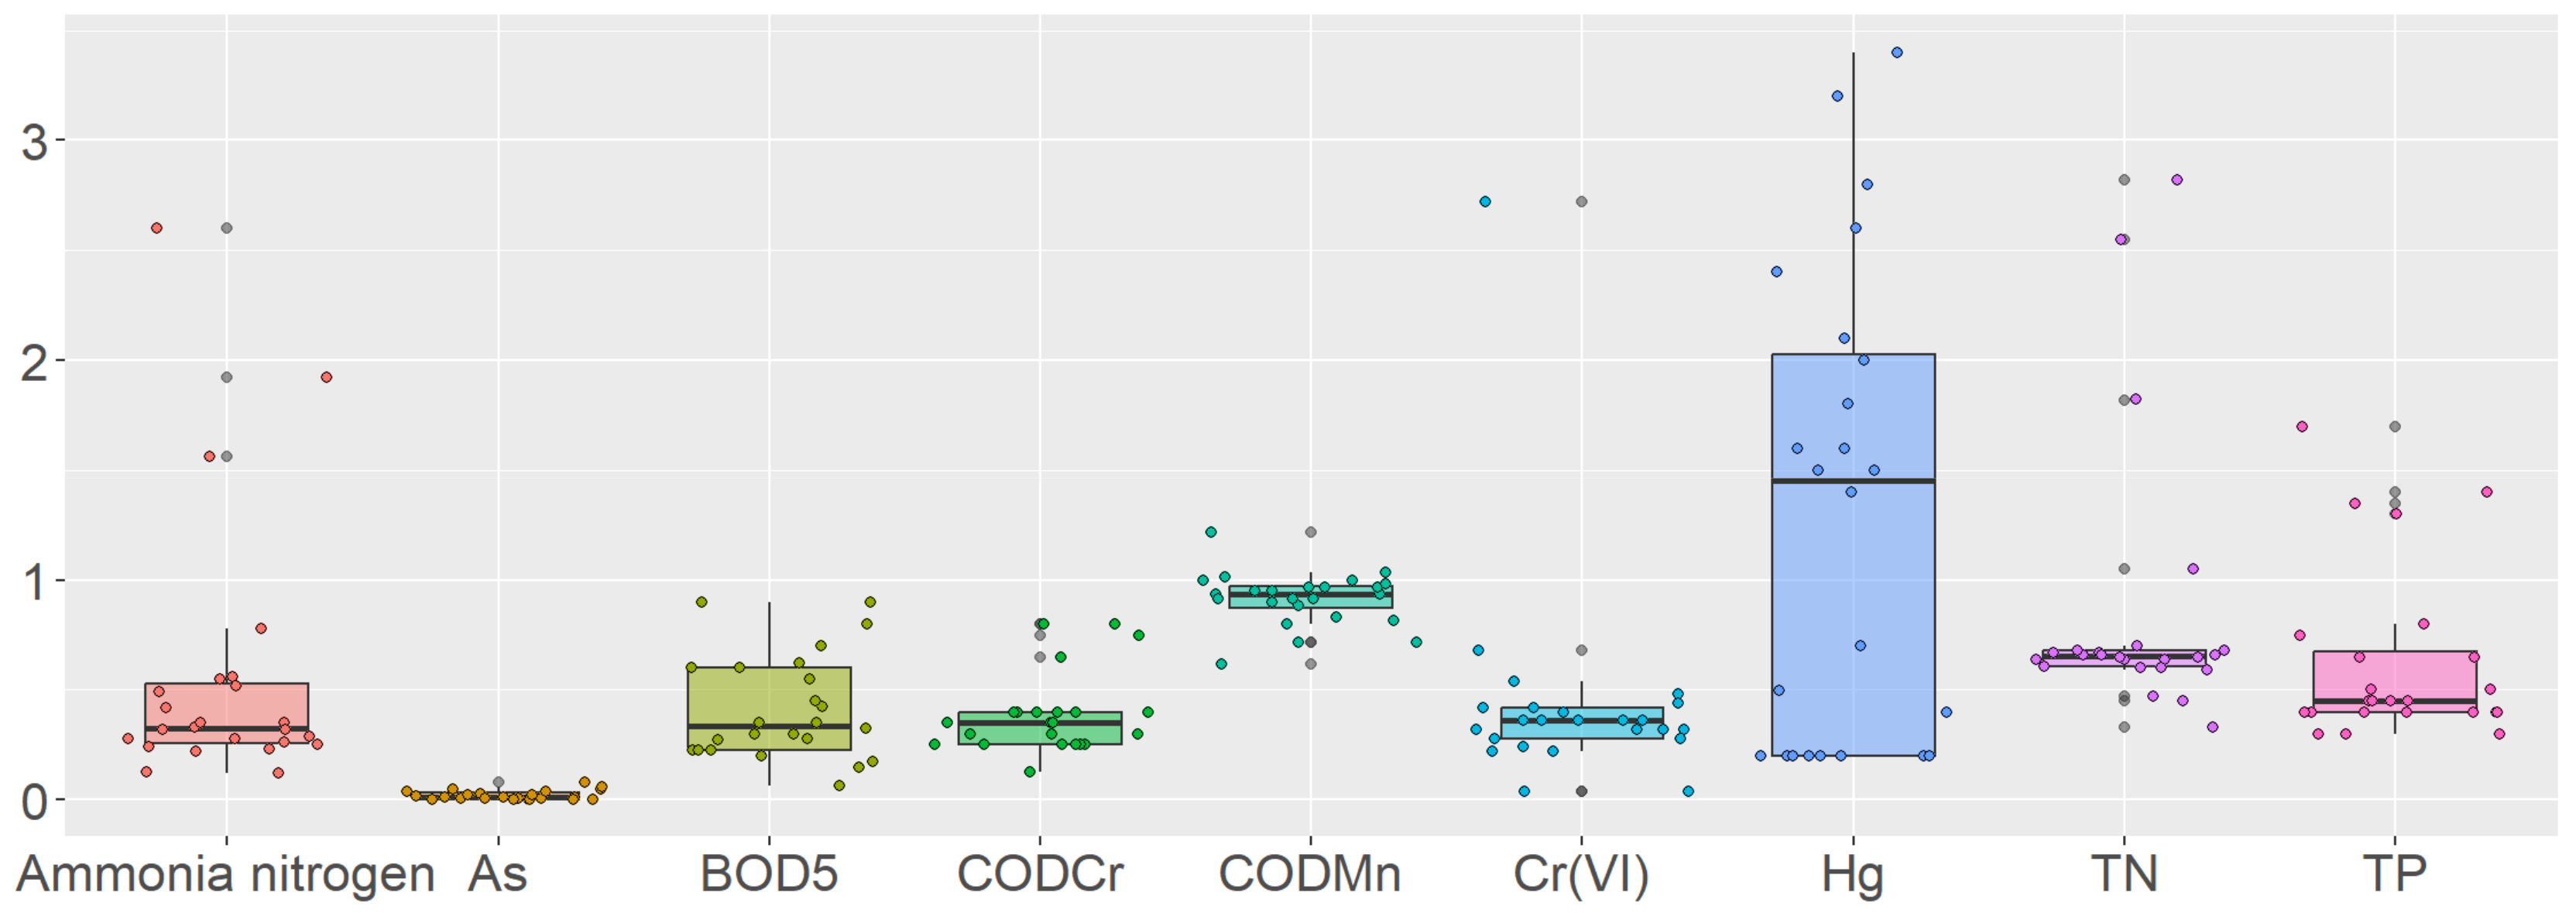
3.1. Statistical Characteristics of Water Quality in the Wanquan River
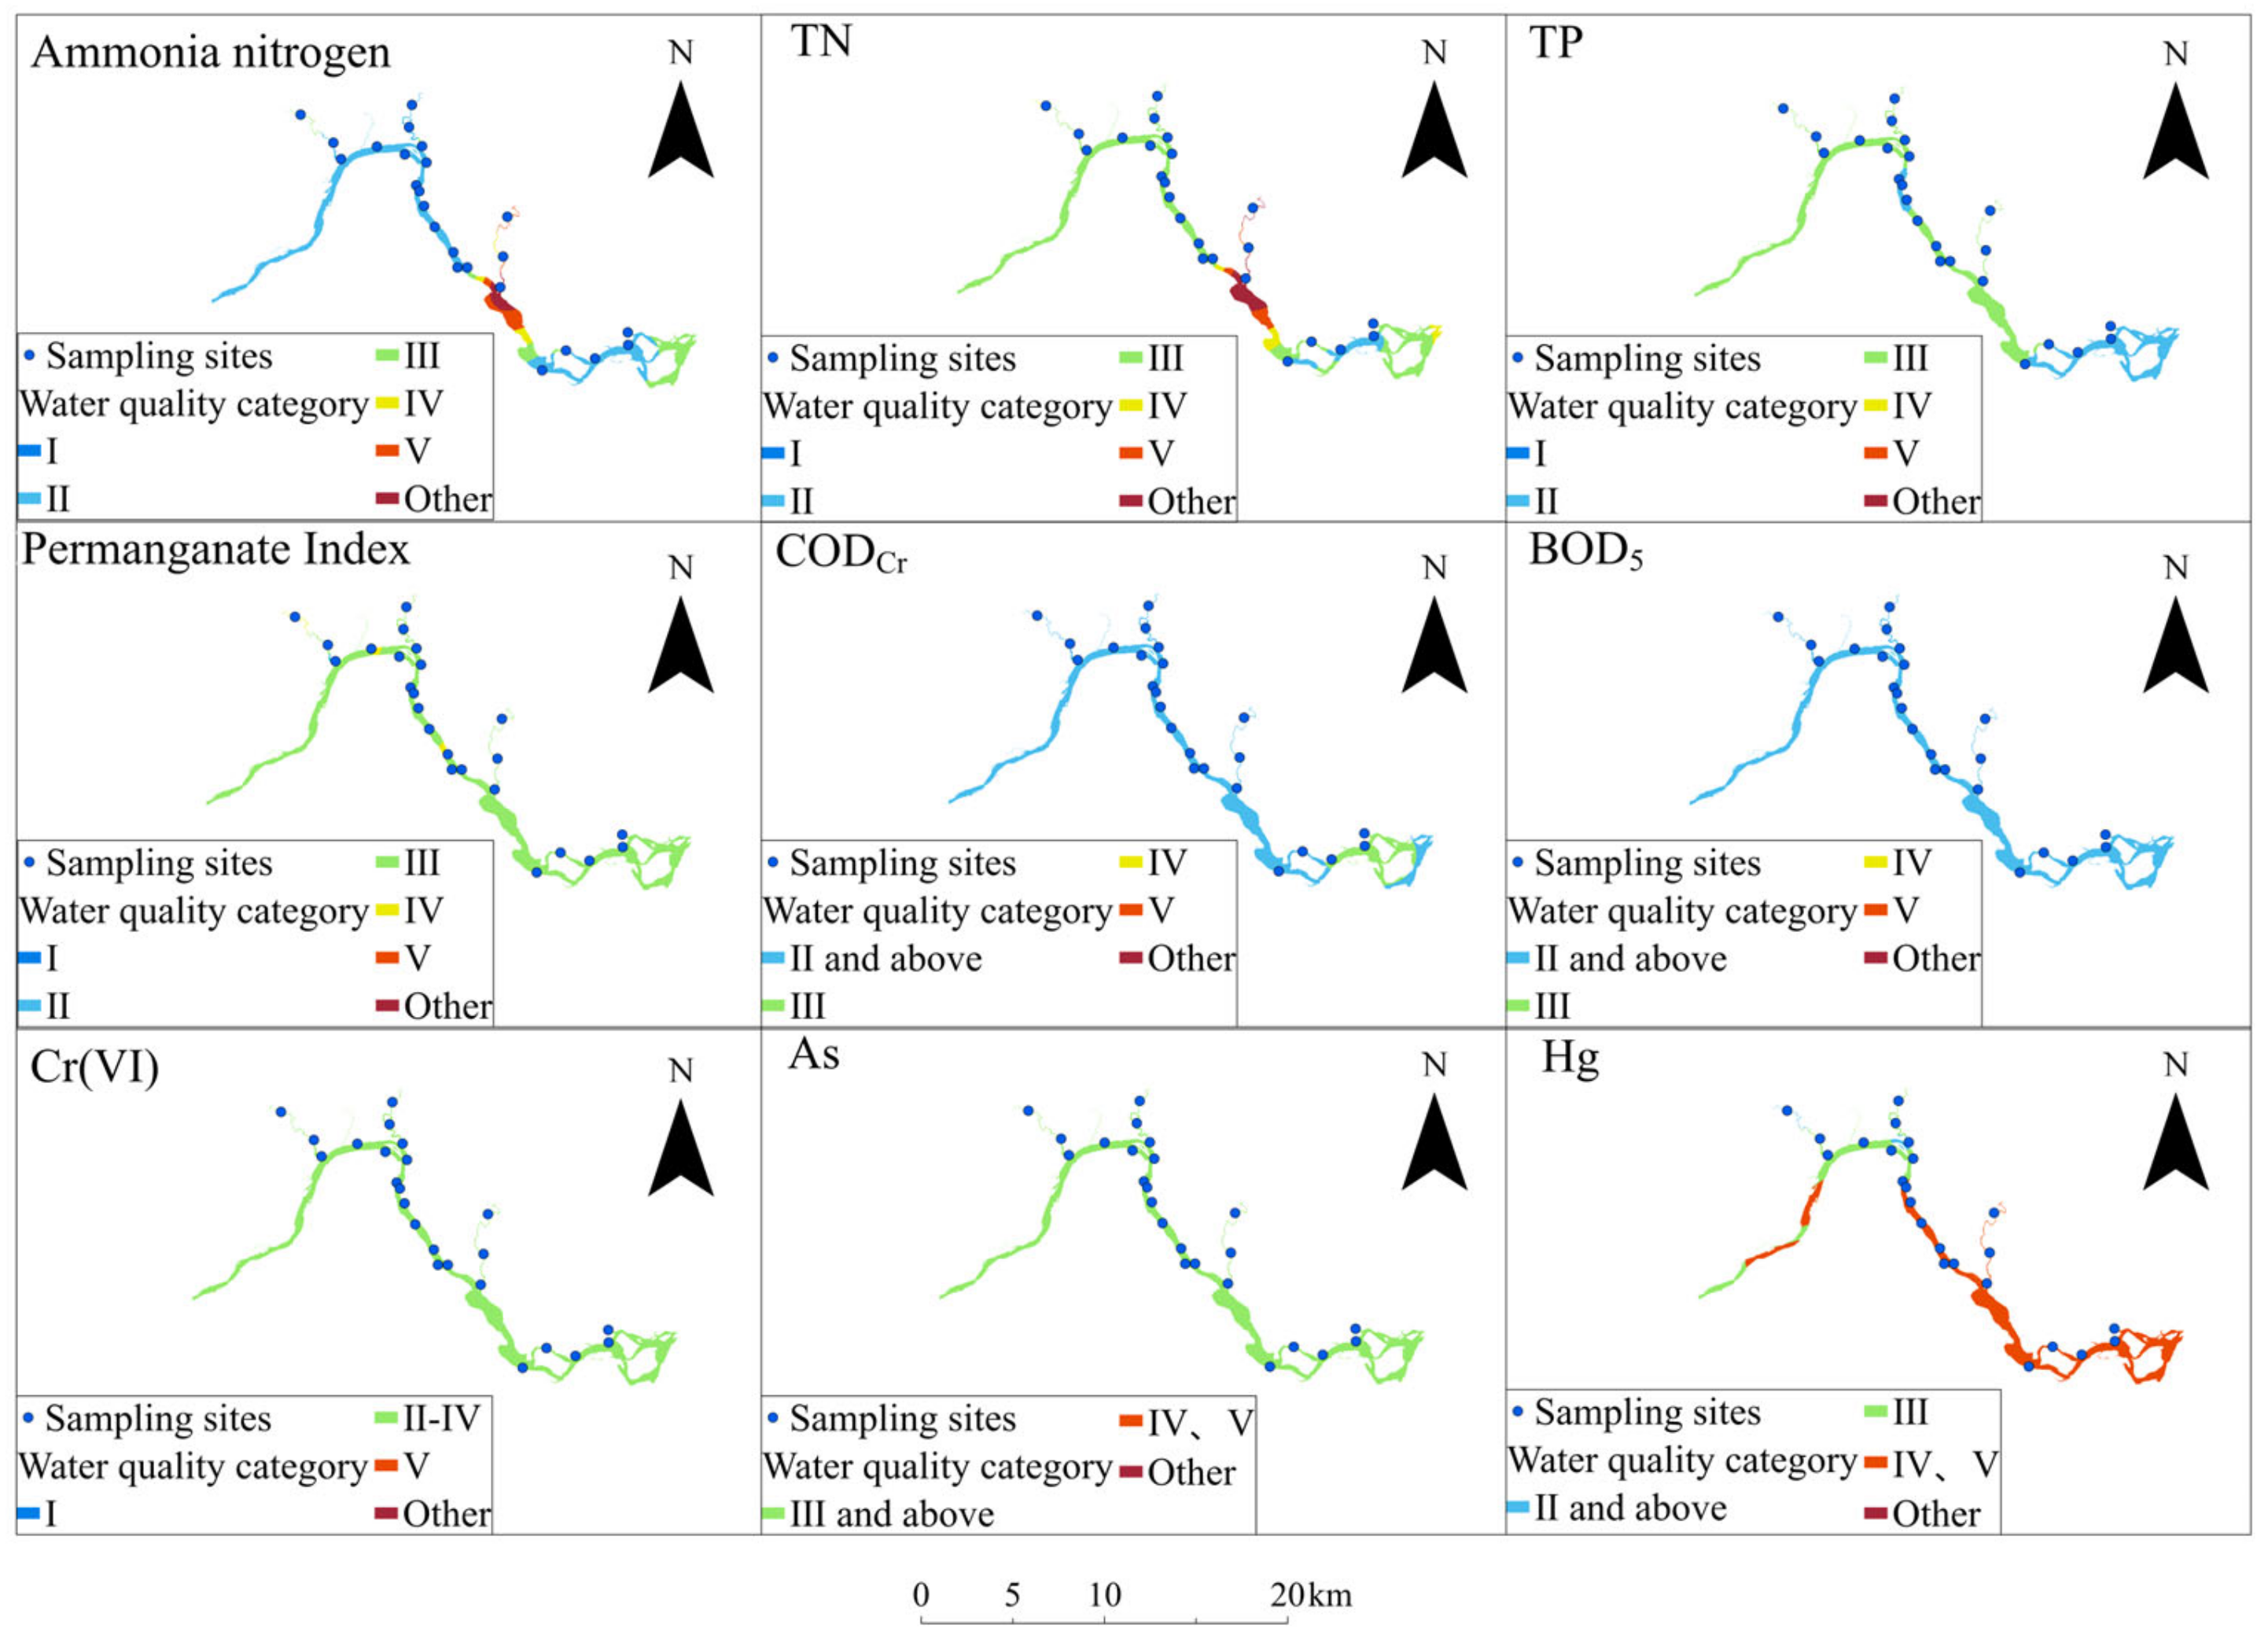
3.2. Spatial Distribution
3.3. Single Factor Pollution Index Evaluation
3.3.1. Single Factor Pollution Index Evaluation Results
3.3.2. Characteristics of the Spatial Distribution of Single-Factor Evaluation Results
- (1)
- Water quality class evaluation
- (2)
- Evaluation of pollution levels
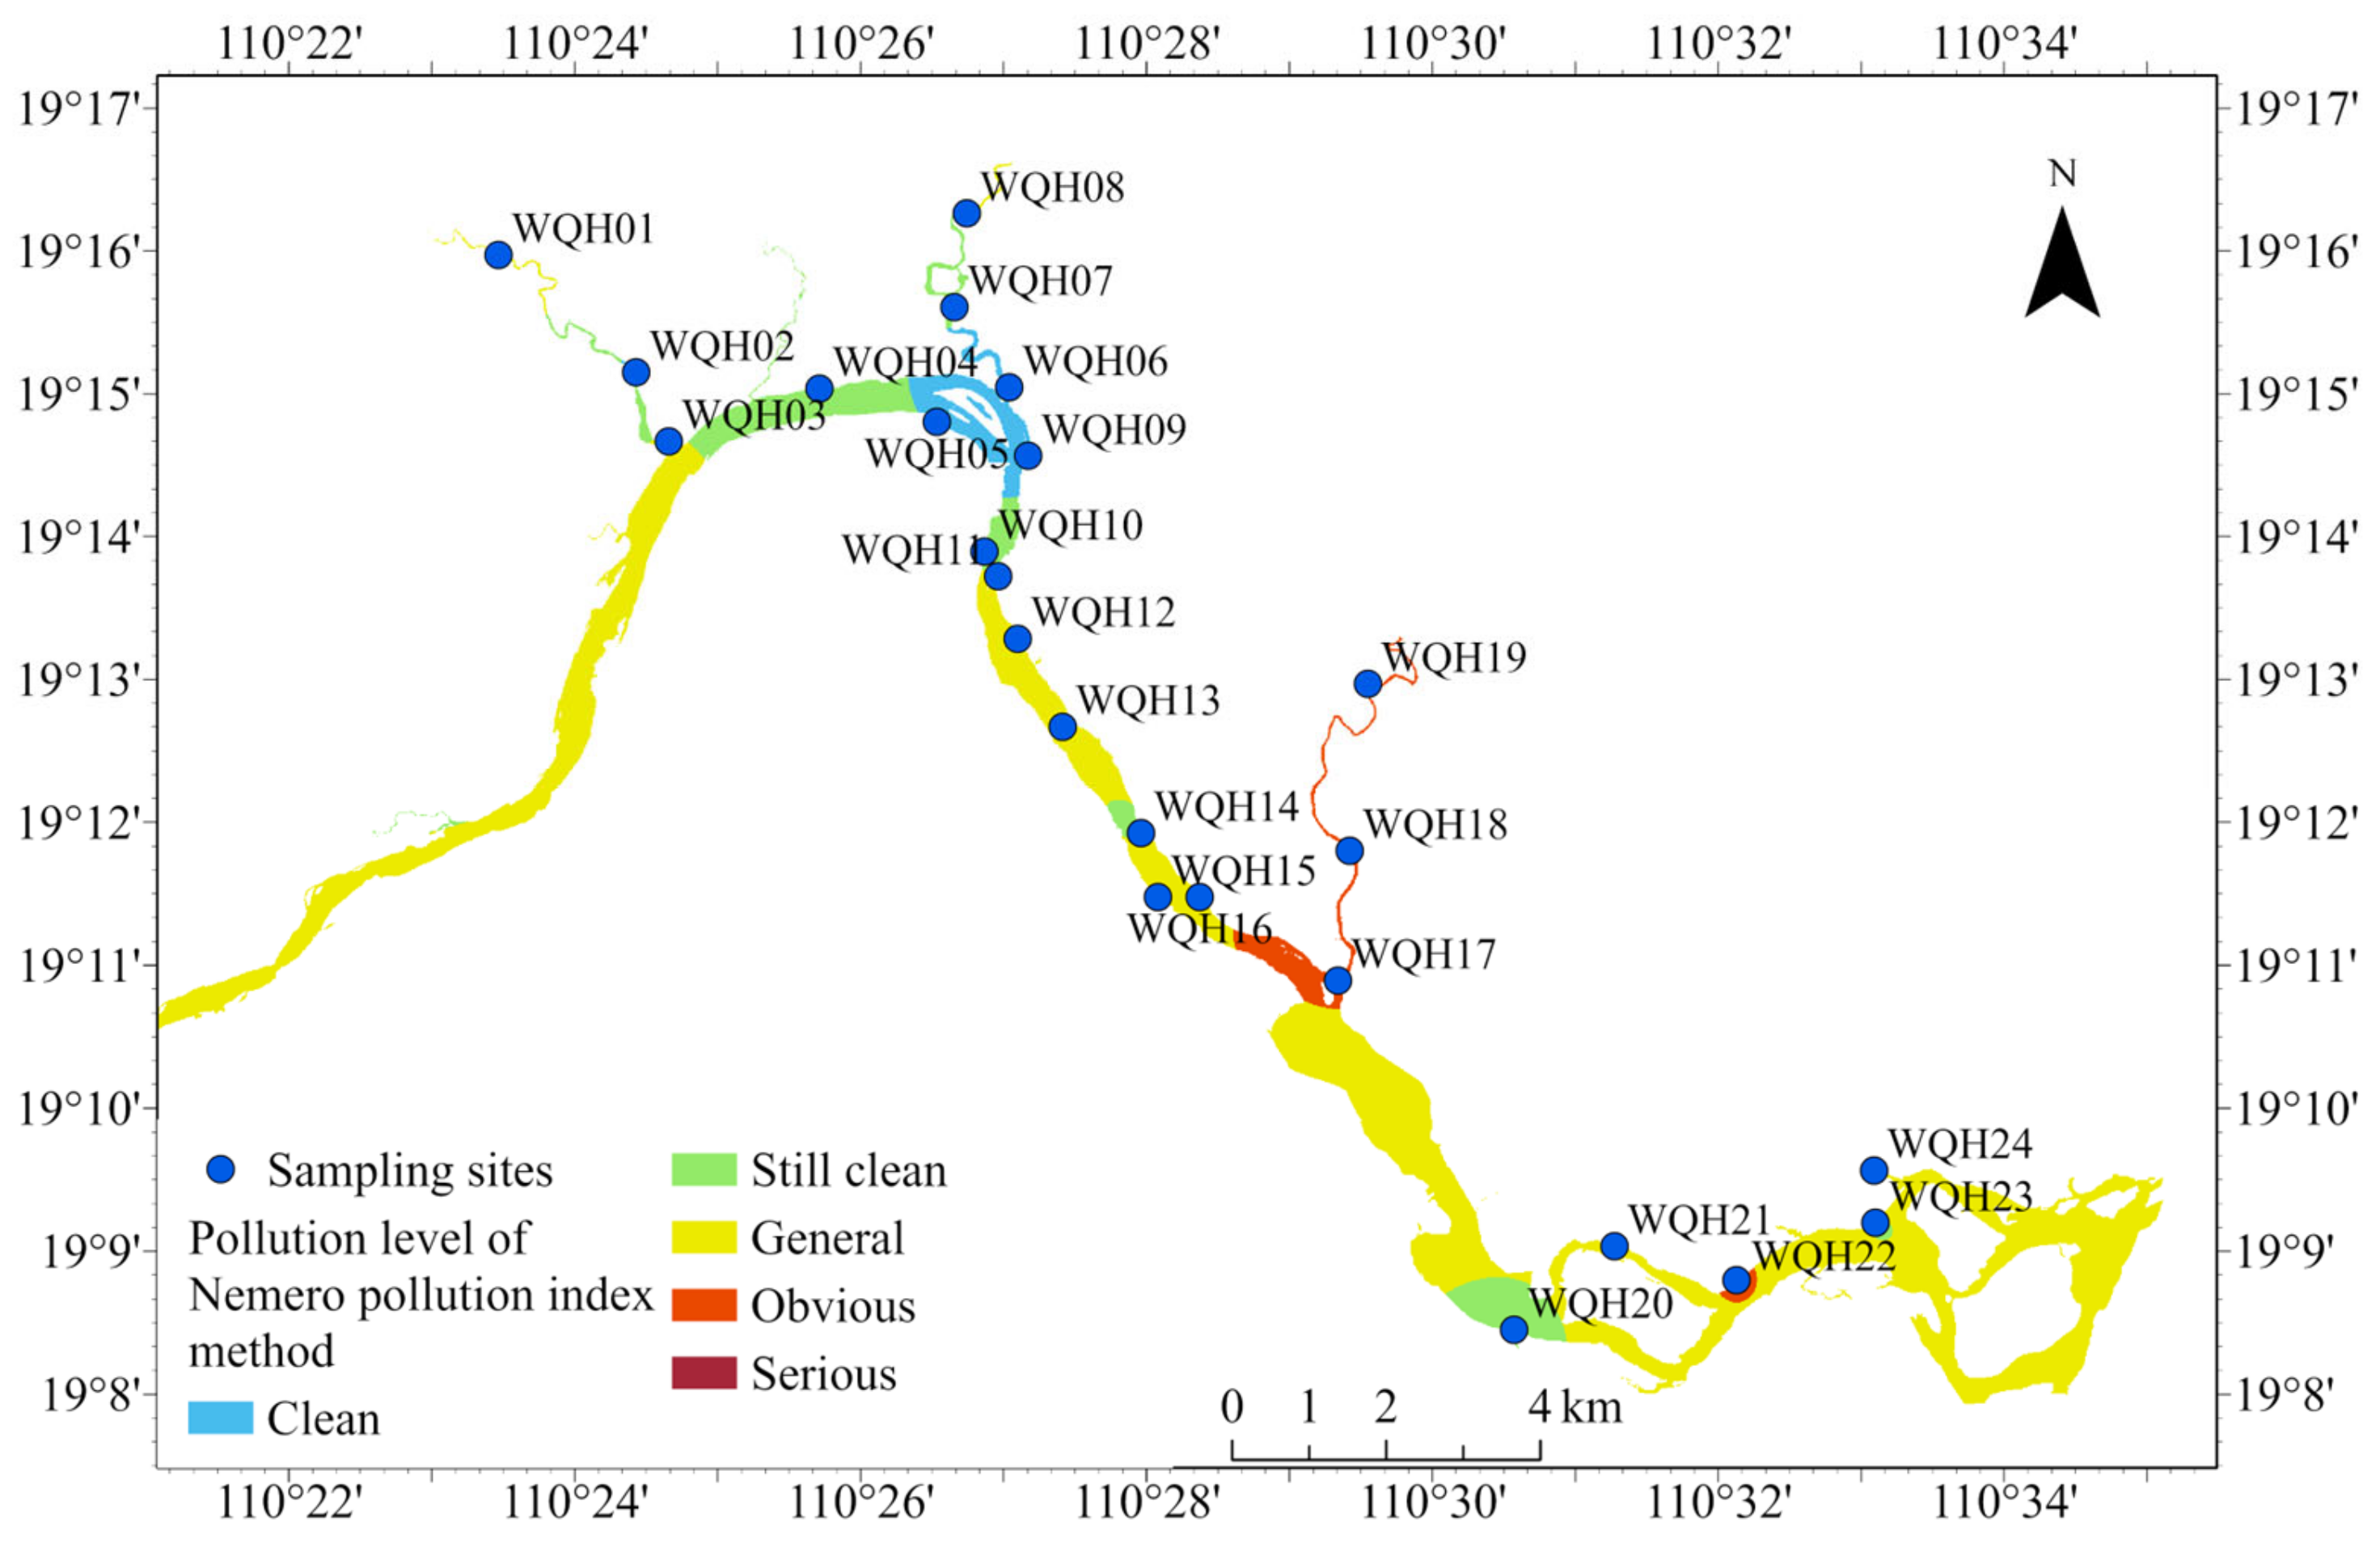
3.4. Evaluation of the Nemerow Composite Pollution Index
3.4.1. Results of the Evaluation of the Nemerow Composite Pollution Index
3.4.2. Spatial Distribution of the Results of the Evaluation of the Nemerow Composite Pollution Index
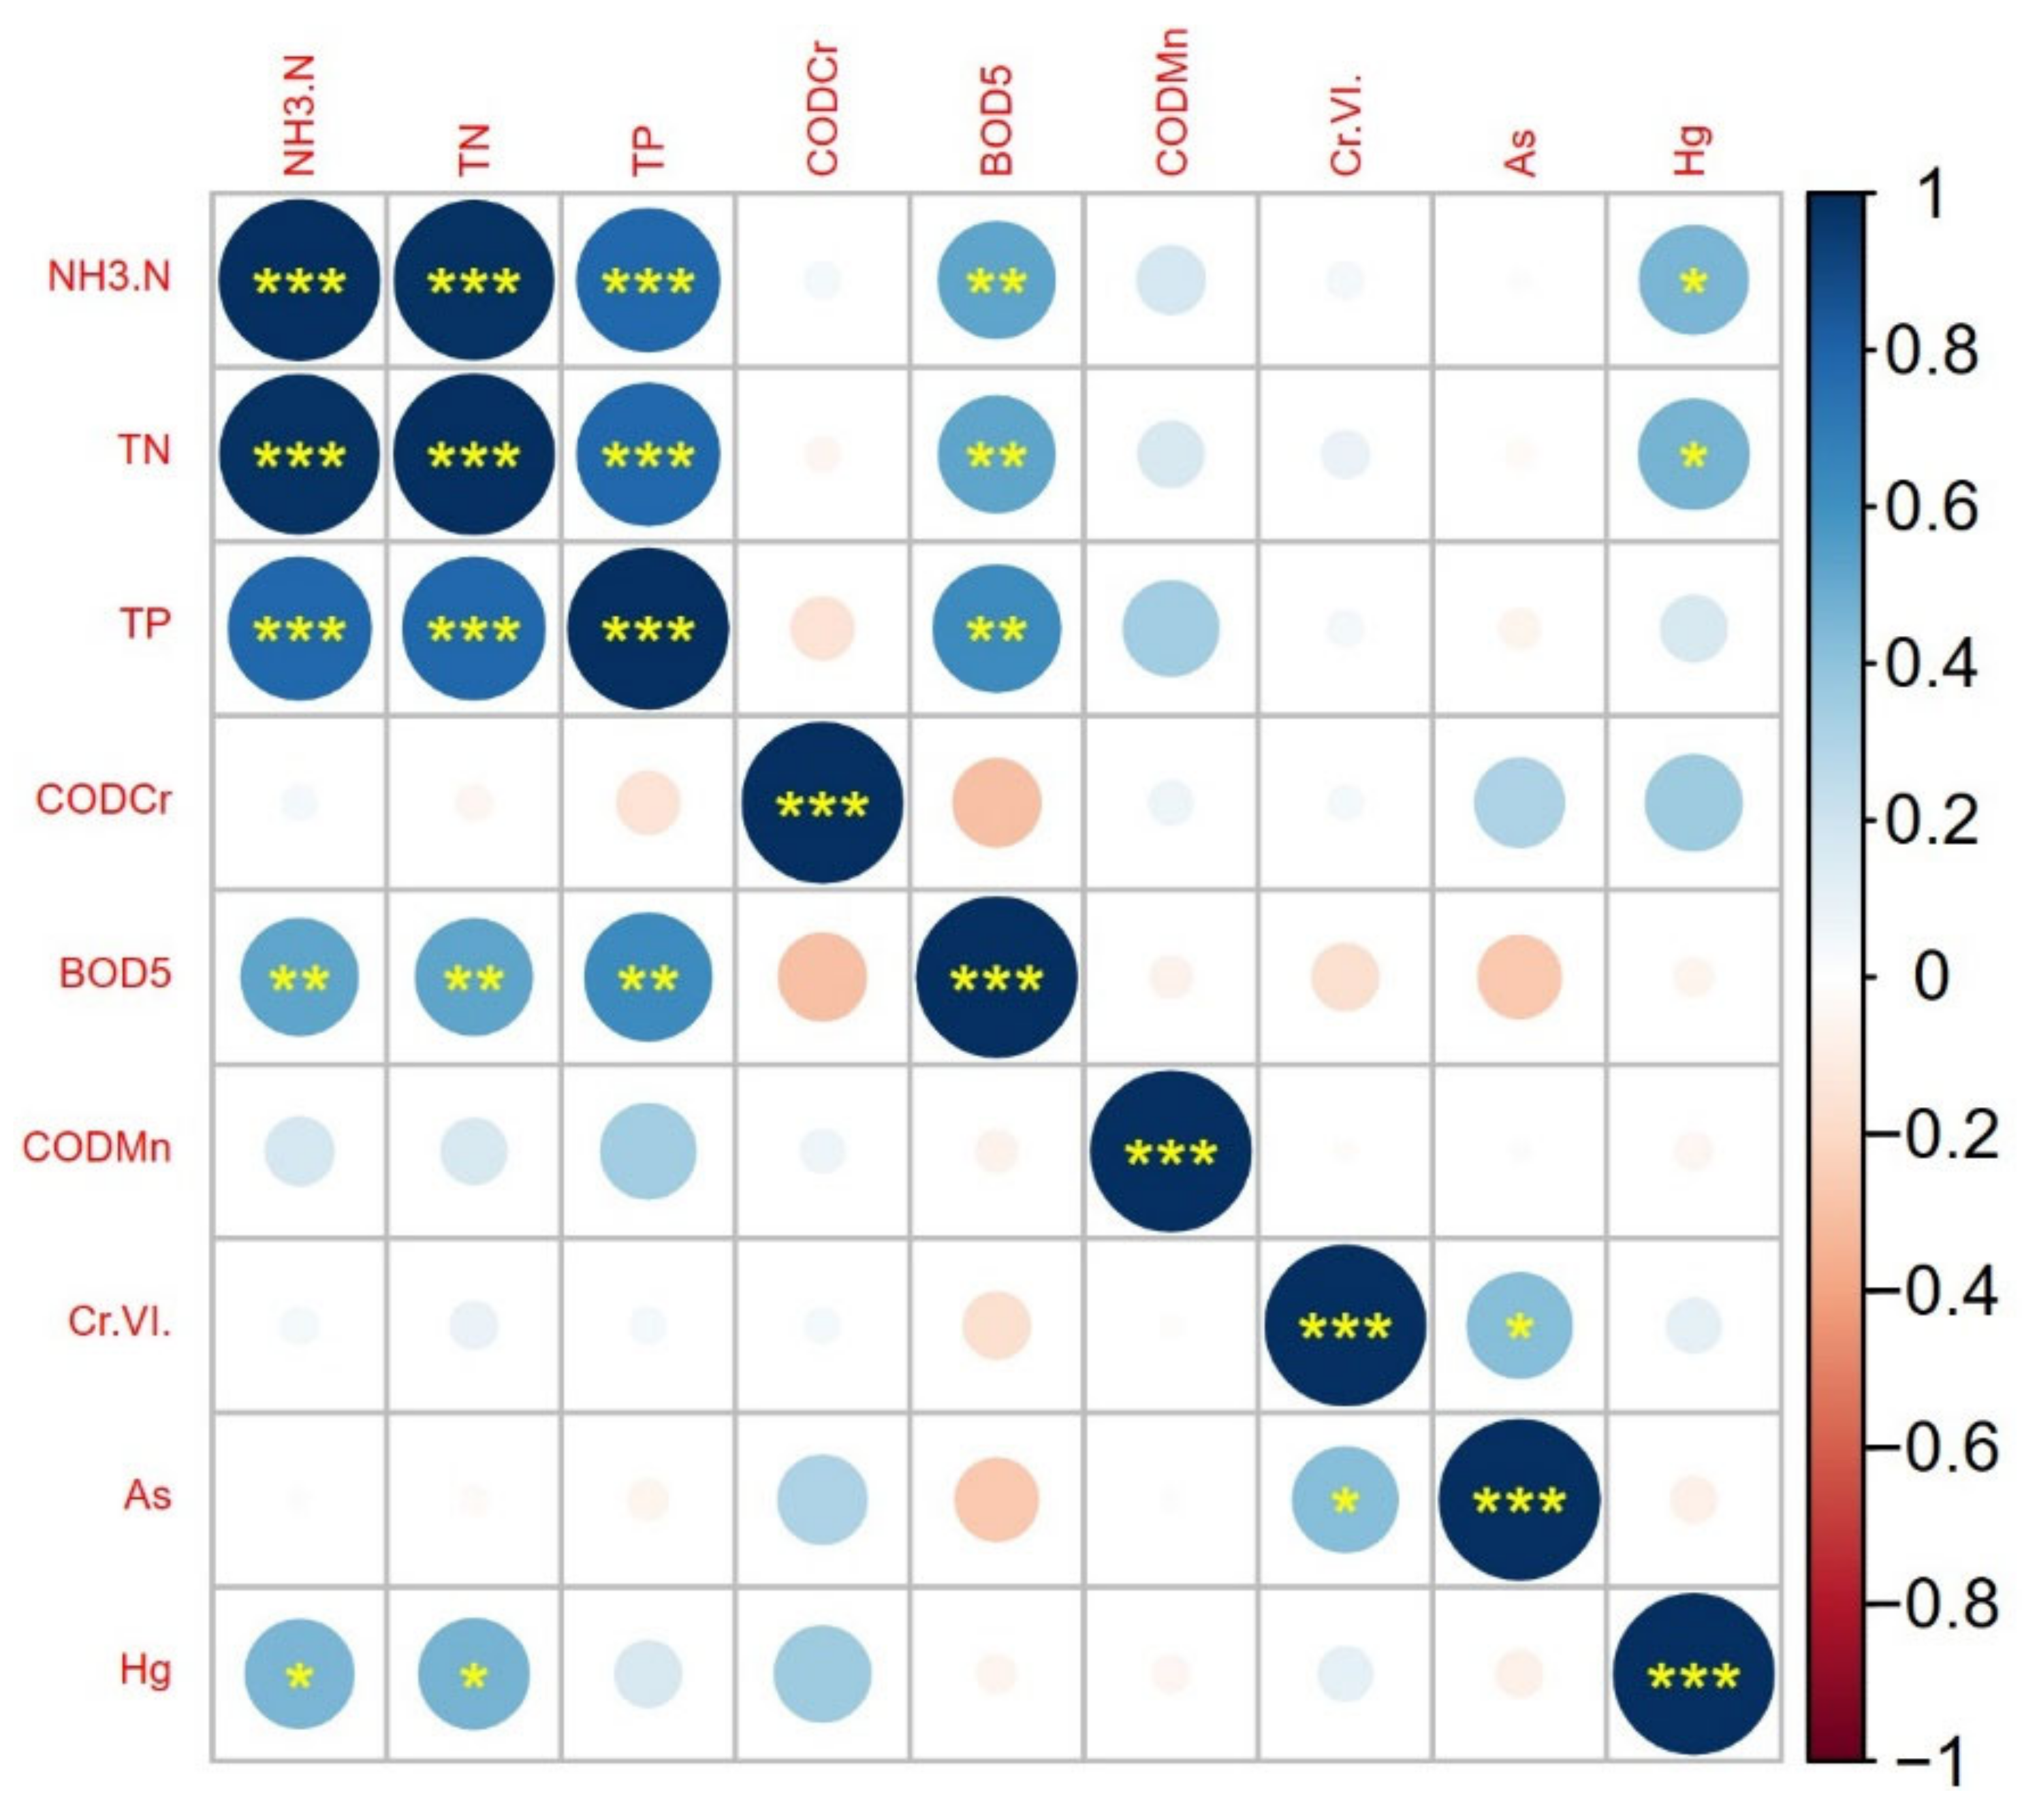
3.5. Analysis of Pollutant Sources
3.5.1. Correlation Analysis
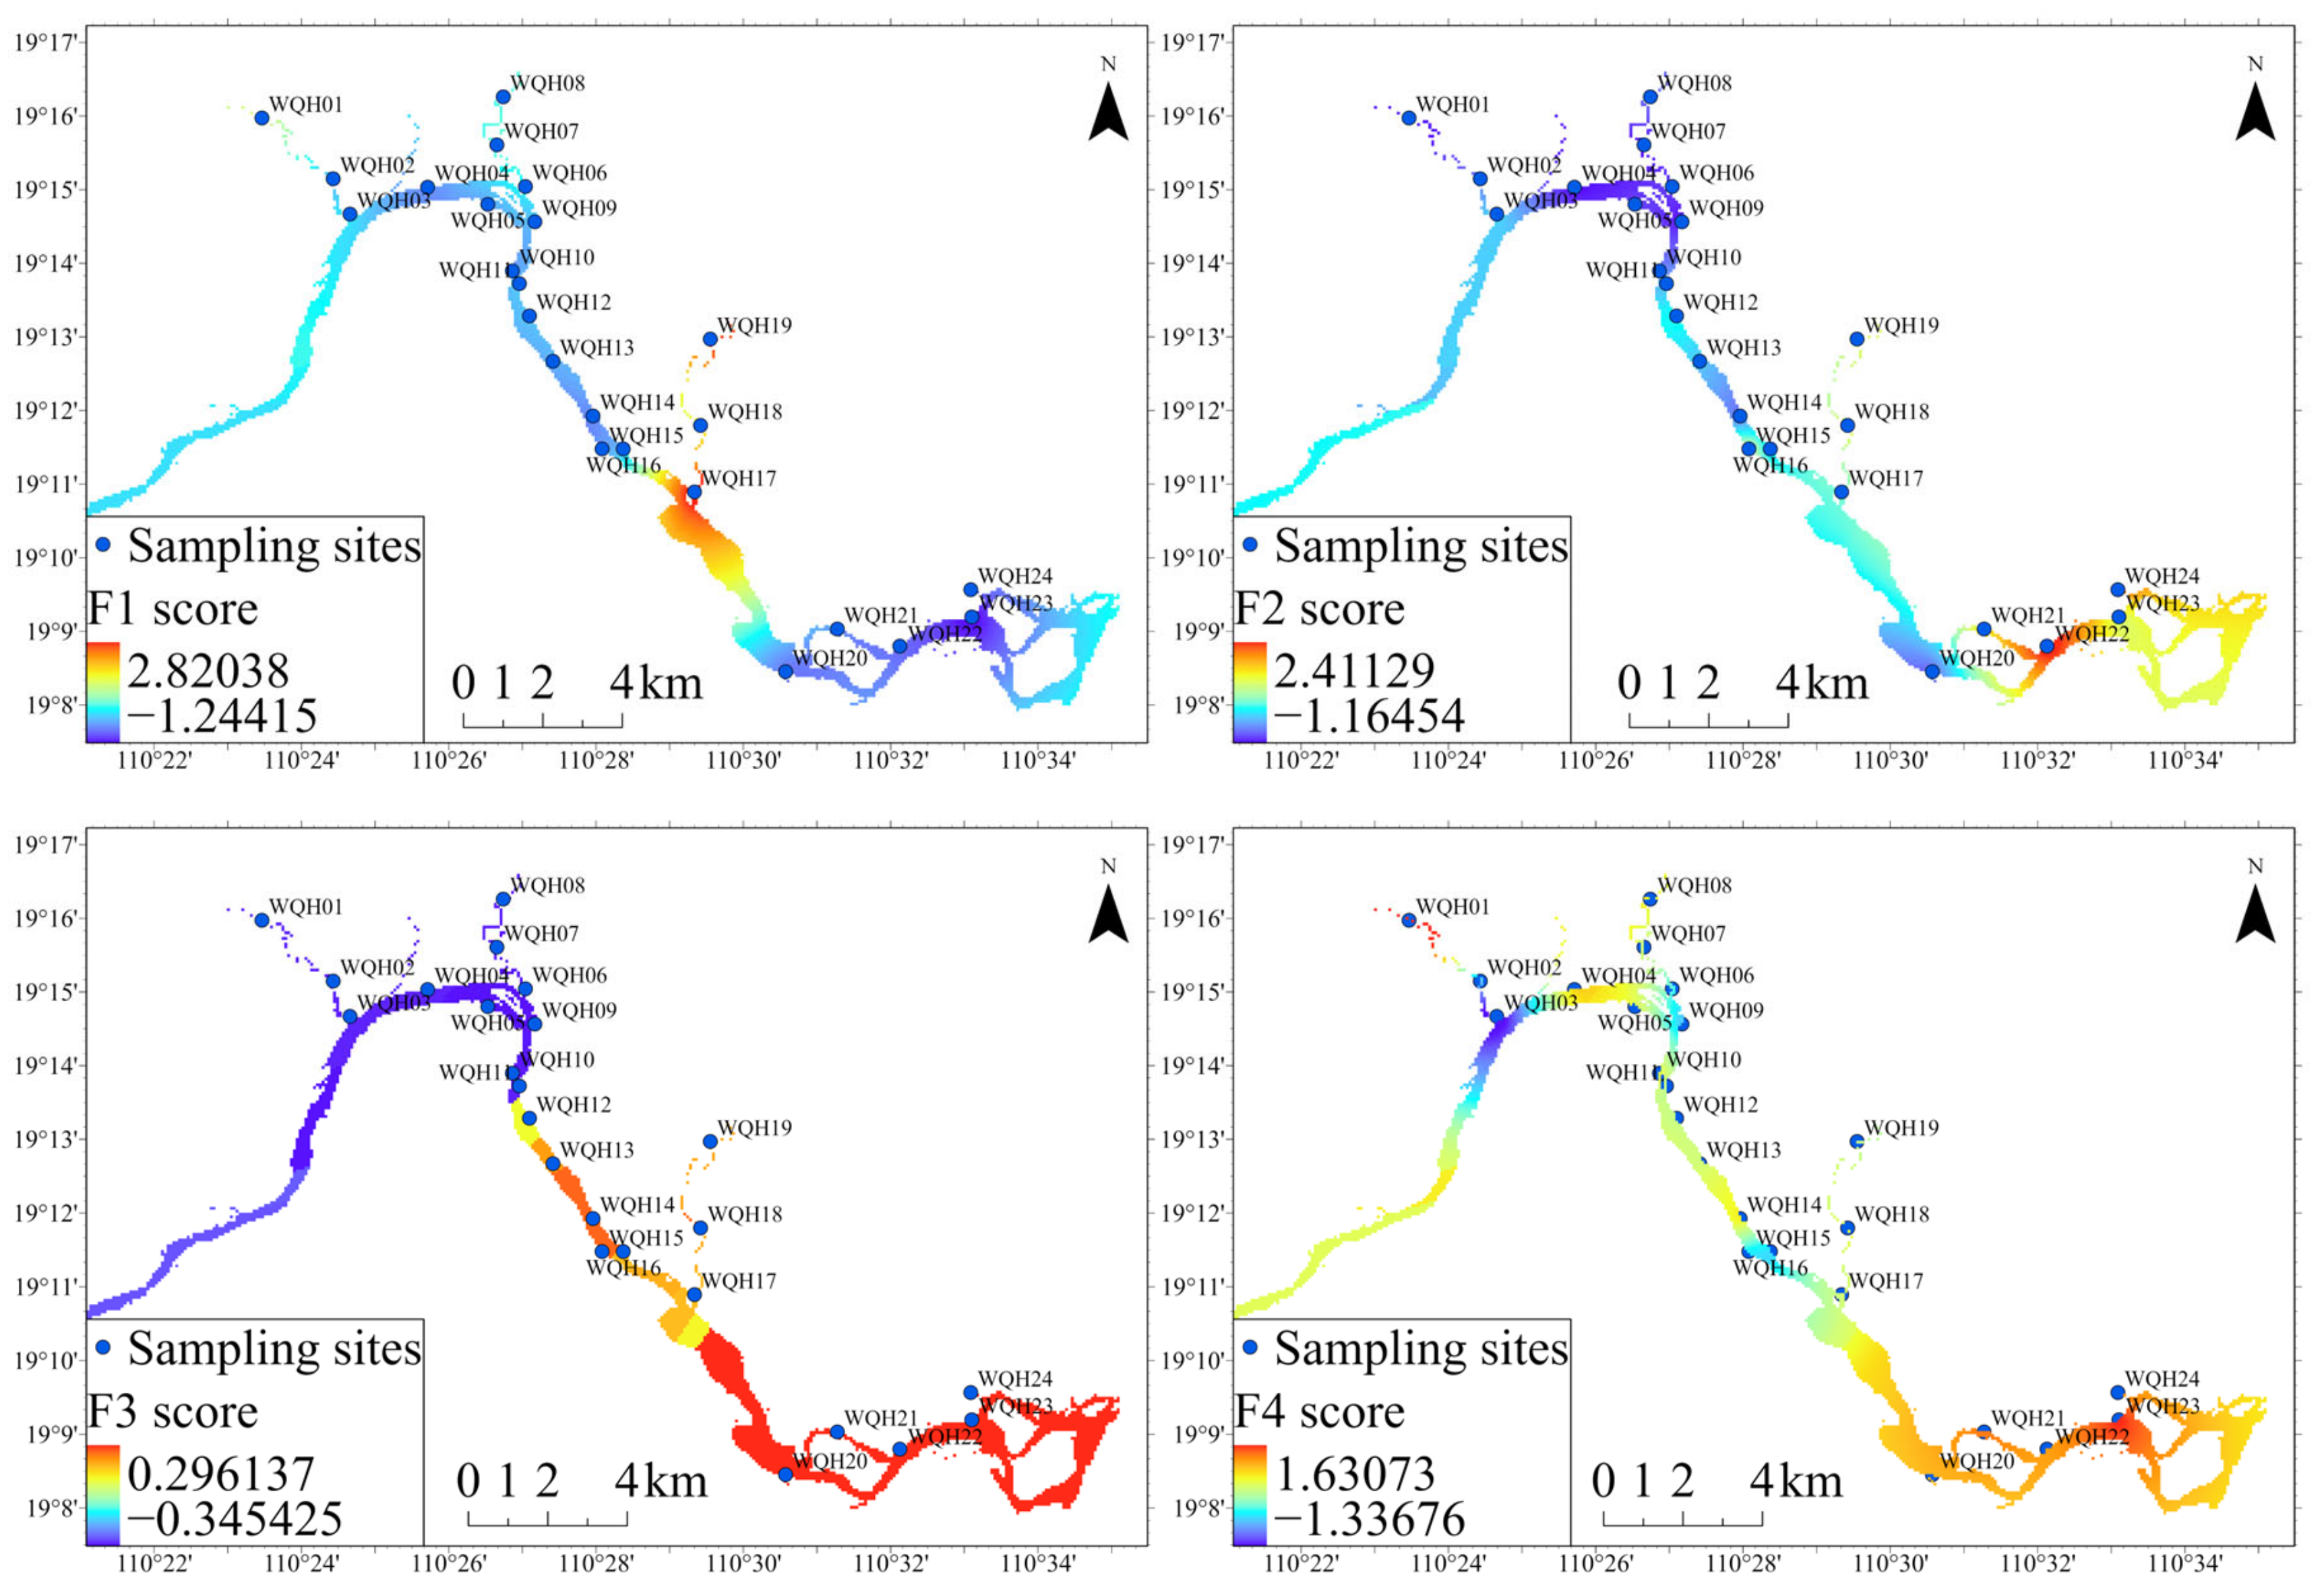
3.5.2. Principal Component Analysis
3.6. Recommendations for Water Pollution Prevention and Control
- 1.
- Strengthen sewage treatment: Ensure that industrial, agricultural, and urban wastewater are all treated properly and discharged to environmental standards by building and improving sewage treatment facilities and using appropriate technologies and methods to effectively remove harmful substances and pollutants;
- 2.
- Improve agricultural practices: Promote sustainable agricultural practices in the area around the Wanquan River and call on farmers to reduce the use of chemical fertilizers and pesticides. Promote and popularize more scientific irrigation methods to reduce soil erosion and nutrient loss and prevent agricultural surface pollution from entering the river;
- 3.
- Sound water quality monitoring and assessment system: Establish a comprehensive water quality monitoring network to regularly monitor and assess the water quality of the Wanquan River. Ensure that problems can be identified in a timely manner and that appropriate measures can be taken quickly to treat and improve the situation;
- 4.
- Transboundary cooperation and policy coordination: Water pollution is a transboundary issue that requires cooperation and coordination between all relevant sectors and stakeholders. Strengthen the integration of policies to promote the unified management of river basins and achieve integrated water resource management and protection.
4. Conclusions
- (1)
- The mean values of water quality indicators in the Wanquan River basin all meet the requirements for Class III water in China’s surface waters; Hg exceeds the standard most seriously, at 54%, while TN (17%), TP (17%), NH4+-N (13%), and CODMn (both 13%) also exceed the standard to a small extent;
- (2)
- Spatially, NH4+-N and TN correspond to Class V water and below near the Tayang River in the south-eastern part of Qionghai, while Hg corresponds to Class III water in the western part of Qionghai and Class IV water and below in most other areas. The other six pollution indicators correspond to Class III water and above in most areas;
- (3)
- The single factor pollution index method shows that Hg has the highest average single factor index (1.3) and is the most important source of pollution. In total, 87.5% of the sample sites meet the surface water quality standard of Class V and above. With Class III water as the target water quality, 92% of the sample sites were at the mild pollution level or above. Spatially, the lightest level of pollution was found in the western part of Qionghai City and the heaviest in the Tayang River area;
- (4)
- The results for the Nemerow pollution index method show that 83% of the sample points are at the light pollution level or above. Spatially, the water pollution is better in the southwest of Qionghai, and the pollution level is worst in the Tayang River basin;
- (5)
- The results of the pollution source analysis indicate that the possible sources of pollution in the Wanquan River include organic and chemical pollution, which may be related to the city’s sewage treatment system and industrial and agricultural activities.
Author Contributions
Funding
Institutional Review Board Statement
Informed Consent Statement
Data Availability Statement
Conflicts of Interest
References
- Qu, X.; Chen, Y.; Liu, H.; Xia, W.; Lu, Y.; Gang, D.-D.; Lin, L.-S. A holistic assessment of water quality condition and spatiotemporal patterns in impounded lakes along the eastern route of China’s South-to-North water diversion project. Water Res. 2020, 185, 116275. [Google Scholar] [CrossRef] [PubMed]
- Ameen, H.A. Spring water quality assessment using water quality index in villages of Barwari Bala, Duhok, Kurdistan Region, Iraq. Appl. Water Sci. 2019, 9, 176. [Google Scholar] [CrossRef] [Green Version]
- Zhang, J.; Li, X.; Guo, L.; Deng, Z.; Wang, D.; Liu, L. Assessment of heavy metal pollution and water quality characteristics of the reservoir control reaches in the middle Han River, China. Sci. Total Environ. 2021, 799, 149472. [Google Scholar] [CrossRef] [PubMed]
- Githaiga, K.B.; Njuguna, S.M.; Gituru, R.W.; Yan, X. Water quality assessment, multivariate analysis and human health risks of heavy metals in eight major lakes in Kenya. J. Environ. Manag. 2021, 297, 113410. [Google Scholar] [CrossRef]
- Agrawal, P.; Sinha, A.; Kumar, S.; Agarwal, A.; Banerjee, A.; Villuri, V.G.K.; Annavarapu, C.S.R.; Dwivedi, R.; Dera, V.V.R.; Sinha, J. Exploring artificial intelligence techniques for groundwater quality assessment. Water 2021, 13, 1172. [Google Scholar] [CrossRef]
- Ma, T.; Sun, S.; Fu, G.; Hall, J.W.; Ni, Y.; He, L.; Yi, J.; Zhao, N.; Du, Y.; Pei, T. Pollution exacerbates China’s water scarcity and its regional inequality. Nat. Commun. 2020, 11, 650. [Google Scholar] [CrossRef] [Green Version]
- Yin, Z.; Duan, R.; Li, P.; Li, W. Water quality characteristics and health risk assessment of main water supply reservoirs in Taizhou City, East China. Hum. Ecol. Risk Assess. Int. J. 2021, 27, 2142–2160. [Google Scholar] [CrossRef]
- Ustaoğlu, F.; Tepe, Y.; Taş, B. Assessment of stream quality and health risk in a subtropical Turkey river system: A combined approach using statistical analysis and water quality index. Ecol. Indic. 2020, 113, 105815. [Google Scholar] [CrossRef]
- Xiao, J.; Wang, L.; Deng, L.; Jin, Z. Characteristics, sources, water quality and health risk assessment of trace elements in river water and well water in the Chinese Loess Plateau. Sci. Total Environ. 2019, 650, 2004–2012. [Google Scholar] [CrossRef]
- Yang, K.; Li, L.; Wang, Y.; Xue, S.; Han, Y.; Liu, J. Airborne bacteria in a wastewater treatment plant: Emission characterization, source analysis and health risk assessment. Water Res. 2019, 149, 596–606. [Google Scholar] [CrossRef]
- Tian, Y.; Jiang, Y.; Liu, Q.; Dong, M.; Xu, D.; Liu, Y.; Xu, X. Using a water quality index to assess the water quality of the upper and middle streams of the Luanhe River, northern China. Sci. Total Environ. 2019, 667, 142–151. [Google Scholar] [CrossRef]
- Su, K.; Wang, Q.; Li, L.; Cao, R.; Xi, Y.; Li, G. Water quality assessment based on Nemerow pollution index method: A case study of Heilongtan reservoir in central Sichuan province, China. PLoS ONE 2022, 17, e0273305. [Google Scholar] [CrossRef]
- Yotova, G.; Varbanov, M.; Tcherkezova, E.; Tsakovski, S. Water quality assessment of a river catchment by the composite water quality index and self-organizing maps. Ecol. Indic. 2021, 120, 106872. [Google Scholar] [CrossRef]
- Unigwe, C.O.; Egbueri, J.C. Drinking water quality assessment based on statistical analysis and three water quality indices (MWQI, IWQI and EWQI): A case study. Environ. Dev. Sustain. 2023, 25, 686–707. [Google Scholar] [CrossRef]
- Nong, X.; Shao, D.; Zhong, H.; Liang, J. Evaluation of water quality in the South-to-North Water Diversion Project of China using the water quality index (WQI) method. Water Res. 2020, 178, 115781. [Google Scholar] [CrossRef]
- Bui, D.T.; Khosravi, K.; Tiefenbacher, J.; Nguyen, H.; Kazakis, N. Improving prediction of water quality indices using novel hybrid machine-learning algorithms. Sci. Total Environ. 2020, 721, 137612. [Google Scholar] [CrossRef]
- Jha, M.K.; Shekhar, A.; Jenifer, M.A. Assessing groundwater quality for drinking water supply using hybrid fuzzy-GIS-based water quality index. Water Res. 2020, 179, 115867. [Google Scholar] [CrossRef]
- Uddin, M.G.; Nash, S.; Olbert, A.I. A review of water quality index models and their use for assessing surface water quality. Ecol. Indic. 2021, 122, 107218. [Google Scholar] [CrossRef]
- Jehan, S.; Ullah, I.; Khan, S.; Muhammad, S.; Khattak, S.A.; Khan, T. Evaluation of the Swat River, Northern Pakistan, water quality using multivariate statistical techniques and water quality index (WQI) model. Environ. Sci. Pollut. Res. 2020, 27, 38545–38558. [Google Scholar] [CrossRef]
- Varol, M. Use of water quality index and multivariate statistical methods for the evaluation of water quality of a stream affected by multiple stressors: A case study. Environ. Pollut. 2020, 266, 115417. [Google Scholar] [CrossRef]
- Shil, S.; Singh, U.K.; Mehta, P. Water quality assessment of a tropical river using water quality index (WQI), multivariate statistical techniques and GIS. Appl. Water Sci. 2019, 9, 168. [Google Scholar] [CrossRef] [Green Version]
- Lu, W.; Wu, J.; Li, Z.; Cui, N.; Cheng, S. Water quality assessment of an urban river receiving tail water using the single-factor index and principal component analysis. Water Supply 2019, 19, 603–609. [Google Scholar] [CrossRef]
- Su, K.; Wang, Q.; Li, L.; Cao, R.; Xi, Y. Water quality assessment of Lugu Lake based on Nemerow pollution index method. Sci. Rep. 2022, 12, 13613. [Google Scholar] [CrossRef] [PubMed]
- Wang, T.-T.; Tang, W.-Q.; Wu, D.-H.; Yu, X.-R.; Wang, G.-Y.; Cai, X.-W.; Shao, S.; Wang, S.; Mo, L.; Liu, Y.-S. Abundance and characteristics of microplastics in the Wanquan River estuary, Hainan Island. Mar. Pollut. Bull. 2023, 189, 114810. [Google Scholar] [CrossRef]
- Zhao, J.; Yang, K.; Chu, F.; Ge, Q.; Xu, D.; Han, X.; Ye, L. Sources and spatial variations of heavy metals in offshore sediments of the western Pearl River Estuary. Mar. Pollut. Bull. 2023, 188, 114599. [Google Scholar] [CrossRef]
- Ram, A.; Tiwari, S.; Pandey, H.; Chaurasia, A.K.; Singh, S.; Singh, Y. Groundwater quality assessment using water quality index (WQI) under GIS framework. Appl. Water Sci. 2021, 11, 46. [Google Scholar] [CrossRef]
- Alarcón-Herrera, M.T.; Martin-Alarcon, D.A.; Gutiérrez, M.; Reynoso-Cuevas, L.; Martín-Domínguez, A.; Olmos-Márquez, M.A.; Bundschuh, J. Co-occurrence, possible origin, and health-risk assessment of arsenic and fluoride in drinking water sources in Mexico: Geographical data visualization. Sci. Total Environ. 2020, 698, 134168. [Google Scholar] [CrossRef]
- GB3838-2002; Environmental Quality Standards for Surface Water. China Environmental Science Press: Beijing, China, 2002.
- GB/T 11892-1989; Water Quality-Determination of Permanganate Index. China Environmental Science Press: Beijing, China, 1989.
- HJ 535-2009; Water Quality-Determination of Ammonia Nitrogen-Nessler’s Reagent Spectrophotometry. China Environmental Science Press: Beijing, China, 2009.
- Ma, J.; Chen, Q.; Wu, X.; Paerl, H.; Brookes, J.; Li, G.; Zeng, Y.; Wang, J.; Chen, J.; Qin, B. The effects of socioeconomic activities on water quality in Hainan Island, south China. Environ. Sci. Pollut. Res. 2023. [Google Scholar] [CrossRef]
- Yu, C.; Huang, X.; Chen, H.; Godfray, H.C.J.; Wright, J.S.; Hall, J.W.; Gong, P.; Ni, S.; Qiao, S.; Huang, G. Managing nitrogen to restore water quality in China. Nature 2019, 567, 516–520. [Google Scholar] [CrossRef]
- He, X.; Li, P. Surface water pollution in the middle Chinese Loess Plateau with special focus on hexavalent chromium (Cr6+): Occurrence, sources and health risks. Expo. Health 2020, 12, 385–401. [Google Scholar] [CrossRef]
- Müller, A.; Österlund, H.; Marsalek, J.; Viklander, M. The pollution conveyed by urban runoff: A review of sources. Sci. Total Environ. 2020, 709, 136125. [Google Scholar] [CrossRef]
- Jiang, J.; Fu, G.; Feng, Y.; Gu, X.; Jiang, P.; Shen, C.; Chen, Z. Characteristics and Causes of Coastal Water Chemistry in Qionghai City, China. Appl. Sci. 2023, 13, 5579. [Google Scholar] [CrossRef]


| Grade | Pi | Pollution Assessment |
|---|---|---|
| I | ≤1 | Non-polluting |
| II | (1, 2] | Light pollution |
| III | (2, 3] | Light pollution |
| IV | (3, 5] | Moderate pollution |
| V | >5 | Heavy pollution |
| Grade | Pi | Pollution Assessment |
|---|---|---|
| I | ≤0.7 | Cleaning |
| II | (0.7, 1.0] | Cleaner |
| III | (1.0, 2.0] | Light pollution |
| IV | (2.0, 3.0] | Moderate pollution |
| V | >3.0 | Heavy pollution |
| Indicator (mg/L) | Maximum Value | Minimum Value | Average | Standard Deviation | Coefficient of Variation | Class II Water Standard | Class III Water Standard | Exceedance Rate |
|---|---|---|---|---|---|---|---|---|
| NH4+-N | 2.60 | 0.12 | 0.56 | 0.59 | 107% | 0.50 | 1.00 | 13% |
| TN | 2.82 | 0.33 | 0.85 | 0.61 | 72% | 0.50 | 1.00 | 17% |
| TP | 0.34 | 0.06 | 0.13 | 0.08 | 62% | 0.10 | 0.20 | 17% |
| CODMn | 7.30 | 3.70 | 5.49 | 0.72 | 13% | 4.00 | 6.00 | 13% |
| COD | 16.00 | 2.50 | 7.81 | 3.54 | 45% | 15.00 | 20.00 | 0% |
| BOD5 | 3.60 | 0.25 | 1.66 | 0.94 | 56% | 3.00 | 4.00 | 0% |
| Cr6+ | 0.14 | 2.00 × 10⁻³ | 0.02 | 0.02 | 113% | 0.05 | 0.05 | 4% |
| As | 4.00 × 10⁻³ | 1.50 × 10⁻⁴ | 1.03 × 10⁻³ | 1.04 × 10⁻³ | 101% | 0.05 | 0.05 | 0% |
| Hg | 3.40 × 10⁻⁴ | 2.00 × 10⁻⁵ | 1.30 × 10⁻⁴ | 1.05 × 10⁻⁴ | 81% | 5.00 × 10⁻⁵ | 1.00 × 10⁻⁴ | 54% |
| Sampling Sites | NH4+-N | TN | TP | COD | BOD5 | CODMn | Cr6+ | As | Hg | One-Factor Evaluation Rating |
|---|---|---|---|---|---|---|---|---|---|---|
| WQH01 | 0.78 | 1.05 | 1.70 | 0.35 | 0.63 | 1.22 | 0.54 | 0.02 | 0.20 | Light pollution |
| WQH02 | 0.33 | 0.67 | 0.65 | 0.35 | 0.35 | 0.72 | 0.04 | 0.01 | 0.20 | Non-polluting |
| WQH03 | 0.35 | 0.64 | 0.50 | 0.35 | 0.60 | 0.62 | 0.04 | 0.01 | 1.50 | Light pollution |
| WQH04 | 0.32 | 0.64 | 0.40 | 0.13 | 0.20 | 1.02 | 0.36 | 0.00 | 0.20 | Light pollution |
| WQH05 | 0.28 | 0.60 | 0.40 | 0.25 | 0.43 | 0.93 | 0.24 | 0.05 | 0.50 | Non-polluting |
| WQH06 | 0.52 | 0.66 | 0.65 | 0.40 | 0.70 | 0.83 | 0.36 | 0.01 | 0.20 | Non-polluting |
| WQH07 | 0.49 | 0.66 | 0.75 | 0.40 | 0.90 | 0.90 | 0.36 | 0.00 | 0.40 | Non-polluting |
| WQH08 | 0.42 | 0.65 | 0.80 | 0.25 | 0.60 | 0.97 | 0.32 | 0.01 | 1.40 | Light pollution |
| WQH09 | 0.29 | 0.59 | 0.45 | 0.30 | 0.55 | 0.72 | 0.32 | 0.03 | 0.20 | Non-polluting |
| WQH10 | 0.25 | 0.60 | 0.50 | 0.25 | 0.28 | 1.00 | 0.22 | 0.00 | 0.70 | Light pollution |
| WQH11 | 0.35 | 0.65 | 0.45 | 0.25 | 0.45 | 0.88 | 0.28 | 0.04 | 1.60 | Light pollution |
| WQH12 | 0.32 | 0.68 | 0.45 | 0.25 | 0.33 | 0.93 | 0.28 | 0.00 | 2.10 | Light pollution |
| WQH13 | 0.26 | 0.64 | 0.40 | 0.25 | 0.35 | 0.92 | 0.42 | 0.00 | 1.50 | Light pollution |
| WQH14 | 0.24 | 0.67 | 0.40 | 0.30 | 0.30 | 1.03 | 0.32 | 0.02 | 0.20 | Light pollution |
| WQH15 | 0.22 | 0.61 | 0.40 | 0.40 | 0.23 | 0.80 | 0.42 | 0.01 | 2.60 | Light pollution |
| WQH16 | 0.23 | 0.66 | 0.45 | 0.40 | 0.18 | 0.82 | 2.72 | 0.06 | 1.60 | Light pollution |
| WQH17 | 2.60 | 2.82 | 1.40 | 0.40 | 0.80 | 0.95 | 0.68 | 0.02 | 2.00 | Light pollution |
| WQH18 | 1.56 | 1.82 | 1.30 | 0.40 | 0.28 | 0.92 | 0.48 | 0.05 | 2.80 | Light pollution |
| WQH19 | 1.92 | 2.55 | 1.35 | 0.40 | 0.90 | 0.97 | 0.36 | 0.01 | 3.40 | Moderate pollution |
| WQH20 | 0.12 | 0.45 | 0.40 | 0.30 | 0.30 | 0.95 | 0.32 | 0.00 | 0.20 | Non-polluting |
| WQH21 | 0.56 | 0.70 | 0.40 | 0.65 | 0.23 | 1.00 | 0.44 | 0.04 | 1.80 | Light pollution |
| WQH22 | 0.28 | 0.47 | 0.30 | 0.80 | 0.23 | 0.97 | 0.22 | 0.01 | 3.20 | Moderate pollution |
| WQH23 | 0.13 | 0.33 | 0.30 | 0.80 | 0.15 | 0.98 | 0.36 | 0.08 | 0.20 | Non-polluting |
| WQH24 | 0.55 | 0.68 | 0.30 | 0.75 | 0.06 | 0.92 | 0.40 | 0.00 | 2.40 | Light pollution |
| Sampling Sites | Nemerow Pollution Index | Pollution Level |
|---|---|---|
| WQH01 | 1.27 | Light pollution |
| WQH02 | 0.56 | Cleaning |
| WQH03 | 1.10 | Light pollution |
| WQH04 | 0.75 | Cleaner |
| WQH05 | 0.69 | Cleaning |
| WQH06 | 0.64 | Cleaning |
| WQH07 | 0.70 | Cleaning |
| WQH08 | 1.04 | Light pollution |
| WQH09 | 0.55 | Cleaning |
| WQH10 | 0.74 | Cleaner |
| WQH11 | 1.17 | Light pollution |
| WQH12 | 1.52 | Light pollution |
| WQH13 | 1.10 | Light pollution |
| WQH14 | 0.76 | Cleaner |
| WQH15 | 1.87 | Light pollution |
| WQH16 | 1.97 | Light pollution |
| WQH17 | 2.11 | Moderate pollution |
| WQH18 | 2.06 | Moderate pollution |
| WQH19 | 2.50 | Moderate pollution |
| WQH20 | 0.70 | Cleaning |
| WQH21 | 1.32 | Light pollution |
| WQH22 | 2.29 | Moderate pollution |
| WQH23 | 0.73 | Cleaner |
| WQH24 | 1.74 | Light pollution |
| Indicators | F1 | F2 | F3 | F4 |
|---|---|---|---|---|
| NH4+-N | 0.941 | 0.222 | 0.030 | 0.060 |
| TN | 0.951 | 0.181 | 0.041 | 0.025 |
| TP | 0.890 | −0.123 | 0.019 | 0.273 |
| CODMn | 0.146 | 0.021 | −0.013 | 0.954 |
| COD | −0.158 | 0.798 | 0.151 | 0.169 |
| BOD5 | 0.713 | −0.390 | −0.244 | −0.158 |
| Cr6+ | 0.081 | 0.007 | 0.844 | −0.117 |
| As | −0.101 | 0.111 | 0.834 | 0.115 |
| Hg | 0.370 | 0.795 | −0.052 | −0.218 |
| Common Factor | Eigenvalue | Percentage of Variance | Cumulative Contribution of Variance | Main Control Indicators |
|---|---|---|---|---|
| F1 | 3.33 | 37.04 | 37.04 | NH4+-N, TN, TP, BOD5 |
| F2 | 1.80 | 20.05 | 57.09 | COD |
| F3 | 1.22 | 13.57 | 70.66 | Cr6+, As |
| F4 | 1.07 | 11.92 | 82.58 | CODMn |
| Sampling Sites | F1 | F2 | F3 | F4 |
|---|---|---|---|---|
| WQH01 | 1.01 | −1.17 | 0.10 | 2.66 |
| WQH02 | −0.35 | −0.57 | −0.60 | −1.03 |
| WQH03 | −0.07 | −0.14 | −0.80 | −2.26 |
| WQH04 | −0.57 | −1.05 | −0.44 | 0.77 |
| WQH05 | −0.44 | −0.83 | 0.52 | 0.21 |
| WQH06 | 0.09 | −0.84 | −0.27 | −0.55 |
| WQH07 | 0.35 | −0.98 | −0.62 | −0.23 |
| WQH08 | 0.19 | −0.63 | −0.39 | 0.22 |
| WQH09 | −0.29 | −0.98 | 0.22 | −1.32 |
| WQH10 | −0.51 | −0.53 | −0.68 | 0.67 |
| WQH11 | −0.21 | −0.30 | 0.21 | −0.42 |
| WQH12 | −0.28 | 0.14 | −0.75 | −0.20 |
| WQH13 | −0.37 | −0.22 | −0.53 | −0.23 |
| WQH14 | −0.59 | −0.68 | −0.04 | 0.99 |
| WQH15 | −0.48 | 0.88 | −0.34 | −1.06 |
| WQH16 | −0.28 | −0.15 | 3.78 | −1.17 |
| WQH17 | 2.84 | 0.31 | 0.38 | −0.03 |
| WQH18 | 1.35 | 0.99 | 0.86 | 0.16 |
| WQH19 | 2.55 | 0.85 | −0.57 | −0.20 |
| WQH20 | −0.73 | −0.70 | −0.53 | 0.38 |
| WQH21 | −0.51 | 1.24 | 0.43 | 0.81 |
| WQH22 | −0.76 | 2.43 | −0.87 | 0.35 |
| WQH23 | −1.26 | 0.82 | 1.53 | 1.33 |
| WQH24 | −0.72 | 2.10 | −0.59 | 0.16 |
Disclaimer/Publisher’s Note: The statements, opinions and data contained in all publications are solely those of the individual author(s) and contributor(s) and not of MDPI and/or the editor(s). MDPI and/or the editor(s) disclaim responsibility for any injury to people or property resulting from any ideas, methods, instructions or products referred to in the content. |
© 2023 by the authors. Licensee MDPI, Basel, Switzerland. This article is an open access article distributed under the terms and conditions of the Creative Commons Attribution (CC BY) license (https://creativecommons.org/licenses/by/4.0/).
Share and Cite
An, M.; Song, Y.; Jiang, J.; Fu, G.; Wang, Y.; Wan, X. Water Quality Evaluation, Spatial Distribution Characteristics, and Source Analysis of Pollutants in Wanquan River, China. Appl. Sci. 2023, 13, 7982. https://doi.org/10.3390/app13137982
An M, Song Y, Jiang J, Fu G, Wang Y, Wan X. Water Quality Evaluation, Spatial Distribution Characteristics, and Source Analysis of Pollutants in Wanquan River, China. Applied Sciences. 2023; 13(13):7982. https://doi.org/10.3390/app13137982
Chicago/Turabian StyleAn, Mengyang, Yanwei Song, Junyi Jiang, Guowei Fu, Yang Wang, and Xiaoming Wan. 2023. "Water Quality Evaluation, Spatial Distribution Characteristics, and Source Analysis of Pollutants in Wanquan River, China" Applied Sciences 13, no. 13: 7982. https://doi.org/10.3390/app13137982
APA StyleAn, M., Song, Y., Jiang, J., Fu, G., Wang, Y., & Wan, X. (2023). Water Quality Evaluation, Spatial Distribution Characteristics, and Source Analysis of Pollutants in Wanquan River, China. Applied Sciences, 13(13), 7982. https://doi.org/10.3390/app13137982