Abstract
With the development of navigation globalization and ship dehumanization, the contradiction between the increasing demand for ship behavior supervision and limited traffic service resources is obvious, and the frequent occurrence of accidents at sea is a problem. The monitoring of abnormal ship behavior is an important link in maritime transportation. With the popularization of the automatic identification system and increasing research in the maritime field, the AIS is widely used in the management of ship static information and the real-time sharing of dynamic information. The generated moving ship trajectory data provide a new opportunity for research into abnormal ship behavior and its detection. In light of the current situation of abnormal ship behavior research, we detected abnormal ship behavior from the point of view of spatial information and thematic information based on moving ship trajectory data. Therefore, this study first modeled the cognition of abnormal ship behavior. Then, based on the cognition of group ship behavior rules, we used a method based on graph structure learning to mine maritime routes from the perspective of ship spatial information. Next, we used Rayda’s criterion to detect the anomalous behavior of ships in space. Then, based on the isolation forest algorithm, we detected and described the abnormal behavior shown by ship thematic information. The experimental results show that the framework proposed in this paper can effectively detect the abnormal behavior of ships.
1. Introduction
Maritime transportation is favored and being rapidly developed due to its advantages of large freight volumes, low cost, low energy consumption, and low required investment. With the continuous innovation of shipbuilding technology, there are more than 4 million ships sailing within the coastal waters of China every year [1]. Maritime transport undertakes 90% of the work of world trade and transportation [2]. Therefore, it can be said that the development of seaborne trade is a barometer of the development trend of the global economy [3]. At the same time, China’s national policy vigorously supports the development of the maritime transport industry. In 2013, President Xi Jinping proposed the cooperation initiatives to build the “New Silk Road Economic Belt” and the “21st Century Maritime Silk Road” [4]. In 2016, China also issued the “Outline of the Development Plan for the Yangtze River Economic Belt” to promote the orderly and free flow of economic factors and build a new bidirectional corridor based on land and sea with the outside world. Therefore, the supervision of maritime traffic is crucial.
However, with the continuous development of the maritime shipping industry and continuous application of the integrated system of various marine services, the number of marine traffic accidents is also increasing. According to the “Transportation Safety Production Accident Report (2019)”, a total of 197 marine traffic accidents occurred during this period, resulting in the deaths of 115 people and the loss of up to 12 Gt of goods. Marine traffic accidents usually result from abnormal ship-related behaviors. In order to better supervise maritime safety, one needs to detect abnormal ship behaviors.
In order to ensure safety in navigation, the AIS base station came into being. International Convention for Safety of Life at Sea (SOLAS) regulation V/19 stipulates that all ships of 300 gross tonnage and above engaged in international voyages, cargo ships of 500 gross tonnage and above not engaged in international voyages, and all passenger ships (regardless of size) should be fitted with automatic identification systems (AISs). The requirement came into effect for all ships on 31 December 2004 [5]. An AIS is a self-reporting information system mainly designed for collision avoidance that uses VHF radio information to track and monitor ship movements by exchanging position, heading, and speed information with other AIS-equipped ships and AIS base stations in the vicinity [6]. There are 27 categories of AIS message types, which can be divided into three types: static information, dynamic information, and voyage-related information [7]. However, this study focuses on the use of the dynamic information and static information of ships to further explore the law of ship behavior. The static attributes include the vessel’s IMO number, vessel name, Maritime Mobile Service Identity (MMSI), callsign number, and size and type of the vessel. The dynamic attributes include the ship position, time stamp, speed over ground (SOG), course over ground (COG), and other information [8]. Meanwhile, vessels have different punctuation intervals due to differences in static information, dynamic information, and voyage-related information during the course of their journeys.
The AIS system provides data support for the analysis and modeling of maritime traffic and enhances the feasibility of research into abnormal behavior detection for ships. Ship behavior is not the specific behavior of a ship but refers to the mode and law of similar actions of ship groups, which not only depend on human consciousness, thinking, decision making, and manipulation but are also affected by the characteristics of the ship and the surrounding environment [9]. Existing research has not effectively combined the characteristics of ship behavior to discriminate abnormal patterns. Since the occurrence of marine accidents can usually be attributed to the abnormal behavior of ships, the characteristics of marine accidents in this study were abstracted from three dimensions—spatial attributes, temporal attributes, and thematic attributes—to obtain the data expression of the abnormal behavior of ships. For example, on 14 May 2021, the accident investigation report of the Maritime Safety Administration of the People’s Republic of China showed that a ship drifted 2 km away from its original route due to a wind disaster and then finally capsized and sank. Based on the AIS data, it can be observed that the spatial position of the ship deviated from the trajectory point group after the wind accident. The schematic diagram is shown in Figure 1. Therefore, it is feasible and necessary to detect abnormal behavior of ships based on AIS data. On the one hand, it can reduce the workload of maritime surveillance operators and improve the efficiency of maritime surveillance [10]. On the other hand, it has guiding significance for the relevant departments to formulate management measures such as the planning of navigation routes and maritime traffic control. Additionally, it has great socioeconomic and environmental benefits.
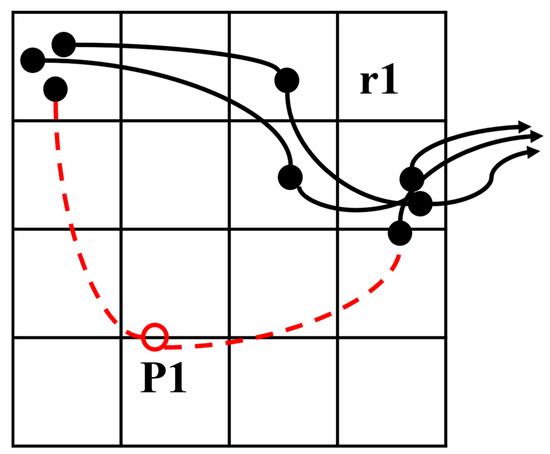
Figure 1.
Schematic representation of the spatial offset of trajectory points. Given the motion trajectories of three moving objects and the fact that p1 is in a low-density region during motion, it can be suspected that there is a spatial offset of p1.
The purpose of this study was to model and mine the typical motion patterns by analyzing the behavior of ships at sea and to detect and evaluate the abnormal behavior of ships based on the AIS data in the framework of the discovery patterns from the perspectives of spatial attributes and thematic attributes to comprehensively express the maritime traffic situation. First, we extracted the information of the maritime routes based on the AIS data extension main graph structure learning strategy to generate a data-driven representation of the real navigation routes. Then, we detected and evaluated abnormal ship behavior based on Rayda’s criterion and the isolated forest algorithm for the spatial attributes and thematic attributes, respectively.
The remainder of this paper is organized as follows. Section 2 is a review of the relevant research. Section 3 introduces the study area and the data and describes the detection method for abnormal behavior based on AIS data. Section 4 provides the experimental results and analysis. Section 5 summarizes the content of this article and puts forward future outlooks.
2. Related Work
Most of the existing studies have reviewed the abnormal behavior of ships based on research methods from their respective fields. Classification according to the research methods can help to elucidate the relevance and continuity of the method in the field, but because the research methods are prone to repeated use, and the existing methods tend to be complex and comprehensive, it is impossible to review the progress of the research with a single method. Therefore, we chose a classification method based on the results of the study to classify the abnormal behavior of ships. According to the literature, the research on abnormal behavior detection for ships can be divided into the following four categories according to the results: only spatial position abnormalities, spatial position and thematic attribute abnormalities, specific situation abnormalities, and no specific experimental results, with only a description of the detection framework instead.
Soleimani et al. [11] compared the input trajectory with the approximate optimal path generated by the A* algorithm to obtain the ship’s abnormal score for the spatial position. This method belongs to unsupervised learning, which can effectively deal with large datasets. Rong et al. [12], based on the Douglas–Peucker algorithm and density-based clustering algorithm, abstracted the ship route into leg sections and turning sections and then probabilistically characterized marine traffic based on the lateral distance of the trajectory points and other attributes. Pallotta et al. [2] used unsupervised incremental learning to cluster and visualize routes and then used the knowledge of the routes to trajectory points for route classification and anomaly detection. Xiong et al. [13] used the multi-kernel non-parametric estimation method to estimate the probability density of the motion patterns of ferry vessels and set the criterion of abnormality to detect a ferry with abnormal behavior. Laxhammar [14] trained the Gaussian mixture model by taking the ship point space information and the attribute information as eigenvalues and marked the outliers by calculating the probability of the new trajectory points generated by the trained model. Ristic et al. [8] used the kernel density estimation method to extract the ship motion pattern from the real AIS data and identify the abnormal points. Bomberger et al. [15] used the incremental learning method based on a fuzzy neural network to forecast and evaluate the position of a ship. Smith et al. [16] combined the Gaussian method and extreme value theory to identify abnormal behavior in the trajectory flow, such as deviation, mooring, and wandering. Venskus et al. [17] performed unsupervised learning on the trajectory flow data obtained by the sensor based on the SOM network to detect abnormal ship movements in maritime traffic.
Lei [6] proposed a comprehensive anomaly detection framework, MT-MAD, to mine the spatial characteristics, sequence characteristics, and behavior characteristics of the ship’s trajectory. Finally, the three features were combined with the cooperative value to determine an abnormal situation for the ship. Shahir et al. [18] proposed an interactive detection system based on the DBSCAN algorithm and Markov algorithm for the multi-ship encounter problem. Based on the two-dimensional Gaussian distribution, Holst et al. [10] carried out probability modeling for the normal ship-running trajectory and detected the ship characteristics by establishing a model. Pallotta et al. [19] extracted abnormal ship traffic by correlating the ship trajectory with the existing route and then scored the degree of abnormality of the point with respect to the course, bow direction, and lateral distance of the trajectory point. Osekowska et al. [20] represented the ship’s behavior using the charge value and built a model to detect abnormal behavior of a ship by defining the relationship between the ship’s movement mode and the change, accumulation, and distribution of the charge value. The method proposed by Venskus et al. [21] is similar to the charge theory proposed by Osekowska et al. [20], which uses the principle of a bionic animal pheromone to detect the standard path of the ship and then uses it to detect the nonstandard movement of marine traffic.
Since it is difficult to consider all the aspects in anomaly detection, it is necessary to consider an anomaly in the context of the situation after it is detected [22]. For example, the deviation of the ship may be a simple response to a particular scenario such as an iceberg or hurricane [22]. Additionally, in some cases, seemingly normal and benign behavior, after combination with the information of the scene, may turn out to be deceptive or concealed abnormal behavior. Kraiman et al. [23] built a model based on a Gaussian mixture model and self-organizing neural network and used the ship attribute information and related environmental information as input data for abnormal behavior detection. Riveiro et al. [24] used an interactive data mining module including SOM, GMM, and Bayesian theory to build the model and judge the abnormal behavior of a ship. This method can obtain situational knowledge and artificial feedback online as well as use visual means to continuously improve the model update. Mascaro et al. [25] learned the data by generating static and dynamic Bayesian networks and added meteorological factors and ship interaction information to enhance the learning ability of the model. Finally, the average scores of 12 abnormalities and the difference between the score and normal behavior were obtained. Radon et al. [26] combined “context information”, including marine environmental factors such as the wind direction and speed, to discriminate abnormal results based on the density clustering algorithm and finally interpreted an abnormal situation through the prior knowledge of experts. The study of Jakob et al. [27] focused on the detection of pirate threat behavior, combining environmental factors and ship attribute characteristics to create a ship movement model based on game theory, the Nash equilibrium principle, and reinforcement learning for the ship route and attack simulation evaluation.
Riveiro et al. [22] expounded on and discussed methods of marine anomaly detection based on four aspects—marine traffic data, methods, systems, and users—and put forward strong insights for future development. Laxhammar et al. [28] evaluated two commonly used methods of maritime anomaly detection: the Gaussian mixture model and adaptive kernel density estimator. They stated that both methods have certain limitations. Therefore, a clustering method combining scenario information and ship motion attribute features was proposed at the end of the article, but this was not verified by experiments. Arguedas et al. [29] created a multi-layer interactive platform called Blue Hub and proposed several spatiotemporal mining techniques to enhance situational awareness. The authors opined that there is still much work to be conducted in the consolidation of past studies. Jasinevicius et al. [30] used a rule-based fuzzy expert knowledge graph to monitor the port safety system. The system combined the characteristics of ship attributes, personnel, and cargo risk factors to detect and identify the behavior of a ship, but this was not verified by experiments.
From the review of the research on abnormal behavior detection for ships, we can observe the following problems: (1) most of the existing studies have defined the “abnormal behavior of ships” in their respective fields without elaborating on the reasons for these definitions; (2) while previous studies have usually been based on using historical data to extract relevant knowledge about the behavior of ships, existing studies have focused more narrowly on the behavior of ships on specific routes; and (3) the existing research on detection is not comprehensive, with the research methods only considering the single attribute characteristics of the ship and not a fusion of characteristics. Some studies still only identify normal or abnormal conditions in a binary fashion, not considering the degree of abnormality for the impacting factors.
In this study, the existing research was combined with the actual geographical environmental factors for a single ship’s motion behavior to create a relatively comprehensive framework for detecting abnormal behavior. Based on the graph structure learning method and the tree linking strategy, we detected the structure of maritime routes to represent the ship’s travel route. The extracted network structure characteristics maintained the real geographic mapping between nodes and could reduce the storage requirements for the maritime routes. Then, using each segment as a unit, the probability characteristics of the trajectory points were detected from the perspectives of spatial attributes and thematic attributes, and the score value for the degree of abnormality of the trajectory points was obtained to evaluate the ship’s motion mode.
3. Materials and Methods
The research method presented in this study consisted of three parts: the general situation of the research area and preprocessing of the research data, the detection of abnormal behavior of a ship based on spatial attributes, and the detection of abnormal behavior of a ship based on thematic attributes. For the second part, there were two phases: (1) the extraction of maritime routes based on AIS data and (2) the detection of abnormal behavior for ships using spatial attributes based on Rayda’s criterion. For the third part, there were two phases: (1) nearest route matching and (2) the detection and scoring of the abnormal behavior characteristics of the ship’s thematic attributes based on the isolation forest algorithm. The framework of this study is shown in Figure 2.
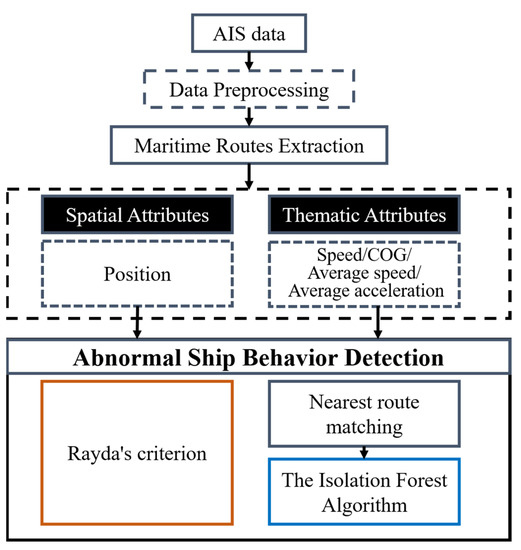
Figure 2.
Framework for abnormal detection.
3.1. Overview of Study Area and AIS Data Preprocessing
3.1.1. Overview of the Study Area
There is a large number of sea-going ship trajectories. In order to mine the characteristics of the ship’s behavior pattern, we partitioned the ship based on its location.
China is located in the east of the Asian continent, facing the Pacific Ocean. The Bohai Sea, Yellow Sea, East China Sea, and South China Sea are the four sea areas under the jurisdiction of the People’s Republic of China. Marine Regions integrates and serves geographic information from the VLIMAR Gazetteer and the MARBOUND database and proposes a standard of marine georeferenced locations, boundaries, and regions. Based on this website, we downloaded the boundary data of the global sea area and intercepted the boundary data of the four major sea areas of China as the data of our research area.
3.1.2. AIS Data Preprocessing
In 2002, the International Maritime Organization (IMO) approved the automatic identification system (AIS). The AIS has become an indispensable tool for maritime safety detection in the world [31]. The AIS data can be transmitted to the relevant equipment through the satellite receiving system or the shore-based receiving system for storage. There are four types of AIS messages: static messages, dynamic messages, voyage-related messages, and safety-related messages [8]. Since the dynamic and static information can reflect the ship’s kinematics information and fixed information at the data level, we filtered the key fields, and the information is shown in Table 1.

Table 1.
AIS data message content.
Using the National Water Transport Information Service Platform and the China Port Network, we obtained the navigation data for all vessels of fishing boats, cargo ships, oil tankers, passenger ships, and engineering ships in Zhejiang Province from 25 October 2021 to 24 November 2021. The AIS data arise from the integration of multiple sensor devices. The quality of the AIS data is uneven due to maritime route congestion, navigation equipment failure, and tampering, which may lead to bad data, duplicate data, and missing data. Therefore, we needed to preprocess the crawler data.
We preprocessed the AIS data in four aspects: map matching, data cutting, data deletion, and data completion:
- Map matching. Map matching is essentially a process of matching trajectory points with maps. The geographic coordinate system for the AIS data is WGS84. However, due to the data encryption problem for the data crawler, we needed to perform artificial offset correction by comparing them with the WGS84 map.
- Data deletion. In order to ensure the accuracy of the research, it was necessary to delete illogical data. We directly deleted data in the following cases: (1) trajectory data whose MMSI was null or whose length was not 9, (2) duplicate AIS data, (2) the trajectory of a vessel sailing in a foreign sea area bordering on China, as the study only considered vessels sailing within China’s sea areas, and (4) the intersection points of the track segments whose lengths of the adjacent track segments were all greater than the average length of all the segments of the target track.
- Data cutting. As the data obtained by the crawler are accidental, it was possible for multiple navigations to mark a single voyage, so we cut the ship track from the spatial and time angle.
- Data completion. (1) After completion of the data cleaning and cutting, since the offshore environment is unstable, and the probability of shore-based satellite dot drift is high, we chose the Kalman filter algorithm for processing the ship trajectory data. on the one hand, it can eliminate abnormal points for the distance offset, and it can effectively smooth the trajectory, making it more in line with the mapping features of the real world. (2) For the continuity of the follow-up study, we then interpolated the trajectory data. For the problem of data completion, we chose the Lagrange first-order interpolation algorithm and the Lagrange second-order interpolation algorithm to complete the trajectory according to the concave–convex trajectory points until the interval condition of the trajectory segment was satisfied. (3) Since some dynamic attributes appeared as null locus points after interpolation, the attributes of the vessel locus points were calculated and completed according to the actual situation.
After the above preprocessing operation, we finally obtained 15,660 trajectories of 1839 ships, resulting in a total of 1,975,379 trajectory points. The schematic diagram of the study area is shown in Figure 3. The sketch maps before and after trajectory data processing are shown in Figure 4.
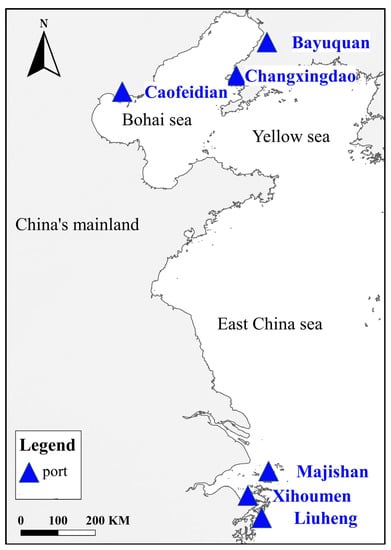
Figure 3.
Schematic diagram of the study area.
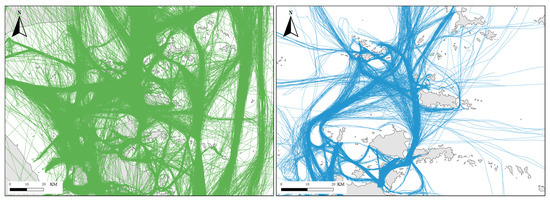
Figure 4.
Diagram before and after track data preprocessing.
3.2. Detection of Abnormal Ship Behavior Based on Spatial Attributes
3.2.1. Maritime Route Extraction Based on AIS Data
The situation is also more complex for sea lanes, which are not constructed like roads on land and are, by contrast, subject to dynamic changes due to external factors such as climate, currents, and accidents. Detection of the maritime routes will help to provide the newest routes and traffic information for ships. In order to model the ship behavior pattern more precisely, we first extracted the structure of the maritime routes based on the AIS data.
Although the AIS data have the advantages of fast updates and a very large geographical range, due to their puncture reception problem, they are also characterized by poor data quality and data density in different regions of great difference. These issues are also a great challenge for the renewal and normalization of sea lanes. Therefore, we used the extraction method for road networks for offshore road networks [32]. This method generates a road network from trajectory point data based on the principal graph structure learning and tree linking strategy. It does not depend on data pretreatment, and the noise, low sampling rate, and non-uniformity of the density of the data’s distribution can be minimized, allowing the robust extraction of the feature structure of the maritime traffic routes.
It was considered that most ships would travel close to the centerlines of the routes (i.e., the centerline of our final generated road map would be consistent with the peak point of the trajectory point), so we could express the geometric topology of the real-world maritime routes approximately in the form of an undirected graph G. In this study, the structure of the maritime routes was abstracted into the following form:
where represents the node of the graph, represents the edge of the graph, and represents the connection matrix of the graph in Equation (1). After inputting a set of trajectory points, we hoped to obtain the best map that could fit the set of trajectory points, namely . Considering that the maritime route is usually a smooth straight line or curve, the optimal main graph should meet the following two conditions: (1) the distance from all the points to the figure shall be as short as possible, and (2) the edges of the graph are straight or rounded, all the edges are as small as possible, and the main graph representing the basic maritime routes shall be as regular as possible. We found that the reversed graph-embedding technology could satisfy the above two conditions to obtain the best main graph.
In order to better understand the reversed graph-embedding technology, we need to understand what the graph-embedding technology is. The graph-embedding technique is a feature transformation operation that constructs the relationship of input spatial data from the perspective of a graph and then reflects the flow pattern structure of the data. Laplacian Eigenmaps is one of the common graph-embedding methods. The main idea of Laplacian Eigenmaps is that if two sets of data i and j are very close to each other, they should be as close as possible in the target subspace after dimension reduction. The structure of the maritime routes is a kind of “graph” structure, so our task was to use a “graph” to fit the structure of the maritime routes (i.e., to embed and then express the road network structure in the form of a graph). Suppose that represents the input spatial trajectory point data. The point set of potential space denotes the node of and can fully express the data distribution characteristics of . Therefore, we need to learn the mapping mechanism so that the point after mapping has a similar distribution with . The reversed graph-embedding technology can realize the searching of the mapping relationship. The basic assumption is that if and have higher similarity (distance), then the mapped and should also have higher similarity; that is, the second condition we proposed above for constructing the optimal master graph is satisfied. In order to maintain the flow structure, we needed to optimize its objective function Q, similar to the Laplacian Eigenmaps:
where W is the weight matrix of the graph from the potential space.
While we met the second condition that we found the road network, we needed to meet the first condition; that is, the sum of the distances of all the points to the best main graph needed to be minimized. Therefore, we added the calculation of the fitting index, which was represented at the data level by minimizing the distance between each input data point and the center of the cluster to which it belonged. Since may have no membership, a regularization term needed to be added to the right side of the objective function. The final loss function formula is as follows. The data-fitting term guarantees the spatial proximity of the nodes of the final main graph and the original trajectory points, and the penalty term guarantees the smoothness of the main graph after calculation:
where denotes the membership matrix and denotes the probability of with .
Based on the assumption of inversed graph embedding and the assumption of the fitting index calculation method, the method of learning the graph structure from spatial data can be transformed for optimizing the following objective function, and can be expressed by :
We used iterative decomposition to obtain the final value of . First, was initialized to solve and . Based on the obtained and cycles, was solved until the change value of the objective function was less than the threshold value, and the cycle was stopped. Finally, we obtained the value that satisfied the conditions. Specifically, we needed the best set of nodes for the main graph . The pseudocode of the algorithm is shown in Algorithm 1.
| Algorithm 1: Principal graph algorithm |
| Input: Trajectory points and parameters: |
| Output: the principal graph: |
|
Based on the above algorithm, we obtained the main graph structure of the original trajectory points. However, since the main map we calculated was based on MST, there were some dangling edges, so we used the ArcGIS toolbox topology editing tool to perform topology correction on the generated route map and obtain the final structure of the maritime routes.
3.2.2. Detection of Spatial Abnormal Behavior of Ships Based on Rayda’s Criterion
The basic assumption of Rayda’s criterion is that a group of detection data contains only random errors, the calculated standard deviation of which determines an interval according to a certain probability and considers that errors beyond this interval are coarse errors and should be eliminated. Due to the influence of environmental factors and the navigation price, the ship usually follows specific route information. Therefore, we assumed that a ship was traveling on its planned route, and the lateral distance between the ship and the route should meet the needs of a normal distribution; that is, the probability that the ship belonged to the route could be calculated by using the normal probability density distribution function. Therefore, we could detect the yaw behavior of the ship by calculating the Gaussian distribution of the ship’s lateral distance. Shown in Figure 5 is an illustration of the maritime routes and trajectory points displayed by real data.
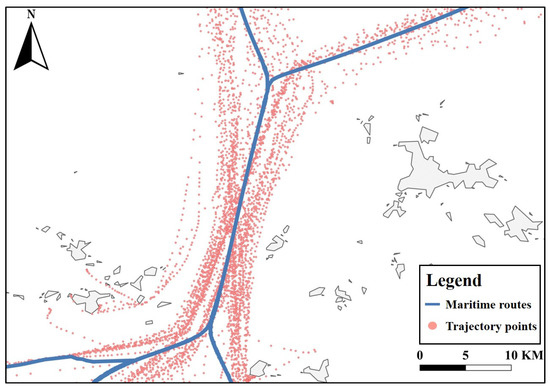
Figure 5.
Distribution of ship trajectory points along the maritime routes.
It can be observed from Figure 5 that the lateral distance of the ship’s trajectory points conformed to the characteristics of a Gaussian distribution. Additionally, the characteristic of a Gaussian distribution is that the standard deviation of a set of data averages can reflect the distribution of this set of data values. Therefore, it was feasible to detect the ship’s spatial displacement based on Rayda’s criterion. Rayda’s criterion takes k (k = 1, 2, 3) times the standard deviation as the threshold value. A value beyond this range can be judged as abnormal if it does not belong to the category of random errors. The value of the multiple of the standard deviation can be adjusted according to the required situation in practical applications. There is an inference in experimental science that when a set of data is normally distributed, almost all the values are within three standard deviations of the mean. The percentages within one standard deviation, two standard deviations, and three standard deviations from the mean can be expressed as 68.27%, 95.45%, and 99.73%, respectively. Based on this inference, this study detected abnormal trajectory points based on the ship’s spatial information.
The pseudocode for Rayda’s criterion is shown in Algorithm 2.
| Algorithm 2: Rayda’s criterion |
| Input: Trajectory points , standard deviation multiple |
| Output: outlier set |
|
| Then, put into y |
3.3. Detection of Abnormal Ship Behavior Based on Thematic Attributes
3.3.1. Nearest Route Matching
Matching the maritime routes to the ship trajectory points can match the current trajectory points to the nearest and most suitable route segments. On the one hand, this may provide data support for the amplification of a maritime route. On the other hand, since different segments of routes have different traffic states, more fine-grained detection of ship patterns can be performed based on the characteristics of the maritime route segments.
Considering the actual situation of the sea lane network, we segmented the sea lane network in a clockwise direction using the ArcGIS tool with the road intersection as the node. Finally, a unique identifier was assigned to the route segments after the segment. After the completion of route segmentation, the nearest route segment of each trajectory point was calculated according to the principle of the minimum distance and assigned as an attribute to the trajectory point.
3.3.2. Anomaly Detection Based on the Isolation Forest Algorithm by Using Thematic Attributes
The work described in Section 3.2 mainly detected abnormal behaviors based on the spatial attributes of ships and then introduced the detection of abnormal behavior for ship thematic attributes based on the isolation forest algorithm. The existing method of detecting abnormal behavior usually provides results of 0–1; that is, the result is abnormal or non-abnormal, but it does not provide a score for the abnormal behavior of the target. Therefore, we chose the isolation forest algorithm to obtain the anomaly score for the input dataset.
Isolation forest is composed of multiple isolated trees, and it divides and detects outliers in a layer-by-layer manner based on the characteristic of “few but different” outliers [33]. We divided the thematic attributes into two feature sets: an instantaneous attribute feature set and average attribute feature set. The instantaneous attribute features include the speed over ground and the variation of the course over ground, which were used to describe the instantaneous changes in the ship’s behavior. The average attribute feature set includes the average velocity and average acceleration attributes in the ship thematic attribute feature to describe the changes related to the time period of the ship in the process of traveling. In the conventional isolation forest construction, a random selection of features is used, and a partition value is selected randomly and iteratively to build an isolation tree until the dataset is iteratively segmented and until one of the following conditions is met: (1) the isolation tree has been constructed to a tree height, (2) there is only one node on a node of the binary tree, or (3) all the sample features on the node are identical. It can be observed that in that process of isolation, a normal point usually belongs to the deep end of the tree, and an abnormal point is usually located near the root of the tree. Therefore, we defined the total path length from the parent node along the corresponding path to a leaf node as the degree of the abnormality of the leaf node. In a feature dataset containing n pieces of data, its average length path in multiple trees is as follows:
where is the harmonic number. Since is the average of after n is provided, we can normalize it for . The normalized exception score formula is as follows:
In the formula, s denotes the abnormal score obtained after training n pieces of data. is the average of the isolation tree . The following evaluation criteria can be obtained from the formula:
- The data are abnormal when s approaches 1;
- The data are more normal when s is far less than 0.5;
- If the score of the entire set of data is around 0.5, there is no significant outlier in the set of data.
Considering that different attributes represent different types of ship motion, we used the entropy weight method to integrate the abnormal scores generated by the isolation forest. The entropy weight method determines the objective weight according to the magnitude of the index variability. On the one hand, this has a smaller computational cost. On the other hand, it belongs to the objective weighting methods and is more suitable for the same data-driven type of isolated forest algorithm. The final composite score is the abnormal score of the input feature set. The flow chart for ship anomaly detection based on isolation forest is shown in Figure 6.
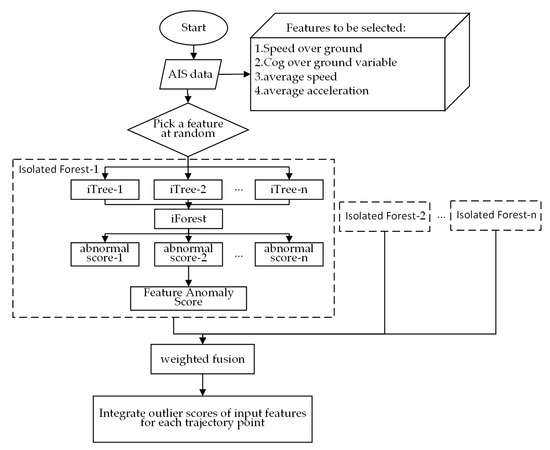
Figure 6.
Flowchart of detection of abnormal ship behavior with thematic attributes based on isolated forest.
4. Results and Discussion
This chapter describes the analysis and verification of the proposed method based on simulated data and real data, respectively. On the one hand, this part of the study compared the proposed method with classical and frontier methods based on simulation data to evaluate the performance of the method. On the other hand, based on real data, this study explored the effectiveness of the proposed method by interactive visual analysis.
4.1. Simulated Experiments
In order to verify the effectiveness of the method, based on the definition of abnormal ship behavior, this study simulated the ship trajectory point from the perspective of spatial and thematic attributes. Based on the ship spatial attributes and four special attributes, a set of normal trajectory point data in accordance with a Gaussian distribution was fitted. Based on the fitting results, three times the standard deviation was added to the abnormal data, and finally, a set of trajectory point data with an abnormal behavior label was obtained. Finally, we simulated about 1000 track points, of which the abnormal data accounted for about 5%. The spatial anomaly representation of the simulation data is shown in Figure 7, and the anomaly representation of the thematic attributes is shown in Figure 8.
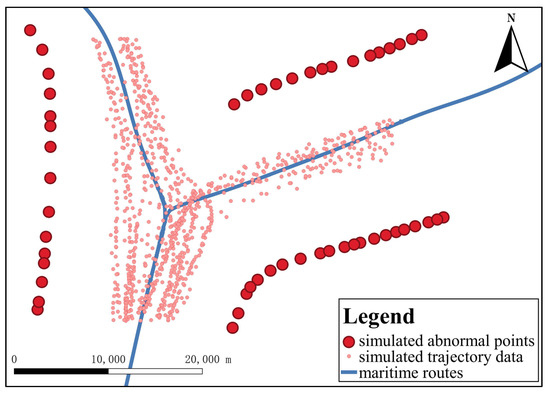
Figure 7.
Simulation data for abnormal behavior of ship spatial attributes.
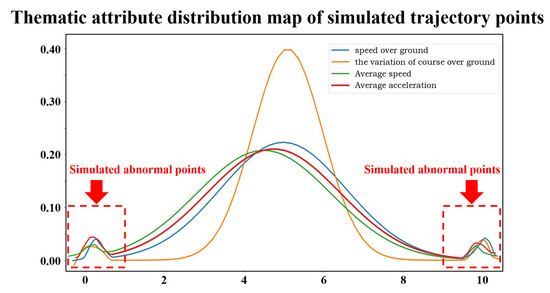
Figure 8.
Simulation data for abnormal behavior of ship thematic attributes.
This part of the study separately explored and analyzed the feasibility of the proposed method for detecting spatial anomalous behavior and thematic attribute anomalous behavior. For the detection of abnormal behavior for spatial attributes, we chose the classical anomaly detection algorithm of the Gaussian mixture model (GMM) and frontier ship anomaly detection algorithm [6] of maritime trajectory modeling and anomaly detection (MT-MAD) as the contrast method. For the detection of abnormal behavior for thematic attributes, we chose the classic anomaly detection algorithm density-based spatial clustering of applications with noise (DBSCAN) and the frontier abnormal ship behavior detection algorithm based on the DBSCAN algorithm and Markov algorithm proposed by Shahir [18] as the comparison method. At the same time, we selected the values of accuracy, recall, precision, and F-score as the evaluation indicators.
The accuracy is the most intuitive measure of the model, and it is calculated as the number of results judged correct divided by the number of all the participants. The precision is calculated as the ratio of the number of samples correctly retrieved to the total number of samples retrieved. The recall is calculated as the ratio of the number of samples correctly retrieved to the number of samples that should be retrieved. The F-score can comprehensively reflect the changes in precision and recall and can be used to effectively evaluate the effectiveness of the model.
Table 2.
Effectiveness of our method in abnormal behavior detection for ship spatial attributes.
Table 3.
Effectiveness of this method in abnormal behavior detection for ship thematic attributes.
In order to verify the rationality of the proposed method, we compared the results of different algorithms from the perspective of spatial attributes and thematic attributes. It can be observed from Table 2 and Table 3 that the method proposed in this paper was accurate for the simulation dataset compared with the traditional classical algorithm, and it was effective in comparison with the frontier method. From the results of the table, we can observe that the classical method had a higher accuracy but a lower F-score. Due to the imbalance between the positive and negative samples, the accuracy index had a larger defect, so we could not select a single accuracy evaluation method. Recall and precision are a pair of contradictory performance measures, while the F-score can compare the performance of a comprehensive approach. It can be observed that the method proposed in this paper had a higher F-score value than the front-end method, which verifies the effectiveness of the method proposed in this paper.
4.2. Experimental Results for Real Datasets
In this section, we describe the use of the above-mentioned introduction framework to assess the degree of object suspicion from a ship’s spatial and thematic attributes to detect anomalies with the real data. In the first step, we extracted the network structure of the maritime routes based on the principal graph structure learning and tree linking strategy, and then we detected the abnormal attributes of ship space with Rayda’s criterion. The second step was to determine the anomaly score for the distribution of thematic attributes for the maritime routes based on the isolation forest algorithm.
China’s vast sea areas and numerous ports constitute a complex route network in the coastal waters of China. The number of ports in each sea area was counted according to the boundary of the sea area. The number of ports in each sea area is shown in Table 4.
Table 4.
Statistics on the number of ports in the sea area.
In order to excavate more representative lanes, two sea areas with the most travel records were chosen as the target areas: the East China Sea and the Bohai Sea. In order to avoid skewness in the data, the ship trajectories before the first three ports in the East China Sea and the Bohai Sea were selected as the experimental data, which are the ports of Xihoumen, Majishan, and Liuheng in the East China Sea and the ports of Changxingdao, Bayuquan, and Caofeidian in the Bohai Sea. Figure 9 shows the trajectory data we selected to travel to and from these six ports.
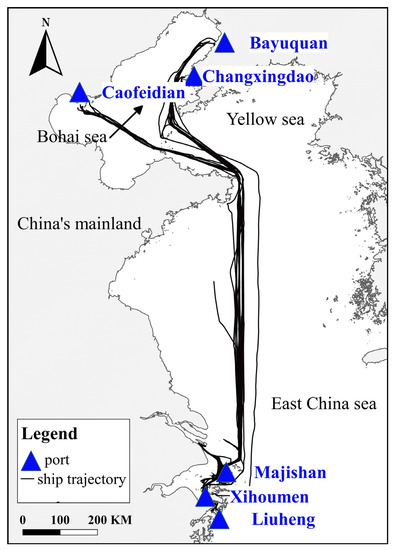
Figure 9.
Ship trajectory in experimental area.
4.2.1. Detection of Abnormal Ship Behavior Based on Spatial Attributes
The density of the experimental datasets is not uniform in space, and the span is wide in space. A ship always goes to the destination according to a similar driving path, so its movement pattern usually shows the special characteristics of a ship cluster. Based on the method proposed in the third section, we extracted the maritime routes based on the dataset and obtained good results. The experimental results were based on the hyperparameters, including the maximum number of iterations— and —which affect the efficiency of the code operation, the fitting error, which is the degree of the edge close to the data center, and the degree of fitting, which is the degree of the generated edge burr. Through much exploratory analysis, we set the parameter of the maximum number of iterations to 20, to 1, and to 0.05. The detection results for the routes are shown in Figure 10.
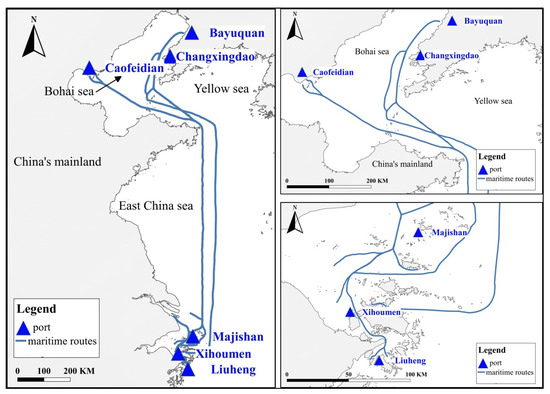
Figure 10.
Maritime route extraction results.
Some de facto standardized sea routes are generally followed, taking into account factors such as travel prices and traffic control. Therefore, the distance between the point of the ship’s trajectory and the maritime routes—that is, the ship’s lateral distance—should satisfy a Gaussian normal distribution. In order to verify this hypothesis, we visually displayed the lateral distance of the experimental data in the form of a histogram, as shown in Figure 11.
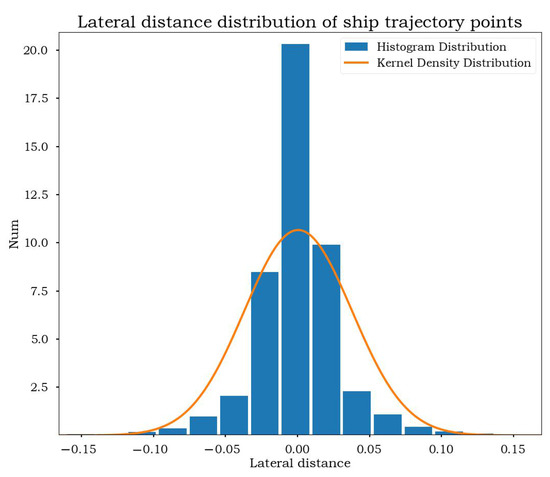
Figure 11.
Lateral distance distribution of ship trajectory points.
It can be observed from Figure 11 that the ship lateral distance satisfies a normal distribution. Therefore, the probability that the ship belongs to this route can be calculated using the normal distribution probability density. On the data level, the outliers were represented as points with distinct differences from other data points in some attribute features, so we could detect the yaw behavior by calculating the Gaussian distribution of the lateral distance of the ship; that is, if the probability of belonging to the route was lower than a certain threshold, we could consider that it did not follow the channel features to some extent. We selected Rayda’s criterion, used in anomaly detection to detect the abnormal points. After the experimental verification, we set the triple standard deviation as the threshold for the judgment standard. We detected six abnormal trajectories with a spatial attribute offset. The detection results are shown in Figure 12.
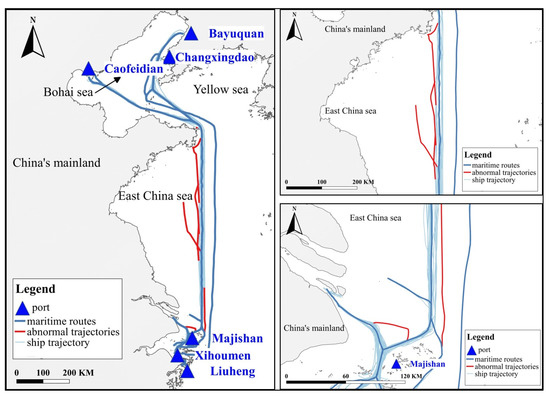
Figure 12.
Abnormal ship behavior detection results based on spatial attributes.
The experimental results show that this method can effectively detect the trajectory points with spatial attribute deviation in the normal motion of a ship. However, this detection method is based on spatial attributes and does not take into account the characteristics of a ship’s time-related subject attributes.
4.2.2. Detection of Abnormal Ship Behavior Based on Thematic Attributes
Based on the above experiments, we obtained the maritime route structure of the input ship trajectory data. Then, we used the intersection as the breakpoint to segment the channel network, and the results after segmentation are shown in Figure 13.
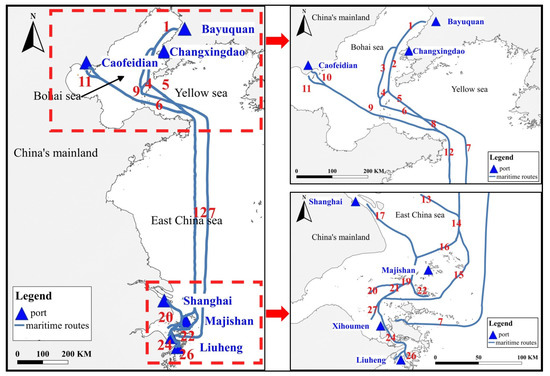
Figure 13.
Maritime road segmentation results.
In light of the time and space constraints on the navigation of ships, the data density distribution of different maritime route segments was not uniform; that is, the sample sizes of some route segments were large, and those of some route segments were small. Considering that ships often exhibit different motion characteristics on different routes in the course of running, we considered the partial route data of the biased data as the input of the experimental data for feature anomaly detection. We counted the number of trajectory points of each segment, and the statistical results are shown in Figure 14.
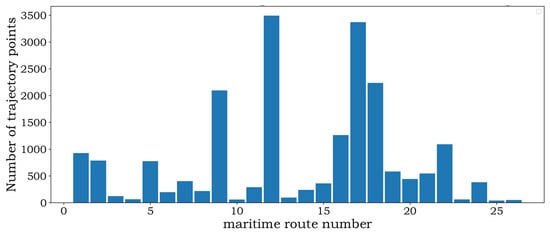
Figure 14.
Statistics for the number of trajectory points in the maritime route segments.
As shown in Figure 14, it can be seen that the route segments with the IDs 12, 17, and 18 had more trajectory points, so we selected the route segment with the most trajectory points, segment 12, as the experimental route segment.
We selected the thematic attribute features of the ship, including the speed over ground, the variation of the course over ground, the average speed, and the average acceleration and used different combinations as model inputs to obtain abnormal scores for different attributes. The higher the score, the more abnormal the attribute of the point. First, we used the above four quantiles as the threshold to separate the characterization and detection of the abnormal scores of four attributes as shown in Figure 15.
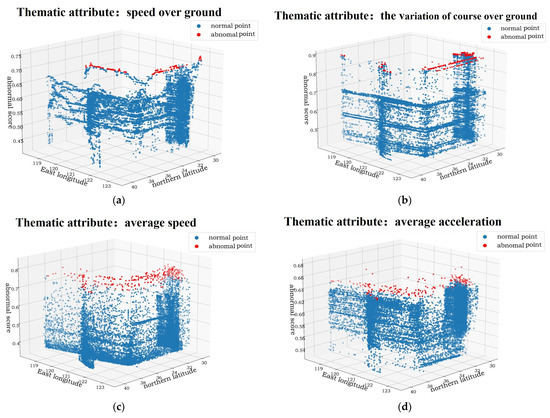
Figure 15.
Spatial distribution of abnormal ship behavior detection scores based on thematic attributes. (a) The spatial distribution of the detection score for abnormal ship behavior with the thematic attribute of the instantaneous speed over ground. (b) The spatial distribution of the detection score for abnormal ship behavior with the thematic attribute as the variation of the course over ground. (c) The spatial distribution of the detection score for abnormal ship behavior with the thematic attribute as the average speed. (d) The spatial distribution of the detection score for abnormal ship behavior with the thematic attribute as the mean acceleration.
In order to further verify the effectiveness of the algorithm, we classified the subject attributes into two large categories according to the time variance of the experimental data. The first category was used to express instantaneous changes of the ship with the speed over ground and the variation of the course over ground, and the second category was used to express the slow change characteristics of the ship over time with the average speed and average acceleration. We used the entropy weight method to assign the weights of the attributes and finally obtained the anomaly scores of each point based on the thematic topic attribute characteristics. The physical meaning of the composite score can be used to describe the degree of the anomaly of the ship at that point in time. We used the above four quantiles as the threshold to detect the abnormal scores for the two types of composite topic attributes, and the results are shown in Figure 16.
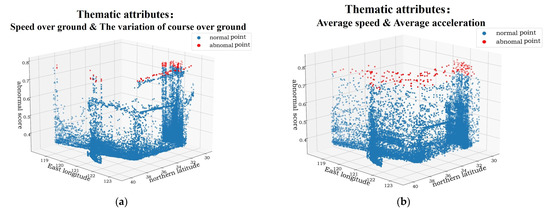
Figure 16.
Spatial distribution of abnormal ship behavior detection scores based on combined thematic attributes. (a) The spatial distribution of the anomaly detection results when the combined thematic attribute features were the speed over ground and the variation of the course over ground. (b) The spatial distribution of the anomaly detection results when the combined thematic attribute features were the average velocity and average acceleration.
It was found that the outliers accounted for about 0.49% of all the point sets when the combined thematic attributes were the speed over ground and the variation of the course over ground. When the combined thematic attribute features were the average velocity and average acceleration, outliers accounted for about 0.46% of all the point sets. In order to verify the rationality of the detection results, we further discovered and explained the detected abnormal points according to the characteristic values of the adjacent attributes and the geographical environmental characteristics of the ship points.
We selected the vessel with the MMSI number 413,459,270 for a period of trips from 29 October 2021 to 31 October 2021 for the combined thematic attribute characterized as the speed over ground and the variation of the course over ground to illustrate the detection results. The ship was in the Caofeidian port on its way to the Xihoumen port, and in the time period from 1:48 a.m. on 30 October 2021 to 2:56 a.m. on 30 October 2021, it was in a hovering state for a long time due to unknown factors and was traveling at a lower speed and with a variable steering angle. By 3:00 a.m. on 30 October 2021, its end-hovering state began to continue, so its instantaneous speed and the amount of change in the steering angle showed an increase, as shown in the test results. Its position at the end hovering had a higher abnormal score. At the same time, an abnormal condition for the spatial position attribute in this time period was detected for the ship. The variation of that characteristic of the travel topic and the geographic map status of the high point of the abnormal score are shown in Figure 17.
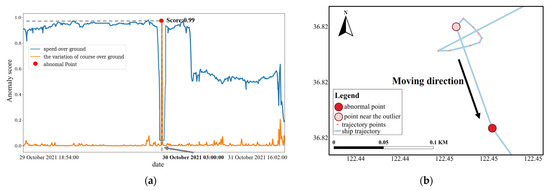
Figure 17.
The thematic attribute set is the schematic diagram of abnormal ship point detection with instantaneous features. (a) The change over time after normalization of the two thematic attributes. (b) The realistic mapping of the high anomaly score points in (a) in the geographic environment.
We selected the vessel with the MMSI number 412,328,140 from 9 November 2021 to 10 November 2021 for the combined subject characteristics of the average speed and average acceleration of the test results. The ship was scheduled to sail from Xihoumen port to Bayuquan port. Through the experiment, we found that the ship appeared as an abnormal point with a high abnormal score during the course of navigation. We drew the average velocity and average acceleration of the segment for each feature after 0–1 normalization, and we could directly observe a significant peak point. It was found from that map that the location of the high abnormal score was near the Shandong Peninsula, at which point it was completing the turning task. The data records show that it took 120 s to complete the turning task in the time period from 3:52 p.m. on 10 November 2021 to 3:54 p.m. on 10 November 2021. The linear distance between the points was 2299 m, and the instantaneous speed changed from 7.1 to 6.2. According to the actual geographical situation, it can be considered that the sudden drop in speed caused by the turning task was in line with the actual situation. The spatial location of the high anomaly score point in the geographic environment is shown in Figure 18.
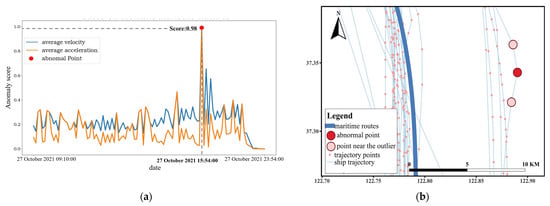
Figure 18.
The thematic attribute set is the schematic diagram of abnormal ship point detection with average characteristics. (a) The changes in the average speed and average acceleration of the ship. (b) The realistic mapping of the high anomaly score points in (a) in the geographic environment.
5. Conclusions
The marine environment is complex and variable, and the unconstrained motion of a ship’s trajectory increases the uncertainty of the data. Based on the characteristics of the target, this study explored a ship’s motion behavior and further detected its abnormal behavior based on the two aspects of spatial attributes and thematic attributes.
The factors affecting a ship during the course of travel, including the range price, weather, traffic control, and geographical environment, usually follow the following factually standardized maritime lanes, so we extended the inversed graph-embedding technology based on historical AIS data to detect and characterize the structure of the maritime routes. Then, based on the extracted structure of the maritime routes, we detected the departure of the ship from the route from the spatial attributes. Next, we refined the data, grouped the ship trajectory groups according to the network structure based on the maritime routes, and detected abnormal ship thematic attributes and scored their degrees based on the isolation forest algorithm. Based on the AIS data for ship navigation between the East China Sea and the Bohai Sea, we detected and scored the abnormal ship motion with spatial attributes and thematic attributes. After detection, we were able to identify a number of abnormal points with high scores. We combined these with the actual physical environment of the trajectory points to find and explain them and then identified more meaningful points and phenomena.
AIS data are an important tool for global sea state monitoring, but their regulation and privacy remain to be discussed. Relevant maritime authorities believe that the privacy and sovereignty of maritime vessels require the encryption of AIS data. At the same time, there is a lack of research on the feature extraction and correlation of high-dimensional datasets, such as those for the weather and the marine environment. The non-spatiotemporal information of ships and the situational information in driving usually contain other behavior patterns of ships. Therefore, considering the static information and environmental information of ships could provide new ideas for the detection of abnormal ship behaviors.
Author Contributions
Conceptualization, Y.S., C.L., X.Y. and M.D.; data curation, C.L.; methodology, C.L., X.Y. and Y.S.; visualization, C.L. and X.Y.; writing—original draft, C.L. and X.Y.; writing—review and editing, C.L., X.Y. and Y.S. All authors have read and agreed to the published version of the manuscript.
Funding
This research was supported by grants from the National Natural Science Foundation of China (41901319 and 42171459), the Key Program of the National Natural Science Foundation of China (41730105), and the Independent Exploration and Innovation Project Fund Designated for Graduate Students of Central South University (2021zzts0819).
Institutional Review Board Statement
Not applicable.
Informed Consent Statement
Not applicable.
Data Availability Statement
Not applicable.
Acknowledgments
This work was carried out in part using computing resources at the High Performance Computing Platform of Central South University.
Conflicts of Interest
The authors declare no conflict of interest.
References
- Rong, H.; Teixeira, A.P.; Soares, C.G. Ship trajectory uncertainty prediction based on a Gaussian Process model. Ocean Eng. 2019, 182, 499–511. [Google Scholar] [CrossRef]
- Pallotta, G.; Vespe, M.; Bryan, K. Vessel Pattern Knowledge Discovery from AIS Data: A Framework for Anomaly Detection and Route Prediction. Entropy 2013, 15, 2218–2245. [Google Scholar] [CrossRef]
- Mou, N.; Ren, H.; Zheng, Y.; Chen, J.; Niu, J.; Yang, T.; Zhang, L.; Liu, F. Traffic Inequality and Relations in Maritime Silk Road: A Network Flow Analysis. ISPRS Int. J. Geo-Inf. 2021, 10, 40. [Google Scholar] [CrossRef]
- He, J. ‘One Belt, One Road’: China's New Strategy and Its Impact on FDI. In Asia's Changing International Investment Regime; Springer: Berlin/Heidelberg, Germany, 2017; pp. 163–175. [Google Scholar]
- Lee, E.S.; Mokashi, A.J.; Sang, Y.M.; Kim, G.S. The Maturity of Automatic Identification Systems (AIS) and Its Implications for Innovation. J. Mar. Sci. Eng. 2019, 7, 287. [Google Scholar] [CrossRef]
- Lei, P.R. A framework for anomaly detection in maritime trajectory behavior. Knowl. Inf. Syst. 2016, 47, 189–214. [Google Scholar] [CrossRef]
- Yang, D.; Wu, L.; Wang, S.; Jia, H.; Li, K.X. How big data enriches maritime research—A critical review of Automatic Identification System (AIS) data applications. Transp Rev. 2019, 39, 755–773. [Google Scholar] [CrossRef]
- Ristic, B.; La Scala, B.; Morelande, M.; Gordon, N. Statistical analysis of motion patterns in AIS Data: Anomaly detection and motion prediction. In Proceedings of the 2008 11th International Conference on Information Fusion, Cologne, Germany, 30 June–3 July 2008; pp. 1–7. [Google Scholar]
- Zhaolin, W. Maritime Traffic Engineering; Maritime Traffic Engineering: Liaoning, China, 1993. [Google Scholar]
- Holst, A.; Bjurling, B.; Ekman, J.; Rudström, Å.; Wallenius, K.; Björkman, M.; Fooladvandi, F.; Laxhammar, R.; Trönninger, J. A Joint Statistical and Symbolic Anomaly Detection System: Increasing performance in maritime surveillance. In Proceedings of the 2012 15th International Conference on Information Fusion, Singapore, 9–12 July 2012; pp. 1919–1926. [Google Scholar]
- Soleimani, B.H.; De Souza, E.N.; Hilliard, C.; Matwin, S. Anomaly Detection in Maritime Data Based on Geometrical Analysis of Trajectories. In Proceedings of the 18th International Conference on Information Fusion (Fusion), Washington, DC, USA, 6–July 2015; pp. 1100–1105. [Google Scholar]
- Rong, H.; Teixeira, A.P.; Soares, C.G. Data mining approach to shipping route characterization and anomaly detection based on AIS data. Ocean. Eng. 2020, 198, 12. [Google Scholar] [CrossRef]
- Xiong, Y.; Xiaohao, Q.U.; Guo, J.; Mou, J.; Navigation, S.O. Monitoring of abnormal movement patterns of ferry based on AIS data. China Saf. Sci. J. 2016, 26, 100–103. [Google Scholar]
- Laxhammar, R. Anomaly detection for sea surveillance. In Proceedings of the 2008 11th International Conference on Information Fusion, Cologne, Germany, 30 June–3 July 2008; pp. 1–8. [Google Scholar]
- Bomberger, N.A.; Rhodes, B.J.; Seibert, M.; Waxman, A.M. Associative learning of vessel motion patterns for maritime situation awareness. In Proceedings of the 9th International Conference on Information Fusion, Florence, Italy, 10 July 2006; pp. 729–736. [Google Scholar]
- Smith, M.; Reece, S.; Roberts, S.; Rezek, I. Online Maritime Abnormality Detection using Gaussian Processes and Extreme Value Theory. In Proceedings of the 12th IEEE International Conference on Data Mining (ICDM), Brussels, Belgium, 10–13 December 2012; pp. 645–654. [Google Scholar]
- Venskus, J.; Treigys, P.; Bernatavičienė, J.; Tamulevičius, G.; Medvedev, V. Real-Time Maritime Traffic Anomaly Detection Based on Sensors and History Data Embedding. Sensors 2019, 19, 3782. [Google Scholar] [CrossRef] [PubMed]
- Shahir, H.Y.; Glässer, U.; Nalbandyan, N.; Wehn, H. Maritime Situation Analysis: A Multi-vessel Interaction and Anomaly Detection Framework. In Proceedings of the 2014 IEEE Joint Intelligence and Security Informatics Conference, The Hague, The Netherlands, 24–26 September 2014; pp. 192–199. [Google Scholar]
- Pallotta, G.; Jousselme, A.L. Data-driven Detection and Context-based Classification of Maritime Anomalies. In Proceedings of the 18th International Conference on Information Fusion (Fusion), Washington, DC, USA, 6–9 July 2015; pp. 1152–1159. [Google Scholar]
- Osekowska, E.; Johnson, H.; Carlsson, B. Grid Size Optimization for Potential Field based Maritime Anomaly Detection. Transp. Res. Procedia 2014, 3, 720–729. [Google Scholar] [CrossRef][Green Version]
- Venskus, J.; Kurmis, M.; Andziulis, A.; Lukosius, Z.; Voznak, M.; Bykovas, D. Self-Learning Adaptive Algorithm for Maritime Traffic Abnormal Movement Detection based on Virtual Pheromone Method. In Proceedings of the 2015 International Symposium on Performance Evaluation of Computer and Telecommunication Systems (SPECTS), Chicago, IL, USA, 27–29 July 2015. [Google Scholar]
- Riveiro, M.; Pallotta, G.; Vespe, M. Maritime anomaly detection: A review. Wiley Interdiscip. Rev.-Data Min. Knowl. Discov. 2018, 8, e1266. [Google Scholar] [CrossRef]
- Kraiman, J.B. Automated anomaly detection processor. Proc. SPIE 2002, 4716, 128–137. [Google Scholar]
- Riveiro, M.; Falkman, G.; Ziemke, T. Visual analytics for the detection of anomalous maritime behavior. In Proceedings of the 12th International Conference Information Visualisation 2008, London, UK, 9–11 July 2008; pp. 273–279. [Google Scholar]
- Mascaro, S.; Nicholson, A.; Korb, K. Anomaly detection in vessel tracks using Bayesian networks. Int. J. Approx. Reason. 2014, 55, 84–98. [Google Scholar] [CrossRef]
- Radon, A.N.; Wang, K.; Glässer, U.; Wehn, H.; Westwell-Roper, A. Contextual verification for false alarm reduction in maritime anomaly detection. In Proceedings of the 2015 IEEE International Conference on Big Data (Big Data), Santa Clara, CA, USA, 29 October–1 November 2015; pp. 1123–1133. [Google Scholar]
- Jakob, M.; Vanĕk, O.; Pĕchouček, M. Using Agents to Improve International Maritime Transport Security. IEEE Intell. Syst. 2011, 26, 90–96. [Google Scholar] [CrossRef]
- Laxhammar, R.; Falkman, G.; Sviestins, E. Anomaly detection in sea traffic—A comparison of the Gaussian Mixture Model and the Kernel Density Estimator. In Proceedings of the 12th International Conference on Information Fusion, Seattle, WA, USA, 6–9 July 2009; pp. 756–763. [Google Scholar]
- Arguedas, V.F.; Mazzarella, F.; Vespe, M. Spatio-temporal Data Mining for Maritime Situational Awareness. In Proceedings of the Oceans 2015 Genova, Ctr Congressi, Genova, Genova, Italy, 18–21 May 2015. [Google Scholar]
- Jasinevicius, R.; Petrauskas, V. Fuzzy Expert Maps for Risk Management Systems. In Proceedings of the IEEE/OES Us/EU-Baltic International Symposium, Tallinn, Estonia, 27–29 May 2008; pp. 35–38. [Google Scholar]
- Bautista-Sánchez, R.; Barbosa-Santillan, L.I.; Sánchez-Escobar, J. Method for Select Best AIS Data in Prediction Vessel Movements and Route Estimation. Appl. Sci. 2021, 11, 2429. [Google Scholar] [CrossRef]
- Huang, J.; Deng, M.; Tang, J.; Hu, S.; Liu, H.; Wariyo, S.; He, J. Automatic Generation of Road Maps from Low Quality GPS Trajectory Data via Structure Learning. IEEE Access 2018, 6, 71965–71975. [Google Scholar] [CrossRef]
- Liu, F.T.; Ting, K.M.; Zhou, Z.H. Isolation Forest. In Proceedings of the Eighth IEEE International Conference on Data Mining, Pisa, Italy, 15–19 December 2008. [Google Scholar]


Publisher’s Note: MDPI stays neutral with regard to jurisdictional claims in published maps and institutional affiliations. |
© 2022 by the authors. Licensee MDPI, Basel, Switzerland. This article is an open access article distributed under the terms and conditions of the Creative Commons Attribution (CC BY) license (https://creativecommons.org/licenses/by/4.0/).